Immigration and population change in the UK's towns and cities
←
→
Page content transcription
If your browser does not render page correctly, please read the page content below
Immigration and population change in the UK's
towns and cities
Population Growth: MW 493

Summary
1. This paper should be read alongside our previous research (‘Impact of immigration in changing the UK
population’, issued on 27 July 20211). That paper found that the foreign-born population of the UK had
doubled from about 4.5 million to around nine million between 2001 and 2020 and that the ethnic minority
population of Great Britain had more than doubled from six million to 13.5 million - reaching over a fifth of
the total (this includes ‘Other White’, i.e. those who identify as White but are not British, often from
European countries. Definitions of ethnic groups are based on those used by the ONS).2

2. The paper looks at the impact of high immigration by non-UK nationals (net 300,000 per year since 2001)
on the UK’s towns and cities. A majority of inhabitants of London (55%), Slough (69%), Leicester (58%)
and Luton (57%) are of ethnic minority (EM) background. The EM share in inner London was 60% in 2016,
and 48% and 42% in Birmingham and Manchester respectively3. Nottingham, Thurrock, Coventry,
Derby, Peterborough, Milton Keynes and Northampton have experienced major demographic shifts.

3. This paper shows that around half of births in some major English cities - London (57%), Birmingham
(42%), Manchester (50%), Cambridge (57%) and Leicester (56%) - are to non-UK born mothers. Some of
the biggest direct and indirect impacts of immigration during the past decade have been in areas adjacent
to London, the East of England and East Midlands (Table 4 & 6 below). Scotland and Wales have also
seen notable rises in the non-UK born and EM populations compared with a relatively lower 2001 level
(Table 1 & 7).

4. This paper argues that the UK is likely to experience a growing gap in outlook between those of different
heritage as more and more towns and cities become areas of hyper-diversity, some potentially marked by
intensifying communal segregation. There are also likely to be growing divisions between urban and rural
areas, and between young and old.

5. Given the serious problems of cultural division and value divergence pointed to by Dame (now Baroness)
Louise Casey in her landmark 2016 report on integration, there is serious risk of the weakening of the basic
fabric of shared understandings and common experience that have long undergirded British life.

Immigration and population change in the UK's towns and cities                                                  1
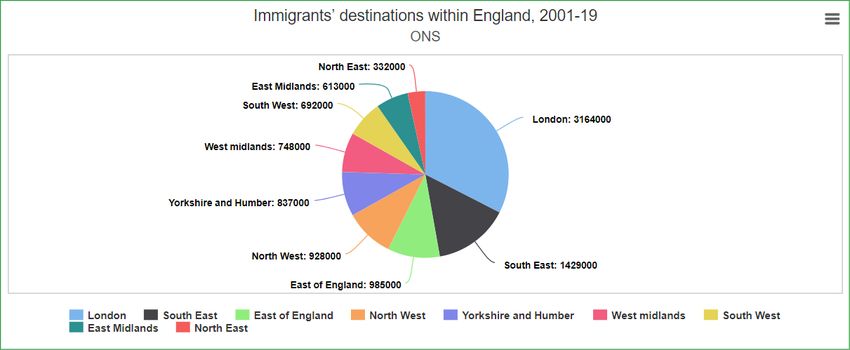
Where do immigrants tend to go?
6. Immigration has direct and indirect impacts on population growth - due to the effect of arrivals from
overseas and children who are subsequently born here. An annual average of 84% of population growth
since 2001 has been due to immigration4 but the impact has been unevenly distributed. The Capital city’s
EM population now accounts for 5 million of the total 9 million population (or about 55%), having risen from
2.8 million of the population of 7.2 million (just under 40%) in 2001. Put another way, the entire increase in
London’s population over the past 20 years is down to immigration.

7. Figure 1 shows that, since 2001 just under 90% of nearly 11 million immigrants have gone to England,
while 6% went to Scotland, 2% to Wales and just over 1% to Northern Ireland (gross immigration figures,
including British citizens). Of those who went to England just under half (47%, or 4.6 million) chose London
and the South East but the next highest totals (just under a million each) went to the East of England and
the North West.

Figure 1: Immigrants’ destination within the UK, 2001-19 (ONS)5. NB: gross immigration (including British
citizens), not net figures.

Immigration and population change in the UK's towns and cities                                               2
Figure 2: Immigrants’ destinations within England, 2001-19 (ONS).

Foreign-born population by area of UK
8. In 2019/20, 8.3 million non-UK born people (90% of the UK total of 9.2 million) were estimated to be
resident in England, 530,000 (6%) in Scotland, 200,000 (2%) lived in Wales and 130,000 (just over 1%)
lived in Northern Ireland. Table 1 below shows the increase in the non-UK born population in each area of
the UK. Scotland had the largest percentage change since 2001/2.

Table 1: Change in non-UK born population by area of UK, (ONS)6.

 Area of the UK                 2001/02 foreign-born   2019/20 foreign-born   Increase       Percentage
                                population             population                            change
 Scotland                       177,000                528,000                351,000        198%
 Wales                          83,000                 209,000                126,000        152%
 Northern Ireland               54,000                 134,000                80,000         148%
 East Midlands                  230,000                569,000                339,000        147%
 North West                     297,000                685,000                388,000        131%
 North East                     68,000                 156,000                88,000         129%
 South West                     236,000                499,000                263,000        111%
 East of England                359,000                758,000                399,000        111%
 South East                     576,000                1,211,000              635,000        110%
 Yorkshire / Humber             245,000                490,000                245,000        100%
 West Midlands                  374,000                741,000                367,000        98%
 London                         1,977,000              3,173,000              1,196,000      60%

9. Table 2 below shows 15 towns and cities in England which had relatively high proportions of foreign-born
residents in 2019/20 compared to the overall English average of 15%, according to the ONS Annual
Population Survey (APS). For this table, London is treated as one unit. However, as Table 3 shows, in

Immigration and population change in the UK's towns and cities                                              3
certain parts of London - such as Kensington and Chelsea, Brent and Newham - 48% of respective
borough populations are foreign-born.
Table 2: Places with relatively high foreign-born populations (ONS, 2019/20)7.
Town / City % foreign born
1 Slough 39%
2 Leicester 39%
3 London 35%
4 Luton 35%
5 Cambridge 32%
6 Oxford 31%
7 Watford 31%
8 Manchester 26%
9 Coventry 25%
10 Northampton 24%
11 Reading 24%
12 Nottingham 23%
13 Peterborough 22%
14 Birmingham 21%
15 Woking 21%
Table 3: London boroughs, top five non UK-born shares (ONS, 2019/20)8.
London Borough % foreign born
1 Newham 48%
2 Kensington & Chelsea 48%
3 Brent 48%
4 Westminster 46%
5 Camden 43%
10. According to the ONS’s local area migration indicators tables, twelve local authorities witnessed a
percentage point increase in the share of non-UK born residents between 2010 and 2019 that was ten
points or more (Table 4 below).
Immigration and population change in the UK's towns and cities 4Table 4: Change in non-UK born population as share of total, 2010-19 (ONS)9. Ordered by percentage point
increase.
Town / Borough Non-UK Non-UK Growth in share of population which was non- Area of
born as born as UK born UK
share of %share of
Percentage increase Percentage point
total (2010) total
increase
(2019)
1 Oadby and Wigston 9% 22% 144% 13% East
Midlands
2 Northampton 14% 27% 93% 13% East
Midlands
3 Hillingdon 27% 39% 44% 12% London
4 Cambridge 25% 36% 44% 11% East of
England
5 Harlow 9% 20% 122% 11% East of
England
6 Croydon 26% 36% 38% 10% London
7 Corby 15% 25% 67% 10% East
Midlands
8 Bromley 13% 23% 77% 10% London
9 Thurrock 10% 20% 100% 10% East of
England
10 Three Rivers 10% 20% 100% 10% East of
England
England as a whole 13% 16% 23% 3%
Indirect impact of immigration on different parts of the UK
11. In addition to the direct effect of immigration on population change, there is the effect of births to non-
UK born parents. Since 1970, the share of births to non-UK born mothers in England and Wales has more
than doubled in size from 12% to 29%. The UK share rose from 24% to 27% (2010-19) and in England from
26% to just under 30%10.
12. By 2019, between 40% and 60% of births in some major English cities were to foreign-born mothers.
Table 5 below shows 15 urban areas with the highest shares of live births to non-born mothers in 2019. It
shows that the percentage was half or more in Luton, Oxford, Manchester, Leicester, Cambridge and
London. The highest share in the UK (with London treated as one unit) was Slough (62%).
13. However, looking at London by individual borough, the five highest shares were: Brent (75%), Harrow
(74%), Newham (73%), Ealing (70%) and Hounslow (69%). Although the share in London only rose by
one percentage point (2010-19), areas such as Havering and Barking and Dagenham saw very high
relative changes of 17 and ten points during that period respectively.
Immigration and population change in the UK's towns and cities 5Table 5: Percentage of live births to non-UK born mothers (ONS)11. Those with a share of half or more are
highlighted in bold.
Town / city % of live births to non-UK born mothers (2019)
1 Slough 62%
2 Luton 58%
3 London 57%
4 Cambridge 57%
5 Leicester 56%
6 Oxford 53%
7 Watford 52%
8 Manchester 50%
9 Boston 49%
10 Peterborough 47%
11 Northampton 46%
12 Coventry 44%
13 Milton Keynes 43%
14 Birmingham 42%
15 Crawley 41%
14. Table 6 below lists 14 local authorities in which the percentage point increase in the share of births to
non-UK born mothers between 2010 and 2019 was eleven points or above.
15. The three English regions with a percentage point increase above four (England as a whole) were the
East Midlands (6), East of England (5) and West Midlands (5). Notable rises were seen in places such as
Northampton, Ipswich, Broxbourne, Mansfield and Nottingham, Corby and Peterborough.
16. Other areas of marked change during the past decade can be found in the North and East London
commuter belts, Hertsmere in Hertfordshire and in Barking and Dagenham, Havering, Thurrock,
Gravesham and Dartford.
Immigration and population change in the UK's towns and cities 6Table 6: Change in births to non-UK born mothers as share of total live births, 2010-19 (ONS)12. Ordered by
percentage point increase.
Local authority Share Share Growth in component of births to non-UK Area of UK
(2010) (2019) born mothers (2010-19)
Percentage increase Percentage point
increase
1 Havering 20 37 85 17 London
2 Northampton 31 46 48 15 East Midlands
3 Dartford 20 34 70 14 South East
4 Boston 35 49 40 14 East Midlands
5 Corby 24 38 58 14 East Midlands
6 Wellingborough 20 33 65 13 East Midlands
7 Thurrock 24 37 54 13 East of England
8 Swindon 22 34 55 12 South West
9 Ipswich 21 33 57 12 East of England
10 Broxbourne 21 33 57 12 East of England
11 Cambridge 45 57 27 12 East of England
12 Milton Keynes 32 43 34 11 South East
13 Mansfield 11 22 100 11 East Midlands
14 Leicester 45 56 24 11 East Midlands
England as a whole 26 30 15 4
17. Also experiencing relatively high growth were local authorities in the South East (Spelthorne,
Gravesham, Rushmoor), West Midlands (Wolverhampton, Coventry, Warwick, Rugby), North West
(Salford) and Scotland (Midlothian).
Ethnic change in different parts of the UK since 2001
18. For historical reasons, the UK regions with the largest EM shares have been and remain London and
the West Midlands (2020 shares of about 55% and 38% respectively, according to the LFS). Such areas
experienced continuing major change since 2001 but there have also been notably large changes in the
North West, East of England and South East.
Immigration and population change in the UK's towns and cities 7Figure 3: Numerical change in ethnic minority population, 2001-20 (ONS). 19. Table 7 contains data ordered by the size of the percentage increase, over the past two decades or so, of the ethnic minority population as a share of the respective total in each area of Great Britain. Table 7: Change in ethnic minority share of the population by area, (ONS)13. Region 2001 2011 2020 Percentage increase 2001-20 Scotland 3.0 7.7 11.3 277% Wales 3.1 5.3 8.7 181% South West 3.8 8.4 9.7 155% East Midlands 6.9 12.8 17.6 155% South East 6.9 12.7 17.4 152% North East 2.8 5.4 7.0 150% East of England 7.1 13.0 16.6 134% North West 6.3 12.0 14.8 135% Yorkshire and Humberside 7.2 12.1 14.5 101% West Midlands 11.9 18.4 23.0 93% London 38.2 52.8 55.4 45% Immigration and population change in the UK's towns and cities 8
20. According to ONS estimates, three urban areas outside London had a majority of inhabitants who were
of EM background in 2016. It should be noted that these ONS estimates are not official statistics but were
produced using the Annual Population Survey (i.e. Labour Force Survey plus various sample boosts), the
mid-year population estimates and 2011 Census14:
• Already majority-minority - Urban areas included London (56%), Luton (57%), Leicester (58%)
and Slough (69%). [Within London, Newham (85%) and Brent (84%) were top, then Tower
Hamlets (73%), Ealing (73%), and Harrow (72%).
• Higher impact - Places where the EM population was 41%-50% of the total included Birmingham
(48%), Manchester (42%), Watford (41%).
• Medium to higher impact - Those with EM populations of 31%-40% included Sandwell - the
council that includes West Bromwich (38%), Coventry (36%), Reading (35%), Oxford (35%),
Wolverhampton (34%), Nottingham (33%), Bradford (31%), Cambridge (31%).
• Medium to lower impact - Those where the EM population was 21%-30% of the total:
Peterborough (30%), Oldham (29%), Milton Keynes (27%), Southampton (27%), Bedford (26%),
Rochdale (24%), Walsall (24%), Kirklees (24%), Woking (23%), Harlow (22%), Derby (22%),
Bristol (22%).
• Lower impact - With an EM population below the Great Britain average of 21% (20% or lower):
Cardiff (19%), Sheffield (19%), Swindon (19%), Exeter (18%), Newcastle-upon-Tyne (18%),
Stoke-on-Trent (18%), Leeds (18%), Brighton (18%), Liverpool (17%), Portsmouth (15%),
Canterbury (14%), Plymouth (10%), Winchester (8%)15.
How are towns and cities changing?
21. We have suggested above that immigrants and minority ethnic groups have tended to settle more in
urban and industrial areas, often reflecting labour market gaps which immigrant communities came to fill in
the 20th Century. London is clearly the first port of call for many immigrants. Nearly one in three overseas
immigrants to the UK in 2019 (29%) went to London, despite the fact that London only makes up 13% of
the total UK population16. As the Casey Review of 2016 noted, half of all minority ethnic citizens in Britain
then lived in London, Birmingham and Manchester. Similar patterns of urban concentration exist in Scotland
and Wales, such as Edinburgh, Glasgow, Cardiff and, increasingly, Swansea17.
22. This is reflected in the fact that recent population growth has been much faster in urban and suburban
areas than in rural areas, accompanied by a process of what the Resolution Foundation (RF) has called
“demographic divergence”, in which the average age in rural populations is rising and urban populations
are becoming younger. RF calls this trend ‘particularly worrying’, while noting the major implications for
politics, local governance and economic strategies18.
The growing urban / rural and older / younger divide
23. Immigrants and those from a minority background also tend to be younger than the overall resident
population. As the RF noted in 2019: “The poorest parts of the country are often urban, young (and getting
younger) ethnically diverse local authorities with high birth rates.” This means that large numbers of
children are being born in low-income places19.
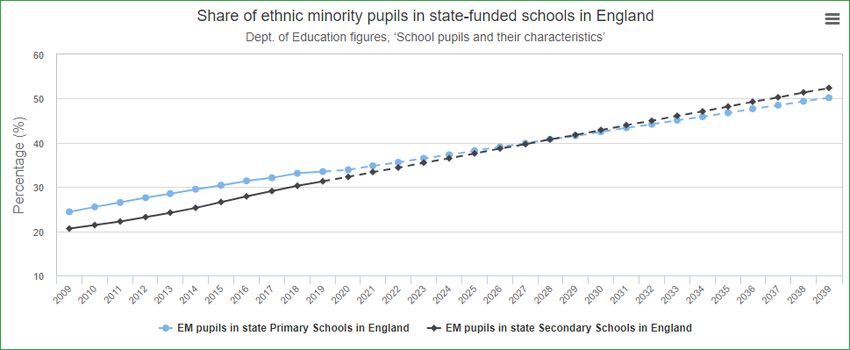
Immigration and population change in the UK's towns and cities 924. More than 90% of immigrants arriving in the UK in 2018 were under 45, compared with less than 60% of the UK population generally20. Meanwhile, the average age of international immigrants to London is 28.3, so migration and relatively high birth rates bring London’s average age down21. 25. The younger cohort of the UK population is much more ethnically diverse than the older cohort. Our previous paper showed that just over a third of pupils in England’s state schools are of ethnic minority heritage (compared with just over a fifth of the total population in England), but with significant regional differences. In the North East of England, the figure is 12%, while it is 38% in the West Midlands and 80% in inner London22 - ethnic segregation becoming a major problem. A Demos study found that, in 2013, more than 50% of ethnic minority students were in schools where ethnic minorities formed the majority of pupils23. 26. The graph below shows both actual and forecast share of ethnic minority pupils in English state-funded schools24. The forecast line after 2020 is based upon the average annual increase in the respective share of ethnic minority pupils from 2009-20 (0.84% for Primary Schools and just over 1% for Secondary schools). This suggests that, on recent trends, ethnic minority children will become the majority in English state schools in about 20 years. Figure 4: Share of ethnic minority pupils in state-funded schools in England (Dept. of Education figures, ‘School pupils and their characteristics’)25. 27. Younger people are more likely to move to urban areas, so the average age in rural areas is 45 (and rising), compared with 39 for urban areas. Indeed, it is quite striking that the fastest-growing population groups overall are rural 55-74s, and rural people over 7526. 28. Professor Eric Kaufmann has described a process in which white majorities are moving towards areas that are heavily white while avoiding more diverse places, with White British families increasingly tending to avoid dense and diverse neighbourhoods - part of a broader picture of population churn. He also cites statistics which show divergence in the moving patterns of both whites and minorities. During the 2000s, two-thirds of white British movers chose whiter wards, 12% went to more diverse places and the rest selected wards of similar diversity. For minority movers, 25% per cent opted for white wards, while 40% chose more diverse wards to move to27. Immigration and population change in the UK's towns and cities 10
29. Meanwhile, Ian Gordon has suggested that London’s growing migrant population has been
accommodated, despite the Capital’s ‘inelastic’ housing stock, by both ‘displacement of others into nearby
regions’ and by acceptance of much higher levels of crowding. However, this is not something that can be
expected to continue, since as migrants ‘become better integrated economically and socially, density
standards seem to converge towards those of the UK-born population’28. This seems to imply that
'displacement' from London may be set to continue (and could perhaps increase), especially should
immigration continue at the very high recent levels.

30. The process of ‘demographic divergence’ related to age (noted above) may have political impacts. The
Resolution Foundation’s view is that ‘age has replaced class as the big dividing line in our politics’ and ‘has
become a key driver of voting preferences’29. However, as Professor Kaufmann notes, in the midst of
shifting demographic patterns, ‘ethnic change is altering the basis of politics from class to ethnicity’30.
How these processes interact as the population transformation continues will be of prime importance for the
UK during the rest of the 21st century and beyond.

Conclusion
31. The uneven impact of immigration and other demographic changes on different parts of the country -
particularly on various urban and suburban areas - are multifarious and difficult to disentangle. However, it
is clear that these effects have been and will continue to be profound. In 2016, Dame Louise Casey
identified ‘worrying levels of segregation and socio-economic exclusion’ in different areas of the
country. In her words: “As the diversity of the nation has increased [a] dynamic is… clear – people
from minority groups have become both more dispersed and in some cases more concentrated and
segregated.”31 As a striking illustration, in one school visited by Casey Report researchers, pupils believed
the population of Britain to be between 50% and 90% Asian, such had been their experience up to that
point.

32. Should the trends described above be allowed to continue, there is an increasing potential for the
shared outlook that has long undergirded British life to weaken further - driven mainly by the huge scale of
recent arrivals together with the younger age structure of most, and the higher fertility rates of some
immigrant groups32.

Immigration and population change in the UK's towns and cities                                              11
Annex A
Table A: Change in share of births to non-UK born mothers by area, (ONS)33.

 Area of UK                     2001 % births to non-UK   2019 % births to non-UK   % point increase
                                born mothers              born mothers
 London                         43                        57                        14
 West Midlands                  15                        27                        13
 East of England                12                        26                        14
 South East                     13                        26                        13
 East Midlands                  10                        24                        15
 Yorkshire / Humber             12                        22                        10
 North West                     10                        21                        11
 South West                     7                         17                        10
 North East                     6                         12                        6
 England                        17                        30                        13
 Wales                          5                         12                        7

Immigration and population change in the UK's towns and cities                                         12
Notes
1. Migration Watch UK, ‘Impact of immigration in changing the UK population’, 27 July 2021, URL: https://www.migrationwatchuk.org/
briefing-paper/492/impact-of-immigration-in-changing-the-uk-population
2. The ONS and Cabinet Office employ the term “ethnic minorities” to describe all groups other than “White British”. On this definition,
groups such as “White – Irish”, “White – Gypsy or Irish Traveller” and “White – Other” are classified as ethnic minorities. ONS, ‘Ethnic
group, national identity and religion’, URL: https://www.ons.gov.uk/methodology/classificationsandstandards/measuringequality/
ethnicgroupnationalidentityandreligion
3. ONS, Population estimates by ethnic group for 2016; BBC News, December 2012, URL: https://www.bbc.co.uk/news/uk-england-
london-20680565 ; ONS, ‘2011 Census: Key Statistics for England and Wales, March 2011’, URL: https://www.ons.gov.uk/
peoplepopulationandcommunity/populationandmigration/populationestimates/bulletins/
2011censuskeystatisticsforenglandandwales/2012-12-11
4. See Figure 2 in Migration Watch UK, ‘Impact of immigration in changing the UK population’, 27 July 2021, URL: https://
www.migrationwatchuk.org/briefing-paper/492/impact-of-immigration-in-changing-the-uk-population
5. ONS, Table 2.06, Migrants’ destination within the UK, URL: https://www.ons.gov.uk/peoplepopulationandcommunity/
populationandmigration/internationalmigration/datasets/
longterminternationalmigrationareaofdestinationororiginwithintheuktable206
6. ONS population by country of birth data from the APS, latest release January 2021, URL: https://www.ons.gov.uk/
peoplepopulationandcommunity/populationandmigration/internationalmigration/datasets/
populationoftheunitedkingdombycountryofbirthandnationality
7. Ibid.
8. Ibid.
9. Estimates of the non-UK born resident population, derived from the APS, ONS local area migration indicators tables, last published:
August 2020, URL: https://www.ons.gov.uk/peoplepopulationandcommunity/populationandmigration/migrationwithintheuk/datasets/
localareamigrationindicatorsunitedkingdom
10. ONS local area migration indicators.
11. ONS births data, as contained in ONS, local area migration indictors tables, latest release August 2020, URL: https://www.ons.gov.uk/
peoplepopulationandcommunity/populationandmigration/migrationwithintheuk/datasets/localareamigrationindicatorsunitedkingdom
12. Ibid.
13. ONS Labour Force Survey. NB These figures use the ONS definitions of ethnicity. See our first paper in this series, URL: https://
www.migrationwatchuk.org/briefing-paper/492/impact-of-immigration-in-changing-the-uk-population Scotland has developed its
ethnic group question independently from other parts of the UK. The question distinguished ‘White Scottish’ from ‘White Other British’
for the first time in 2001. In 2011 it identified ‘White: Polish’, ‘White: Gypsy/Traveller’, and ‘Arab’ for the first time, and made African a
separate category from ‘Caribbean or Black.
14. ONS, Population estimates by ethnic group for 2016.
15. These tables are only for England and Wales. However, the 2011 census showed that the ethnic minority share of cities in Scotland
were 17.9% in Edinburgh, 17.3% in Glasgow and 17.1% in Aberdeen, URL: https://www.scotlandscensus.gov.uk/census-results/at-a-
glance/ethnicity/
16. ONS data tables, Long-term international migration 2.06, area of destination or origin within the UK, URL: https://www.ons.gov.uk/
peoplepopulationandcommunity/populationandmigration/internationalmigration/datasets/
longterminternationalmigrationareaofdestinationororiginwithintheuktable206
17. As the ESRC Centre on Dynamics of Ethnicity (CoDe) has written, Edinburgh and Glasgow are the largest Scottish local authorities with
one fifth of Scotland’s population. They house 44% of the minority population if ‘White Other British’ is excluded. A 2014 report noted
that every ward in both Edinburgh and Glasgow has seen an increase in diversity (between 2001 and 2011). It added: “All of Edinburgh’s
population and two thirds of Glasgow’s population live in electoral wards that are more diverse than Scotland as a whole.” However,
CoDE also notes that the data shows that minorities are moving into new parts of Scotland growth has been at least as great outside
each group’s ‘clustered’ wards as within them, with Chinese the only exception to this rule. CoDE, May 2014, URL: http://bemis.org.uk/
docs/code-census-briefing-scotland_v2.pdf
18. Resolution Foundation, ‘Ageing, fast and slow’, October 2019, p.47, URL: https://www.resolutionfoundation.org/app/uploads/2019/10/
Ageing-fast-and-slow.pdf
19. Ibid, p. 44.
20. ONS international migration data, URL: https://www.ons.gov.uk/peoplepopulationandcommunity/populationandmigration/
internationalmigration/datalist?filter=datasets
21. Resolution Foundation (2019), p.46.
22. The Casey Review, 2016, p. 11, URL: https://assets.publishing.service.gov.uk/government/uploads/system/uploads/attachment_data/
file/575973/The_Casey_Review_Report.pdf; ICoCo, ‘Understanding school segregation’, March 2017, URL: https://drive.google.com/
file/d/0BxL3m2uvdxMea2F1X0liT2JMSG5kYjJKaVN1akpSWjBLSEh3/view?resourcekey=0-S8Sal4vRVP1uc64G78kWlg
23. Casey Review, 2016. P.11
24. Ibid.
25. Department of Education, ‘Schools, pupils and their characteristics’, 29 June 2017, URL: https://assets.publishing.service.gov.uk/
government/uploads/system/uploads/attachment_data/file/650547/SFR28_2017_Main_Text.pdf / January 2020, URL: https://explore-
education-statistics.service.gov.uk/find-statistics/school-pupils-and-their-characteristics
26. Resolution Foundation (2019), quoted in BBC briefing on housing, 2021. P. 56. URL: http://news.files.bbci.co.uk/include/newsspec/
pdfs/bbc-briefing-housing-newsspec-26534.pdf
27. Eric Kaufmann, Whiteshift, (Allen Lane, 2018).
28. Ian Gordon, 'Development, displacement and.or densification in the London region', in Kochan, Ben, ed. (2014) Migration and London’s
growth: final report of LSE London’s HEIF 5 project on Migration and the Transformation of London. LSE London, London, UK, p. 7, URL:
Immigration and population change in the UK's towns and cities 13http://eprints.lse.ac.uk/62150/1/Kochan_migration_and_londons_growth.pdf
29. Resolution Foundation (2019), p.52.
30. Kaufmann (2018).
31. Dame Louis Casey, ‘Review into opportunity and integration’, December 2016, URL: https://assets.publishing.service.gov.uk/
government/uploads/system/uploads/attachment_data/file/575973/The_Casey_Review_Report.pdf
32. ONS 2011 Census; BBC briefing on immigration, p. 108.
33. ONS, parents’ country of birth, latest release July 2020, URL: https://www.ons.gov.uk/peoplepopulationandcommunity/
birthsdeathsandmarriages/livebirths/datasets/parentscountryofbirth; ONS, local area migration indictors, latest release: August 2020,
URL: https://www.ons.gov.uk/peoplepopulationandcommunity/populationandmigration/migrationwithintheuk/datasets/
localareamigrationindicatorsunitedkingdom
Immigration and population change in the UK's towns and cities 14You can also read