Payments and E-commerce Report - Asia Pacific - Gain expertise and get granular insights on e-commerce in Asia Pacific: consumer demographics ...
←
→
Page content transcription
If your browser does not render page correctly, please read the page content below
Payments and E-commerce Report
Asia Pacific

Gain expertise and get granular insights on e-commerce in Asia Pacific:
consumer demographics, payment preferences, cross-border shopping stats
and more.
                                                                      1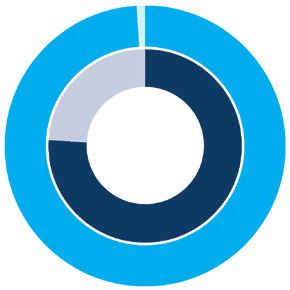
Asia Pacific
There is a certain solemn shuffle in the way that economic      On the bright side, at least for anyone involved in online
forecasts are released and updated. Long-range forecasts        retail, e-commerce appears to be enjoying a boom.
are always a little uncertain. The markets monitor them,
and as the time draws near for them to be updated, there        In China, TenCent announced that it was hiring new workers
is some sober speculation in the business press about           to cope with the boom in demand for e-commerce since
whether the previous estimate will have to be updated by        COVID-19 made it hard for people to shop instore⁵. During
fractions of a percentage point.                                the peak of the outbreak in China, online grocer Carrefour
                                                                saw orders in some categories increase by 600 %⁵. In
Not this year. In October 2019, the IMF predicted that Asia     Singapore, shoppers have been buying four to eight times
would grow by 5 % in 2019¹. That’s 0.4 % lower than the         their normal order with online grocers⁷. In South Korea,
IMF’s April 2019 projection for full year growth, but overall   e-commerce operator Coupang has seen deliveries rise
not too bad¹. How is that prediction holding up now?            from 2.2 million a day before the outbreak to 3 million now⁸.

The short answer is that we don’t know yet. The novel           Whether these changes in behaviour are permanent or not
coronavirus has swept all assumptions before it and left        remains to be seen. For now, all we can say for sure is that
them piled in a heap. By the time this report was going to      all economic forecasts for Asia Pacific are now outdated.
press, it appeared as if the worst of the pandemic was          The region is the part of the world that seems to have the
already over for Asia.                                          virus best under control. But for the economy to return to
                                                                normal, Asia’s export markets also need to follow its lead
Mass testing and strict social distancing has seen the          and take whatever measures are necessary to beat the
number of new cases fall to zero in China². Singapore, Japan,   pandemic.
South Korea and other Asian markets also appeared to
have the virus under control³. Reports indicate that people     In the meantime, the e-commerce industry looks as if it
in these countries are once more spending money.                could be one of the few beneficiaries of this unprecedented
                                                                disruption.
But that does not mean that a rapid recovery – the v-shaped
bounce so beloved of optimistic economists – is assured.
There are still many constraints on growth which have to be     THE ASIAN E-COMMERCE MARKET
cleared. Ports are still trying to clear the backlog of goods
in warehouses⁴. And Western markets – the main destina-         On average, the B2C e-commerce market in the countries
tions for many Asian goods – are trying to contain the          covered by this report is growing by 22 %, consumers
spread of the pandemic by staying in.                           spend $ 2,181 a year with online merchants, and online

2
sales account for 20 % of all retail sales⁹. However, these      THE LOCAL PAYMENT CULTURE
averages conceal wide disparities. In Malaysia, for instance,
e-commerce volumes are growing at a rate of 39 % a year.         The most common type of online payment method was the
Whereas, in Japan, a much more mature market, the growth         e-wallet, with a 46 % market share⁹. Cards came second at
rate is 9 %⁹.                                                    30 %, followed by bank transfers (13 %), cash (7 %) and
                                                                 various minor payment types (4 %)⁹. The card market is
In rapidly industrialising and developing markets such as        dominated by local schemes and minor players at 86 %⁹.
the Philippines and Indonesia, e-commerce is growing at          Visa has 9 % of the card market, Mastercard 5 % and
close to or even more than 30 % a year⁹. In more mature          American Express less than 1 %⁹.
markets such as Hong Kong, Taiwan and Singapore, the
growth rate hovers closer to 10 %⁹. 58 % of all online pur-
chases in the region are made on a mobile device⁹.               ENABLING AND LIMITING FACTORS

China dominates the regional e-commerce market. 42 % of          In the markets we researched, 76 % of the population had a
all e-commerce purchases worldwide take place in China¹⁰,        bank account and just 14 % a credit card⁹. Access to financial
so it’s unsurprising that China is a colossus in the regional    services varies a great deal from country to country. In
e-commerce market, even one as big as APAC’s.                    Vietnam, for instance, 31 % of the population has a bank
                                                                 account compared with 100 % in Australia⁹.
Southeast Asia looks like it will be the next big arena of
competition, with local players squaring off against US and      In Southeast Asia, more than half of adults in the poorest
Chinese competitors. Between 2017 and now, Amazon has            40 % of households remain unbanked¹⁷ In India, 80 % of the
expanded into Singapore¹¹, Vietnam¹² and Australia¹³. In a       population has a bank account⁹. This is largely thanks to a
recent article, Reuters suggested that investing in Singa-       government initiative to broaden access, which has seen
pore is often a stepping stone to expansion into larger          300 million new accounts open in just a few years¹⁸. Accor-
Southeast Asian markets such as Indonesia¹⁴.                     ding to the World Bank, China is building a network of bank
                                                                 agents – operating from small local businesses – to bring
Ambitious though it may be, Amazon will not have the             banking services to the 43 % of its population that still lives
market to itself. Chinese e-commerce giant Alibaba has           on the land¹⁹.
invested US$ 2 billion in the region and is present in markets
including Singapore, Indonesia, Malaysia, the Philippines,       Over 1.78 billion Asians have some sort of Internet
Thailand, and Vietnam¹⁵. There is also strong local com-         connection⁹. 51 % have an Internet-enabled smartphone⁹.
petition from sites such as Tokopedia and Shopee¹⁶.              The state of connectivity differs greatly from one market to

                                                                                                                               3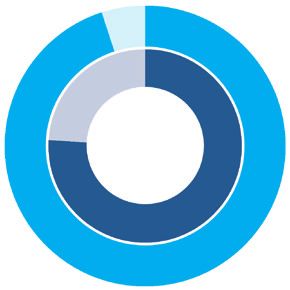
the next and between rural and urban areas. Any merchant
or PSP planning to expand into Asia will need to understand
the context of each market and of each audience segment
within that market.

In some areas, logistics may be challenging. Even in well-
served Singapore, up to half of consumers say that worries
about delivery put them off shopping online²⁰. With pay-
ment by card, particularly the big international brands,
making up a very small fraction of the market, support for
local payment methods will also be crucial. New entrants
will need to invest heavily in localisation and have strategies
for competing not only with local incumbents but also with
Chinese and US newcomers.

CONCLUSION

Asia Pacific is a fast-growing and highly lucrative e-com-
merce market. Merchants entering the region need to plan
for the long term. That means thinking about how consumer
sentiment and trading conditions may change over the
next few years. But, even in a slowdown, there are many
millions of consumers in Asia Pacific shopping for leading
brands and great products.

4

1. Asia and Pacific Regional Economic Outlook: Caught in Prolonged Uncertainty, October 2019, International Monetary Fund
2. The coronavirus pandemic began in China. Today, it reported no new local infections for the first time, CNN, 19 March 2020
3. This interactive chart shows countries flattening their COVID-19 curves, WEF, 19 March 2020
4. Coronavirus Snarls Trans-Pacific Shipping and Ripples Through U.S. Business, Wall Street Journal, 5 March 2020
5. Tencent ramps up hiring to meet stay-at-home demand, Nikkei Asia, 17 March 2020
6. Coronavirus’s Impact on Consumers and Businesses in China, 26 February 2020, eMarketer
7. Demand for online grocery and food delivery ticks higher in Singapore amid coronavirus outbreak, CNBC, 28 February 2020
8. South Korean e-commerce firm Coupang stretched by order surge as coronavirus cases jump, Reuters, 4 March 2020
9. Original PPRO research
10. 42 % of global e-commerce is happening in China. Here’s why, 10 April 2018, Rob Smith, World Economic Forum
11. Amazon enters Southeast Asia with launch of Prime Now fast delivery service in Singapore, 27 July 2017, EDB Singapore
12. Amazon establishes subsidiary in Vietnam, 16 August 2019, Vietnam Plus
13. Amazon in Asia Pacific: A 2019 update, 11 March 2019, Jeff Rajeck, Econsultancy
14. Amazon launches bigger local online store in Singapore, 8 October 2019, Reuters
15. Belt and road on steroids: How Alibaba conquered Southeast Asia, 2 April 2019, Qian Linliang, Financial Review
16. Digital 2019: Leading Online Retailers in Southeast Asia, 18 September 2019, Simon Kemp & Sarah Moey, Data Portal
17. Accelerating Financial Inclusion in South-East Asia With Digital Finance, 2017, Asian Development Bank.
18. India Moves Toward Universal Financial Inclusion, 30 August 2018, CGAP.
19. Toward Universal Financial Inclusion in China, February 2018, The World Bank.
20. Lifting the Barriers to E-Commerce in ASEAN, 2016, A. T. Kearney.

                                                                                                                                5
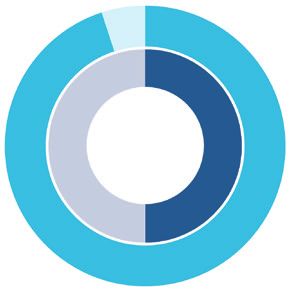
Regional Payment Trends                                                                                        76 %

                                                                                                               74 %

                                                                                                          Banked
                                                        Region                  World                    population

Population                                                3.6 bn                7.6 bn

Population (15+)                                          2.8 bn                5.6 bn

                                                                                                                               World
GDP                                                       29.1 tr               85.8 tr
                                                                                                               14 %

GDP per capita                                             8,165                11,299                         21 %

B2C e-commerce                                             1.7 tr                3.4 tr                  Credit card
                                                                                                         penetration

                                                                                                                               Region
B2C e-commerce growth                                      22 %                  18 %

Online population                                         1.8 bn                4.5 bn

Smartphone penetration                                      51 %                 58 %
                                                                                                               50 %
Mobile e-commerce                                          57 %                  50 %
                                                                                                               60 %
Average online spend                                       2,181                 2,594
                                                                                                          Internet
                                                                                                         penetration
E-commerce % of total retail                               20 %                  16 %

                        Currencies in this report are always depicted in $USD

                                                                                          2%
                   4%
                                                                                               9%
                                                                                                          1%
                                                                                                    5%
                                                        Card                                                           Visa
                                    30 %
                                                        Cash                                                           Mastercard
                  Payment                                                                  Card
                  method                                 ank
                                                        B                                scheme                        AMEX
                                                        transfer
                 breakdown                                                              breakdown
    46 %                                                                                                               Local
                                                        E-wallet                                                       schemes
                                      7%                Other                                                          Other
                                                                                    84 %
                           13 %

6
Australia     . . . . . . . . . . . . . . . . . . 10

China         . . . . . . . . . . . . . . . . . . 12

Hong Kong     . . . . . . . . . . . . . . . . . . 14

India         . . . . . . . . . . . . . . . . . . 16

Indonesia     . . . . . . . . . . . . . . . . . . 18

Japan         . . . . . . . . . . . . . . . . . . 20

Malaysia      . . . . . . . . . . . . . . . . . . 22

New Zealand   . . . . . . . . . . . . . . . . . . 24

Philippines   . . . . . . . . . . . . . . . . . . 26

Singapore     . . . . . . . . . . . . . . . . . . 28

South Korea   . . . . . . . . . . . . . . . . . . 30

Taiwan        . . . . . . . . . . . . . . . . . . 32

Thailand      . . . . . . . . . . . . . . . . . . 34

Vietnam       . . . . . . . . . . . . . . . . . . 36

                                                       7
Australia                                                                                            13 %
                                                                                               e-commerce growth

                                    Australia         Region              World
Population                             25 m                3.6 bn          7.6 bn

Population (15+)                      20.2 m               2.8 bn          5.6 bn    TOP E-COMM SEGMENTS
GDP                                    1.4 tr              29.1 tr         85.8 tr

GDP per capita                        57,305               8,165           11,299

Online population                      22 m                1.8 bn          4.5 bn
                                                                                       Airlines & Hotels: 22 %
Smartphone penetration                 84 %                 51 %            58 %

Average online spend                   1,935               2,181           2,594

E-commerce % of total retail               9%              20 %             16 %

                                                                                     Clothing & Footwear: 12 %
     Banked                      Credit card                          Internet
    population                   penetration                         penetration
             100 %                         60 %                           88 %

             76  %                         14 %                           50 %

                                                                                        Food & Drink: 10 %

                               Australia          Region                                Electrical goods: 9 %

                                                                                     Homeware & Furniture: 6 %
      B2C e-comm.              Mobile e-comm.          Cross-border e-comm.
         30 bn                  43 % of total              30 % of total

8
5%

                                                        53 % Card total
                                                        53 % ICS
                                        Card
 22 %
                                        Cash
           Payment
           method               53 %    Bank transfer
          breakdown                                     22 % E-wallet total
                                        E-wallet        15 % PayPal
  16 %
                                        Other           7 % Other

         5%

              1%

         8%
                                                        9 bn
                                       Card scheme      Cross-border
                                       breakdown        e-commerce value

                                        Visa            63 % shop cross-border
31 %
                                        Mastercard
                                                             China: 40 %
                              60 %
                                        AMEX

                                        Other                USA: 21 %

                                                             UK: 14 %

              POLi Payments

                                                                                 9
China                                                                                                 24 %
                                                                                                e-commerce growth

                                        China          Region             World
 Population                             1.4 bn             3.6 bn          7.6 bn

 Population (15+)                       1.1 bn             2.8 bn          5.6 bn    TOP E-COMM SEGMENTS
 GDP                                    13.6 tr            29.1 tr         85.8 tr

 GDP per capita                          9,771              8,165          11,299

 Online population                      756.3 m            1.8 bn          4.5 bn

 Smartphone penetration                  60 %               51 %            58 %
                                                                                      Clothing & Footwear: 17 %
 Average online spend                    2,386              2,181          2,594

 E-commerce % of total retail            24 %               20 %            16 %

                                                                                       Airlines & Hotels: 15 %
      Banked                     Credit card                          Internet
     population                  penetration                         penetration
              80 %                         21 %                           54 %

              76 %                         14 %                           50 %

                                                                                        Electrical goods: 14 %

                                China             Region                                 Food & Drink: 11 %

                                                                                     Homeware & Furniture: 10 %
       B2C e-comm.              Mobile e-comm.             Cross-border e-comm.
        1,276.2 bn               59 % of total                 17 % of total

10
3%
22 % Card total
22 %
22 % CUP
Card
Cash
Payment
method 6% Bank transfer
56 % E-wallet total
breakdown
E-wallet 33 % Alipay
56 % 23 % WeChat Pay
13 % Other
5 % Other
100 %
217 bn
Cross-border
e-commerce value
Card scheme
43 % shop cross-border
breakdown
Local schemes Japan: 23 %
USA: 14 %
Hong Kong: 12 %
UnionPay
11Hong Kong 12 %
e-commerce growth
Hong Kong Region World
Population 7.5 m 3.6 bn 7.6 bn
Population (15+) 6.6 m 2.8 bn 5.6 bn TOP E-COMM SEGMENTS
GDP 363 bn 29.1 tr 85.8 tr
GDP per capita 48,717 8,165 11,299
Online population 6.7 m 1.8 bn 4.5 bn
Airlines & Hotels: 26 %
Smartphone penetration 76 % 51 % 58 %
Average online spend 3,301 2,181 2,594
E-commerce % of total retail N/A 20 % 16 %
Clothing & Footwear: 13 %
Banked Credit card Internet
population penetration penetration
95 % 65 % 89 %
76 % 14 % 50 %
Electrical goods: 13 %
Hong Kong Region Food & Drink: 10 %
Homeware & Furniture: 10 %
B2C e-comm. Mobile e-comm. Cross-border e-comm.
15.7 bn 50 % of total 36 % of total
125%
43 % Card total
29 % CUP
Card
14 % ICS
Cash
30 % Payment 43 %
method Bank transfer
breakdown
E-wallet
30 % E-wallet total
Other
16 % Allpay
14 % Other
13 %
8%
17 % 5.6 bn
Card scheme Cross-border
breakdown e-commerce value
10 %
Visa 75 % shop cross-border
Mastercard
China: 37 %
6%
67 % AMEX
Other USA: 21 %
Japan: 16 %
Alipay HK Octopus App
13India 28 %
e-commerce growth
India Region World
Population 1.4 bn 3.6 bn 7.6 bn
Population (15+) 982.1 m 2.8 bn 5.6 bn TOP E-COMM SEGMENTS
GDP 2.7 tr 29.1 tr 85.8 tr
GDP per capita 2,016 8,165 11,299
Online population 466 m 1.8 bn 4.5 bn
Airlines & Hotels: 16 %
Smartphone penetration 36 % 51 % 58 %
Average online spend 428 2,181 2,594
E-commerce % of total retail 4% 20 % 16 %
Clothing & Footwear: 13 %
Banked Credit card Internet
population penetration penetration
80 % 3% 34 %
76 % 14 % 50 %
Electrical goods: 11 %
India Region Food & Drink: 9 %
Homeware & Furniture: 9 %
B2C e-comm. Mobile e-comm. Cross-border e-comm.
43.4 bn 46 % of total 16 % of total
147%
32 % Card total
26 % ICS
32 % Card
6 % RuPay
26 % Cash
Payment
method Bank transfer
breakdown
E-wallet
26 % E-wallet total
Other
13 % PayPal
18 %
17 % 13 % Other
20 % 7 bn
Card scheme Cross-border
2%
breakdown e-commerce value
45 % Visa 34 % shop cross-border
Mastercard
USA: 26 %
AMEX
33 % Local schemes China: 23 %
Australia: 8 %
PhonePe WhatsApp Pay
15Indonesia 31 %
e-commerce growth
Indonesia Region World
Population 267.7 m 3.6 bn 7.6 bn
Population (15+) 195.4 m 2.8 bn 5.6 bn TOP E-COMM SEGMENTS
GDP 1 tr 29.1 tr 85.8 tr
GDP per capita 3,894 8,165 11,299
Online population 146.4 m 1.8 bn 4.5 bn
Smartphone penetration 60 % 51 % 58 %
Electrical goods: 17 %
Average online spend 360 2,181 2,594
E-commerce % of total retail 4% 20 % 16 %
Airlines & Hotels: 16 %
Banked Credit card Internet
population penetration penetration
49 % 2% 55 %
76 % 14 % 50 %
Homeware & Furniture: 9 %
Clothing & Footwear: 8 %
Indonesia Region
Health & Beauty: 8 %
B2C e-comm. Mobile e-comm.
14.4 bn 54 % of total
167%
17 % E-wallet total
15 % PayPal
17 % Card
34 % 2 % Other
Cash
Payment
method Bank transfer
breakdown
E-wallet
Other
29 %
13 %
13 % Top cross-border
Card scheme
markets
breakdown
China: 41 %
50 % Visa
Mastercard
USA: 10 %
36 %
Other
Singapore: 10 %
17Japan 9%
e-commerce growth
Japan Region World
Population 126.5 m 3.6 bn 7.6 bn
Population (15+) 110.3 m 2.8 bn 5.6 bn TOP E-COMM SEGMENTS
GDP 5 tr 29.1 tr 85.8 tr
GDP per capita 39,287 8,165 11,299
Online population 118.1 m 1.8 bn 4.5 bn
Airlines & Hotels: 22 %
Smartphone penetration 55 % 51 % 58 %
Average online spend 1,666 2,181 2,594
E-commerce % of total retail 9% 20 % 16 %
Food & Drink: 18 %
Banked Credit card Internet
population penetration penetration
98 % 68 % 93 %
76 % 14 % 50 %
Electrical goods: 12 %
Japan Region Clothing & Footwear: 11 %
Homeware & Furniture: 7 %
B2C e-comm. Mobile e-comm. Cross-border e-comm.
160.2 bn 54 % of total 10 % of total
183% 11 %
68 % Card total
35 % JCB
Card
33 % ICS
13 % Cash
Payment
method Bank transfer
breakdown
E-wallet
6%
68 % Other
1%
Card scheme 16 bn
27 % Cross-border
breakdown
e-commerce value
Visa
6 % shop cross-border
Mastercard
52 %
China: 29 %
AMEX
Local schemes
19 % USA: 29 %
Other
South Korea: 12 %
2%
Carrier billing Konbini Payments
19Malaysia 39 %
e-commerce growth
Malaysia Region World
Population 31.5 m 3.6 bn 7.6 bn
Population (15+) 23.9 m 2.8 bn 5.6 bn TOP E-COMM SEGMENTS
GDP 354.3 bn 29.1 tr 85.8 tr
GDP per capita 11,239 8,165 11,299
Online population 25.3 m 1.8 bn 4.5 bn
Airlines & Hotels: 26 %
Smartphone penetration 84 % 51 % 58 %
Average online spend 352 2,181 2,594
E-commerce % of total retail 2% 20 % 16 %
Electrical goods: 13 %
Banked Credit card Internet
population penetration penetration
85 % 21 % 80 %
76 % 14 % 50 %
Clothing & Footwear: 10 %
Homeware & Furniture: 9 %
Malaysia Region
Health & Beauty: 9 %
B2C e-comm. Mobile e-comm. Cross-border e-comm.
5.6 bn 52 % of total 40 % of total
205%
6%
32 % Card
Cash
Payment
method Bank transfer
breakdown
E-wallet
Other
46 %
11 %
2%
2.2 bn
Cross-border
Card scheme e-commerce value
breakdown
38 % 48 % shop cross-border
Visa
59 % Mastercard
China: 63 %
AMEX
USA: 7 %
South Korea: 4 %
Maybank2U
21New Zealand 10 %
e-commerce growth
New Zealand Region World
Population 4.9 m 3.6 bn 7.6 bn
Population (15+) 3.9 m 2.8 bn 5.6 bn TOP E-COMM SEGMENTS
GDP 205 bn 29.1 tr 85.8 tr
GDP per capita 41,966 8,165 11,299
Online population 4.4 m 1.8 bn 4.5 bn
Airlines & Hotels: 35 %
Smartphone penetration 79 % 51 % 58 %
Average online spend 1,997 2,181 2,594
E-commerce % of total retail 8% 20 % 16 %
Food & Drink: 10 %
Banked Credit card Internet
population penetration penetration
99 % 61 % 91 %
76 % 14 % 50 %
Clothing & Footwear: 10 %
New Zealand Region Electrical goods: 9 %
Homeware & Furniture: 7 %
B2C e-comm. Mobile e-comm. Cross-border e-comm.
4.4 bn 37 % of total 16 % of total
223%
17 % 55 % Card total
Card 55 % ICS
Cash
Payment
method Bank transfer
breakdown 55 %
E-wallet 17 % E-wallet total
22 % 12 % PayPal
Other
5 % Other
3%
3%
6%
0.7 bn
Card scheme Cross-border
breakdown e-commerce value
27 % Visa 34 % shop cross-border
Mastercard
China: 33 %
64 % AMEX
Local schemes Australia: 22 %
USA: 19 %
POLi Payments
23Philippines 27 %
e-commerce growth
Philippines Region World
Population 106.7 m 3.6 bn 7.6 bn
Population (15+) 73.1 m 2.8 bn 5.6 bn TOP E-COMM SEGMENTS
GDP 330.9 bn 29.1 tr 85.8 tr
GDP per capita 3,103 8,165 11,299
Online population 64 m 1.8 bn 4.5 bn
Airlines & Hotels: 29 %
Smartphone penetration 45 % 51 % 58 %
Average online spend 112 2,181 2,594
E-commerce % of total retail 2% 20 % 16 %
Clothing & Footwear: 13 %
Banked Credit card Internet
population penetration penetration
34 % 2% 60 %
76 % 14 % 50 %
Food & Drink: 11 %
Electrical goods: 8 %
Philippines Region
Health & Beauty: 8 %
B2C e-comm. Mobile e-comm. Cross-border e-comm.
3.8 bn 50 % of total 24 % of total
245%
8%
22 %
Card
Cash
Payment
method Bank transfer
breakdown
29 % E-wallet
Other
37 %
1%
17 %
Card scheme 0.9 bn
Cross-border
breakdown
e-commerce value
Visa
50 % shop cross-border
Mastercard
22 % China: 39 %
58 % AMEX
Local schemes
USA: 23 %
Other
South Korea: 7 %
2%
7-CONNECT
25Singapore 13 %
e-commerce growth
Singapore Region World
Population 5.6 m 3.6 bn 7.6 bn
Population (15+) 4.8 m 2.8 bn 5.6 bn TOP E-COMM SEGMENTS
GDP 364.2 bn 29.1 tr 85.8 tr
GDP per capita 64,582 8,165 11,299
Online population 4.8 m 1.8 bn 4.5 bn
Airlines & Hotels: 29 %
Smartphone penetration 91 % 51 % 58 %
Average online spend 1,648 2,181 2,594
E-commerce % of total retail 6% 20 % 16 %
Clothing & Footwear: 12 %
Banked Credit card Internet
population penetration penetration
98 % 49 % 84 %
76 % 14 % 50 %
Electrical goods: 11 %
Food & Drink: 10 %
Singapore Region
Health & Beauty: 8 %
B2C e-comm. Mobile e-comm. Cross-border e-comm.
5.6 bn 47 % of total 35 % of total
261%
10 %
75 % Card total
10 % Card 39 % eNETS
Payment
Cash 34 % ICS
4%
method Bank transfer 2 % Other
breakdown
E-wallet
Other
75 % 10 % E-wallet total
5 % PayPal
5 % Other
2%
Card scheme 2 bn
26 % Cross-border
breakdown
e-commerce value
Visa
73 % shop cross-border
52 % Mastercard
AMEX
China: 43 %
17 % Local schemes
USA: 20 %
Other
South Korea: 8 %
3%
DBS PayLah!
27South Korea 24 %
e-commerce growth
S. Korea Region World
Population 51.6 m 3.6 bn 7.6 bn
Population (15+) 44.7 m 2.8 bn 5.6 bn TOP E-COMM SEGMENTS
GDP 1.6 tr 29.1 tr 85.8 tr
GDP per capita 31,363 8,165 11,299
Online population 49.1 m 1.8 bn 4.5 bn
Smartphone penetration 94 % 51 % 58 %
Food & Drink: 21 %
Average online spend 1,604 2,181 2,594
E-commerce % of total retail 16 % 20 % 16 %
Airlines & Hotels: 18 %
Banked Credit card Internet
population penetration penetration
95 % 64 % 95 %
76 % 14 % 50 %
Electrical goods: 15 %
Clothing & Footwear: 14 %
South Korea Region
Health & Beauty: 7 %
B2C e-comm. Mobile e-comm.
58 bn 61 % of total
282%
12 %
Card
11 % Cash
Payment
method Bank transfer
2%
breakdown
E-wallet
Other
73 %
Card scheme Top cross-border
34 %
breakdown markets
37 %
Visa
Mastercard USA: 48 %
AMEX
China: 15 %
Other
4%
24 % Japan: 13 %
Naver Pay
29Taiwan 10 %
e-commerce growth
Taiwan Region World
Population 23.6 m 3.6 bn 7.6 bn
Population (15+) 19.4 m 2.8 bn 5.6 bn TOP E-COMM SEGMENTS
GDP 1.3 tr 29.1 tr 85.8 tr
GDP per capita 55,244 8,165 11,299
Online population 20.7 m 1.8 bn 4.5 bn
Airlines & Hotels: 17 %
Smartphone penetration 78 % 51 % 58 %
Average online spend 1,973 2,181 2,594
E-commerce % of total retail 17 % 20 % 16 %
Electrical goods: 15 %
Banked Credit card Internet
population penetration penetration
94 % 53 % 88 %
76 % 14 % 50 %
Clothing & Footwear: 12 %
Taiwan Region Homeware & Furniture: 11 %
Food & Drink: 9 %
B2C e-comm. Mobile e-comm.
29.7 bn 45 % of total
3014 %
Card
14 % 42 % Cash
Payment
method Bank transfer
breakdown
E-wallet
Other
19 %
13 %
1%
12 %
Card scheme Top cross-border
breakdown markets
20 % Visa
Mastercard China
AMEX
67 % Japan
Other
USA
Carrier billing JKOPay Konbini Payments
31Thailand 14 %
e-commerce growth
Thailand Region World
Population 69.4 m 3.6 bn 7.6 bn
Population (15+) 57.6 m 2.8 bn 5.6 bn TOP E-COMM SEGMENTS
GDP 505 bn 29.1 tr 85.8 tr
GDP per capita 7,274 8,165 11,299
Online population 36.7 m 1.8 bn 4.5 bn
Airlines & Hotels: 21 %
Smartphone penetration 45 % 51 % 58 %
Average online spend 404 2,181 2,594
E-commerce % of total retail 2% 20 % 16 %
Electrical goods: 13 %
Banked Credit card Internet
population penetration penetration
82 % 10 % 53 %
76 % 14 % 50 %
Clothing & Footwear: 11 %
Food & Drink: 10 %
Thailand Region
Health & Beauty: 10 %
B2C e-comm. Mobile e-comm. Cross-border e-comm.
6.2 bn 53 % of total 30 % of total
3212 %
26 % 26 % Card total
Card 23 % ICS
Payment
Cash 2 % TPN
23 % method Bank transfer
breakdown
E-wallet
16 % Other 23 % E-wallet total
13 % PayPal
24 % 10 % Other
1%
1%
8%
Card scheme 1.9 bn
Cross-border
breakdown
e-commerce value
20 %
Visa
49 % shop cross-border
Mastercard
AMEX
China: 52 %
Local schemes
71 % Japan: 14 %
Other
USA: 8 %
123 PromptPay
33Vietnam 26 %
e-commerce growth
Vietnam Region World
Population 95.5 m 3.6 bn 7.6 bn
Population (15+) 73.5 m 2.8 bn 5.6 bn TOP E-COMM SEGMENTS
GDP 244.9 bn 29.1 tr 85.8 tr
GDP per capita 2,564 8,165 11,299
Online population 63.3 m 1.8 bn 4.5 bn
Airlines & Hotels: 21 %
Smartphone penetration 72 % 51 % 58 %
Average online spend 132 2,181 2,594
E-commerce % of total retail 1% 20 % 16 %
Clothing & Footwear: 11 %
Banked Credit card Internet
population penetration penetration
31 % 4% 66 %
76 % 14 % 50 %
Food & Drink: 10 %
Electrical goods: 9 %
Vietnam Region
Health & Beauty: 9 %
B2C e-comm. Mobile e-comm.
7.6 bn 53 % of total
345%
14 % 35 % Card total
Card 31 % NAPAS
35 %
Payment
Cash 4 % ICS
method Bank transfer
breakdown
E-wallet
26 %
Other
21 %
5%
4%
Top cross-border
Card scheme markets
breakdown
Visa
USA: 26 %
Mastercard
Local schemes China: 25 %
90 %
Japan: 17 %
NganLuong VTC Pay
35As one of the very first payment service providers, Computop offers its customers around the world local and innovative
omnichannel solutions for payment processing and fraud prevention. The internally developed Computop Paygate payment
platform enables seamless integrated payment processes for e-commerce, at POS and on mobile devices. Retailers and
service providers have the flexibility and freedom to choose from over 350 payment methods enabling them to specifically
tailor their payment options per country. Technologies such as biometric authentication and self-learning algorithms improve
security and convenience for retailers and consumers alike.
Computop, a global player with its head office in Germany and locations in China, England and the USA, has been servicing
large international companies in the service, retail, mobility, gaming and travel industries for more than 20 years. These com-
panies include global brands such as Amway, C&A, Fossil, the entire Otto Group, Sixt, Swarovski and Wargaming. Computop
also provides its payment system to banks and financial service providers as a white-label solution. In total, Computop
processes commercial payment transactions with a combined value of USD 36 billion annually in 127 currencies. With its
individual and secure solutions, Computop makes a major contribution to the future of international payment processing.
Sources: PPRO and Edgar, Dunn & Company
05/20 Copyright 2020 – Computop Wirtschaftsinformatik GmbH • All rights reserved
Computop has been partnering with PPRO for a number of years and many of the alternative payment methods mentioned
in this guide are provided through this partnership. PPRO provides Computop with the ability to accept locally preferred
payment methods like e-wallets, bank transfers, cash, and local cards in more than 175 countries across the globe. Through
one contract and one API.
https://www.ppro.com/almanac
For questions and inquiries about Computop’s solutions, contact a payment specialist in your area
or visit www.computop.com.
Computop GmbH Computop Inc.
T: +49 951–980-0922 T: +1–800–701-7806
sales@computop.com usa@computop.com
Computop Ltd. Computop China
T: +44 1932–895735 T: +86–21-64685053
uk@computop.com info@computop-china.cn
36You can also read