State of the Nation 2016 Kidney Health Week Chronic Kidney Disease Hot Spots - Mapping the impact of - Kidney Health Australia
←
→
Page content transcription
If your browser does not render page correctly, please read the page content below
State of the Nation
2016 Kidney Health Week
Chronic Kidney Disease Hot Spots

               Mapping the impact of
          chronic kidney disease in Australia

Prevent, Detect, Support.
Connect with us
Freecall 1800 454 363
www.kidney.org.au

The Australian Kidney Foundation
Trading as Kidney Health Australia
ABN 37 008 464 426 | Charity No. CH 0614
Contents

Foreword                                       3

Burden of end stage kidney disease             4
Incidence                                      4
Prevalence                                     4
Cause of death                                 5

Burden of chronic kidney disease               6
CKD in Aboriginal and Torres Strait Islander
peoples                                        7

Economic burden of chronic kidney disease      8
Hospitalisations                               8
Cost of treatment                              8

Chronic kidney disease hot spots               9
Hot spots for Aboriginal and Torres Strait
Islander peoples                               15

Acknowledgements                               16
Foreword
“State of the Nation: Chronic Kidney Disease in Australia” is an annual opportunity to present up to date
information to the public and to kidney stakeholders about what is happening in the kidney world. This
report highlights trends over time in the delivery of dialysis and transplantation and draws on the
remarkable and unique database known as the Australian and New Zealand Dialysis and Transplant
Registry (ANZDATA) that has maintained records of all kidney failure patients treated since these
treatments became available 50 years ago.

For the first time ever, this year the report also utilises previously unpublished data from the Australian
Health Survey 2011-13 to identify the Top 20 Australian chronic kidney disease (CKD) hot spots, based on
the proportion of the adult population within each Medicare Local catchment area with biomedical signs
of CKD.

This data draws important attention to priority areas for community and clinical CKD education and
awareness. It also enables policymakers to better target health interventions and fund the enablers for
more effective and sustainable interventions.

Several caveats surrounding this data must be considered. The data is based on Medicare Local catchment
areas, which have been superseded by Primary Health Networks. The Medicare Local data collection was
restricted to urban and rural areas in all states and territories. This impacts most on the Northern Territory
data, as 23 per cent of the population of this jurisdiction reside in Very remote areas, and research and
primary care data has documented the heaviest CKD burden in these regions. Lastly, several of the estimates
of CKD numbers and proportions have confidence intervals in the range of 25 per cent to 50 per cent, and
therefore should be interpreted with caution.

This CKD hot spot report provides a preliminary insight into the areas of greatest need for CKD education,
awareness and health services. A longer-term objective is to supplement this data with postcode-level
analyses to identify the anticipated future hot spots for CKD. This data will be used to merge the CKD hot
spot data with other chronic disease maps to create a comprehensive picture of the most commonly
experienced chronic diseases in Australia (stroke, heart disease, diabetes and CKD), as well as look at the
interaction with other socio-economic indicators.

State of the Nation is produced each year for release during Kidney Health Week. Copies are downloadable
from www.kidney.org.au.

Dr Marie Ludlow (PhD)
General Manager Health Outcomes and Evaluation
Kidney Health Australia

  3     Kidney Health Australia State of the Nation 2016
Burden of end stage kidney disease
Incidence
Latest data from the Australian and New Zealand Dialysis and Transplant Registry (ANZDATA) show that
in 2014, 2,610 people commenced kidney replacement therapy (dialysis or kidney transplant) for end stage
kidney disease. The population-based incidence of new dialysis or kidney transplant patients in Australia
each year has stabilised in the last decade (Figure 1). The pattern for Aboriginal and Torres Strait Islander1
patients has shown more fluctuation, and incidence varies markedly by remoteness. Nationally, a trend
towards stabilisation of incidence amongst Aboriginal and Torres Strait Islander people may be emerging.

             Figure 1. New kidney replacement therapy patients per million population in Australia, 2005-20141

Prevalence
The total number of people on dialysis or living with a kidney transplant continues to grow in Australia,
although the growth has slowed in recent years (Figure 2). At the end of 2014 there were 22,234 people on
dialysis or living with a transplant in Australia1.

                                                    1000
                                                     900           Dialysis
                                                     800           Transplant
                Prevalence per million population

                                                     700
                                                     600
                                                     500
                                                     400
                                                     300
                                                     200
                                                     100
                                                       0

                                                                                                  Year

                                                    Figure 2. Prevalence (per million population) of kidney replacement therapy, 1994-20141

Projections forecast the number of people on dialysis and transplantation is expected to rise by 60 per cent
between 2011 and 2020 (19,780 patients in 2011 to 31,589 in 2020), although the Australian population will
only increase by 13 per cent over this period2. The number of people whose end stage kidney disease is
caused by diabetes is projected to double between 2011 and 2020. This is fuelled by recent research showing
that globally the number of people with diabetes has nearly quadrupled since 19803.

1
  The terms Aboriginal and Torres Strait Islander and Indigenous Australians are interchangeable in this report. The term Indigenous is used with
reference and respect to Australian Aboriginal and Torres Strait Islanders.

                                                                                                   Kidney Health Australia State of the Nation 2016   4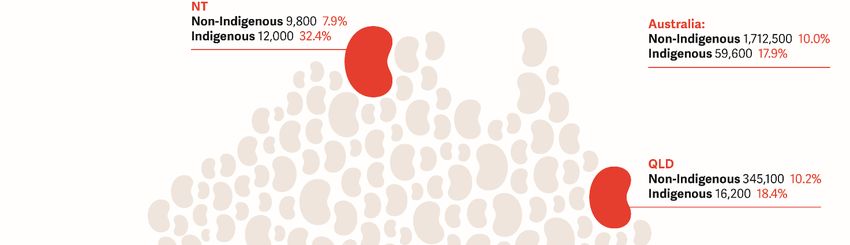
Cause of death
In 2014, a total of 22,218 people died with kidney-related diseases. This equates to 60 people dying with
kidney-related diseases every day, or one person dying every 25 minutes.4.

Kidney and urinary diseases were the fifth most common cause of death mentioned on Australian death
certificates, to which 15 per cent of deaths were attributable.

                                                    55000
                                                    50000
                                                    45000
                                                    40000
                             Number of deaths

                                                    35000
                                                    30000
                                                    25000
                                                    20000
                                                    15000
                                                    10000
                                                     5000
                                                        0

                                                                          Figure 3. Selected multiple causes of death, 20144

Someone with CKD is up to 20 times more likely to die from a heart attack or stroke than they are to
progress to end stage kidney disease requiring dialysis or transplant5.

For people who do receive a transplant or go on to dialysis, the survival rate at five years is worse than
most common cancers (Figure 9)6.

                                 100                        95
                                        90                           85
                                        80                                        75          75
                                        70
      % of 5 year survival

                                                                                                          62         60
                                        60
                                                                                                                                54
                                        50                                                                                                 46           44
                                        40

                                        30

                                        20

                                          10

                                                0
                                                       Testicular   Breast      Bladder     Kidney      Rectal     Cervical    Colon   Stage 5 CKD    Ovarian
                                                                                          Transplant                                    on dialysis
                                                                                                       Diagnosis

                                     Figure 4. Five year survival of patients aged 60 years with common cancers compared with CKD6

  5                      Kidney Health Australia State of the Nation 2016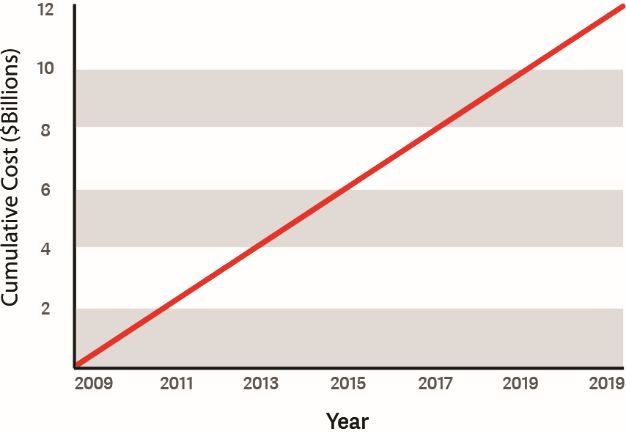
Burden of chronic kidney disease
Australian population studies have estimated that every year at least 16,000 Australian adults will develop
CKD7. The vast majority of these people will be unaware they have CKD, as it is a largely asymptomatic
condition, and identification relies on opportunistic testing in people with identified risk factors.
Over 1.7 million Australian adults (1 in 10)8 are currently living with biomedical markers of CKD such as a
reduced estimated glomerular filtration rate or protein in their urine. For Indigenous Australians, this figure
is doubled to 1 in 59 (See footnote2).
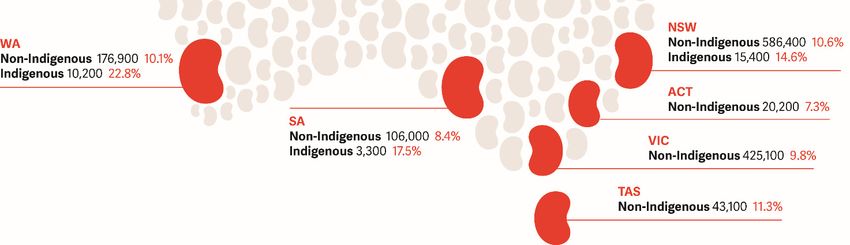
Figure 5 presents the number of adults (proportion of population) with biomedical signs of CKD. For non-
Indigenous Australians, New South Wales, Victoria and Queensland experience the highest burden of CKD
in terms of the number of people affected, and collectively these three states account for 80 per cent of the
estimated burden of people with signs of CKD.
For Indigenous Australians, Queensland and New South Wales account for over half of the estimated burden
of people with signs of CKD.
In terms of the proportion of the population with biomedical signs of CKD, for non-Indigenous Australians
Tasmania experiences the highest burden (11.3 per cent versus the national average of 10 per cent).
For Indigenous Australians, the estimated proportion of the population with signs of CKD in the Northern
Territory is almost double the national average (32.4 per cent versus 17.9 per cent).
Figure 5. Living with signs of CKD – Number of people (proportion of population)8
2
The 2011-13 Australian Health Survey recorded estimated glomerular filtration rate (eGFR) and urinary albumin creatinine ratio (ACR) in participants aged
18 years and over on a single occasion. While these results may indicate impaired kidney function, they cannot provide a diagnosis for kidney disease, as
CKD can only be confirmed if abnormal results persist for at least three months. Data is derived from a sample of approximately 25,000 private
dwellings across Australia. Very Remote areas of Australia and discrete Aboriginal and Torres Strait Islander communities (and the remainder of the
Collection Districts in which these communities were located) were excluded. These exclusions are unlikely to affect national estimates, and will only
have a minor effect on aggregate estimates produced for individual states and territories, except the Northern Territory where the population living in
Very remote areas accounts for around 23 per cent of persons. Indigenous data is derived from the concomitant National Aboriginal and Torres Strait
Islander Health Measures Survey of 3,300 Aboriginal and Torres Strait Islander adults across Australia.
Kidney Health Australia State of the Nation 2016 6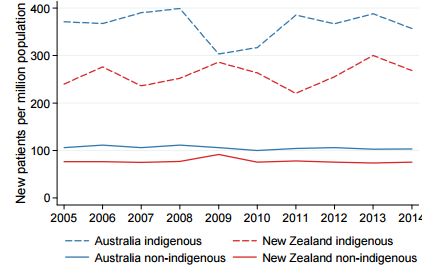
CKD in Aboriginal and Torres Strait Islander peoples
An estimated 59,600 adults of Aboriginal or Torres Strait Islander origin (1 in 5) are living with biomedical
markers of CKD9.

After taking age differences into account, Aboriginal and Torres Strait Islander people are more than twice
as likely as non-Indigenous people to have indicators of CKD. They are three times as likely as their
non-Indigenous counterparts to have indicators of Stage 1 CKD and more than four times as likely to
have Stages 4–59.

Among those Aboriginal and Torres Strait Islander people who have indicators of CKD, 11.2 per cent self-
reported having the condition. Although this rate is significantly higher than that for the non-Indigenous
population (where 6.0 per cent with indicators of chronic kidney disease self-reported having the condition),
these results still indicate that around 90 per cent Aboriginal and Torres Strait Islander people with signs
of CKD are not aware they have it.

Indigenous adults living in remote areas are more than twice as likely as those in non-remote areas to have
signs of CKD (34 per cent compared with 13 per cent)9, 10

             40
                                                                           36.7
             35

             30
                                                                27.6

             25

         %   20
                                                   17.7

             15
                      11.8
                                    10.7
                                                                                         10
             10

              5
                                                                                                        1.8
             0
                  Major cities Inner regional Outer regional   Remote   Very remote   Australian    Self-reported
                                                                                       average     kidney disease

         Figure 6. Aboriginal and Torres Strait Islander adults with signs of CKD by remoteness9, 10

  7     Kidney Health Australia State of the Nation 2016
Economic burden of chronic kidney disease
Hospitalisations
Of the 10.2 million admissions to hospitals in 2014-15, dialysis for end stage kidney disease was the most
common single reason for care (over 1.3 million admissions). Dialysis currently represents 13% of
hospitalisations in Australia. Between 2010-11 and 2014-15, admissions for dialysis increased by 3.6 per
cent on average each year11.
Aboriginal and Torres Strait Islander peoples are admitted to hospital for dialysis at 12 times the rate
for other Australians11.
Cost of treatment
People with CKD incur 85 per cent higher healthcare costs and 50 per cent higher government subsidies
than individuals without CKD. Even early stage CKD is associated with a 50 per cent increase in direct
costs, with more advanced stages associated with a sixfold increase in expenditure12.
In 2012, the total costs attributable solely to CKD were estimated at $4.1 billion, made up of $2.5 billion in
direct healthcare costs, $700 million in direct non-healthcare costs, and $900 in government subsidies12 .
Note that these costs are for pre end-stage kidney disease only, as people receiving dialysis or transplant
were excluded from these cost estimates.
In Australia, dialysis and transplantation for ESKD are estimated to cost over $1 billion each year. The
cumulative cost of treating all current and new cases of end stage kidney disease from 2009 to 2020 is
conservatively estimated to be between $11.3 billion and $12.3 billion (in 2009 dollars)13 .
Figure 7. Projected treatment costs for all new and existing kidney patients13
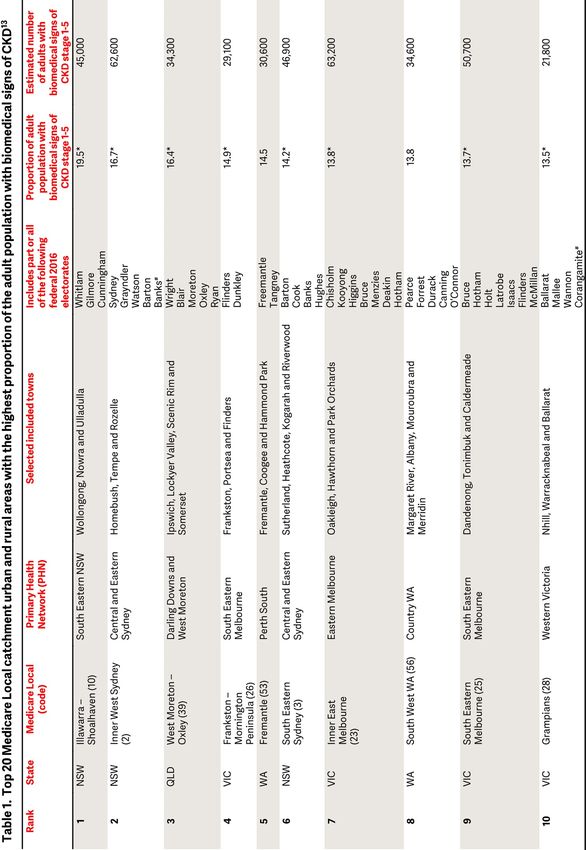
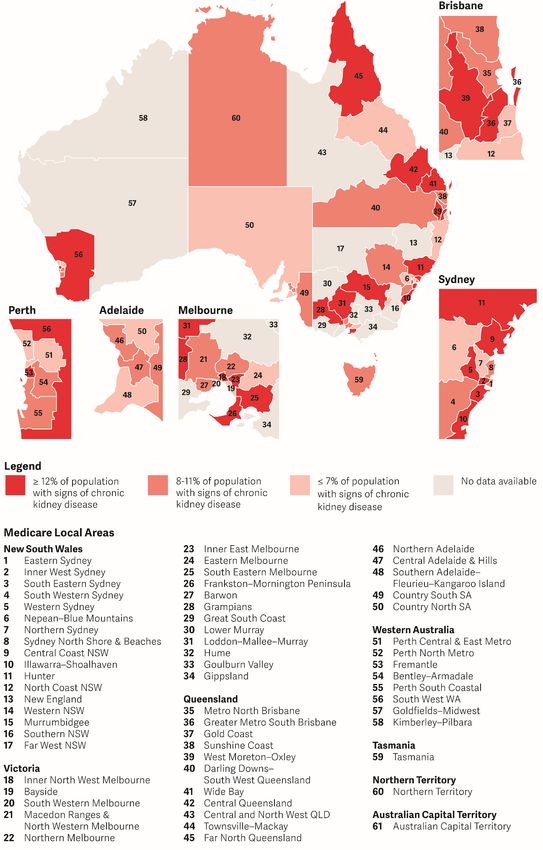
Kidney Health Australia State of the Nation 2016 8Chronic kidney disease hot spots Kidney Health Australia commissioned the Australian Bureau of Statistics to provide customised analyses of estimates and proportions of CKD stages according to Medicare Local catchment areas. Although Medicare Locals are no longer in operation, the boundary areas remain relevant for analysis of state and federal electorates, and Primary Health Network classifications. Medicare Local catchment areas also provide an opportunity to identify regions more generally, and are a basis for future work with other data that exists regarding health service delivery and chronic disease risk factors. As stated previously in this report, this Medicare Local data is derived from a sample of approximately 25,000 private dwellings across Australia. Urban and rural areas in all states and territories were included, while Very Remote areas of Australia and discrete Aboriginal and Torres Strait Islander communities (and the remainder of the Collection Districts in which these communities were located) were excluded. These exclusions are unlikely to affect national estimates, and will only have a minor effect on aggregate estimates produced for individual states and territories, with the exception of the Northern Territory. In the Northern Territory the population living in Very Remote areas accounts for around 23 per cent of persons, and research and primary care data has documented the heaviest CKD burden in these regions. Table 1 and Figure 8 present the Top 20 Medicare Locals in urban and rural areas with the highest proportion of people living with signs of CKD. All of these hot spots are associated with an estimated prevalence of CKD higher than the national average of ten per cent. These 20 hot spots account for an estimated 48 per cent of the 1.7 million Australian adults with signs of CKD. Hot spots – proportion of population affected The significant hot spots areas based on the proportion of adults with signs of CKD are the Illawarra – Shoalhaven and the Inner West Sydney areas of NSW and the West Moreton-Oxley area west of Brisbane (QLD). In the Illawarra – Shoalhaven Medicare Local, the estimated proportion of people with signs of CKD (19.5 per cent) is almost double the national average, and 45,000 individuals are potentially affected. Inner West Sydney and West Moreton-Oxley have the second and third highest proportions (16.7 and 16.4 per cent respectively) with almost 100,000 affected individuals residing in these areas. Hot spots – number of adults affected The significant hot spot areas based on the estimated number of adults with signs of CKD are in the south metropolitan area of Brisbane (QLD), the Hunter area north of Sydney (NSW) and the inner east area of Melbourne (VIC). In the Greater Metro South Brisbane Medicare Local area alone it is estimated that there are over 96,000 adults living with signs of CKD. An additional 74,500 adults with signs of CKD reside in the Hunter Medicare Local, and a further 63,200 individuals with signs of CKD are located in the Inner East Melbourne Medicare Local. The full list of 61 Medicare Local catchments by state/territory is presented in Table 2. 9 Kidney Health Australia State of the Nation 2016
Kidney Health Australia State of the Nation 2016 10
11 Kidney Health Australia State of the Nation 2016
Figure 8. Medicare Local urban and rural hot spots3
3
 Hot spots are based on the proportion of the population with signs of CKD for Australian urban and rural Medicare Local catchment areas. Data was
not available for all urban and rural Medicare Local areas due to high confidence intervals (detailed in Table 2). Note that Medicare Local catchment
areas have been superseded by Primary Health Networks (PHNs). Detailed PHN and federal electorate information is presented in Table 1.

                                                                                 Kidney Health Australia State of the Nation 2016                   12
Table 2. Proportions and estimates of the adult population with signs of CKD by Medicare Local urban
and rural catchment area9, 14
Medicare Local (code) Proportion of adult Estimated number of
population with adults with biomedical
biomedical signs of signs of CKD stage 1-5
CKD stage 1-5
AUSTRALIA TOTAL 10.0 1,712,500
AUSTRALIAN INDIGENOUS TOTAL 17.9 59,600
New South Wales Total 10.6 586,400
New South Wales Indigenous Total 14.6 15,400
Illawarra – Shoalhaven (10) 19.5* 45,000
Inner West Sydney (2) 16.7* 62,600
South Eastern Sydney (3) 14.2* 46,900
Murrumbidgee (15) 12.9* 23,900
Hunter (11) 12.1 74,500
Western Sydney (5) 12.0* 50,600
Central Coast NSW (9) 12.0* 32,700
Eastern Sydney (1) 9.7* 38,200
South Western Sydney (4) 9.0* 57,800
Western NSW (14) 8.9* 14,000
Sydney North Shore and Beaches (8) 8.0* 33,800
Northern Sydney (7) 7.0* 33,000
North Coast NSW (12) 5.9* 26,100
Nepean – Blue Mountains (6) 5.6* 11,500
New England (13) np np
Southern NSW (16) np np
Far West NSW (17) np np
Northern Territory Total** 7.9 9,800
Northern Territory Indigenous Total 32.4 12,000
Northern Territory (60) 7.9 9,800
Australian Capital Territory Total** 7.3 20,200
Australian Capital Territory (61) 7.3 20,200
Victoria Total 9.8 425,100
Frankston – Mornington Peninsula (26) 14.9* 29,100
Inner East Melbourne (23) 13.8* 63,200
South Eastern Melbourne (25) 13.7* 50,700
Grampians (28) 13.5* 21,800
Loddon – Mallee – Murray (31) 13.5* 16,500
Inner North West Melbourne (18) 12.5* 47,000
Barwon (27) 11.0* 29,100
Macedon Ranges and North Western Melbourne (21) 10.5* 28,400
Northern Melbourne (22) 8.7* 47,300
Eastern Melbourne (24) 7.0* 19,400
Bayside (19) 5.4* 27,500
South Western Melbourne (20) np np
Great South Coast (29) np np
Lower Murray (30) np np
Hume (32) np np
Goulburn Valley (33) np np
Gippsland (34) np np
South Australia Total 8.4 106,100
South Australia Indigenous Total 17.5 3,300
Country South (49) 11.4* 11,300
Central Adelaide and Hills (47) 9.2 36,900
Northern Adelaide (46) 8.0 23,600
Southern Adelaide – Fleurieu – Kangaroo Island (48) 7.7 27,800
Country North (50) 5.8* 6,500
13 Kidney Health Australia State of the Nation 2016Queensland Total 10.2 345,100
Queensland Indigenous Total 18.4 16,200
West Moreton – Oxley (39) 16.4* 34,300
Central Queensland (42) 13.0 24,100
Far North Queensland (45) 12.5* 15,700
Wide Bay (41) 12.3* 16,100
Greater Metro South Brisbane (36) 12.0 96,200
Sunshine Coast (38) 11.4 33,200
Darling Downs – South West Queensland (40) 11.4* 36,000
Metro North Brisbane (35) 8.6 59,900
Gold Coast (37) 5.7 21,500
Townsville – Mackay (44) 3.0* 8,100
Central and North West Queensland (43) np np
Western Australia Total 10.1 176,900
Western Australia Indigenous Total 22.8 10,200
Fremantle (53) 14.5 30,600
South West WA (56) 13.8 34,600
Bentley – Armadale (54) 11.4 36,400
Perth South Coastal (55) 11.2 22,300
Perth North Metro (52) 7.1* 24,300
Perth Central East Metro (51) 6.3* 23,600
Goldfields – Midwest (57) np np
Kimberley – Pilbara (58) np np
Tasmania Total** 11.3 43,100
Tasmania (59) 11.3 43,100
* Estimate has a relative standard error between 25 per cent and 50 per cent and should be used with caution
** State/territory consist of one Medicare Local
np = not suitable for publication as estimate had a relative standard error greater than 50 per cent
Kidney Health Australia State of the Nation 2016 14Hot spots for Aboriginal and Torres Strait Islander peoples
The analysis of signs of CKD for each Medicare Local catchment area was not able to be calculated
for Aboriginal and Torres Strait Islander peoples due to the high confidence intervals surrounding
the estimates.
Across Australia, rates of Indigenous adults living with signs of CKD in Very remote (37 per cent) and
Remote areas (28 per cent) are much higher than those for Indigenous adults living in Major cities (12 per
cent) or Inner regional areas (13 per cent)9.
Previous mapping exercises utilising postcode of usual residence have revealed that the incidence of end
stage kidney disease among Indigenous Australians is highest in the remote regions of Tennant Creek,
Aputula and Jabiru in the Northern Territory, Warburton and Kalgoorlie in Western Australia, and Ceduna
in South Australia15.
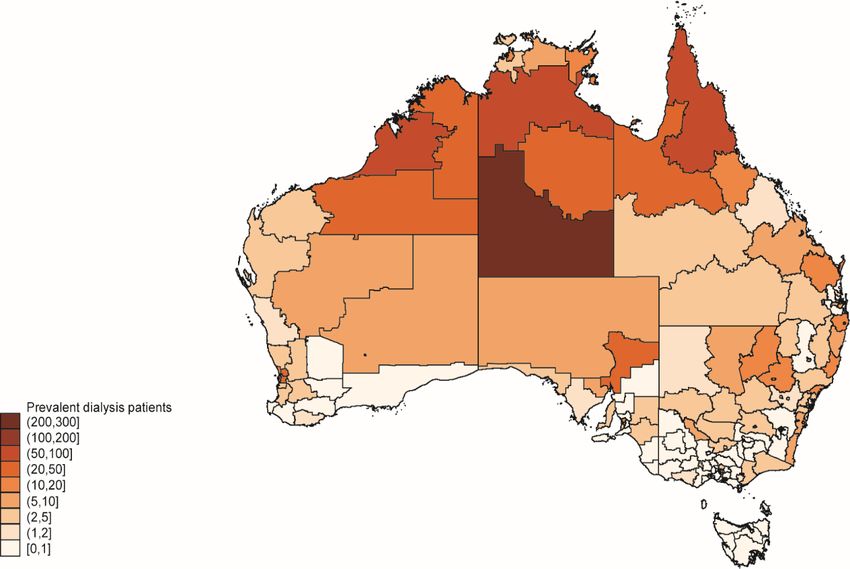
The geographical distribution of Aboriginal and Torres Strait Islander peoples receiving treatment for end
stage kidney disease is also depicted in Figure 9. This map shows the number of Aboriginal and Torres
Strait Islander peoples on dialysis in 2014, by statistical subdivision (SSD)1.
Australian SSDs are defined as socially and economically homogeneous regions characterised by identifiable
links between the inhabitants. The statistical subdivision was obtained by mapping postcodes of residence
for people when they start dialysis to SSD (some postcodes were distributed over more than one SSD).
Note that postcode of residence at the start of dialysis treatment is an imperfect indicator of the usual
place of residence. People from remote areas are often required to relocate to a major regional centre to
access dialysis services. Research has shown that 78 per cent of patients in remote areas have to relocate
to access end stage kidney disease treatment, compared with 39 per cent of those who live in rural areas
and 15 per cent of urban Indigenous end stage kidney disease patients.
Figure 9. Prevalent Aboriginal and Torres Strait Islander dialysis patients in 2014 by statistical
subdivision4
4
Image is courtesy of the ANZDATA Registry and mapping data are courtesy of the Australian Bureau of Statistics.
15 Kidney Health Australia State of the Nation 2016Acknowledgements
This report was prepared by Dr Marie Ludlow, General Manager Health Outcomes and Evaluation, Kidney
Health Australia. The assistance of Luke Toy, General Manager Advocacy and Sarah Smith, Government
Relations Advisor is gratefully acknowledged.
The Australian and New Zealand Dialysis and Transplant Registry and the Australian Bureau of Statistics
also provided assistance with the supply and interpretation of customised data.
Kidney Health Australia State of the Nation 2016 16Reference List
(1) ANZDATA Registry. The 38th Annual ANZDATA Report. Australia and New Zealand Dialysis and Transplant Registry,
Adelaide, Australia. Available at: http://www.anzdata.org.au; 2016.
(2) Australian Institute of Health and Welfare. Projections of the prevalence of treated end‐stage kidney disease in Australia
2012‐2020. Cat. no. PHE 176. Canberra: AIHW; 2014.
(3) World Health Organisation. Global report on diabetes. WHO Press, Switzerland; 2016.
(4) Australian Bureau of Statistics. Causes of Death, Australia, 2014. 2016.
(5) Keith DS, Nichols GA, Gullion CM, Brown JB, Smith DH. Longitudinal follow‐up and outcomes among a population with
chronic kidney disease in a large managed care organization. Arch Intern Med 2004 March 22;164(6):659‐63.
(6) Hutchison AJ, Smith CJ, Brenchley PEC. Pharmacology, efficacy, and safety of oral phosphate binders. Nature Reviews
Nephrology 2011;7:578‐89.
(7) Barr ELM, Magliano DJ, Zimmet PZ et al. AusDiab 2005: The Australian Diabetes, Obesity and Lifestyle Study.
International Diabetes Institute; 2006.
(8) Australian Bureau of Statistics. Australian Health Survey: Biomedical Results for Chronic Diseases, 2011‐12. ABS,
Canberra; 2013.
(9) Australian Bureau of Statistics. Australian Aboriginal and Torres Strait Islander Health Survey: Biomedical Results, 2012‐
13. 2014. Report No.: 4727.0.55.003, Canberra.
(10) Australian Institute of Health and Welfare. Cardiovascular disease, diabetes and chronic kidney disease‐Australian facts:
Aboriginal and Torres Strait Islander people. Cardiovascular, diabetes and chronic kidney disease series no. 5. Cat. no.
CDK 5. Canberra: AIHW.; 2015.
(11) Australian Institute of Health and Welfare. Admitted patient care 2014‐15: Australian hospital statistics. Health services
series no. 68. Cat. no. HSE 172. Canberra: AIHW.; 2016.
(12) Wyld MLR, Lee CMY, Zhuo X et al. Cost to government and society of chronic kidney disease stage 1‐5: a national cohort
study. Int Med J 2015;45(7):741‐7.
(13) Cass A, Chadban S, Gallagher M et al. The economic impact of end‐stage kidney disease in Australia: Projections to 2020.
Kidney Health Australia, Melbourne, Australia; 2010.
(14) ABS. Customised report. 2015.
(15) Cass A, Cunningham J, Wang Z, Hoy W. Regional variation in the incidence of end‐stage renal disease in Indigenous
Australians. Medical Journal of Australia 2001 July 2;175(1):24‐7.
17 Kidney Health Australia State of the Nation 2016Connect with us Freecall 1800 454 363 www.kidney.org.au The Australian Kidney Foundation Trading as Kidney Health Australia ABN 37 008 464 426 | Charity No. CH 0614
You can also read