COVID-19 Pandemic Putting South Africa into global perspective - (As on 15 April 2020)
←
→
Page content transcription
If your browser does not render page correctly, please read the page content below

COVID-19 Pandemic
 Putting South Africa into
    global perspective
       (As on 15 April 2020)

    Prof Bärbel B Haldenwang
Introduction
This analysis is an example of one of the services that the
IFR offers; clients commission us to scan emerging trends,
change drivers in an industry, or an issue of concern and
compile it into a document, hoping to assist decision-makers
in their sense-making efforts.
Professor Haldenwang has a long, valued relationship with
the IFR; we thank her for this meticulous piece of work.

                          ©BB Haldenwang, IFR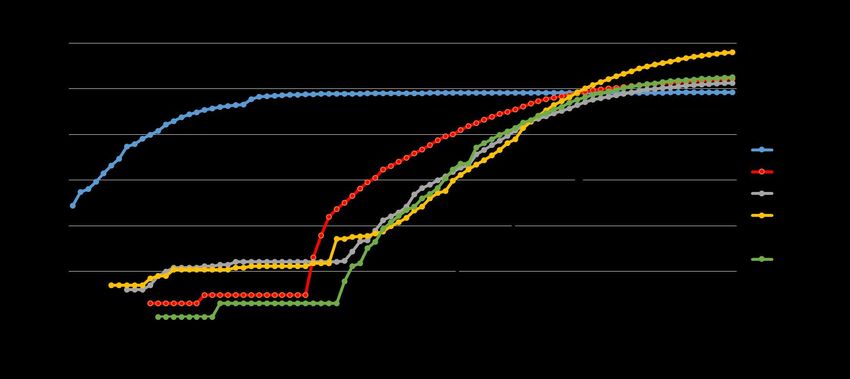
Outline
• Worldwide Covid-19 pandemic situation as on 15 Apr 2020
• South Africa:
   • How many people die annually? What is the age distribution of deaths?
   • Which are the leading causes of death? How does influenza/pneumonia fit into the
     picture?
   • When was the first Covid-19 case reported? Where do we stand now?
• How does the Covid-19 epidemic in South Africa compare to those in severely hit
  countries?
   •   Covid-19 epidemic in China as on 15 Apr 2020
   •   Covid-19 epidemic in Italy as on 15 Apr 2020
   •   Covid-19 epidemic in Germany as on 15 Apr 2020
   •   Covid-19 epidemic in Spain as on 15 Apr 2020
   •   Covid-19 epidemic in the USA as on 15 Apr 2020
• What would happen to the Covid-19 epidemic in South Africa under various
  doubling time estimates?
• Which are the critical areas in South Africa?
• Conclusion
         ©BB Haldenwang, IFR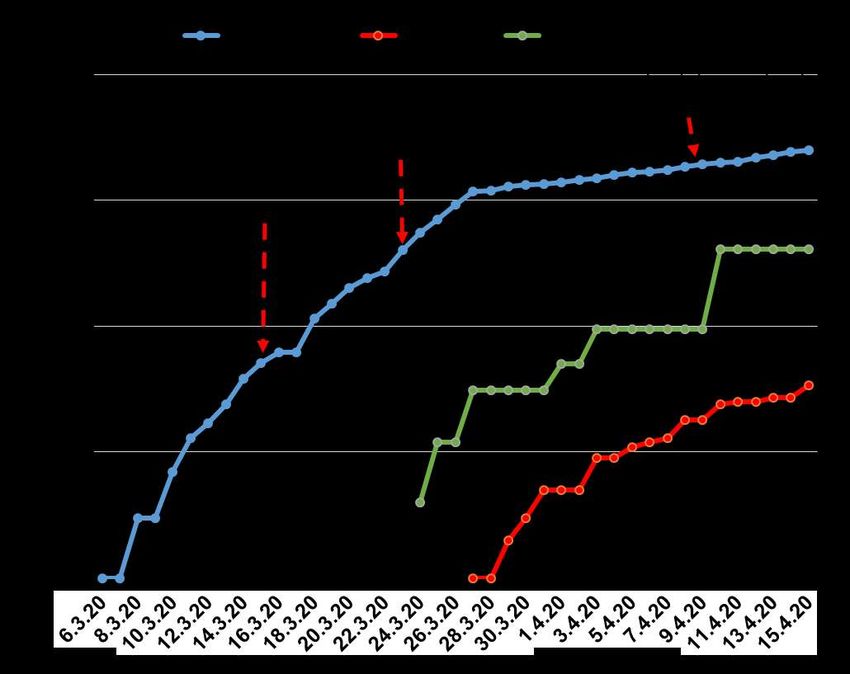
Covid-19 pandemic in the world
                                     Number of deaths as on 15 April 2020: 137 193

Source: Compiled from Johns Hopkins Coronavirus Resource Centre, 2020.               ©BB Haldenwang, IFR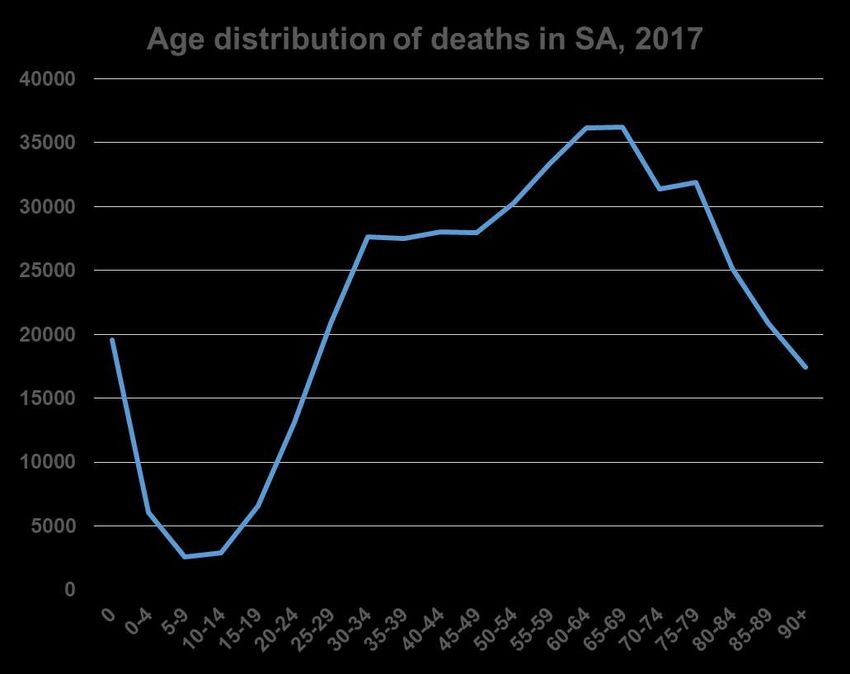
World Covid-19
        pandemic situation
        as on 15 April 2020
 •   First Covid-19 case detected: 31 Dec 2019
 •   Cumulative number of infected people:
     2.07m
 •   Covid-19 infection rate: 0.266 per 1000
     population
 •   Total number of deaths: 137 193
 •   Covid-19 crude death rate: 0.018 deaths per
     1000 population
 •   Influenza/pneumonia death rate: not
     available
 •   Overall crude death rate: 7.5 deaths per
     1000 population
 •   Number of people recovered from Covid-19:
     517 931

Sources: Compiled from Johns Hopkins Coronavirus Resource Centre, 2020; TradingView, 2020; UN, 2019 (World Population Prospects, 2019
Revision); Worldometer, 2020.                                                                                           ©BB Haldenwang, IFR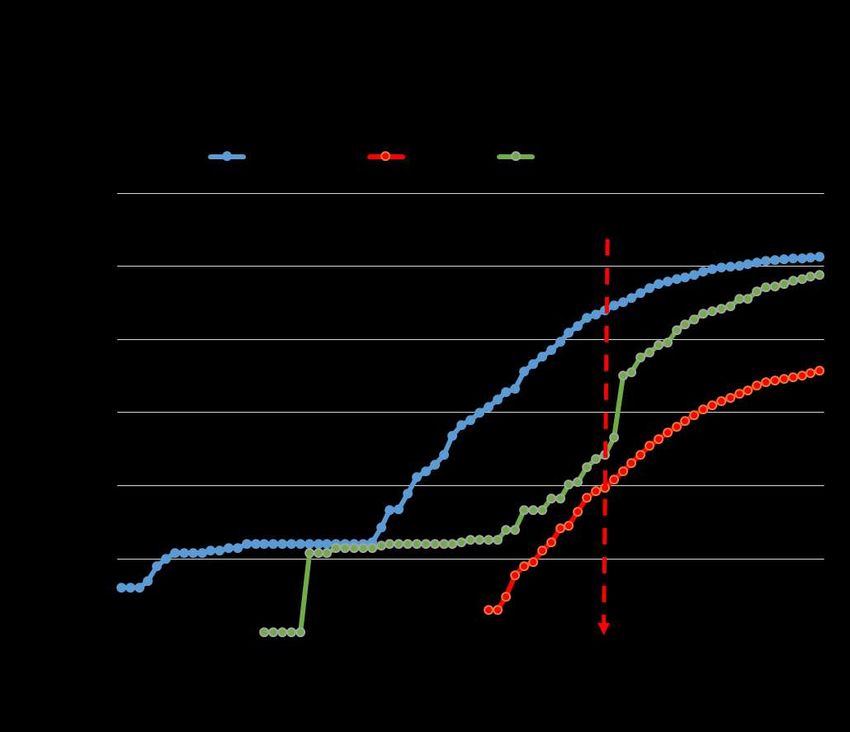
How many people die annually
     in South Africa?
 What is the age distribution of
            deaths?
(Please note that the most recently available data on causes of death is for 2017, published in March 2020)

      ©BB Haldenwang, IFR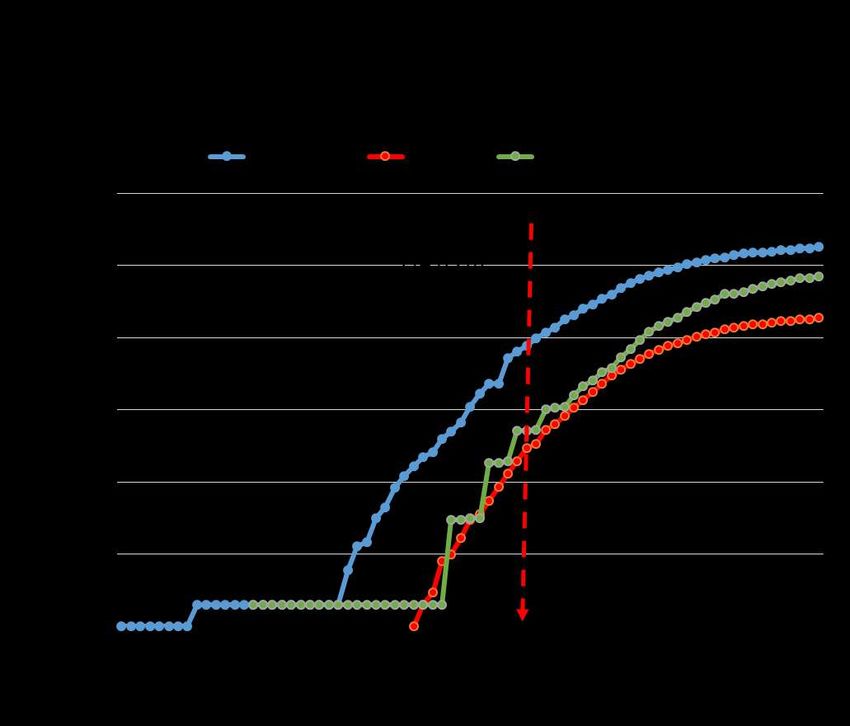
Total number of deaths in
           SA (2017)
            446 544

  0-19 year-olds: 37 689 (8.4% of all deaths)
  20-64 year-olds: 244 749 (55% of all deaths)
  65+ year-olds: 162 764 (36.6% of all deaths)

Source: Compiled from StatsSA, 2020. Mortality and cause of death in South Africa, 2017.   ©BB Haldenwang, IFR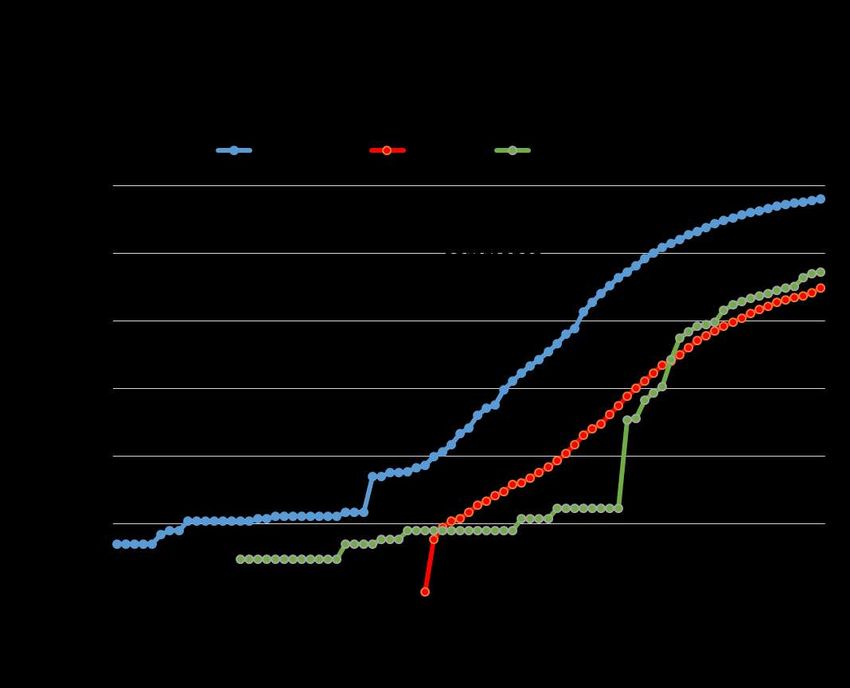
Which are the leading causes of
    death in South Africa?

How does influenza/pneumonia
     fit into the picture?
             ©BB Haldenwang, IFR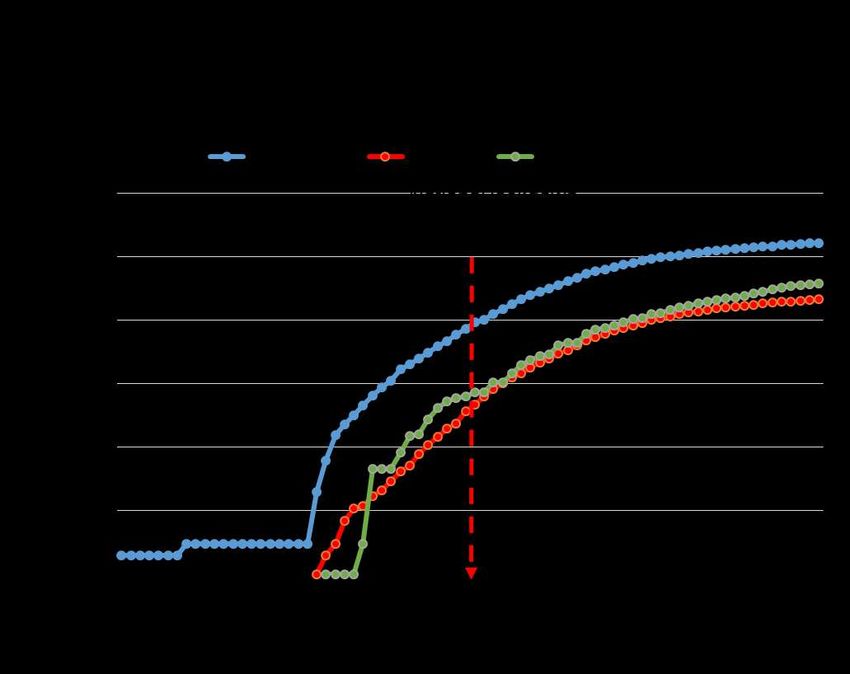
10 Leading underlying causes of death in SA, 2017

• TB, diabetes and                                           Rank       Cause of death              Number      % of total
  cerebrovascular diseases                                       1      TB                          28 675           6.4
  are the leading causes of                                      2      Diabetes                    25 336           5.7
  death, responsible for 17.1%
  of all deaths                                                  3      Cerebrovascular diseases    22 259           5.0
                                                                 4      Other heart diseases        22 098           4.9
• Influenza/pneumonia is in 7th
  position, resulting in                                         5      HIV                         21 439           4.8
  approximately 19 000 deaths                                    6      Hypertensive diseases       19 900           4.5
  per annum (or 52 per day),                                     7      Influenza/pneumonia         18 837           4.2
  constituting about 4.2% of all
                                                                 8      Chronic lower respiratory   13 167           2.9
  deaths in the country                                                 diseases
• Influenza/pneumonia death                                      9      Ischaemic heart diseases    12 766           2.9
  rate is 0.32 deaths per 1000                                  10      Other viral diseases        12 622           2.8
  population

Source: Compiled from StatsSA, 2020. Mortality and cause of death in South Africa, 2017.                     ©BB Haldenwang, IFR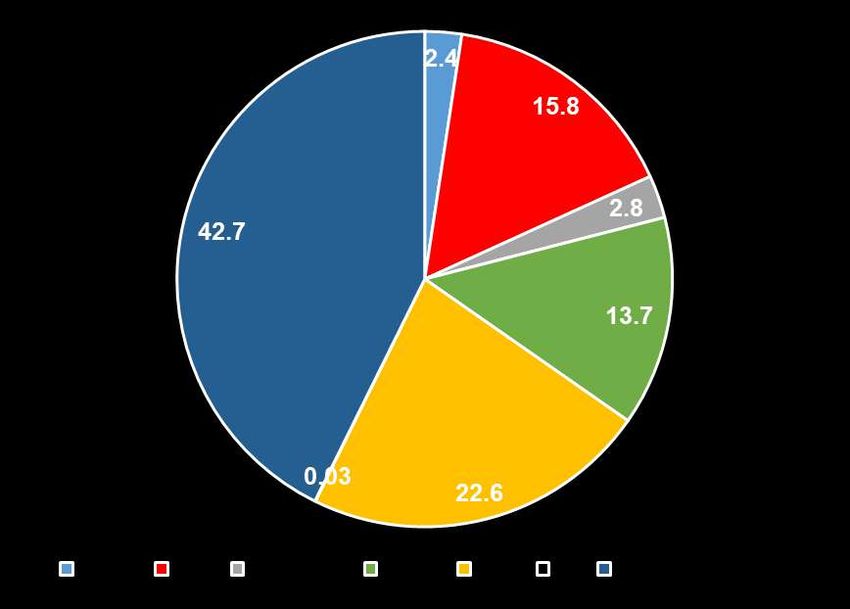
• In SA influenza/pneumonia is
  the leading cause of death
  among children aged 1-14
  years and the 2nd leading                                       Ranking of influenza/pneumonia as cause of death
                                                                                  in SA by age, 2017
  cause of death among babies
  younger than 1 year, whilst                                        Age              Rank     Number   % of all causes
  among those aged 45-64 and                                        0                      2   1 5518         7.8
  the elderly aged 65+ it is only                                   1-14                   1     817          7.1
  the 7th leading cause of deaths                                   14-44                  4    4 645         3.8
• Amongst the elderly in SA,                                        45-64                  7    4 893         3.8
  diabetes, cerebrovascular                                         65+                    7    6 894         4.2
  diseases and hypertensive
  diseases are the 3 leading
  causes of death

Source: Compiled from StatsSA, 2020. Mortality and cause of death in South Africa, 2017.                    ©BB Haldenwang, IFR
When was the first Covid-19
case in SA reported?
Where do we stand now?
©BB Haldenwang, IFR• The first case of Covid-19 in SA was reported on 6 March 2020 • Since then the number of daily confirmed cases of Covid-19 increased steadily, reaching a peak of 243 cases reported on 27 March 2020 • Pres Ramaphosa announced the 21 day lockdown on 23 March, just before a relatively sharp increase in confirmed Covid-19 cases • Since lockdown started on 27 March the daily number of confirmed cases has declined significantly and fluctuated at a relatively low level (
Average number of
     Covid-19 cases per
           week
 • Prior to the national lockdown, the
   average number of new
   confirmed Covid-19 cases per
   week increased rapidly from 2 to
   111
 • Since the lockdown, the average
   number of new cases per week
   has declined to 67
 • The average for the last 6 days is
   95
 • The average for the next couple
   of weeks will give an indication of
   whether the infection curve is
   turning upwards towards an
   exponential growth in new cases
                                                                           ©BB Haldenwang, IFR
Source: Calculated from Johns Hopkins Coronavirus Resource Centre, 2020.
• On a cumulative basis, the number
Number of deaths as on 15 April 2020: 34
of confirmed Covid-19 cases in SA
has increased to 2 506 as on 15
April 2020
• Does the lockdown have an impact
on the number of confirmed Covid-
19 cases?
• YES, the number of confirmed
cases has declined and stabilized
at a significantly lower level than
prior to lockdown
• Is the infection curve flattening at
the top?
• YES, it is flattening, but the next
couple of weeks will give an
indication of whether the infection
curve will remain flat or increase
exponentially as generally
expected by epidemiologists
Source: Compiled from Johns Hopkins Coronavirus Resource Centre, 2020. ©BB Haldenwang, IFRSouth Africa Covid-19 Cumulative number of confirmed Covid-19 cases,
deaths and recoveries in SA
epidemic situation as (log scale on vertical axis)
on 15 April 2020
• First Covid-19 case detected: 6 Mar 2020
• Cumulative number of infected people:
2 506 (0.12% of world infected total vs 0.8% of world
population)
• Covid-19 infection rate: 0.042 per 1000 population
• Total number of deaths: 34 (0.025% of world total)
• Covid-19 crude death rate: 0.0006 deaths per 1000
population
• Influenza/pneumonia death rate: 0.320 per 1000
population
• Overall crude death rate (all causes): 9.5 deaths per
1000 population
• Number of people recovered from Covid-19: 410
(0.08% of world total)
• Number of tests done: 90 515 or 1 526 per 1m
population
Sources: Compiled from Johns Hopkins Coronavirus Resource Centre, 2020; TradingView, 2020; UN, 2019 (World Population Prospects, 2019
Revision); WHO, 2018 Mortality Database; Worldometer, 2020. ©BB Haldenwang, IFRHow does the Covid-19 epidemic
in South Africa compare to those
in severely hit countries such as
China, Italy, Germany, Spain and
the USA?
©BB Haldenwang, IFRCovid-19 epidemic in China
Number of deaths as on 15 April 2020: 3 346
Source: Compiled from Johns Hopkins Coronavirus Resource Centre, 2020. ©BB Haldenwang, IFRChina Covid-19
epidemic situation
as on 15 April 2020
• First Covid-19 case detected: 31 Dec 2019
• Cumulative number of infected people:
83 402 (4.0% of world infected total vs 18% of
world population)
• Covid-19 infection rate: 0.058 per 1000 population
• Total number of deaths: 3 346 (2.4% of world
total)
• Covid-19 crude death rate: 0.002 deaths per 1000
population
• Influenza/pneumonia death rate: not available
• Overall crude death rate: 7.1 deaths per 1000
population
• Number of people recovered from Covid-19:
78 374 (15.1% of world total)
• Number of tests done: not available
Sources: Compiled from Johns Hopkins Coronavirus Resource Centre, 2020; TradingView, 2020; UN, 2019 (World Population Prospects, 2019
Revision); WHO, 2018 Mortality Database; Worldometer, 2020. ©BB Haldenwang, IFRCovid-19 epidemic in Italy
Number of deaths as on 15 April 2020: 21 645
Source: Compiled from Johns Hopkins Coronavirus Resource Centre, 2020. ©BB Haldenwang, IFRItaly Covid-19
epidemic situation
as on 15 April 2020
• First Covid-19 case detected: 31 Jan 2020
• Cumulative number of infected people: 165 155
(8.0% of world infected total vs 0.8% of world
population)
• Covid-19 infection rate: 2.732 per 1000 population
• Total number of deaths: 21 645 (15.8% of world total)
• Covid-19 crude death rate: 0.358 deaths per 1000
population
• Influenza/pneumonia death rate: 0.201 per 1000
population
• Overall crude death rate: 10.5 deaths per 1000
population
• Number of people recovered from Covid-19:
38 092 (7.4% of world total)
• Number of tests done: 1 117 404 or 18 481 per 1m
population
Sources: Compiled from Johns Hopkins Coronavirus Resource Centre, 2020; TradingView, 2020; UN, 2019 (World Population Prospects, 2019
Revision); WHO, 2018 Mortality Database; Worldometer, 2020. ©BB Haldenwang, IFRCovid-19 epidemic in Germany
Number of deaths as on 15 April 2020: 3 804
Source: Compiled from Johns Hopkins Coronavirus Resource Centre, 2020. ©BB Haldenwang, IFRGermany Covid-19
epidemic situation
as on 15 April 2020
• First Covid-19 case detected: 28 Jan 2020
National social
• Cumulative number of infected people: distancing
134 753 (6.5% of world infected total vs 1.1% of measures
world population) commence
(22.3.20)
• Covid-19 infection rate: 1.608 per 1000 population
• Total number of deaths: 3 804 (2.8% of world total)
• Covid-19 crude death rate: 0.045 deaths per 1000
population
• Influenza/pneumonia death rate: 0.254 per 1000
population
• Overall crude death rate: 11.2 deaths per 1000
population
• Number of people recovered from Covid-19: 77 000
(14.9% of world total)
• Number of tests done: 1 728 357 or 20 629 per 1m
population
Sources: Compiled from Johns Hopkins Coronavirus Resource Centre, 2020; TradingView, 2020; UN, 2019 (World Population Prospects, 2019
Revision); WHO, 2018 Mortality Database, Worldometer, 2020. ©BB Haldenwang, IFRCovid-19 epidemic in Spain
Number of deaths as on 15 April 2020: 18 812
Source: Compiled from Johns Hopkins Coronavirus Resource Centre, 2020.Spain Covid-19
epidemic situation
as on 15 April 2020
• First Covid-19 case detected: 1 Feb 2020
• Cumulative number of infected people:
180 659 (8.7% of world infected total vs 0.6% of
world population)
• Covid-19 infection rate: 3.864 per 1000 population
• Total number of deaths: 18 812 (13.7% of world
total)
• Covid-19 crude death rate: 0.402 deaths per 1000
population
• Influenza/pneumonia death rate: 0.229 per 1000
population
• Overall crude death rate: 9.0 deaths per 1000
population
• Number of people recovered from Covid-19: 70 853
(13.7% of world total)
• Number of tests done: 650 755 or 13 918 per 1m
population
Sources: Compiled from Johns Hopkins Coronavirus Resource Centre, 2020; TradingView, 2020; UN, 2019 (World Population Prospects, 2019
Revision); WHO, 2018 Mortality Database; Worldometer, 2020.Covid-19 epidemic in the USA
Number of deaths as on 15 April 2020: 30 985
Source: Compiled from Johns Hopkins Coronavirus Resource Centre, 2020.USA Covid-19
epidemic situation as
on 15 April 2020
• First Covid-19 case detected: 22 Jan 2020
• Cumulative number of infected people: 639 664
(30.9% of world infected total vs 4.2% of world
population)
• Covid-19 infection rate: 1.933 per 1000
population
• Total number of deaths: 30 985 (22.6% of world
total)
• Covid-19 crude death rate: 0.094 deaths per
1000 population
• Influenza/pneumonia death rate: 0.178 per 1000
population
• Overall crude death rate: 8.7 deaths per 1000
population
• Number of people recovered from Covid-19:
52 738 (10.2% of world total)
• Number of tests done: 3 258 879 or 9 845 per
1m population
Sources: Compiled from Johns Hopkins Coronavirus Resource Centre, 2020; TradingView, 2020; UN, 2019 (World Population Prospects, 2019
Revision); WHO, 2018 Mortality Database; Worldometer, 2020.Covid-19 pandemic indicators: Comparison between China, Italy, Germany, Spain, the USA and South Africa (15 Apr 2020) Covid-19 indicator South Africa China Italy Germany Spain USA World No of infections 2 506 83 402 165 155 134 753 180 659 639 664 2 069 819 % of all Covid-19 infections 0.12 4.0 8.0 6.5 8.7 30.9 Infection rate (per 1000 0.042 0.058 2.732 1.608 3.864 1.933 0.266 population) No deaths 34 3 346 21 645 3 804 18 812 30 985 137 193 % of all Covid-19 deaths 0.03 2.4 15.8 2.8 13.7 22.6 Covid-19 death rate (per 0.0006 0.002 0.358 0.045 0.402 0.094 0.018 1000 population Case fatality rate (deaths 1.4 4.0 13.1 2.8 10.4 4.8 6.6 per 100 infections) Number recovered 410 78 374 38 092 77 000 70 853 52 738 517 931 % of all recovered 0.08 15.1 7.4 14.9 13.7 10.2 Number of tests done 90 515 n/a 1 117 404 1 728 357 650 755 3 258 879 n/a Tests per 1m population 1 526 n/a 18 481 20 629 13 918 9 845 n/a Sources: Compiled from Johns Hopkins Coronavirus Resource Centre, 2020; TradingView, 2020; UN, 2019 (World Population Prospects, 2019 Revision); WHO, 2018 Mortality Database; Worldometer, 2020.
Cumulative number of confirmed Covid-19 cases
       for various countries

                             •   Initially, China dominated the Covid-19 pandemic with
                                 almost no infections in other countries
                             •   Since early March infections started spreading around
                                 the globe
                             •   Now, the USA has the largest number of infections,
                                 followed by Spain, Italy, Germany, France and the UK,
                                 with China in 7th position
                             •   About 41.7% of Covid-19 infections are found in other
                                 countries

Source: Compiled from Johns Hopkins Coronavirus Resource Centre, 2020.
% distribution of confirmed Covid-19 % distribution of confirmed Covid-
infections for various countries, 19 deaths for various countries,
15 Apr 2020 15 Apr 2020
Source: Compiled from Johns Hopkins Coronavirus Resource Centre, 2020.Covid-19 pandemic development: Comparison between
China, Italy, Germany, Spain, the USA and South Africa
Source: Compiled from Johns Hopkins Coronavirus Resource Centre, 2020.Doubling times of Covid-19 infections in China,
Italy, Germany, Spain, USA and South Africa
Source: Own calculations based on data from Johns Hopkins Coronavirus Resource Centre, 2020.Doubling times of Covid-19 infections in China, Italy, Germany,
Spain, USA and South Africa
• For the infection curve to flatten at the top, the doubling time in infections has to increase or lengthen in days
• In China the infection doubling time has increased from 2 to 9 days and then to 21 days (Slide 29), resulting in
the infection curve to flatten since mid-Feb (Slide 28). Currently, the doubling time is 65 days
• In Italy the infection doubling time hovered between 1 and 3 days until early Mar after which it slowly increased
from 4 to 18 days (Slide 29), resulting in a slight flattening of the infection curve during the past week (Slide
28)
• In Germany the infection doubling time fluctuated between 1 and 3 days until mid-Fed, followed by a steady
lengthening in the doubling time to a current 16 days (Slide 29), with the infection curve flattening (Slide 28)
• In the USA the doubling time in the early phase of the pandemic was rather long, followed by a decline to 2
days in early Mar. Since then the infection doubling time has fluctuated between 2 and 4 days for about 3
weeks. It is only since the end of Mar that the doubling time started lengthening to the current 11 days (Slide
29), with no indication yet of a flattening of the curve (Slide 28)
• In Spain the infection doubling time was fluctuating between 1 and 2 days until 12 Mar, after which it increased
to 4 days. Since the end of Mar the doubling time started increasing to the current 15 days (Slide 29), with the
infection curve flattening slightly (Slide 28)
• In SA the infection doubling time hovered between 1 and 3 days until 24 Mar, followed by a strong increase to
the current 17 days (Slide 29), resulting in a flattening of the curve since 27 Mar, the day that lockdown started
(Slide 28)
Source: Own calculations based on data from Johns Hopkins Coronavirus Resource Centre, 2020.What could happen to the
Covid-19 epidemic in South Africa
under various doubling times?
©BB Haldenwang, IFRVarious Covid-19 doubling time estimates
• Although SA still has a relatively small
number of confirmed Covid-19 infections, and
although the infection curve seems to be
flattening, it needs to be remembered that the
number and percentage of people tested for
the virus are still very low and the epidemic
has not yet spread widely into the community
• Should the doubling time remain at the
current 17 days, 5 900 would be infected by 5
May 2020, ie, shortly after the lockdown
• BUT what if the doubling time would decline
to 10, 5 or 3 days as more people are being
tested and the epidemic spreads to the
community?
• At a 10 day doubling time, 10 000 would be
infected by 5 May 2020
• At a 5 day doubling time, 40 100 would be
infected by 5 May 2020
• At a 3 day doubling time, 267 300 would be
infected by 5 May 2020
• It is therefore of the utmost importance that
the doubling time remains high to prevent an
exponential growth in new cases
Source: Own calculations. ©BB Haldenwang, IFRBUT is it possible to keep the doubling time high, therefore avoiding an exponential growth in Covid-19 cases? According to Prof Salim S Abdool Karim, Chair of the Ministerial Advisory Group on Covid-19: ‘No! Not unless SA has a special protective factor not present anywhere else in the world’ The most likely scenario is a delayed exponential curve after lockdown Source: Dept of Health, 2020.
Which are the critical areas
     in South Africa?

           ©BB Haldenwang, IFR
Number of Covid-19 cases and deaths per province,
• Gauteng, the Western Cape and 15.4.2020
KwaZulu-Natal have the largest Provence Covid-19 cases Covid-19 deaths
numbers of Covid-19 cases and Number % Number %
deaths
Eastern Cape 199 8.0 0 0.0
• More than 1 in every 3 cases
are in Gauteng, while more than Free State 97 3.9 3 8.8
50% of deaths occurred in Gauteng 930 37.1 5 14.7
KwaZulu-Natal
KwaZulu-Natal 519 20.7 18 53.0
• The greater Johannesburg, Limpopo 25 1.0 0 0.0
Cape Town and Ekurhuleni
metropolitan areas with high Mpumalanga 22 0.9 0 0.0
population densities especially North West 23 0.9 0 0.0
in informal settlements where
poverty levels, TB and HIV Northern Cape 16 0.6 0 0.0
prevalence are high, are most at Western Cape 657 26.2 8 23.5
risk of rapid community Unknown 18 0.7 0 0.0
transmissions
South Africa 2 506 100.0 34 100.0
Source: National Institute for Communicable Diseases, 2020.Conclusion
• Worldwide about 2.1m people have been infected with Covid-19,
about 137 000 people have died and 0.52m have recovered
• The worst affected countries are the USA, Spain, Italy, Germany,
France, the UK and China
• In South Africa the initial rapid increase in Covid-19 cases slowed
down significantly after the national lockdown commenced on 27
Mar 2020
• The infection curve has flattened (plateaued) since lockdown and
did not follow the expected exponential curve
• The epidemic trajectory in South Africa is ‘unique’ and very
different from other countries
©BB Haldenwang, IFRConclusion (continued)
• Why is the Covid-19 epidemic curve in South Africa different compared to
those in other infected countries (eg, USA, Italy, Germany, Spain and
China)?
• Why are new cases declining to a plateau or why is the infection curve
flattening?
• In this regard, three questions can be asked (according to Prof Karim):
• Are we missing cases due to low or declining testing coverage? Covid-19
cases have declined during the past weeks, while testing has increased (both
among people with and without medical aid)
• Are there missing cases in poor communities due to skewed higher private lab
testing?
• Is the reduction genuine and due to the interventions in SA’s Covid-19
response?
©BB Haldenwang, IFRConclusion (cont) • At this stage of the epidemic, it is almost certain that Government’s responses have slowed the spread of Covid-19, ‘the infections curve has been impacted and the country has gained some time in the fight against the epidemic’ (Prof Karim) • BUT the infections will rise again after lockdown because nobody is immune to the novel coronavirus and no vaccine is yet available • According to the WHO, the virus spreads fast and is 10 times more deadly than swine flu (H1N1), which caused a global pandemic in 2009 • The national lockdown will have to be lifted within the next couple of weeks, but control measures and restrictions will have to be lifted slowly • The WHO states that ‘control measures can only be lifted if the right public health measures are in place, including significant capacity for contact tracing’ • ‘Ultimately, the development and delivery of a safe and effective vaccine will be needed to fully interrupt transmission’ (WHO, 2020)
References

Dept of Health, 2020. SA’s Covid-19 epidemic: Trends & next steps. https://www.sabc.co.za/sabc/sas-
covid-19-epidemic-trends-and-next-steps/

Johns Hopkins Coronavirus Resource Centre. Online database, 2020.
https://coronavirus.jhu.edu/map.html

National Institute for Communicable Diseases, 2020. https://www.nicd.ac.za/

StatsSA, 2020. Mortality and cause of death in South Africa, 2017. Pretoria: StatsSA.

TradingView. 2020. Coronavirus (Covid-19) charts and stats. https://www.tradingview.com/covid19/

UN, 2019. World Population Prospects, 2019 Revision. https://population.un.org/wpp/DataQuery/

WHO, 2018. Online Mortality Database. https://apps.who.int/healthinfo/statistics/mortality/whodpms/

WHO, 2020. WHO says Covid-19 is 10 times more deadly than swine flu.
https://www.france24.com/en/20200413-who-says-covid-19-is-10-times-more-deadly-than-swine-flu

Worldometer. Online database, 2020. https://www.worldometers.info/coronavirus/
Contact for
further enquiries

   Doris Viljoen
   Senior Futurist
   doris@ifr.sun.ac.za
You can also read


