Estimates and Projections - Population Estimates and Australian Infrastructure Audit Background Paper April 2015 - Ministers for ...
←
→
Page content transcription
If your browser does not render page correctly, please read the page content below
Population
Population
   Estimates and
   Projections
Estimates
and     Australian Infrastructure
        Audit Background Paper
Projections
        April 2015

Australian Infrastructure Audit
Background Paper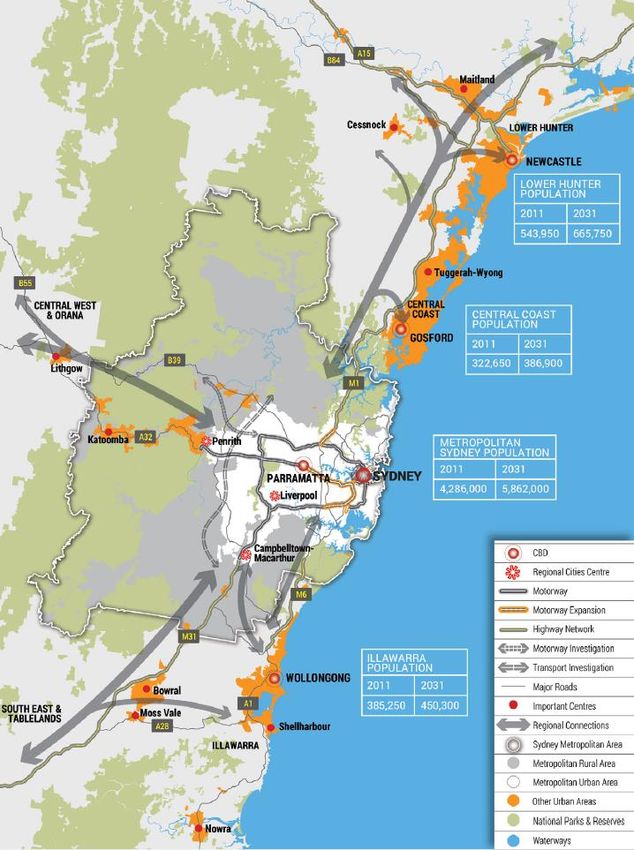
2   Population Estimates and Projections Australian Infrastructure Audit Background Paper

                                Infrastructure Australia is an independent statutory body that is the key source of research and advice
                                for governments, industry and the community on nationally significant infrastructure needs.

                                It leads reform on key issues including means of financing, delivering and operating infrastructure and
                                how to better plan and utilise infrastructure networks.

                                Infrastructure Australia has responsibility to strategically audit Australia’s nationally significant
                                infrastructure, and develop 15 year rolling infrastructure plans that specify national and state level
                                priorities.

                                Online
                                ISBN 978-1-925352-06-1

                                Ownership of intellectual property rights in this publication
                                Unless otherwise noted, copyright (and any other intellectual property rights, if any) in this
                                publication is owned by the Commonwealth of Australia (referred to below as Infrastructure
                                Australia).
                                © Infrastructure Australia 2015

                                Disclaimer
                                The material contained in this publication is made available on the understanding that the
                                Commonwealth is not providing professional advice, and that users exercise their own skill and care
                                with respect to its use, and seek independent advice if necessary.

                                The Commonwealth makes no representations or warranties as to the contents or accuracy of the
                                information contained in this publication. To the extent permitted by law, the Commonwealth
                                disclaims liability to any person or organisation in respect of anything done, or mitted to be done, in
                                reliance upon information contained in this publication.

                                Creative Commons licence
                                With the exception of the Coat of Arms, the copyright in this publication is licenced under a Creative
                                Commons Attribution 3.0 Australia Licence.

                                Creative Commons Attribution 3.0 Australia Licence is a standard form licence agreement that allows
                                you to copy, communicate and adapt this publication provided that you attribute the work to the
                                Commonwealth and abide by the other licence terms.

                                A summary of the licence terms are available from
                                http://creativecommons.org/licenses/by/3.0/au/deed.en.

                                The full licence terms are available from http://creativecommons.org/licenses/by/3.0/au/legalcode

                                This publication should be attributed in the following way: © Infrastructure Australia 2015

                                Acknowledgments
                                Northern Territory Planning Commission – high resolution image for Figure 23
                                Victorian Department of Transport, Planning and Local Infrastructure - high resolution image for
                                Figure 18
                                Western Australian Department of Planning – high resolution image for Figure 21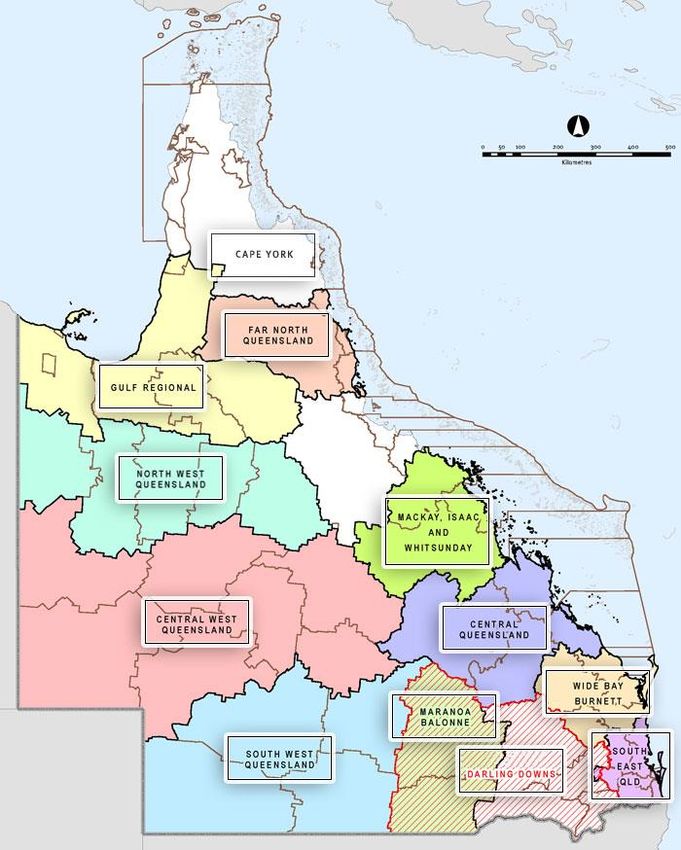
Population Estimates and Projections Australian Infrastructure Audit Background Paper   3

Contents
Executive Summary                                                                                              6
1 Introduction                                                                                                10
   1.1 Scope of this Paper                                                                                    11
   1.2 Comment on the Projections and Implications for the Audit                                              12
   1.3 Structure of the Paper                                                                                 13
2 Australia’s Present Population                                                                              14
   2.1 Historic and Recent Growth                                                                             15
   2.2 Drivers of Past Population Growth                                                                      16
3 Performance of Previous Population Projections                                                              19
4 Projections of Australia’s Population                                                                       21
   4.1 Which Areas are Projected to Grow Fastest?                                                             22
      4.1.1 States and Territories                                                                            22
      4.1.2 Cities and Regions                                                                                23
   4.2 Other Views                                                                                            26
5 Conclusions                                                                                                 27
   5.1 Significant Growth in Store                                                                            27
   5.2 Implications for Infrastructure                                                                        27
References                                                                                                    67

Appendices

Appendix 1    Details of Australian National Level Estimates and Projections                                  29
Appendix 2    Details of Queensland Projections and Plans                                                     37
Appendix 3    Details of New South Wales Projections and Plans                                                42
Appendix 4    Details of Australian Capital Territory Projections and Plans                                   47
Appendix 5    Details of Victorian Projections and Plans                                                      50
Appendix 6    Details of Tasmanian Projections and Plans                                                      54
Appendix 7    Details of South Australian Projections and Plans                                               57
Appendix 8    Details of Western Australian Projections and Plans                                             60
Appendix 9    Details of Northern Territory Projections and Plans                                             64

Tables
Table 1 - Estimated resident population (ERP) of Australian states and territories at 30
           September 2014                                                                                     14
Table 2 - Estimated resident population of capital cities and the balance of each
           state/territory at 30 June 2014                                                                    15
Table 3 - Change in estimated resident population – end September 2009 – end September
           2014                                                                                               15
Table 4 - Historical Sydney population projections                                                            19
Table 5 - Historical Adelaide population projections                                                          20
Table 6 - Historical Queensland population projections                                                        20
Table 7 - Historical Perth population projections                                                             20
Table 8 - Medium level projected growth of the states and territories - 2011-2061                             22
Table 9 - Medium level projected growth of Australian capital cities: 2011-2061                               25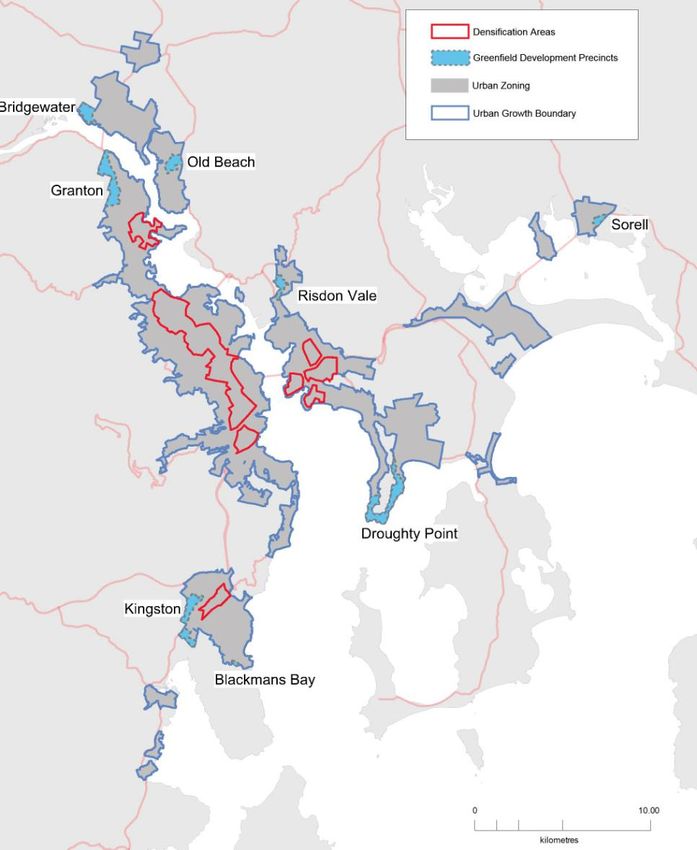
4 Population Estimates and Projections Australian Infrastructure Audit Background Paper
Table 10 - Net interstate migration – 2004 to 2013 31
Table 11 - Share of Australian estimated resident population by state and territory – June
1971 – June 2011 32
Table 12 - Comparison of assumptions behind ABS 2008 and 2013 long-term projections 33
Table 13 - Comparison of projected and past annual population growth rates 34
Table 14 - Comparison of Australian Bureau of Statistics 2008 and 2013 projection series 35
Table 15 - Projections of Australia’s population used in the 2015 Intergenerational Report 35
Table 16 - Queensland Government projections of state population to 2061 (Persons) 37
Table 17 - Queensland Government projections of regional population (no. of persons) to
2031 38
Table 18 - Comparison of Queensland Government and ABS population projections- 2011
to 2061 (persons) 39
Table 19 - Population estimates and projections used in Queensland regional plans 40
Table 20 - NSW Government population projections – Sydney and regional, 2011-2031 42
Table 21 - Comparison of New South Wales Government and ABS population projections –
2011to 2041 43
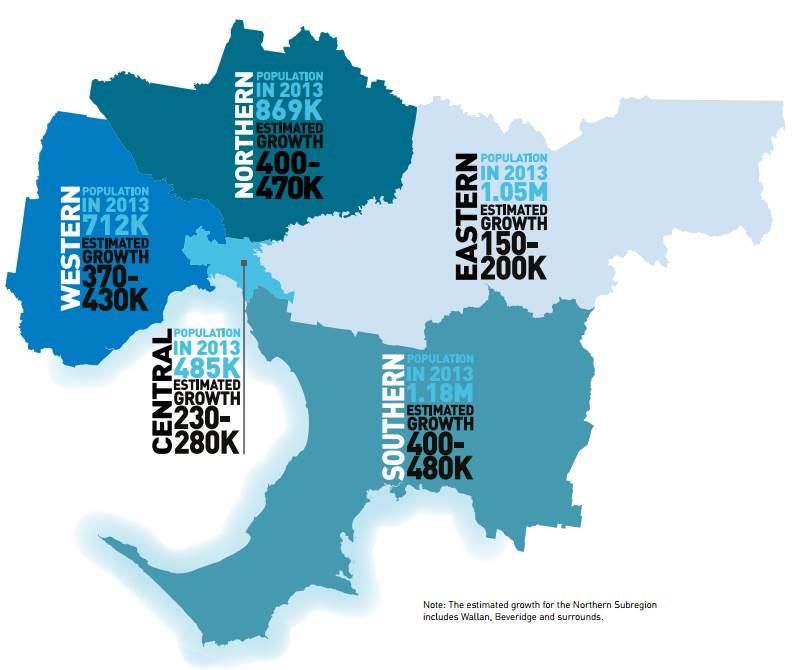
Table 22 - Planned population increases in Sydney sub-regions – 2011-2031 45
Table 23 - ACT Government estimates of past and projected population 47
Table 24 - Comparison of ACT Government and ABS population projections – 2011to 2061
(persons) 48
Table 25 – Victorian Government projections of state population to 2051 50
Table 26 - Victorian Government regional population projections – 2011-2031 50
Table 27 - Comparison of Victorian Government and ABS medium population projections –
2011-2051 (Persons) 51
Table 28 - Planned population for Victorian non-metropolitan regions 53
Table 29 - Tasmanian Government population estimates and projections – 2011-2061 54
Table 30 - Comparison of Tasmanian Government and ABS population estimates and
projections 2011-2061 55
Table 31 - South Australian Government population projections for South Australia - 2006-
2036 57
Table 32 - Comparison of South Australian Government and ABS population projections –
2011 to 2036 58
Table 33 – Western Australian Government population projections for Western Australia
2006 – 2026 60
Table 34 - Western Australian Government medium level regional population projections –
2006-2026 60
Table 35 - Comparison of Western Australian Government and ABS medium population
projections – 2006-2026 61
Table 36 - Northern Territory Government population projections to 2011-2041 64
Table 37 - Northern Territory Government population projections for Darwin and rest of
NT to 2011-2041 64
Figures
Figure 1 - The 3Ps of growth in real GDP per person 11
Figure 2 - Components of annual population growth, Australia 16
Figure 3 - Inter-state migration flows – 2013 17
Figure 4 - State and territory share of Australian population - 1971-2011 17
Figure 5 - Projected population of Australia to 2101 21
Figure 6 - Comparison of projected growth of national and capital city population – 2011-
2061 23
Figure 7 - Medium projected population growth in Australian capital cities 24
Figure 8 - Annual percentage growth in the Australian population – 1901-02 to 2013-14 29
Figure 9 - Comparison of annual population percentage growth rates for selected countries,
G7 and OECD average 30
Figure 10 - Comparison of Australia’s projected (2008) & latest estimated resident
population 34
Figure 11 - Comparison of Treasury and ABS medium level population projections – 2015-
2055 36
Figure 12 - Regions covered by Queensland Government regional plans 41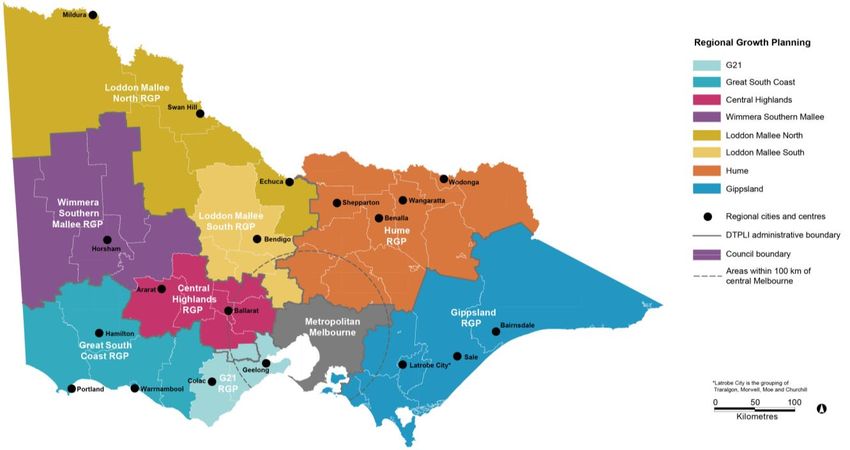
Population Estimates and Projections Australian Infrastructure Audit Background Paper 5
Figure 13 - Projected Population Growth in Sydney/Lower Hunter/Illawarra Conurbation 44
Figure 14 - NSW Government’s planning sub-regions for Sydney 46
Figure 15 - ACT Government estimates of Territory population - past and projected 47
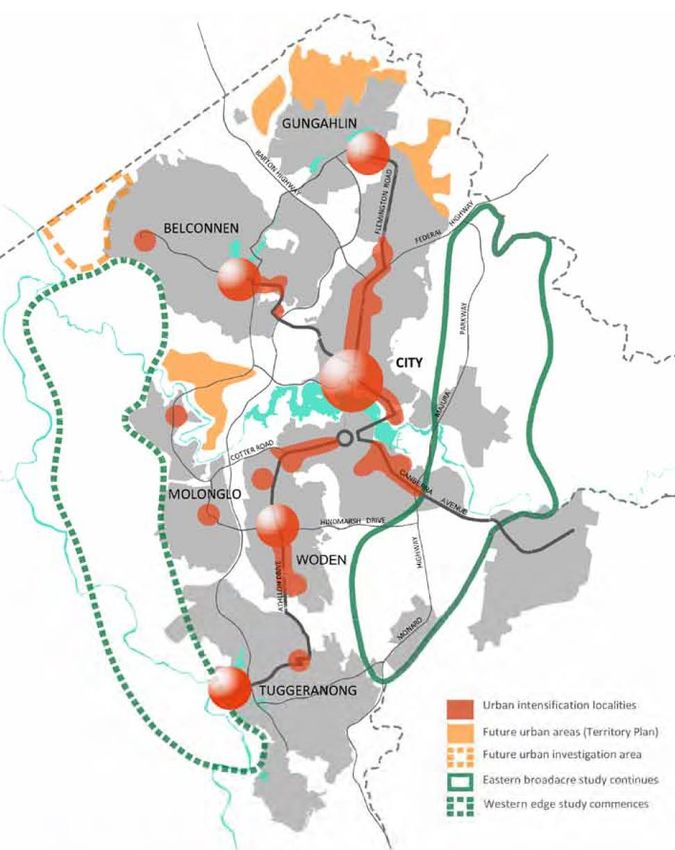
Figure 16 - Proposed urban growth and intensification areas in Canberra 49
Figure 17 - Current population and estimated growth to 2031 in Melbourne’s sub-regions 52
Figure 18 - Victorian planning regions 53
Figure 19 - Areas for residential development in greater Hobart 2010-2035 56
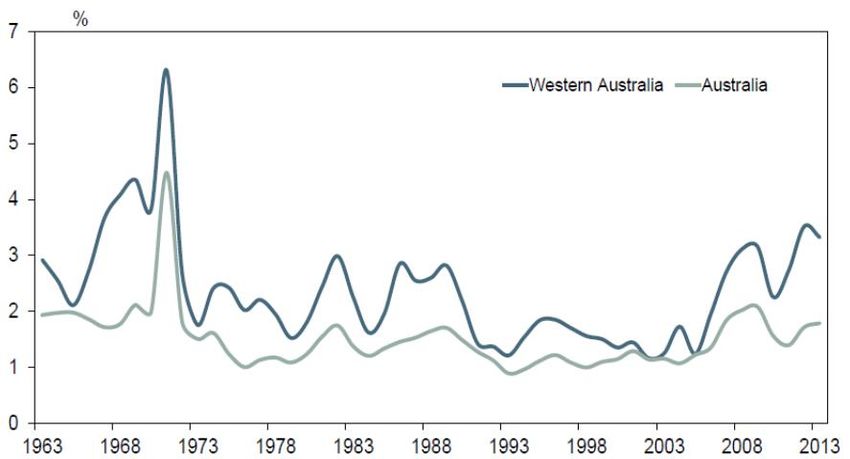
Figure 20 - Comparison of population growth rates for Australia and Western Australia:
1963 - 2013 62
Figure 21 - Western Australian Government planning regions in and around Perth 63
Figure 22 - Comparison of Northern Territory Government and ABS population projections
– 2011 to 2041 65
Figure 23 - Draft Darwin Regional Land Use Plan – proposed land use structure 66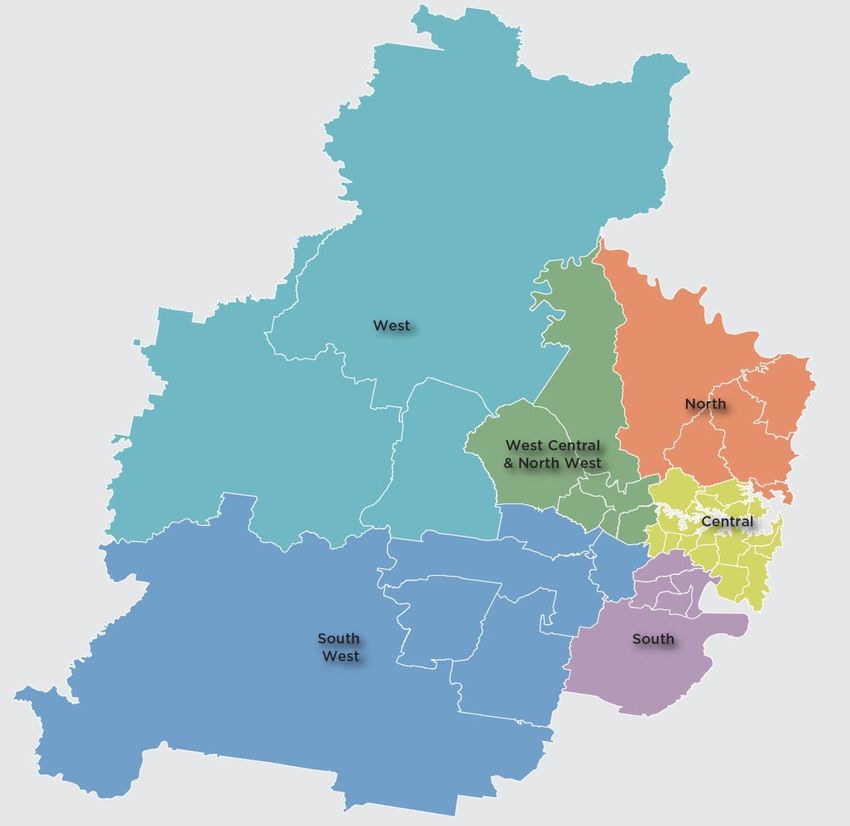
6 Population Estimates and Projections Australian Infrastructure Audit Background Paper Executive Summary Introduction This paper provides an overview of various population projections for Australia, the eight states and territories, their capital cities, and some regional areas over the next 15 to 40+ years. The paper has been prepared to inform the Australian Infrastructure Audit and subsequent development of the Australian Infrastructure Plan. The purpose of the paper is to consolidate authoritative data on population issues in order to minimise the potential for misunderstanding of the demographic drivers of future demand for infrastructure. Developing a solid understanding of population projections is important for a range of reasons. Firstly, population growth is a key driver of economic growth. The so-called ‘three Ps’ model of economic growth - population, productivity, and participation - applied by the Australian Treasury and others has population at its core. Secondly, projections of the demand for infrastructure services, and in turn the business cases for new capital and maintenance proposals, turn heavily on population projections. Misunderstanding population projections can lead to poor infrastructure-related decisions. Finally, population not only adds to demand for infrastructure; it can also provide funding for infrastructure. A larger population, gainfully employed, can afford more. Australia’s Present Population Australia’s population at the end of September 2014 was estimated to be 23.58 million persons. The four most populous states were: New South Wales (7.54 million and 32.0% of the national total); Victoria (5.87 million; 24.9%), Queensland (4.74 million; 20.1%) and Western Australia (2.59 million; 11.0%). Two-thirds of Australians live in the capital cities. Western Australia, South Australia and Victoria have the highest concentrations of population in their capital city (all 75% or more), while Tasmania and Queensland have the least (both under 50%). Natural increase in the population has ranged between 114,000 and 162,200 persons per annum over the last 20-25 years. Recently, net overseas migration (NOM) has played a more significant role in national population growth, with net figures between 200,000 and 300,000 persons per annum since the mid-2000s. Projected Population Growth Over recent years, Australia has had one of the fastest population growth rates in the developed world (it grew by 1.49% per annum over the 15 years to June 2014). Long-term population projections released by the Australian Bureau of Statistics (ABS) in November 2013 suggest that, on ‘medium’ assumptions, Australia’s population will grow from 22.7 million persons in June 2012 to: 30.5 million in 2031 (an increase of 7.8 million persons or 1.56% per annum); 41.5 million in 2061 (an increase of 18.8 million persons or 1.24% per annum); and
Population Estimates and Projections Australian Infrastructure Audit Background Paper 7 53.6 million persons in 2101 (an increase of 30.9 million or 0.97% per annum). The latest projections are somewhat higher than the equivalent figures released in 2008. The previous projected populations for 2031 and 2061 were 28.8 million and 36.7 million persons respectively. The new medium level projection for 2031 (30.5 million persons) is not that different to the previous high level projection (30.9 million). This increase in the projected population reflects both recent natural growth in population as well as higher levels of net overseas migration. The new medium level projections assume net overseas migration of 240,000 persons per annum, 60,000 persons more than the 2008 projections. The assumption on net overseas migration is the largest and most uncertain, both in terms of the aggregate number and the distribution of future migrants between the states and territories. Projections of Australia’s population used in the 2015 version of the Intergenerational Report are very close to those issued by the ABS in November 2013. The 2015 Intergenerational Report provides a projection for 2034-35 (32.0 million persons), i.e. the closest year to 2031 (the year of interest in the Audit). The medium level ABS population projection for June 2035 is also 32.0 million. The proportion of Australians living in capital cities is expected to grow. The medium projections suggest that Australia's capital cities will increase their share of national population from 66.0 per cent in 2011 to 69.3 per cent in 2031 and 73.4 per cent in 2061. This view is consistent with those of several state governments (e.g. New South Wales, Victoria and South Australia) that are planning for their capital cities to take on a greater share of the state’s population. The medium level projections suggest that 78.4 per cent of Australia’s population growth over the period to 2031 could occur in the cities. The equivalent percentage for the period to 2061 is 82.1 per cent. On these medium projections, the population of Australia's capital cities would grow by: 6.4 million persons between 2011 and 2031; and 15.7 million persons between 2011 and 2061. The projected growth in the population of the capital cities between 2011 and 2031 is equivalent to a new Melbourne and Brisbane. The projected growth to 2061 is more than the total current population of the capital cities. The population of a number of major cities outside the capitals, e.g. Geelong, Bendigo, Ballarat, Newcastle (or more precisely the Lower Hunter), the Sunshine Coast and Gold Coast in Queensland (and possibly Rockingham and Mandurah in Western Australia), is also expected to grow appreciably. Several of these cities are in ‘peri-urban locations’ that are relatively close to the capitals and share many economic and social linkages. Over time, as these peri-urban cities grow, it is conceivable there will be greater interaction between the capital and the city in question. In the absence of employment growth in these locations, ‘journey to work’ trips to and from the capital city may increase appreciably. Performance of Previous Population Projections Projecting population growth over the long term can be challenging. Examining the performance of past projections provides an insight into how future projections may perform. Population projections for Sydney based on the 1981 Census suggested a 2011 population which was only 3.2 per cent (142,000 persons) lower than the observed estimated resident population (ERP) in 2011. Similarly, the 1981 population projections for Adelaide in 2011 were 4.8 per cent lower (58,000 persons) than the observed ERP in 2011. A previous projection of Queensland’s population in 2011 was only 4.0 per cent (174,000 persons) lower than the observed ERP in 2011. Given the length of time over which these projections were made, the margins of error provide some encouragement for future projections. Projections for Western Australia show a different result. The projection for 2011 was 14.4 per cent (230,000 persons) lower than the observed ERP. However, the 2001 projection was off by less than 1 per
8   Population Estimates and Projections Australian Infrastructure Audit Background Paper

cent. The difference in the following ten years is almost certainly due to the impact of growth in the
mineral and energy sectors in the period after 2001.

More recent population projections for Melbourne also appear not to have fully anticipated a period of
very strong economic growth. The Victoria in Future projections, based on the 2001 Census, anticipated a
2011 population for Melbourne of 3.87 million persons. In contrast, the observed population was 4.17
million by 2011, a difference of 294,000 persons (7.6 per cent) in less than a decade.

Examining the performance of these past long-term projections has shown that they can prove to be
reasonably accurate, but are susceptible to inaccuracy should periods of strong economic growth develop
in the future.

Implications for Our Infrastructure Networks
Projections are simply that; projections of future population given certain assumptions. Change the
assumptions, and a different set of projections arise. They are used to inform forecasts and plans.

Arguably, greater weight should be placed on the forecasts and plans themselves. This is because they are
expressions of intent and/or design, reflecting decisions and commitments by various parties.
Government plans are usually (but not always) based on population projections that, at a state/territory
level, accord fairly well with the medium growth ABS projections.

Governments and others may advocate other plans and strategies that, if implemented, would lead to
materially different population figures from those suggested by current projections. This is particularly
the case at a sub-national level. For example, the Australian Government has committed to developing
and implementing a strategy to grow economic activity in northern Australia. Also, state government
projections for New South Wales and Victoria suggest greater population growth in regional areas than
anticipated by the ABS.

Demand for infrastructure does not necessarily rise or fall in proportion with changes in population.
Nevertheless, in the absence of changes in the per capita consumption of infrastructure services and/or an
ability to manage demand for those services within existing assets, the recent and prospective growth in
Australia’s population suggests a rising demand for new infrastructure.

The projected growth in population will have significant implications for our infrastructure networks.
Given the ‘fiscal gaps’ projected in various versions of the Intergenerational Report (and equivalent
reports prepared by some states), funding (or otherwise meeting) the projected requirements for
infrastructure will almost certainly require significant policy change.

Within the cities, the location of new development and population growth will be critical. While the cost
of providing new infrastructure in ‘greenfield areas’ is substantial, the cost of retrofitting or augmenting
some infrastructure (for example transport links in tunnels) in established areas can also be high.

With a few exceptions, the ‘population case’ for expanding infrastructure networks in regional areas is
likely to be less obvious. Arguments for investment in infrastructure in those areas will be driven more by
social considerations (service equality) and economic development prospects, e.g. proposals for
development in northern Australia.

Approach Pursued in the Audit
The ABS estimates and projections are a starting point for analysis during the Audit, particularly at a
national and state/territory level. The ABS projections are also used as a starting point by state and
territory governments, as well as other bodies such as the Australian Treasury.

In developing sub-state/territory projections, a balance has been struck between, on the one hand, having
a set of projections that is sufficiently disaggregated to inform meaningful discussions about an area’s
infrastructure needs and, on the other, having a level of disaggregation that is manageable to deliver. The
Audit uses sub-state/territory projections at the ABS-defined Statistical Area (SA) 4 Level. This is the
first level of disaggregation below the state/territory level. There are 88 SA4 areas across Australia. In
some cases, e.g. when analysing urban transport, a finer grain of analysis (SA3 or SA2) has been applied.
Population Estimates and Projections Australian Infrastructure Audit Background Paper   9

The projections used in the Audit are consistent with those used in the recent Northern Australia
Infrastructure Audit prepared by Infrastructure Australia. Given the nature of that work, in some cases
estimates and projections were prepared at the ABS SA2 level.
10   Population Estimates and Projections Australian Infrastructure Audit Background Paper

1 Introduction
The Australian Government has asked Infrastructure Australia to prepare an Australian Infrastructure
Audit (the Audit), and subsequently to assist the Government in preparing an Australian Infrastructure
Plan (the Plan) for the development of Australia’s infrastructure.

This paper provides an overview of the range of population projections for Australia, the eight
states/territories, and their capital cities and some regional areas over the next 15-40+ years. The paper
has been prepared to inform the Audit and, in turn, development of the Plan.

The purpose of the paper is to consolidate authoritative data on population issues, in order to minimise the
potential for misunderstanding of the demographic drivers of future demand for infrastructure.

A large number of population estimates and projections is in existence, including those prepared by the
Australian Bureau of Statistics (ABS), Commonwealth Treasury, and state/territory governments. This
paper consolidates the latest estimates and projections in one location, to form a resource to be used
during the audit and to highlight any differences between the various projections.

Developing a solid understanding of population projections is important for several reasons.

Firstly, population is a key driver of economic growth. As shown in Figure 1, the so-called ‘three Ps’
model of economic growth - population, productivity, and participation - applied by the Australian
Treasury and others has population at its core. In the 2015 Intergenerational Report (IGR), population
growth is assumed to drive almost half of the projected economic growth - measured in real Gross
Domestic Product (GDP) - over the next 40 years.1

If productivity does not grow at 1.5 per cent per annum (as assumed in the IGR), the significance of
population growth as a driver of economic growth will be larger than projected.

Secondly, projections of the demand for infrastructure services, particularly the business cases for new
capital and maintenance proposals, turn heavily on population projections. Poor population projections
can lead to poor infrastructure-related decisions.

Population projections can vary somewhat, both between and indeed within jurisdictions. To the extent
that the projections are used in the development of infrastructure business cases, differences between
projections and associated plans can confound rigorous, transparent decision-making.

Thirdly, and related to the second reason, population growth often leads to community expectations that
infrastructure will be upgraded to address expected ‘pressure points’. The responses to such expectations

1
     Australian Treasurer (2015), p.27. The IGR projects that population will grow at an average 1.3 % per annum, while real GDP per
     person will grow at 1.5% per annum, producing a projected growth in real GDP of 2.8% per annum over the period to 2055. The
     average 1.5% per annum rise in real GDP per person is assumed to be the product of several factors, notably a 1.5% per annum
     increase in productivity; a 0.1% per annum decrease in participation rates, and a 0.1% per annum increase in the proportion of the
     population aged over 15.
Population Estimates and Projections Australian Infrastructure Audit Background Paper 11
can gain a ‘head of steam’ and be pursued without rigorous examination of the arguments and options to
address those pressure points.
Finally, population not only adds to demand for infrastructure; it also provides funding for infrastructure.
A larger population, gainfully employed, can afford more.
Figure 1 - The 3Ps of growth in real GDP per person
Source: Australian Treasurer (2015), p. xi, using data from ABS catalogue no. 5206.0, catalogue no. 6202.0, and Treasury
projections.
1.1 Scope of this Paper
As the Australian Government has requested the preparation the Audit of current infrastructure and the
development of the Plan, this paper focuses on current population and projections over the next
approximately 15 years.
Most projections, and the plans which they inform, are based on five yearly intervals that coincide with
the five yearly interval of the Census. The last Census was held in August 2011.
This paper focuses on projections through to 2031 for two reasons:
infrastructure is designed for a long life, and it is appropriate to take a longer view of the population
projections. Indeed, the paper also makes some comment about projections over the longer term.
This makes sense, as major infrastructure decisions often turn on business cases that take 30-year
and even 40-year views of future demand; and
some jurisdictions have plans that expressly adopt a 2031 time horizon.
This paper is intended as a first exploration of these matters. It does not set out to provide a detailed
review of population issues. In particular, the paper does not address changes in ageing of the population
and its implications for the development and management of our infrastructure in detail. The paper does
provide a brief assessment of the performance of historical population projections for a sample of states
and major cities.
The paper does not seek to deal with the record of Australian governments in projecting and planning for
population growth. Evidence from the past suggests that projections can be proved wrong and plans can
be undone by subsequent decisions and changes in wider society. Examples include: (i) the impact of
post-World War II immigration on the efficacy of plans for some of our major cities, and (ii) changes in
internal migration within Australia (which were partly in response to changing perceptions of economic
opportunity and concerns about the cost of housing).12 Population Estimates and Projections Australian Infrastructure Audit Background Paper
1.2 Comment on the Projections and Implications for the Audit
This paper draws on the latest estimates and projections of population in Australia. Estimates of current
population and projections of future population by the ABS form the basis for most of the analysis,
although other estimates and projections are also referenced. This is because the ABS estimates and
projections:
are nationally consistent;
are available for the states/territories and their respective capital cities (unlike some other
projections);
can be aligned with other ABS data, e.g. economic data; and
are recognised and used by other governments and industry.
The ABS estimates and projections have been used as a starting point for analysis during the Audit,
particularly at a national and state/territory level. These set ‘control totals’ for analysis of the cities and
regions within a state or territory.
In developing the sub-state and territory projections, a balance has been struck between, on the one hand,
having a set of projections that is sufficiently disaggregated to inform meaningfully discussions about an
area’s infrastructure needs and, on the other, having a level of disaggregation that is manageable to
deliver.
The Audit uses sub-state and territory projections at the ABS-defined Statistical Area (SA) 4 Level. This
is the first level of disaggregation below the state and territory level. The Bureau also produces data for
the Greater Capital City Statistical Areas (GCCSA), which are, in effect, aggregations of SA4 areas in the
capital cities. There are 88 SA4 areas across Australia. 2 In some cases, e.g. when analysing urban
transport patterns, a finer grain of analysis (SA3) has been used.
At a sub-state and territory level, ABS analysis has been supplemented with projections and planning
forecasts developed by the state and territory governments.
Any consideration of population estimates and projections requires some understanding of the different
bases on which the estimates and projections are prepared. Confusion can easily arise, especially since, at
face value, the estimates or projections cover a similar period or geographic area. Differences between
projections can arise for one or more reasons, including:
the use of different assumptions about fertility, mortality and migration (including migration within
Australia). Different parties can legitimately reach different views on these matters;
the fact that the projections are prepared or reviewed at different points in time. In most cases, the
latest projections by state and territory governments have been built upon data from the 2011
Census, while others were built upon on the previous (2008) long-term projections by the Australian
Bureau of Statistics, while some still draw from the 2006 Census; and
the use of different geographical boundaries. For example, governments may change the boundaries
of local government areas. It is also particularly relevant in the discussions about the capital cities.
From time to time, governments will alter their conception or definition of what a city may be. In
2
Strictly, the first sub-state level of aggregation is between the respective capital city, i.e. the Greater Capital City Statistical Area
(GCCSA) and the ‘rest of state’. The GCCSA is a combination of SA4 areas in each city. In regional areas, SA4s tend to have a
population between 100,000 and 300,000. In metropolitan areas, SA4s tend to have populations of 300,000 to 500,000. See
Australian Bureau of Statistics (2011).Population Estimates and Projections Australian Infrastructure Audit Background Paper 13
addition, the ABS change to a new geographic standard in July 2011 has some minor impact when
comparing past and present projections of the population of Australia’s capital cities. 3
For all of that, until the November 2013 projections from the ABS, the differences have generally not
been that marked (at least at higher levels of geographic aggregation).
To minimise the risk of confusion, this paper endeavours to be as specific as is possible about the source
material that is being used, and to highlight any key points of difference with other projections or plans.
This paper also considers forecasts of population that underpin the plans of governments (e.g. a regional
development strategy), the private sector (a project business case) and other stakeholders (e.g. policy
advocacy). It is important to note that projections are not forecasts. Projections only show how the
population would change if certain demographic assumptions were to eventuate over the projection period.
Change the assumptions, and a different set of projections arise.
Projections are used to inform forecasts and plans; however greater weight should arguably be placed on
the forecasts and plans themselves. This is because they are expressions of intent and/or design, reflecting
decisions and commitments by various parties. For example, a government may plan for an area to have a
population increase of 100,000 people, which in turn leads to land use zoning decisions, expectations of
changes in the demand for infrastructure and, consequentially, commitments to spend funds on particular
infrastructure projects.
1.3 Structure of the Paper
Section two provides current estimates of the population of the states and territories, the capital cities, and
areas outside the capital cities.
Section three provides a brief assessment of the performance of historical population projections for a
sample of states and major cities.
Section four analyses population projections for Australia. Projections at a sub-national level are also
considered. The views of various interest groups are also highlighted.
The final section provides a range of concluding comments, and suggestions for further work.
A series of appendices sets out more detailed information about the projections and plans for each of the
jurisdictions.
3
Since July 2011, the Australian Bureau of Statistics has improved the basis for the geographical structure of its data, the Australian
Statistical Geography Standard (ASGS) - see Australian Bureau of Statistics (2011). The new standard establishes a hierarchy of
‘statistical areas’.14 Population Estimates and Projections Australian Infrastructure Audit Background Paper
2 Australia’s Present
Population
Australia’s population at 30 September 2014 (the most recent estimate) was 23.58 million persons. The
associated estimates of the population of the states and territories are shown in Table 1.
The latest estimates of the population of the capital cities and the balance of each state and territory
(based on estimates of state and territory population in June 2013) are shown in Table 2. The figures for
the capital cities exclude the population of nearby regions, although these regions are affected by and
contribute to the life and economy of their capital city.4
As shown in Table 2, two-thirds of Australians live in the capital cities. Western Australia, South
Australia and Victoria have the highest concentrations of population in their capital city. In each case, the
capital city accounts for more than three-quarters of the state’s total population. Tasmania is the most
decentralised of the states. Details of the population of various regional areas are shown in the
Appendices. The population of the capital cities grew by 1.9 per cent in the year to 30 June 2014,
compared to 1.6 per cent for the nation as a whole.
Table 1 - Estimated resident population (ERP) of Australian states and territories at 30 September 2014
Jurisdiction Estimated Resident Percentage Share of National
Population at 30 Population
September 2014
New South Wales 7,544,485 32.0%
Victoria 5,866,292 24.9%
Queensland 4,740,927 20.1%
South Australia 1,688,667 7.2%
Western Australia 2,589,078 11.0%
Tasmania 514,978 2.2%
Northern Territory 246,322 1.0%
Australian Capital Territory 387,069 1.6%
Australia - Total 23,581,029 100.0%
Source: Australian Bureau of Statistics (2015)
Note: The total for Australia includes other Territories comprising Jervis Bay Territory, Christmas Island and the Cocos (Keeling)
Islands.
4
The ABS produces population estimates at the state/territory level on a quarterly basis. Estimates of population below the
state/territory level are prepared annually. As shown in Table 2, the total Australian population in June 2014 (23.49 million) was
around 90,000 lower than in September 2014. The NSW Greater Capital City Statistical Area (GCCSA) excludes the Illawarra and
Lower Hunter. The Queensland GCCSA excludes the Gold Coast and Sunshine Coast. The Victorian GCSSA excludes Geelong.
The Western Australian GCCSA includes Fremantle and Mandurah in the south and Yanchep in the north.Population Estimates and Projections Australian Infrastructure Audit Background Paper 15
Table 2 - Estimated resident population of capital cities and the balance of each state/territory at 30 June
2014
Region NSW VIC QLD SA WA TAS NT ACT Australia
Greater Capital City 4,840,628 4,440,328 2,274,560 1,304,631 2,021,203 219,243 140,386 385,996 15,626,975
Balance 2,677,844 1,401,339 2,447,887 381,083 552,186 295,519 104,693 - 7,860,551
State/Territory
State/Territory Total 7,518,472 5,841,667 4,722,447 1,685,714 2,573,389 514,762 245,079 385,996 23,490,736
Capital City as % 64.4% 76.0% 48.2% 77.4% 78.5% 42.6% 57.3% 100.0% 66.5%
of Total
Source: Infrastructure Australia analysis of Australian Bureau of Statistics (2015a) data
2.1 Historic and Recent Growth
Appendix 1 includes a graph showing annual population growth rates back to 1901-02. Average annual
growth rates have been:
since 1901 (i.e. from 30 June 1901 – 30 June 2014) - 1.63% per annum;
the last 40 years (i.e. from 30 June 1974 – 30 June 2014) - 1.35% per annum;
the last 15 years (i.e. from 30 June 1999 – 30 June 2014) - 1.49% per annum; and
the last 5 years (i.e. from 30 June 2009 – 30 June 2014) - 1.61% per annum.
In recent years, Australia has had one of the highest population growth rates in the western world. Over
the last decade, Australia’s population growth rate was more than twice the average of Organisation for
Economic Co-operation and Development (OECD) member countries. Between September 2009 and
September 2014, Australia’s population grew by 1.79 million persons or 8.23 per cent.
Table 3 shows a breakdown of population growth by jurisdiction over the five years to September 2014.
Although the east coast states grew more in absolute terms, the growth of Western Australia’s population
stands out, particularly in percentage terms. Notwithstanding the recent slowdown in the mining and
resources industries, Western Australia’s population grew the fastest in percentage terms in the 12 months
to September 2014 (2.12 per cent), followed by Victoria (1.77 per cent). New South Wales grew the
fastest in absolute terms (106,365 persons).
The figures highlight the scale of population growth that is leading, in part, to calls for investment in
infrastructure.
Table 3 - Change in estimated resident population – end September 2009 – end September 2014
Region 2009 (no.) 2014 (no.) Change 2009 - 2014 Change 2009 - 2014
(no.) (%)
New South Wales 7,079,175 7,544,485 465,310 6.6%
Victoria 5,398,874 5,866,292 467,418 8.7%
Queensland 4,350,135 4,740,927 390,792 9.0%
South Australia 1,614,593 1,688,667 74,074 4.6%
Western Australia 2,253,355 2,589,078 335,723 14.9%
Tasmania 505,468 514,978 9,510 1.9%
Northern Territory 227,255 246,322 19,067 8.4%
ACT 356,310 387,069 30,759 8.6%
Other Territories 2,923 3,211 288 9.9%
Australia - Total 21,788,088 23,581,029 1,792,941 8.2%
Source: Infrastructure Australia analysis of Australian Bureau of Statistics (2015) data16 Population Estimates and Projections Australian Infrastructure Audit Background Paper
2.2 Drivers of Past Population Growth
As shown in Figure 2, natural increase in the population has ranged between 114,000 and 162,200 persons
per annum over the last 30 years. Recently, net overseas migration has played a more significant role in
national population growth, with net figures between 200,000 and 300,000 persons per annum since the
mid-2000s. Net overseas migration since 2005 has averaged around 220,000 persons per annum.
Residents also shift from one jurisdiction to another for a variety of reasons. Many move in search of
improved economic prospects, cheaper housing (this was reportedly a significant issue in the movement
of people out of New South Wales in the early 2000s), and retirement/lifestyle preferences.
Figure 3 shows that while gross inter-state migration flows can be significant, the net figures (at least on
an annual basis) are relatively modest. In all jurisdictions, net flows in and out were less than 12,000
persons in 2013 (and in most cases well below that figure).
Figure 2 - Components of annual population growth, Australia
500
450
400
350
300
thousand
250
200
150
100
50
0
1982 1984 1986 1988 1990 1992 1994 1996 1998 2000 2002 2004 2006 2008 2010 2012 2014
Natural Increase Net overseas migration Total growth
Source: Australian Bureau of Statistics (2015)
Note 1: Annual components calculated at the end of each quarter
Note 2: Estimates prior to 30 September 2011 are final. Estimates for 30 September to 31 December 2012 are revised. Estimates
thereafter are preliminary.
Note 3: NOM estimates have been calculated using a range of methods over the period.
Appendix 1 provides more detail of inter-state migration flows for the period 2004 to 2013. The largest
net flows were:
out migration - migration out of New South Wales to other states and territories averaged almost
19,200 persons per year over the last decade, although the rate has halved since the early 2000s; and
in migration – migration into Queensland averaged almost 16,700 persons per year over the last
decade, although the rate has recently dropped to around a quarter of what it was in the early 2000s.
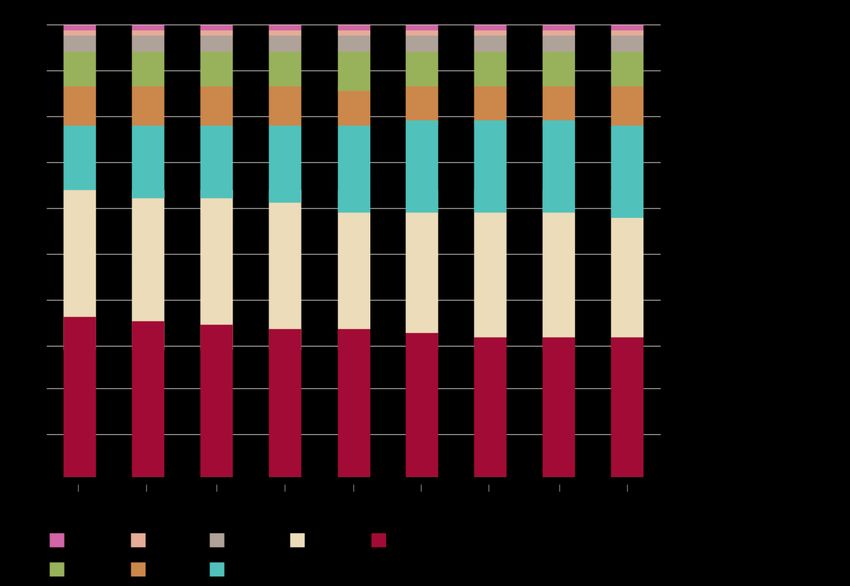
Figure 4 bears out this pattern of inter-state migration. Over the last 40 years, the proportion of the
Australian population living in Queensland (especially) and Western Australia has increased, while other
jurisdictions have remained stable or declined slightly. The share of the national population in the smaller
jurisdictions has remained largely unchanged.Population Estimates and Projections Australian Infrastructure Audit Background Paper 17 Figure 3 - Inter-state migration flows – 2013 Source: Australian Bureau of Statistics (2013a), p.13 Figure 4 - State and territory share of Australian population - 1971-2011 Source: Infrastructure Australia Analysis of Australian Bureau of Statistics (2014) data
18   Population Estimates and Projections Australian Infrastructure Audit Background Paper

Appendix 1 provides further detail, particularly in relation to the capital cities and balance of the states
and territories.

It shows that over the 40 years from 1971 to 2011, the proportion of people living in the capital cities
remained relatively stable (increasing slightly from 65.48% to 65.97%). These figures mask a fall from
1971 to 1996 and a slightly larger increase over the 15 years from 1996 to 2011 (from 64.67% to 65.97%).
In short, more Australians have been choosing to settle in the larger cities, particularly in recent years.

Regional Queensland also stands out, increasing its share of the national population from 6.84 per cent in
1971 to 10.43 per cent in 2011.
Population Estimates and Projections Australian Infrastructure Audit Background Paper 19 3 Performance of Previous Population Projections Projecting population growth over a long period of time can be challenging. Examining the performance of past projections can provide an insight into how future projection may perform. Past population projections have been drawn from a variety of sources. These include: New South Wales Department of Planning (Base Year 1981); ABS South Australian population projections (Base Year 1981); ABS Queensland population projections (Base Year 1981); Western Australian Ministry of Planning (Base Year 1991); and Victorian Department of Planning (Base Year 2001). A comparison of population projections for Sydney made in the early 1980s (based off the 1981 Census) with the observed estimated resident population (ERP) in the relevant year is presented in Table 4. The projection for 1986 was 49,000 persons (1.4%) lower than the ERP. The difference narrowed to 28,000 persons (0.7%) in 1996. This gap may have been due to the fact the projections were made in the midst of the recession of the early 1980s. The assumptions made at the time were influenced by weak economic conditions. The economic recovery was more robust than anticipated and population growth was stronger than projected. Over the medium term (fifteen years) the economic cycle and projected growth rate appears to have converged. Between 1996 and 2006, Sydney experienced another economic cycle (and the Sydney Olympics) which saw the projections being 62,000 persons (1.5%) below the observed ERP in 2001. Concerns about housing affordability (leading to migration out of Sydney) probably contributed to the gap between the two closing significantly (and reversing) by 2006. The 2011 population projection made in 1981 was 3.2 per cent (142,000 persons) lower than the observed ERP in 2011. Table 4 - Historical Sydney population projections Sydney 1986 1991 1996 2001 2006 2011 Population projections made in 1981 3,423,000 3,637,000 3,853,000 4,066,000 4,272,000 4,467,000 Observed ERP 3,472,000 3,673,000 3,881,000 4,128,000 4,256,161 4,608,949 Difference between projection and ERP -49,000 -36,000 -28,000 -62,000 15,839 -141,949 Similarly, as shown in Table 5, projections of Adelaide’s population prepared by the ABS in 1981 proved to be reasonably accurate. The ABS projection of Adelaide’s population in 2011 was 4.8 per cent (58,000 persons) lower than the observed ERP in that year. When the period between 1981 and 2011 is analysed further, ERP growth between 2006 and 2011 was much higher than the 1981 population projections had anticipated. However, this followed a twenty year period in which the population projections were higher than the ERP.
20   Population Estimates and Projections Australian Infrastructure Audit Background Paper

Table 5 - Historical Adelaide population projections

Adelaide                                            1986           1991          1996            2001           2006        2011
Population projections made in 1981            1,011,465      1,062,577     1,107,162        1,144,108      1,175,785   1,206,275
Observed ERP                                   1,003,548      1,056,561     1,078,437        1,107,986      1,189,243   1,264,091
Difference between projection and ERP              7,917           6,016       28,725          36,122         -13,458     -57,816

ABS population projections for Queensland prepared in 1981 (Table 6) show a similar pattern. The
projections were closely aligned with the observed ERP until the mining and resources boom stimulated
the Queensland economy during the 2000s. Interstate migration due to housing affordability concerns (in
Sydney particularly) may also have been a factor. The 2011 projection for Queensland was four per cent
(174,000 persons) lower than the observed ERP in 2011.

Table 6 - Historical Queensland population projections

Queensland                                          1986           1991          1996            2001           2006        2011
Population projections made in 1981            2,650,400      2,976,000     3,308,000        3,640,700      3,970,300   4,302,900
Observed ERP                                   2,624,595      2,960,951     3,338,690        3,628,946      4,111,018   4,476,778
Difference between projection and ERP             25,805          15,049       -30,690         11,754       -140,718    -173,878

The impact of the mining boom can also been seen in the population of Perth (Table 7). Projections made
in 1991 by the then WA Ministry of Planning suggested Perth would have a population of 1.38 million
persons in 2001. The projection was off by less than 1 per cent (9,500 persons). However, the projection
for 2011 was 14.4 per cent (230,000 persons) lower than the observed ERP. The difference in the
following ten years can be attributed to the rate of growth in the mineral and energy sector, which hadn’t
been anticipated in 1991.

On the other hand, there are also examples where plans have fairly accurately projected future growth.
Zaw (2013) reports on the 1963 Perth Metropolitan Regional Scheme, which forecast that the city’s
population would be 1.4 million persons in 2000. Perth’s estimated resident population in June 2000 was
1.43 million persons - see Australian Bureau of Statistics (2013a).

Table 7 - Historical Perth population projections

Perth                                                      1996        2001          2006           2011
Population projections made in 1991                 1,208,145      1,383,460    1,491,262       1,603,446
Observed ERP                                        1,295,092      1,393,002    1,576,912       1,833,567
Difference between projection and ERP                  -86,947        -9,542       -85,650      -230,121

More recent population projections for Melbourne also appear not to have anticipated a period of strong
economic growth. The Victoria in Future projections (based off the 2001 Census) anticipated a 2011
population for Melbourne of 3.87 million. The observed population in 2011 was 4.17 million persons,
representing a difference of 294,000 persons (7.6%) in less than a decade.

Examining the performance of these projections indicates that long-term projections can prove reasonably
accurate. However, they are susceptible to error during periods of strong economic growth in the future.
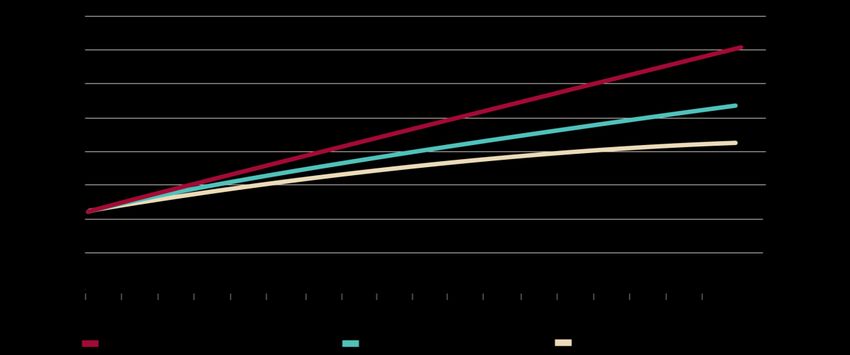
Population Estimates and Projections Australian Infrastructure Audit Background Paper 21

4 Projections of
Australia’s Population
Figure 5 provides three projections of Australia’s population to 2101. On a medium level projection
(Series B), Australia’s population will grow by around 7.8 million persons (or 34.3%) from 22.72 million
persons at June 2012 to 30.50 million persons at June 2031.

The national population will grow by around 18.8 million persons (or 82.7%) to approximately 41.5
million by 2061. The low and high projections of Australia’s population in 2061 are 36.8 and 48.3 million
respectively.

The projections also suggest that the nation’s population will grow to between 42.4 and 70.1 million
persons by 2101, with a medium level projection of 53.6 million persons.

Further detail, particularly on the underlying fertility, mortality, and net migration assumptions, can be
found in Appendix 1.

Figure 5 - Projected population of Australia to 2101

Source: Australian Bureau of Statistics (2013b)

These projections are somewhat higher than those released in 2008. For example, the 2008 projection of
Australia’s population in 2031 was 28.8 million persons. The equivalent medium level projection for
2031 released in November 2013 (30.5 million) is 1.7 million persons or almost 6 per cent higher than the
projections released five years earlier.

The latest projections assume higher rates of net overseas migration than those used in the equivalent
projections prepared in 2008. Appendix 1 provides further details on the difference between the 2008 and
2013 projections.

Appendix 1 also provides a comparison with projections used by Treasury in preparing the 2015
Intergenerational Report. The Treasury’s projections of Australia’s population in 2031 are very close to
the medium level ABS projection.
22    Population Estimates and Projections Australian Infrastructure Audit Background Paper

4.1     Which Areas are Projected to Grow Fastest?

Understanding which areas of Australia are projected to experience significant population growth
provides insights for where infrastructure demand might grow. Significant absolute increases in
population are likely to lead to significant increases in demand, especially on ‘trunk’ networks and at key
nodes. Whether substantial percentage increases in population present an infrastructure issue is likely to
depend in part on the extent to which existing networks have spare capacity.

4.1.1       States and Territories

As shown in Table 8, the projected population growth to 2031 in Western Australia (1.6 million persons
and 69%) and Queensland (almost 2 million persons and 44%) stand out. Absolute population growth in
NSW and Victoria (1.9 million and 2.0 million persons respectively) is also projected to be significant
over this period.

The four largest states are each projected to grow by more than 4 million persons over the period to 2061.
The population of the Australian Capital Territory is projected to more than double over the next 50 years.
Tasmania’s population growth is projected to be relatively small, slightly over 1,000 people per annum
over the next 50 years.

Table 8 - Medium level projected growth of the states and territories - 2011-2061

State/                   2011       2011            2031      2031         Change    Change                  2061     2061   Change    Change
Territory                (no.)     (% of            (no.)    (% of       2011-2031     2011-                 (no.)   (% of 2011-2061 2011-2061
                                   Aust.)                    Aust.)           (no.) 2031 (%)                         Aust.)     (no.)      (%)
Queensland         4,476,778          20.0    6,445,733         21.1      1,968,955           44.0     9,259,341        22.3     4,782,563    106.8

NSW                7,218,529          32.3    9,128,665         29.9      1,910,136           26.5 11,475,527           27.6     4,256,998     59.0

ACT                  367,985           1.6      520,412          1.7        152,427           41.4       740,903         1.8       372,918    101.3

Victoria           5,537,817          24.8    7,584,869         24.9      2,047,052           37.0 10,305,516           24.8     4,767,699     86.1

Tasmania             511,483           2.3      559,706          1.8          48,223            9.4      565,710         1.4        54,227     10.6

South              1,639,614           7.3    1,971,779          6.5        332,165           20.3     2,308,149         5.6       668,535     40.8
Australia
Northern             231,292           1.0      316,655          1.0          85,363          36.9       453,024         1.1       221,732     95.9
Territory
Western            2,353,409          10.5    3,970,021         13.0      1,616,612           68.7     6,402,253        15.4     4,048,844    172.0
Australia
Australia -       22,340,024        100.0 30,501,192          100.0       8,161,168           36.5 41,513,375         100.0 19,173,351         85.8
Total
Source: Infrastructure Australia analysis of Australian Bureau of Statistics (2013b) – Series B and Australian Bureau of Statistics (2013d)
        data

Compared with the previous (2008) projections prepared by the ABS and previous projections developed
by the respective states and territories, the current projections differ in most cases. In several cases, the
differences are fairly minor. In some cases, e.g. South Australia and Western Australia the differences are
more significant. The differences are primarily due to:
(1) the fact that the projections are prepared or reviewed at different points in time. Most recent
    projections by state and territory governments are derived from the 2011 Census, while others are
    derived from the previous (2008) long-term projections by the ABS, and some still draw on data from
    the 2006 Census; and
(2) different demographic assumptions, e.g. fertility, mortality and net migration.
Population Estimates and Projections Australian Infrastructure Audit Background Paper 23
4.1.2 Cities and Regions
Population growth is expected to occur primarily in and around Australia’s capital cities. Aggregated data
for the capital cities is shown in Figure 6 and Table 9 below.
The projections suggest that Australia's capital cities will see their share of the national population
increase from 66.0 per cent in 2011 to 69.3 per cent in 2031 and 73.4 per cent in 2061. This view is
consistent with those of several state governments (particularly NSW and Victoria) which are also
projecting and planning for their capital cities to take on a greater share of the state’s population.
Figure 6 - Comparison of projected growth of national and capital city population – 2011-2061
Source: Infrastructure Australia analysis of Australian Bureau of Statistics (2013b) – Series B and Australian Bureau of Statistics (2013d)
data
The projections suggest that 78.4 per cent of Australia’s population growth over the period to 2031 could
occur in the cities. The equivalent percentage for the period to 2061 is 82.1 per cent.
Figure 7 illustrates the expected growth in the population of the eight capital cities between 2011 and
2061.
On these ‘medium’ projections, the population of Australia's capital cities is projected to grow by
approximately 6.4 million persons between 2011 and 2031, and by 15.7 million persons between 2011
and 2061. The projected growth to 2061 is more than the total current population of the capital cities. The
projected growth between 2011 and 2031 is equivalent to a new Melbourne and Brisbane.
The percentages and figures above do not include growth in and around the capital cities in peri-urban
locations such as the lower Hunter, Geelong, the Gold Coast and the Sunshine Coast.
These areas already interact significantly with their nearby capital cities. Indeed, some of these areas and
their capital might already be viewed as one conurbation.
Projections below the state and territory level are not published by the ABS, other than figures for the
relevant Greater Capital City Statistical Areas (GCCSA). The states and territories, though, have released
projections and/or plans for these cities.24 Population Estimates and Projections Australian Infrastructure Audit Background Paper
Figure 7 - Medium projected population growth in Australian capital cities
10,000,000
9,000,000
8,000,000
7,000,000
6,000,000
5,000,000
2011
4,000,000
2031
3,000,000
2061
2,000,000
1,000,000
-
Source: Infrastructure Australia analysis of Australia Bureau of Statistics (2013b) – Series B data.
As shown in the Appendices, the population in areas around some of the regional cities (especially in
Queensland) is projected to grow appreciably. In Queensland, the following statistical areas are all
projected to grow substantially over the period 2011 – 2031:
Gold Coast (increase of 308,000 persons by 2031);
Sunshine Coast (increase of 167,000 persons by 2031);
Fitzroy (increase of 113,000 persons by 2031);
Townsville (increase of 107,000 persons by 2031);
Cairns (increase of 90,000 persons by 2031);
Mackay (increase of 89,000 persons by 2031); and
Wide Bay (increase of 85,000 persons by 2031).
In NSW, the population of Outer Metropolitan Sydney, comprising Lower Hunter, Central Coast, and
Illawarra is projected to grow by over 250,000 persons (representing 20 per cent growth) by 2031.
Similarly, the regional cities that encircle Greater Melbourne, namely Geelong, Ballarat and Bendigo are
also projected to exhibit strong population growth to 2031, increasing their respective populations by
upwards of 35 per cent.
Over time, as these peri-urban cities grow, it is conceivable there will be greater interaction between the
capital and the city in question. In the absence of employment growth in these locations, ‘journey to work’
trips to and from the capital city may increase appreciably.
The Australian Government has announced its intention to work with the Queensland, Northern Territory
and Western Australian Governments to foster economic growth in northern Australia. It expects to
release a White Paper on northern Australia in 2015.You can also read