Default Market Offer 2021-22 - Wholesale energy and environment cost estimates for DMO 3 Final Determination - Australian ...
←
→
Page content transcription
If your browser does not render page correctly, please read the page content below
19 April 2021
Report to       Australian Energy Regulator

Default Market Offer
2021-22
Wholesale energy and environment cost
estimates for DMO 3 Final Determination
About ACIL Allen

ACIL Allen is a leading independent economics, policy and strategy advisory firm, dedicated to helping clients
solve complex issues.
Our purpose is to help clients make informed decisions about complex economic and public policy issues.
Our vision is to be Australia’s most trusted economics, policy and strategy advisory firm. We are committed
and passionate about providing rigorous independent advice that contributes to a better world.

Suggested citation for this report
Default Market Offer 2021-22: Wholesale energy and environmental cost estimates for DMO 3 Final Determination, ACIL Allen, April 2021
Reliance and disclaimer The professional analysis and advice in this report has been prepared by ACIL Allen for the exclusive use of the party or parties to whom it is addressed (the
addressee) and for the purposes specified in it. This report is supplied in good faith and reflects the knowledge, expertise and experience of the consultants involved. The report must
not be published, quoted or disseminated to any other party without ACIL Allen’s prior written consent. ACIL Allen accepts no responsibility whatsoever for any loss occasioned by any
person acting or refraining from action as a result of reliance on the report, other than the addressee.
In conducting the analysis in this report ACIL Allen has endeavoured to use what it considers is the best information available at the date of publication, including information supplied
by the addressee. ACIL Allen has relied upon the information provided by the addressee and has not sought to verify the accuracy of the information supplied. If the information is
subsequently determined to be false, inaccurate or incomplete then it is possible that our observations and conclusions as expressed in this report may change. The passage of time,
manifestation of latent conditions or impacts of future events may require further examination of the project and subsequent data analysis, and re-evaluation of the data, findings,
observations and conclusions expressed in this report. Unless stated otherwise, ACIL Allen does not warrant the accuracy of any forecast or projection in the report. Although ACIL
Allen exercises reasonable care when making forecasts or projections, factors in the process, such as future market behaviour, are inherently uncertain and cannot be forecast or
projected reliably.
This report does not constitute a personal recommendation of ACIL Allen or take into account the particular investment objectives, financial situations, or needs of the addressee in
relation to any transaction that the addressee is contemplating. Investors should consider whether the content of this report is suitable for their particular circumstances and, if
appropriate, seek their own professional advice and carry out any further necessary investigations before deciding whether or not to proceed with a transaction. ACIL Allen shall not be
liable in respect of any claim arising out of the failure of a client investment to perform to the advantage of the client or to the advantage of the client to the degree suggested or
assumed in any advice or forecast given by ACIL Allen.
© ACIL Allen 2021
Contents

Executive summary                                                                       vii

1     Introduction                                                                     10

2     Overview of approach                                                             11
      2.1    Introduction                                                               11
      2.2    Components of the total energy cost estimates                              11
      2.3    Methodology                                                                12

3     Responses to submissions to Draft Determination                                  27
      3.1    Overall approach to estimate the WEC                                       27
      3.2    AEMO Direction costs                                                       28
      3.3    Estimation of LGC prices                                                   29
      3.4    Retailer Reliability Obligation                                            30
      3.5    Estimating separate WECs for residential and small business customers      30

4     Estimation of energy costs                                                       31
      4.1    Introduction                                                               31
      4.2    Estimation of the Wholesale Energy Cost                                    37
      4.3    Estimation of renewable energy policy costs                                65
      4.4    Estimation of other energy costs                                           69
      4.5    Estimation of energy losses                                                78
      4.6    Summary of estimated energy costs                                          80

A     AEMC 2020 Residential electricity price trends report                           A-1
      A.1    Wholesale energy costs                                                    A-1

Figures
Figure ES 1 Change in estimated TEC between 2020-21 and 2021-22 ($/MWh, and %) – Final
            Determination                                                                  ix
Figure 2.1 Components of DMO and TEC                                                      12
Figure 2.2 Illustrative example of hedging strategy, prices and costs                     14
Figure 2.3 Estimating the WEC – market-based approach                                     19
Figure 2.4 Steps to estimate the cost of LRET                                             23
Figure 2.5 Steps to estimate the cost of SRES                                             24
Figure 3.1 Cumulative trade volumes in LGCs given the number of days from surrender date29
Figure 4.1 Actual average time of day wholesale electricity spot price ($/MWh, nominal) and
            load profiles (MW, relative) – Queensland – 2011-12 to 2019-20                32
Figure 4.2 Actual average time of day wholesale electricity spot price ($/MWh, nominal) and
            load profiles (MW, relative) – New South Wales – 2011-12 to 2019-20           33
Figure 4.3 Actual average time of day wholesale electricity spot price ($/MWh, nominal) and
            load profiles (MW, relative) – South Australia – 2011-12 to 2019-20           34
Figure 4.4 Actual annual average demand weighted price ($/MWh, nominal) by profile and
            Queensland time weighted average price ($/MWh, nominal) – 2009-10 to 2019-20
                                                                                          35
Contents
Figure 4.5 Actual annual average demand weighted price ($/MWh, nominal) by profile and New
South Wales time weighted average price ($/MWh, nominal) – 2009-10 to 2019-20
35
Figure 4.6 Actual annual average demand weighted price ($/MWh, nominal) by profile and
South Australia time weighted average price ($/MWh, nominal) – 2009-10 to 2019-20
36
Figure 4.7 Base, Peak, and Cap trade weighted average contract prices ($/MWh, nominal) –
2013-14 to 2021-22 37
Figure 4.8 Time series of trade volume and price – ASX Energy base futures - Queensland40
Figure 4.9 Time series of trade volume and price – ASX Energy peak futures - Queensland41
Figure 4.10 Time series of trade volume and price – ASX Energy $300 cap futures - Queensland
42
Figure 4.11 Time series of trade volume and price – ASX Energy base futures – New South
Wales 43
Figure 4.12 Time series of trade volume and price – ASX Energy peak futures – New South
Wales 44
Figure 4.13 Time series of trade volume and price – ASX Energy $300 cap futures – New South
Wales 45
Figure 4.14 Time series of trade volume and price – ASX Energy base futures – South Australia
46
Figure 4.15 Time series of trade volume and price – ASX Energy peak futures – South Australia
47
Figure 4.16 Time series of trade volume and price – ASX Energy $300 cap futures – South
Australia 48
Figure 4.17 Comparison of upper one per cent of hourly regional system loads of 2021-22
simulated hourly demand sets with historical outcomes 49
Figure 4.18 Comparison of upper one per cent of hourly NSLPs of 2021-22 simulated hourly
demand sets with historical outcomes 51
Figure 4.19 Comparison of load factor of 2021-22 simulated hourly demand sets with historical
outcomes - NSLPs 52
Figure 4.20 Simulated annual TWP for Queensland, New South Wales, and South Australia for
2021-22 compared with range of actual annual outcomes in past years 53
Figure 4.21 Comparison of upper 1 percent tail of simulated hourly price duration curves for
Queensland, New South Wales, and South Australia for 2021-22 and range of actual
outcomes in past years 54
Figure 4.22 Annual average contribution to the Queensland, New South Wales, and South
Australia TWP by prices above $300/MWh in 2021-22 for simulations compared with
range of actual outcomes in past years 55
Figure 4.23 Simulated annual DWP for NSLP as a percentage premium of annual TWP for 2021-
22 compared with range of actual outcomes in past years 56
Figure 4.24 Contract volumes used in hedge modelling of 550 simulations for 2021-22 for
Energex NSLP 58
Figure 4.25 Contract volumes used in hedge modelling of 550 simulations for 2021-22 for
Essential (COUNTRYENERGY) 59
Figure 4.26 Contract volumes used in hedge modelling of 550 simulations for 2021-22 for Ausgrid
(ENERGYAUST) 60
Figure 4.27 Contract volumes used in hedge modelling of 550 simulations for 2021-22 for
Endeavour (INTEGRAL) 61
Figure 4.28 Contract volumes used in hedge modelling of 550 simulations for 2021-22 for SAPN
(UMPLP) 62Contents
Figure 4.29 Annual hedged price and DWP ($/MWh, nominal) for NSLPs for the 550 simulations
– 2021-22 63
Figure 4.30 Estimated WEC ($/MWh, nominal) for 2021-22 at the regional reference node in
comparison with WECs from previous determinations 64
Figure 4.31 LGC prices for 2021 and 2022 for 2021-22 ($/LGC, nominal) 66
Figure A.1 Projected average time of day spot price ($/MWh, nominal) – 2021-22 A-2
Figure A.2 Total wholesale costs ($/MWh, nominal) – 2021-22 A-3
Tables
Table ES 1 Estimated TEC components for 2021-22 Final Determination ($/MWh, nominal) vii
Table ES 2 Estimated TEC for 2021-22 ($/MWH, nominal) – Final Determination viii
Table ES 3 Change in estimated energy cost components between 2020-21 and 2021-22 (%) –
Final Determination viii
Table 2.1 Sources of load data 16
Table 3.1 Review of issues raised in submissions in response to Interim Consultation Paper27
Table 4.1 Estimated contract prices ($/MWh, nominal) - Queensland 38
Table 4.2 Estimated contract prices ($/MWh, nominal) – New South Wales 39
Table 4.3 Estimated contract prices ($/MWh, nominal) – South Australia 39
Table 4.4 Estimated WEC ($/MWh, nominal) for 2021-22 at the regional reference node 64
Table 4.5 Estimating the 2021 and 2022 RPP values 66
Table 4.6 Estimated cost of LRET – 2021-22 67
Table 4.7 Estimated cost of SRES – 2021-22 67
Table 4.8 Total renewable energy policy costs ($/MWh, nominal) – 2021-22 67
Table 4.9 Estimated cost of ESS ($/MWh, nominal) – 2021-22 68
Table 4.10 NEM management fees ($/MWh, nominal) – 2021-22 69
Table 4.11 Ancillary services ($/MWh, nominal) – 2021-22 69
Table 4.12 AEMO prudential costs for Energex NSLP – 2021-22 71
Table 4.13 AEMO prudential costs for Ausgrid NSLP – 2021-22 71
Table 4.14 AEMO prudential costs for Endeavour NSLP – 2021-22 71
Table 4.15 AEMO prudential costs for Essential NSLP – 2021-22 72
Table 4.16 AEMO prudential costs for SAPN NSLP – 2021-22 72
Table 4.17 Hedge Prudential funding costs by contract type – Queensland 2021-22 73
Table 4.18 Hedge Prudential funding costs by contract type – New South Wales 2021-22 73
Table 4.19 Hedge Prudential funding costs by contract type – South Australia 2021-22 73
Table 4.20 Hedge Prudential funding costs for ENERGEX NSLP – 2021-22 74
Table 4.21 Hedge Prudential funding costs for Ausgrid NSLP – 2021-22 74
Table 4.22 Hedge Prudential funding costs for Endeavour NSLP – 2021-22 74
Table 4.23 Hedge Prudential funding costs for Essential NSLP – 2021-22 75
Table 4.24 Hedge Prudential funding costs for SAPN NSLP – 2021-22 75
Table 4.25 Total prudential costs ($/MWh, nominal) – 2021-22 75
Table 4.26 Total of other costs ($/MWH, nominal) – Energex NSLP – 2021-22 77
Table 4.27 Total of other costs ($/MWH, nominal) – Ausgrid NSLP – 2021-22 77
Table 4.28 Total of other costs ($/MWH, nominal) – Endeavour NSLP – 2021-22 77
Table 4.29 Total of other costs ($/MWH, nominal) – Essential NSLP – 2021-22 77
Table 4.30 Total of other costs ($/MWH, nominal) – SAPN NSLP – 2021-22 78
Table 4.31 Estimated transmission and distribution losses 79
Table 4.32 Estimated TEC for 2021-22 ($/MWH, nominal) – Final Determination 80
Table 4.33 Estimated TEC for 2021-22 Final Determination ($/MWh, nominal) 81Contents Boxes Box 4.1 Availability of cap contract products 38
Executive summary
                              ACIL Allen has been engaged by the Australian Energy Regulator (AER) to support the AER in
                              estimating specific cost inputs required for the determination of Default Market Offer (DMO) prices.
                              Specifically, ACIL Allen is required to provide consultancy services to the AER to estimate the
                              underlying wholesale and environmental cost inputs to inform the determination for 2021-22 (DMO
                              3). These estimates are to be based on the relevant cost drivers for a retailer supplying electricity to
                              residential and small business customers in non-price regulated jurisdictions (excluding Victoria).
                              This report relates to Phase 2 of our engagement, and provides estimates of the wholesale energy,
                              environmental, and other costs for use by the AER in its Final Determination, using the
                              methodology proposed in our Phase 1 methodology review report to the AER, as well as
                              considering stakeholder feedback in response to the AER’s Position Paper and Draft
                              Determination.

                              Summary of estimated energy costs
                              ACIL Allen’s estimates of the 2021-22 total wholesale energy costs, environmental costs and total
                              energy costs (TEC) for the Draft Determination for each of the regional tariff profiles for 2021-22
                              are presented in Table ES 1.
Table ES 1         Estimated TEC components for 2021-22 Final Determination ($/MWh, nominal)
                              Total wholesale costs at the      Total environmental costs at the Total energy costs at the
Profile                       customer terminal ($/MWh,         customer terminal ($/MWh,        customer terminal ($/MWh,
                              nominal)                          nominal)                         nominal)
Ausgrid – NSLP                             $87.94                            $19.17                             $107.11
Endeavour - NSLP                           $88.27                            $19.31                             $107.58
Essential - NSLP                           $80.34                            $19.04                             $99.38
Ausgrid - CLP1                             $60.44                            $19.22                             $79.66
Ausgrid - CLP2                             $57.47                            $19.22                             $76.69
Endeavour - CLP                            $83.29                            $19.31                             $102.60
Essential – CLP                            $67.30                            $19.04                             $86.34
Energex – NSLP                             $74.03                            $16.75                             $90.78
Energex – CLP31                            $58.84                            $16.75                             $75.59
Energex – CLP33                            $61.18                            $16.75                             $77.93
SAPN – NSLP                               $119.47                            $20.39                             $139.86
SAPN – CLP                                 $72.82                            $20.39                             $93.21
Source: ACIL Allen analysis

                                 Default Market Offer 2021-22 Wholesale energy and environment cost estimates for DMO 3
                                                                                                       Final Determination    vii
The change, in $/MWh and percentage terms, in the estimated total energy costs between 2020-21
DMO 2 Final Determination and 2021-22 DMO 3 Draft Determination are shown in Table ES 2 and
Figure ES 1.
Table ES 2 Estimated TEC for 2021-22 ($/MWH, nominal) – Final Determination
2020-21 Total energy 2021-22 Total energy
Change from 2020-21 to
costs at the customer costs at the customer Change from 2020-21
Profile 2021-22 ($/MWh,
terminal ($/MWh, terminal ($/MWh, to 2021-22 (%, nominal)
nominal)
nominal) nominal)
Ausgrid - NSLP $128.23 $107.11 -$21.12 -16.47%
Endeavour - NSLP $129.63 $107.58 -$22.05 -17.01%
Essential - NSLP $120.75 $99.38 -$21.37 -17.70%
Ausgrid - CLP1 $91.24 $79.66 -$11.58 -12.69%
Ausgrid - CLP2 $89.33 $76.69 -$12.64 -14.15%
Endeavour - CLP $121.28 $102.60 -$18.68 -15.40%
Essential - CLP $105.15 $86.34 -$18.81 -17.89%
Energex - NSLP $106.59 $90.78 -$15.81 -14.83%
Energex – CLP31 $87.39 $75.59 -$11.80 -13.50%
Energex – CLP33 $89.16 $77.93 -$11.23 -12.60%
SAPN - NSLP $172.69 $139.86 -$32.83 -19.01%
SAPN - CLP $111.72 $93.21 -$18.51 -16.57%
Source: ACIL Allen analysis
The change, in percentage terms, in the estimated energy cost components between 2020-21
DMO 2 Final Determination and 2021-22 DMO 3 Draft Determination are set out in Table ES 3.
Table ES 3 Change in estimated energy cost components between 2020-21 and 2021-22 (%) – Final Determination
Change in total wholesale Change in total environmental Change in total energy cost
Profile
energy cost (%) cost (%) (TEC) (%)
Ausgrid - NSLP -20.82% 11.65% -16.47%
Endeavour - NSLP -21.38% 11.23% -17.01%
Essential - NSLP -22.38% 10.38% -17.70%
Ausgrid - CLP1 -18.35% 11.61% -12.69%
Ausgrid - CLP2 -20.30% 11.61% -14.15%
Endeavour - CLP -19.85% 11.23% -15.40%
Essential - CLP -23.44% 10.38% -17.89%
Energex - NSLP -19.08% 10.93% -14.83%
Energex – CLP31 -18.61% 10.93% -13.50%
Energex – CLP33 -17.39% 10.93% -12.60%
SAPN - NSLP -22.48% 9.80% -19.01%
SAPN - CLP -21.83% 9.80% -16.57%
Source: ACIL Allen analysis
Default Market Offer 2021-22 Wholesale energy and environment cost estimates for DMO 3
Final Determination viiiFigure ES 1 Change in estimated TEC between 2020-21 and 2021-22 ($/MWh, and %) – Final Determination
$5.00 0.00%
$0.00 -2.00%
-4.00%
($5.00)
-6.00%
($/MWh, nominal)
($10.00) -8.00%
(%)
($15.00) -10.00%
($20.00) -12.00%
-14.00%
($25.00)
-16.00%
($30.00) -18.00%
($35.00) -20.00%
Ausgrid - Endeavour Essential - Ausgrid - Ausgrid - Endeavour Essential - Energex - Energex - Energex - SAPN - SAPN -
NSLP - NSLP NSLP CLP1 CLP2 - CLP CLP NSLP CLP1 CLP2 NSLP CLP
Change in TEC (from 2020-21 to 2021-22) ($/MWh) Change TEC (from 2020-21 to 2021-22) (%)
Source:ACIL Allen analysis
The key drivers for these changes are:
— Total wholesale energy costs:
― Wholesale energy costs (WEC) (a sub-component of total wholesale energy cost):
the key drivers in the change in whole energy costs are the change in contract prices and
shape of the load profiles. Compared with the 2020-21, futures base contract prices for
2021-22, on an annualised and trade weighted basis to date, have:
− decreased by about $13.80/MWh for Queensland
− decreased by about $15.20/MWh for New South Wales
− decreased by about $21.10/MWh for South Australia.
― The market is clearly expecting a continued strong decline in price outcomes due to the
strong increase in renewable investment coming on-line between 2020-21 and 2021-22.
― This is offset to some extent by the continued uptake of rooftop PV which carves out the
NSLP demand during daylight hours, making the demand profile more peaky and hence
more expensive to hedge.
― Other energy costs (a sub-component of total wholesale energy cost): the most
significant change in other wholesale energy costs are the costs associated with ancillary
services recovery. Ancillary service costs are estimated by the most recent 52 weeks of
actual cost data as published by AEMO. Generally, there has been a decrease in weekly
ancillary service costs as a result of additional supply being commissioned that can offer
services to this relatively small market. This results in a reasonable decrease in ancillary
service costs in Queensland and New South Wales.
— Environmental costs: environmental costs are estimated to fall slightly across all regions.
The decline is primarily driven by a projected decline in the cost of the LRET between 2020-
21 and 2021-22 of about 15 per cent (or $0.74/MWh) as a result of declining LGC forward
prices. LGC forward prices have fallen due to the surge in investment in renewables over
recent years. The cost of the SRES is estimated to increase by 24 per cent (or $2.21/MWh),
with the expectation that small-scale installations in 2022 will remain at levels observed in
2020. The cost variations by region mainly result from differences in jurisdictional energy
efficiency schemes.
Default Market Offer 2021-22 Wholesale energy and environment cost estimates for DMO 3
Final Determination ix1 Introduction 1
ACIL Allen Consulting (ACIL Allen) has been engaged by the Australian Energy Regulator (AER) to
support the AER in estimating specific cost inputs required for the determination of Default Market
Offer (DMO) prices. Specifically, ACIL Allen is required to provide consultancy services to the AER
to estimate the underlying wholesale and environmental cost inputs to inform the determination for
2021-22 (DMO 3).
These estimates are to be based on the relevant cost drivers for a retailer supplying electricity to
residential and small business customers in non-price regulated jurisdictions (excluding Victoria).
ACIL Allen’s work is broadly divided into two phases:
— Phase 1: Review and assessment of methodology
― The services in this phase include reviewing the methodology used to estimate the
underlying wholesale and environmental cost inputs for the 2020-21 DMO (DMO 2), and
clearly set out any changes, refinements, or considerations to the existing methodology
for DMO 3. The deliverable in this phase was ACIL Allen’s methodology review report
which formed part of the Position Paper for DMO 3 (the Position Paper) published by the
AER.
— Phase 2: Estimating the underlying costs to inform the DMO 2021-22 determination
― The services in this phase include estimating the underlying cost inputs for the DMO 3
determination based on the methodology refined in Phase 1. The deliverables in this
phase form part of the draft DMO 3 prices (Draft Determination) and the final DMO prices
(Final Determination).
This report relates to Phase 2 of our engagement, and provides estimates of the wholesale energy,
environmental, and other costs for use by the AER in its Final Determination for DMO 3, using the
methodology proposed in our Phase 1 methodology review report, and including some refinements
to address stakeholder issues raised in submissions to the DMO 3 Position Paper.
The report is presented as follows:
— Chapter 2 summarises our methodology.
— Chapter 3 provides responses to submissions made by various stakeholders following the
release of the AER’s Draft Determination: Default Market Offer Prices 2021-22 (17 February
2021), where those submissions refer to the methodology used to estimate the cost of energy
in regulated retail electricity prices.
— Chapter 4 summarises our derivation of the energy cost estimates.
— Finally, Appendix A summarises our high-level comparison with the AEMC’s 2020 Residential
Electricity Price Trends Report released in December 2020.
Default Market Offer 2021-22 Wholesale energy and environment cost estimates for DMO 3
Final Determination 102 Overview of approach 2
2.1 Introduction
In determining the DMO, the Competition and Consumer (Industry Code – Electricity Retail)
Regulations 2019 (the Regulations) requires the AER to determine the annual consumption and
annual retail bill amounts based on the following principles and policy objectives:
— an electricity retailer should be able to make a reasonable profit in relation to supplying electricity
in the region
— to reduce the unjustifiably high level of standing offer prices for consumers who are not engaged
in the market
— to set DMO prices at a level that provides consumers and retailers with incentives to participate
in the market
— to allow retailers to recover their efficient costs in servicing customers.
The overall objective of estimating the DMO is to ensure that the projected change in costs from one
determination to the next is as accurate as possible.
With the objectives of the DMO in mind, presented in this chapter is a summary of the methodology
used for DMO 3, including refinements based on stakeholder feedback from the Position Paper.
2.2 Components of the total energy cost estimates
ACIL Allen is required to estimate the Total Energy Costs (TEC) component of the DMO. Total Energy
Costs comprise of the following components (as shown in Figure 2.1):
— Wholesale energy costs (WEC) for various demand profiles
— Environmental Costs: costs of complying with state and federal government policies, including
the Renewable Energy Target (RET).
— Other wholesale costs: including National Electricity Market (NEM) fees, ancillary services
charges, Reliability and Emergency Reserve Trader (RERT) costs, and costs of meeting
prudential requirements.
— Energy losses incurred during the transmission and distribution of electricity to customers.
— For the purpose of the DMO, the AER has requested ACIL Allen to present the estimates of the
TEC components in two broad groupings – Wholesale and Environmental – in the manner shown
in Figure 2.1.
Default Market Offer 2021-22 Wholesale energy and environment cost estimates for DMO 3
Final Determination 11Figure 2.1 Components of DMO and TEC
Source: ACIL Allen
2.3 Methodology
The ACIL Allen methodology adopted for DMO 3 (and DMO 2) estimates costs from a retailing
perspective. This involves estimating the energy and environmental costs that an electricity retailer
would be expected to incur in a given determination year. The methodology includes undertaking
wholesale energy market simulations to estimate expected spot market costs and volatility, and the
hedging of the spot market price risk by entering into electricity contracts with prices represented by
the observable futures market data. Environmental and other energy costs are added to the wholesale
energy costs and the total is then adjusted for network losses.
2.3.1 Estimating the WEC - market-based approach
Energy purchase costs are incurred by a retailer when purchasing energy from the NEM spot market
to satisfy their retail load. However, given the volatile nature of wholesale electricity spot prices, which
is an important and fundamental feature of an energy-only market (i.e. a market without a separate
capacity mechanism), and that retailers charge their customers based on fixed rate tariffs (for a given
period), a prudent retailer is incentivised to hedge its exposure to the spot market.
Default Market Offer 2021-22 Wholesale energy and environment cost estimates for DMO 3
Final Determination 12Hedging can be achieved by a number of means – a retailer can own or underwrite a portfolio of
generators (the gen-tailer model), enter into bilateral contracts directly with generators, purchase over
the counter (OTC) contracts via a broker, or take positions on the futures market. Typically, a retailer
will employ a number of these hedging approaches. In addition, a retailer may choose to leave a
portion of their load exposed to the spot market.
At the core of the market-based approach is an assumed contracting strategy that an efficient retailer
would use to manage its electricity market risks. Such risks and the strategy used to mitigate them are
an important part of electricity retailing. The contracting strategy adopted generally assumes that the
retailer is partly exposed to the wholesale spot market and partly protected by the procured contracts.
The methodology simulates the cost of hedging by building up a portfolio of hedges consisting of base
and peak swap contracts, and cap contracts (and this is discussed in more detail below).
Conceptually, in a given half-hourly settlement period, the retailer:
— Pays AEMO the spot price multiplied by the demand.
— Pays the contract counterparty the difference between the swap contract strike price and the
spot price, multiplied by the swap contract quantity. This is the case for the base swap contract
regardless of time of day, and for the peak swap contract during the periods classified as peak. If
the spot price is greater than the contract strike price than the counter party pays the retailer.
— Pays the contract counterparty the cap price multiplied by the cap contract quantity.
— If the spot price exceeds $300/MWh, receives from the contract counter party the difference
between the spot price and $300, multiplied by the cap contract quantity.
Figure 2.2 shows an illustrative example of a hedging strategy for a given load across a 24-hour
period.
In this example:
— The demand profile:
― Varies between 400 MW and 1,300 MW.
― Peaks between 6 pm and 10 pm, with a smaller morning peak between 9 am and 11 am.
— The hedging strategy:
― Consists of 375 MW of base swaps, 100 MW of peak period swaps, and 700 MW of caps.
― Means that demand exceeds the total of the contract cover between 7 pm and 10 pm by
about 100 MW. Hence during these periods, the retailer is exposed to the spot price for 100
MW of the demand, and the remaining demand is covered by the hedges.
― Demand is less than the hedging strategy for all other hours. Hence, during these periods
the retailer in effect sells the excess hedge cover back to the market at the going spot price
(and if the spot price is less than the contract price this represents a net cost to the retailer,
and vice versa).
Default Market Offer 2021-22 Wholesale energy and environment cost estimates for DMO 3
Final Determination 13Figure 2.2 Illustrative example of hedging strategy, prices and costs
Total contract position: Net long Net short
1,400
Swap contract position: Net short Net long Net short
1,200
1,000
800
(MW)
600
400
200
0
1 3 5 7 9 11 13 15 17 19 21 23
Base swap contract cover (MW) Peak swap contract cover (MW)
Cap contract cover MW Demand (MW)
Cap strike price: < spot > spot < spot
Base Swap contract price: < spot > spot
Peak Swap contract price: < spot > spot
$400.00
$350.00
$300.00
$250.00
($/MWh)
$200.00
$150.00
$100.00
$50.00
$0.00
1 3 5 7 9 11 13 15 17 19 21 23
Spot price Base swap contract price Peak swap contract price
Cap strike price Cap price
$500,000
$400,000
$300,000
$200,000
($)
$100,000
$0
1 3 5 7 9 11 13 15 17 19 21 23
$100,000
$200,000
Spot payment to AEMO Swap difference payment (Base)
Swap difference payment (Peak) Cap payout
Cap premium payment Total hedged cost (payments less payouts)
Source: ACIL Allen
With this in mind, the WEC for a given demand profile for a given year is therefore generally a function
of four components, the:
1. demand profile
2. wholesale electricity spot prices
3. forward contract prices
4. hedging strategy.
Default Market Offer 2021-22 Wholesale energy and environment cost estimates for DMO 3
Final Determination 14Use of financial derivatives in estimating the WEC
As discussed above, retailers purchase electricity in the NEM at the spot price and use a number of
strategies to manage their risk. Market-based approaches adopted by regulators for estimating the
WEC make use of financial derivative data given that it is readily available and transparent. This is not
to say regulators are of the view that retailers only use financial derivatives to manage risk – it simply
reflects the availability and transparency of data.
Some retailers also use vertical integration and Power Purchase Agreements (PPAs) to manage their
risk. However, the associated costs, terms and conditions of these approaches are not readily
available in the public domain. Further, smaller retailers may not be in a position to use vertical
integration or PPAs and hence rely solely on financial derivatives.
Additionally, the value of long-dated assets associated with vertical integration and PPAs is
determined by conditions in the market at a given point in time. The price in a PPA or the annualised
historical cost of generation reflects the long term value of the generation anticipated at the time of
commitment when the investor was faced with a variety of uncertain futures. As a consequence, there
are considerable difficulties in using the price of PPAs or the annualised historical cost of generation
as a basis for estimating current hedging costs.
Use of load profiles in estimating the WEC
Our scope of work requires the estimation of the WEC for residential and small business load in each
distribution zone.
The following load profiles are required for the given determination year:
— System load for each region of the NEM (that is, the load to be satisfied by scheduled and semi-
scheduled generation) – used to model the regional wholesale electricity spot prices.
— Net System Load Profiles (NSLPs) and controlled load profiles (CLPs) - used to model the cost
of procuring energy for residential and small business customers for the following:
― New South Wales: Ausgrid, Endeavour, Essential
― Queensland: Energex
― South Australia: SAPN.
Historical load data is available from AEMO – as shown in Table 2.1.
The NSLP is used as the representative load profile for residential and small business customers
because the majority of residential and small business customers in New South Wales, Queensland,
and South Australia, are on accumulation (or basic) meters. And those customers with digital (or
interval) meters are in the minority. Therefore, a single WEC is estimated for residential and small
business customers within each distribution zone.
ACIL Allen investigated estimating separate WECs for residential and small business customers as
part of its methodology review and reached the conclusion that splitting the load into residential and
non-residential customers does not improve accuracy and is largely arbitrary. It ignores, and does not
account for, the large variety of non-residential load profile shapes that exist and the different mixes of
these profiles that each retailer may have, and for some non-residential customers their profile may
well be closer related to a residential profile given the nature of their business and hours of operation.
Nor does it account for the difference in residential customers with and without rooftop solar PV –
which are more likely to have very different load profiles.
Default Market Offer 2021-22 Wholesale energy and environment cost estimates for DMO 3
Final Determination 15Table 2.1 Sources of load data
Region Distribution Load Type Load Name Source
Network
New South Wales NA System Load NSW1 MMS
Ausgrid NSLP NSLP,ENERGYAUST MSATS
Ausgrid CLP CLOADNSWCE,ENERGYAUST MSATS
Ausgrid CLP CLOADNSWEA,ENERGYAUST MSATS
Endeavour NSLP NSLP,INTEGRAL MSATS
Endeavour CLP CLOADNSWIE,INTEGRAL MSATS
Essential NSLP NSLP,COUNTRYENERGY MSATS
Essential CLP CLOADNSWCE,COUNTRYENERGY MSATS
Queensland NA System Load QLD1 MMS
Energex NSLP NSLP,ENERGEX MSATS
Energex CLP QLDEGXCL31,ENERGEX MSATS
Energex CLP QLDEGXCL33,ENERGEX MSATS
South Australia NA System Load SA1 MMS
SAPN NSLP NSLP,UMPLP MSATS
Source: AEMO
Key steps to estimating the WEC
The key steps to estimating the WEC for a given load and year are:
1. Forecast the hourly load profile – generally as a function of the underlying demand forecast as
published by the Australian Energy Market Operator (AEMO), and accounting for further uptake
of rooftop solar PV. A stochastic demand and renewable energy resource model to develop 50
weather influenced annual simulations of hourly demand and renewable energy resource traces
which are developed so as to maintain the appropriate correlation between the various regional
and NSLP/CLP demands, and various renewable energy zone resources.
2. Use a stochastic availability model to develop 11 annual simulations of hourly thermal power
station availability.
3. Forecast hourly wholesale electricity spot prices by using ACIL Allen’s proprietary wholesale
energy market model, PowerMark. PowerMark produces 550 (i.e. 50 by 11) simulations of hourly
spot prices of the NEM using the stochastic demand and renewable energy resource traces and
power station availabilities as inputs.
4. Estimate the forward contract price using ASX Energy contract price data, verified with broker
data. The book build is based on the observed trade volumes and the price estimate is equal to
the trade volume weighted average price.
5. Adopt an assumed hedging strategy – the hedging strategy represents a strategy that a retailer
would undertake to hedge against risk in the spot price in a given year. It is generally assumed
that a retailer’s risk management strategy would result in contracts being entered into
progressively over a two- or three-year period, resulting in a mix (or portfolio) of base (or flat),
peak and cap contracts.
6. Calculate the spot and contracting cost for each hour and aggregate for each of the 550
simulations – for a given simulation, for each hour calculate the spot purchase cost, contract
Default Market Offer 2021-22 Wholesale energy and environment cost estimates for DMO 3
Final Determination 16purchase costs, and different payments, and then aggregate to get an annual cost which is
divided by the annual load to get a price in $/MWh terms.
The above steps produce a distribution of estimated WECs which vary due to variations in demand,
and spot prices. Wholesale electricity spot prices will vary depending on the actual load (which will
vary based on weather conditions), renewable generator resource (which also varies with weather
outcomes), and availability of thermal power stations. It is this variability, and associated risk, that
incentivises retailers to enter into hedging arrangements. However, this variability also changes the
values of the spot purchase costs and difference payments incurred by a retailer (even though the
contract prices and strategy are fixed).
The distribution of outcomes produced by the above approach is then analysed to provide a risk
assessed estimate of the WEC. ACIL Allen adopts the 95th percentile WEC from the distribution of
WECs as the final estimate. In practice, the distribution of WECs from the simulations exhibits a
relatively narrow spread when compared to estimates based on the load being 100 per cent exposed
to the spot market, which is to be expected since they are hedged values. Choosing the 95th percentile
reduces the risk of understating the true WEC, since only five per cent of WEC estimates exceed this
value.
Choosing the appropriate hedging strategy
As mentioned above, multiple hedging strategies are tested by varying the mix of base/peak/cap
contracts for each quarter. This is done by running the hedge model for a large number1 of simulations
for each strategy and analysing the resulting distribution of WECs for each given strategy – and in
particular, keeping note of the 95th percentile WEC for each strategy. We select a strategy that is
robust and plausible for each load profile, and minimises the 95th percentile WEC, noting that:
— some strategies may be effective in one year but not in others
— in practice, retailers do not necessarily make substantial changes to the strategy from one year
to the next
— our approach is a simplification of the real world, and hence we are mindful not to over-engineer
the approach and give a false sense of precision.
The hedging strategy is not necessarily varied for every determination year – it tends to change when
there is a sufficient change in either the shape of the load profile (for example, due to the continued
uptake of rooftop PV) or a change in the relationship between contract prices for the different contract
products (for example, in some years base contract prices increase much more than peak contract
prices, which can influence the strategy).
Demand-side settings
The seasonal peak demand and annual energy forecasts for the regional demand profiles are
referenced to the neutral scenarios from the latest available Electricity Statement of Opportunities
(ESOO) published by AEMO and take into account past trends and relationships between the NSLPs
and the corresponding regional demand.
It is usual practice to use a number of years of historical load data together with the P10, P50 and P90
seasonal peak load, and energy forecasts from the AEMO neutral scenario to produce multiple
simulated representations of the hourly load profile for the given determination year using a Monte
Carlo analysis. These multiple simulations include a mix of mild and extreme representations of
demand – reflecting different annual weather conditions (such as mild, normal and hot summers).
1When testing the different strategies, we do not run the full set of 550 simulations as this is time prohibitive.
However, we run the full set of 550 simulations once the strategy has been chosen.
Default Market Offer 2021-22 Wholesale energy and environment cost estimates for DMO 3
Final Determination 17The key steps in developing the demand profiles are:
— The half-hourly demand profiles of the past three years are obtained. The profiles are adjusted
by ‘adding’ back the estimated rooftop PV generation for the system demand and each NSLP
(based on the amount of rooftop PV in each distribution network).
— A stochastic demand model is used to develop about 50 weather influenced simulations of hourly
demand traces for the NSLPs, each regional demand, and each renewable resource –
importantly maintaining the correlation between each of these variables. The approach takes the
past three years of actual demand data, as well as the past 50 years of weather data and uses a
matching algorithm to produce 50 sets of weather-related demand profiles of 17,520 half-hourly
loads. This approach does not rely on attempting to develop a statistical relationship between
weather outcomes and demand – instead, it accepts there is a relationship and uses a matching
algorithm to find the closest matching weather outcomes for a given day across the entire NEM
from the past three years to represent a given day in the past.
— The set of 50 simulations of regional system demands is then grown to the AEMO demand
forecast using a non-linear transformation so that the average annual energy across the 50
simulations equals the energy forecast, and the distribution of annual seasonal peak loads
across the 50 simulations generally matches the distribution of peak loads inferred by the P10,
P50 and P90 seasonal peaks from the AEMO demand forecast.
— A relationship between the variation in the NSLPs and the corresponding regional demand from
the past four years is developed to measure the change in NSLP as a function of the change in
regional demand. This relationship is then applied to produce 50 simulations of weather related
NSLP profiles of 17,520 half-hourly loads which are appropriately correlated with system
demand, but also exhibit an appropriate level of variation in the NSLP across the 50 simulations.
— The projected uptake of rooftop PV for the determination year is obtained (using our internal
rooftop PV uptake model).
— The half-hourly rooftop PV output profile is then grown to the forecast uptake and deducted from
the system demand and NSLPs.
Supply side settings
ACIL Allen maintains a Reference case projection of the NEM, which it updates each quarter in
response to supply changes announced in the market in terms of new investment, retirements, fuel
costs, and plant availability. In this analysis, for 2021-22 we use our December 2020 Reference case
projection settings which are closely aligned with AEMO’s Integrated System Plan (ISP) for the Draft
Determination, and our latest reference case available at the time for the Final Determination.
ACIL Allen incorporates changes to existing supply where companies have formally announced the
changes – including, mothballing, closure and change in operating approach. Near term new entrants
are included where the plants are deemed by ACIL Allen to be committed projects.
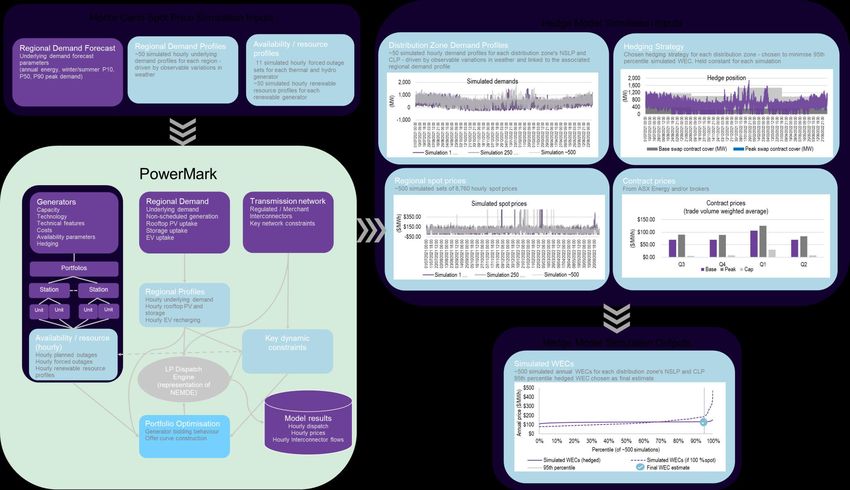
Summary infographic of the approach to estimate the WEC
Figure 2.3 provides an infographic type summary of the data, inputs, and flow of the market-based
approach to estimating the WEC.
Default Market Offer 2021-22 Wholesale energy and environment cost estimates for DMO 3
Final Determination 18Figure 2.3 Estimating the WEC – market-based approach
Default Market Offer 2021-22 Wholesale energy and environment cost estimates for DMO 3 Final Determination 192.3.2 Other wholesale costs
Market fees and ancillary services costs
Market fees and ancillary service costs are estimated based on data and policy documents
published by AEMO.
NEM fees
NEM fees are payable by retailers to AEMO to cover operational expenditure, costs associated with
full retail contestability (FRC), and the Energy Consumers Australia (ECA).
The approach uses for estimating market fees is to make use of AEMO’s budget report. For the
most part, the budget report includes forecasts of fees for four or more years.
It is worth noting that in previous determinations, the National Transmission Planner (NTP) was
included in this cost category. However, the recovery of this item has recently been transferred
from AEMO to each of the Transmission Network Service Providers (TNSPs) directly, forming part
of the TUOS charge. Therefore, the NTP cost is excluded from our analysis for 2021-22.
Ancillary services charges
Ancillary services charges cover the costs of services used by AEMO to manage power system
safety, security and reliability. AEMO recovers the costs of these services from market participants.
These fees are published by AEMO on its website on a weekly basis.
The approach uses for estimating ancillary services costs is to average the most recent 52 weeks
of costs to recover ancillary services from customers, which is published on the AEMO website.
To date ACIL Allen has taken the approach of using the ancillary service costs data published by
AEMO, and summing the costs across the NEM and then dividing by the total energy across the
NEM to get a cost per MWh that is the same in each region. Although this approach is reasonable
when there is no islanding of the regions, it is likely that in the future there will be more islanding
events as a result of the large investment in semi-scheduled renewable energy projects which may
well result in price separation of ancillary services.
ACIL Allen continues to use the same data set, but for the 2021-22 determination derives these
costs on a region-by-region basis.
Prudential costs
Prudential costs, for AEMO, as well as representing the capital used to meet prudential
requirements to support hedging take into account:
— the AEMO assessed maximum credit limit (MCL)
— the future risk-weighted pool price
— participant specific risk adjustment factors
— AEMO published volatility factors
— futures market prudential obligation factors, including:
— the price scanning range (PSR)
— the intra month spread charge
— the spot isolation rate.
Prudential costs are calculated for each NSLP. The prudential costs for the NSLP are then used as
a proxy for prudential costs for the controlled load profiles.
Default Market Offer 2021-22 Wholesale energy and environment cost estimates for DMO 3
Final Determination 20AEMO publishes volatility factors two years in advance. Similarly, ASX Energy publishes initial
margin parameters two years in advance.
AEMO prudential costs
AEMO calculates a maximum credit limit for each counterparty in order to determine the
requirement for any or a combination of:
— bank guarantees
— reallocation certificates
— prepayment of cash.
There is no fundamental requirement to reallocate prudential obligations – it is a retailer’s choice to
do so. Assuming no reallocation and no vertical integration (either owned generation or PPAs), a
retailer is required to provide suitable guarantees to the AEMO assessed maximum credit limit
(MCL) which is calculated as follows:
MCL = OSL + PML
Where for the Summer (December to March), Winter (May to August) and Shoulder (other months):
OSL = (Average daily load x Average future expected spot price x Participant Risk Adjustment
Factor * OS Volatility factor x (GST + 1) x 35 days
PML = (Average daily load x Average future expected spot price x Participant Risk Adjustment
Factor * PM Volatility factor x (GST + 1) x 7 days
The cost of funding a bank guarantee for the MCL associated with the single MWh is assumed to
be a 2.5 percent annual charge for 42 days or 2.5%*(42/365) = 0.288 percent.
Hedge prudential costs
ACIL Allen relies on the futures market to determine hedging costs. The futures market includes
prudential obligations by requiring entities to lodge initial margins (we assume cash) when
contracts are purchased or sold. We understand that the cash that is lodged as an initial margin
receives a money market related return which offsets some of the funding costs. The current
money market rate is 0.10 per cent. Additional margin calls may apply where contracts move
unfavourably for the purchaser or seller. However, as these may be favourable or unfavourable, we
have assumed that they average out over time.
We understand that the initial margin is set based on three parameters being:
— the price scanning range (PSR) expressed as a percentage of the contract face value and is
set for each of the base, peak and cap contract types
— the intra monthly spread charge and is set for each of the base, peak and cap contract types
— the spot isolation rate and is set for each of the base, peak and cap contract types.
Using the annual average futures price and applying the above factors gives an average initial
margin for each quarter. This is divided by the average hours in the given quarter. Then applying
an assumed funding cost but adjusted for an assumed return on cash lodged with the clearing
results in the prudential cost per MWh for each contract type.
Reliability and Emergency Reserve Trader (RERT)
Given the RERT is called upon under extreme circumstances only, ACIL Allen is of the opinion that
it is difficult to project into the future. Although it may be possible to make use of previous costs of
the RERT and relate these to AEMO’s projection of USE in the ESOO, there is little data available
at this point to take this approach.
Default Market Offer 2021-22 Wholesale energy and environment cost estimates for DMO 3
Final Determination 21Therefore, as with the ancillary services, we use the RERT costs as published by AEMO for the 12-
month period prior to the Final Determination. ACIL Allen expresses the cost based on energy
consumption, by taking the reported cost in dollar terms from AEMO for the given region and
prorating the cost across all consumers in the region on a consumption basis.
Retailer Reliability Obligation
The Retailer Reliability Obligation (RRO) started on 1 July 2019 to help manage the risk of
declining reliability of supply in response to the recent large amounts of investment in intermittent
renewable projects coupled with recent and potential closures of thermal power stations.
If the RRO is triggered for a given quarter and region of the NEM, then retailers need to secure
sufficient qualifying contracts to cover their share of a one-in-two-year peak demand.
The RRO has not been triggered for 2021-22, and hence we are not required to account for the
RRO in the wholesale costs for 2021-22. However, it is worth noting that this cost component
should be included as part of the wholesale cost if the RRO is triggered in future determinations.
We think that entering into a mix of firm base, peak, and cap contracts satisfies the qualifying
contract definition. As part of the current WEC estimation methodology, an algorithm is run to
determine the optimal hedge cover for a given distribution zone for each quarter of the given
determination period.
The total optimal cover is expressed as a percentage of the P50 annual peak demand for the given
quarter – which is analogous to a one-in-two-year peak demand referred to in the RRO.
Our proposed approach to account for the triggering of the RRO in the estimated WEC is:
— If the overall level of the optimal contract cover is less than 100 per cent of the P50 annual
peak demand, then increase the overall level of contract cover to 100 per cent. This will result
in an increase in the WEC value since the cost of the additional contracts will be included.
— If the overall level of the optimal contract cover is equal to or greater than 100 per cent of the
P50 annual peak demand then no change is required, and hence the RRO has no impact on
the WEC.
2.3.3 Environmental costs
Large-scale Renewable Energy Target (LRET)
By 31 March each compliance year, the Clean Energy Regulator (CER) publishes the Renewable
Power Percentage (RPP), which translates the aggregate LRET target into the number of Large-
scale Generation Certificates (LGCs) that liable entities must purchase and acquit under the
scheme.
The RPP is determined ex-ante by the CER and represents the relevant year’s LRET target (in
fixed GWh terms) as a percentage of the estimated volume of liable electricity consumption
throughout Australia in that year.
The estimated cost of compliance with the LRET scheme is derived by multiplying the RPP and the
determined LGC price to establish the cost per MWh of liable energy supplied to customers. Since
the cost is expressed as a cost per MWh, it is applicable across all retail electricity tariffs.
Market-based approach
A market-based approach is used to determine the price of a LGC, which assumes that an efficient
and prudent electricity retailer builds up LGC coverage prior to each compliance year.
Default Market Offer 2021-22 Wholesale energy and environment cost estimates for DMO 3
Final Determination 22This approach involves estimating the average LGC price using LGC forward prices for the two
relevant calendar compliance years in the determination period. Specifically, for each calendar
compliance year, the trade-weighted average of LGC forward prices since they commenced trading
is calculated.
To estimate the costs to retailers of complying with the LRET for 2021-22, ACIL Allen uses the
following elements:
— The average of the trade-weighted average of LGC forward prices for 2021 and 2022 from
brokers TFS
— the Renewable Power Percentages (RPPs) for 2021, published by the CER2
— estimated RPP values for 20223.
Figure 2.4 Steps to estimate the cost of LRET
Source: ACIL Allen
Small-scale Renewable Energy Scheme (SRES)
Similar to the LRET, by 31 March each compliance year, the CER publishes the binding Small-
scale Technology Percentage (STP) for a year and non-binding STPs for the next two years.
2It is worth noting that the 2021 RPP changed slightly between the 2020-21 Final Determination and the
2021-22 Draft Determination due to a slight revision in the estimated electricity acquisitions.
3The estimated RPP value for 2022 is estimated using ACIL Allen’s estimate of liable acquisitions and the
CER-published mandated LRET targets for 2022.
Default Market Offer 2021-22 Wholesale energy and environment cost estimates for DMO 3
Final Determination 23The STP is determined ex-ante by the CER and represents the relevant year’s projected supply of
Small-scale Technology Certificates (STCs) as a percentage of the estimated volume of liable
electricity consumption throughout Australia in that year.
The estimated cost of compliance with the SRES is derived by multiplying the estimated STP value.
To estimate the costs to retailers of complying with the SRES, ACIL Allen uses the following
elements:
— the binding Small-scale Technology Percentage (STP) for 2021 published by the CER
— an estimate of the STP value for 20224
— CER clearing house price5 for 2021 and 2022 for Small-scale Technology Certificates (STCs)
of $40/MWh.
Figure 2.5 Steps to estimate the cost of SRES
Source: ACIL Allen
4 The STP value for 2022 is estimated using estimates of STC creations and liable acquisitions in 2022,
taking into consideration the CER’s non-binding estimate.
5 Although there is an active market for STCs, ACIL Allen is not compelled to use market prices. This is
mainly because historical prices might not be the best indicators of future prices as the market is designed to
clear every year – so in theory prices could be $40 or at least very close to it. This assumes that the CER
provides an accurate forecast of created certificates underpinning the STP for the next year.
Default Market Offer 2021-22 Wholesale energy and environment cost estimates for DMO 3
Final Determination 242.3.4 Other environmental costs
New South Wales Energy Savings Scheme (ESS)
The Energy Savings Scheme (ESS) is a New South Wales Government program to assist
households and businesses reduce their energy consumption. It is a certificate trading scheme in
which retailers are required to fund energy efficiency through the purchase of certificates.
To estimate the cost of complying with the ESS, ACIL Allen uses the following elements:
— Energy Savings Scheme Target for 2021 and 2022 of 8.5 and 96 per cent respectively, as
published by IPART
— Historical Energy Savings Certificate (ESC) market forward prices for 2021 and 2022 from
brokers TFS.
South Australia Retailer Energy Efficiency Scheme (REES)
The Retailer Energy Efficiency Scheme (REES) is a South Australian Government energy
efficiency scheme that provides incentives for South Australian households and businesses to save
energy. It does this via energy efficiency and audit targets to be met by electricity and gas retailers
with customers in South Australia.
The targets are set by the Essential Services Commission of South Australia (ESCOSA). REES
commenced in 2009 and was set to operate until 31 December 2020.7 However, in late 2019, a
review into the scheme recommended it be extended to 31 December 20308, and hence it was
included in DMO 2, and is included in DMO 3 for 2021-22
The cost of the REES is recovered directly through retail electricity tariffs, and therefore should be
considered as part of the environment cost component – but care needs to be taken that these
costs are not double counted in the retail cost component.
In the AEMC’s 2018 price trends methodology report, the cost of the REES was sourced using data
from the relevant jurisdiction, although there is no link to the exact location of this data.9 The
estimated cost was $2.50/MWh. The same cost was also report in the 201910 and 202011 price
trend reports.
In the AEMC’s report, the estimated cost of REES, which is expected to be generally flat in nominal
terms over the reporting period, comprises less than 10 per cent of the cost of environmental
policies, and less than one per cent of the total retail bill in South Australia during the four-year
reporting period.
6The Draft Determination used 8.5 per cent for 2022, but the New South Wales Government has since
updated the target and the legislation was amended to increase the targets by 0.5 per cent annually from
2022 to 2025 and extends the scheme to 2050 – as part of the Energy Security Safeguard.
7https://www.escosa.sa.gov.au/ArticleDocuments/214/20190627-REES-
RegulatoryFrameworkInformationSheet.pdf.aspx?Embed=Y
8 https://www.energymining.sa.gov.au/__data/assets/pdf_file/0008/356228/2019_REES_Review_Report.pdf
9 Table 8.5, page 49 at
https://www.aemc.gov.au/sites/default/files/2018-
12/AEMC%202018%20Residential%20Electricity%20Price%20Trends%20Methodology%20Report%20-
%20CLEAN.pdf
10https://www.aemc.gov.au/sites/default/files/2019-
12/2019%20Residential%20Electricity%20Price%20Trends%20final%20report%20FINAL.pdf
11 https://www.aemc.gov.au/market-reviews-advice/residential-electricity-price-trends-2020
Default Market Offer 2021-22 Wholesale energy and environment cost estimates for DMO 3
Final Determination 25You can also read