Farm Safety-Net Payments Under the 2014 Farm Bill: Comparison by Program Crop - Randy Schnepf Specialist in Agricultural Policy - Federation of ...
←
→
Page content transcription
If your browser does not render page correctly, please read the page content below
Farm Safety-Net Payments Under the 2014
Farm Bill: Comparison by Program Crop

Randy Schnepf
Specialist in Agricultural Policy

August 11, 2017

                                    Congressional Research Service
                                                          7-5700
                                                     www.crs.gov
                                                           R44914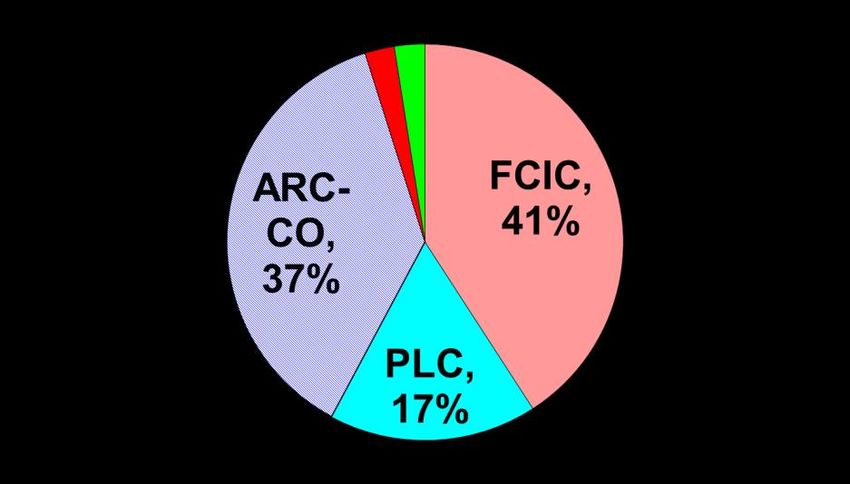
Farm Safety-Net Payments Under the 2014 Farm Bill: Comparison by Program Crop

Summary
The 2014 farm bill (Agricultural Act of 2014, P.L. 113-79) authorizes farm safety-net programs
for the five crop years of 2014 through 2018. This includes revenue support for 20 “covered
commodities” under either the Agricultural Risk Coverage (ARC) program or the Price Loss
Coverage (PLC) program and interim financing and floor price support for an expanded list of 24
“loan commodities” under the Marketing Assistance Loan (MAL) program. Outlays under the
MAL, ARC, and PLC programs are funded by the U.S. Department of Agriculture’s (USDA’s)
Commodity Credit Corporation (CCC).
In addition, federally subsidized crop insurance is available for over 100 agricultural
commodities—including both covered and loan commodities. Federal crop insurance is
permanently authorized by the Federal Crop Insurance Act (7 U.S.C. 1501 et seq.) but is
periodically modified by new farm bill legislation. The principal subsidy component of federal
crop insurance is premium subsidies that pay for an average of 62% of the cost of buying an
insurance policy since 2014. Premium subsidies are funded by USDA’s Federal Crop Insurance
Corporation (FCIC).
Through the first three years of the 2014 farm bill (2014 through 2016), USDA has spent over
$38 billion on commodity-specific farm program outlays. Annually, commodity-specific outlays
are estimated at $12.7 billion per year, including $7.5 billion for CCC programs and $5.2 billion
in FCIC crop insurance premium subsidies. When farm program payments are linked to specific
crops, they can influence relative market incentives and resource allocations. Furthermore,
significant differences in spending across program crops may have regional or geographic
implications.
This report looks at available CCC and FCIC data for the major program crops and compares
relative support using several different measures: absolute payments, payments per acre,
payments as a share of the value of production, and payments as a share of the cost of production.
In addition, price and income support levels are compared to market prices. By all of these
measures, there has been substantial variation in relative support across program crops. Annual
corn payments account for 46% of all CCC and FCIC commodity-specific outlays; however, corn
also has the most planted acres and the largest annual value of production. When payments are
compared per acre, and as a share of either the value or the cost of production for each crop, then
peanuts and rice receive higher levels of support than do other program crops. Also significant is
the absence of any net program outlays for the U.S. dairy sector under the 2014 farm bill.
One particular analytical method for comparing price-protection levels across program crops
involves PLC reference prices. PLC reference prices for each commodity are adjusted such that
35%, 40%, or 45% of monthly farm price observations fall below the adjusted reference price
during the January 2008 through May 2017 period. The choice of these reference levels is
arbitrary but facilitates comparison. Important differences in support levels emerge. Peanuts and
cottonseed (included for comparative purposes as a hypothetical program crop) receive
significantly higher price protection levels compared to the other program crops. Canola and
sorghum also have above-average support levels relative to the remaining program crops. In
contrast, soybeans and pulse crops receive lower levels of price protection.

Congressional Research Service
Farm Safety-Net Payments Under the 2014 Farm Bill: Comparison by Program Crop
Contents
Introduction ..................................................................................................................................... 1
Overview of U.S. Agricultural Sector ............................................................................................. 2
Why Examine Commodity-Specific Support? ................................................................................ 3
Substantial Funding Has Supported the Farm Safety Net ......................................................... 3
Public vs. Private Resource Allocation ..................................................................................... 4
Regional Differences in Agricultural Activities ........................................................................ 5
Commodity-Specific Farm Safety-Net Programs............................................................................ 5
Commodity-Specific CCC Support ........................................................................................... 6
Coupled Price Protection: Marketing Assistance Loan (MAL) Program ........................... 6
Decoupled Revenue Support: ARC and PLC Programs ..................................................... 7
Cotton-Specific Programs ................................................................................................... 8
Dairy Programs ................................................................................................................... 9
Sugar ................................................................................................................................... 9
Agricultural Commodities Without CCC Program Support ............................................. 10
Commodity-Specific FCIC Support ........................................................................................ 10
Comparison of Farm Safety-Net Program Outlays ........................................................................ 11
Program-Specific Outlays ....................................................................................................... 13
Commodity-Specific Outlays .................................................................................................. 15
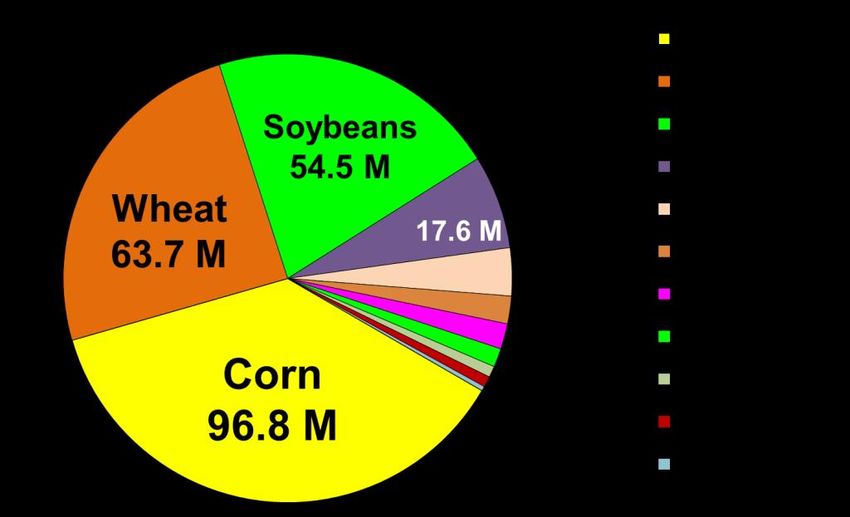
Production Characteristics of Major Program Commodities ............................................ 15
Comparison of Base Acres and Planted Acres .................................................................. 17
Comparison of Outlays by Commodity ............................................................................ 18
Support Levels Compared to Market Prices .................................................................................. 24
Support Levels as a Share of Average Farm Prices ................................................................. 25
Measuring Price Protection: January 2008 to May 2017 ........................................................ 27
Hypothetical Equity Adjustments to Program Parameters ...................................................... 29
Hypothetical 20%-, 25%-, and 30%-Price Protection MAL Loan Rates .......................... 29
Hypothetical 35%-, 40%-, and 45%-Price Protection PLC Reference Prices .................. 29
Conclusion .............................................................................................................................. 31
Figures
Figure 1. USDA Farm Safety-Net Total Outlays, 1996 to 2017 ..................................................... 11
Figure 2. Commodity-Specific Farm Safety-Net Outlays, 1996 to 2017 ...................................... 12
Figure 3. Index of Monthly Average Farm-Prices Received (2011 = 100) ................................... 13
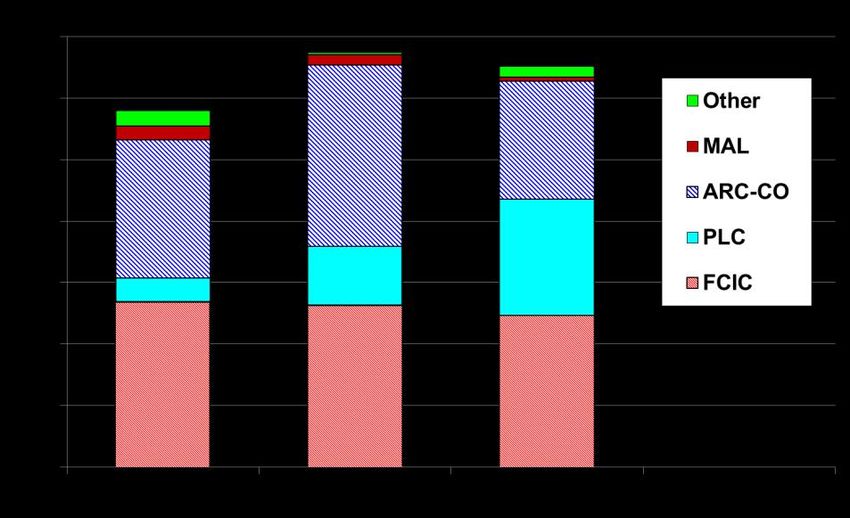
Figure 4. Commodity-Specific Farm Safety-Net Outlays by Program ......................................... 14
Figure 5. Commodity-Specific Outlay Shares by Program ........................................................... 14
Figure 6. Share of Commodity-Specific Outlays by Commodity ................................................. 15
Figure 7. Value of Production by Commodity ............................................................................... 16
Figure 8. Output Value per Harvested Acre by Commodity .......................................................... 16
Figure 9. Base versus Planted Acres, by Commodity.................................................................... 17
Figure 10. Base Acres by Commodity, 2014 Farm Bill................................................................. 18
Figure 11. CCC and FCIC Outlays by Commodity ....................................................................... 19
Figure 12. CCC and FCIC Outlays per Planted Acre by Commodity ........................................... 20
Congressional Research Service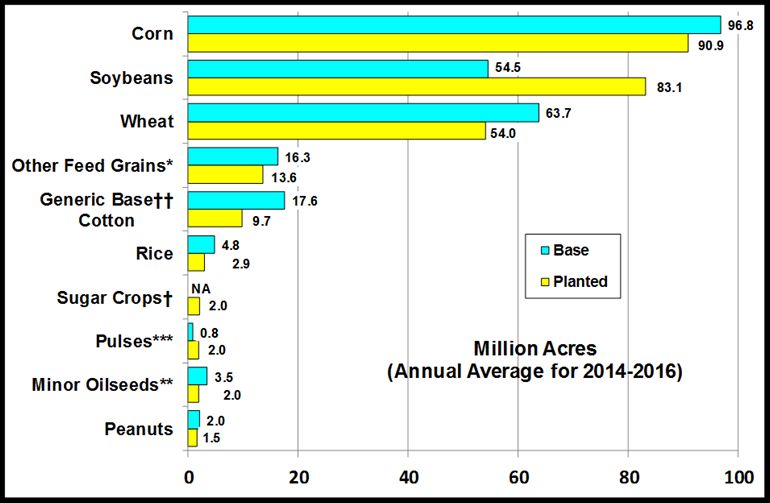
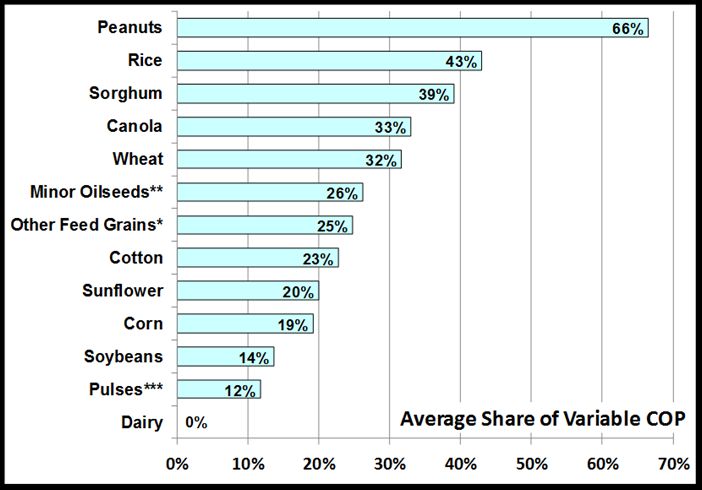
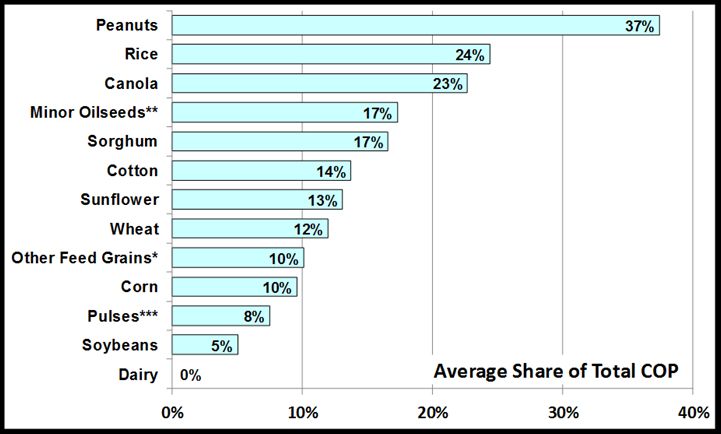
Farm Safety-Net Payments Under the 2014 Farm Bill: Comparison by Program Crop

Figure 13. CCC and FCIC Outlays as Share of Production Value by Commodity ....................... 20
Figure 14. CCC and FCIC Outlays as Share of Variable COP by Commodity ............................. 23
Figure 15. CCC and FCIC Outlays as Share of Total COP by Commodity .................................. 23
Figure 16. MAL Loan Rates as a Percent of Average Farm Prices ............................................... 25
Figure 17. PLC Reference Price as a Percent of Average Farm Prices ......................................... 26
Figure 18. Frequency Monthly Farm Prices Are Below Support Levels Since 2008 .................... 28
Figure 19. Hypothetical Adjustments to Equalize MAL Loan Rates ............................................ 30
Figure 20. Hypothetical Adjustments to Equalize PLC Reference Prices ..................................... 30

Tables
Table 1. U.S. Farm Sector Cash Receipts by Agricultural Category ............................................... 2
Table 2. Comparison of MAL Program Loan Rates and Monthly Farm Prices, by
  Commodity ................................................................................................................................. 32
Table 3. Comparison of PLC Program Reference Prices and Monthly Farm Prices, by
  Commodity ................................................................................................................................. 33
Table 4. Farm Program Crop Production Data: Annual Averages for 2014 to 2016 ..................... 34
Table 5. Farm Prices, Market Loan Rates, and PLC Reference Prices ......................................... 35
Table 6. Annual Average Farm Support Outlays by Program and Commodity ............................. 36

Contacts
Author Contact Information .......................................................................................................... 37

Congressional Research Service
Farm Safety-Net Payments Under the 2014 Farm Bill: Comparison by Program Crop

Introduction
The U.S. Department of Agriculture (USDA) operates several programs that supplement the
incomes of farmers and ranchers in times of low farm prices and helps them to manage risks
associated with natural disasters and with variability in crop and pasture yields and commodity
prices. These programs—referred to as the “farm safety net”—include three components: federal
crop insurance, farm revenue support programs, and agricultural disaster assistance.1
Over the years substantial federal resources have been spent in support of the farm safety net.
Much of this spending has gone to a small group of field crops. Within this group of field crops,
there has been significant variation in both absolute and relative levels of historical farm support.
The 2014 farm bill (Agricultural Act of 2014, P.L. 113-79) changed the structure of several
safety-net programs;2 however, important differences in commodity-specific funding persist.
In their June 2017 baseline projections of USDA program outlays through 2027, the
Congressional Budget Office (CBO) projects disparities in payments and relative support levels
across program crops.3 CBO’s June projections are described in a lay-friendly study released by
farmdocdaily on July 14, 2017.4 In the farmdocdaily study, when combined farm safety-net
payments (excluding federal crop insurance premium subsidies) are expressed on a per-acre basis,
peanuts receive the highest support rate with an average of $288 per acre. Rice receives the
second-highest per-acre rate at $135 per acre. The average annual payment rate for all other
program crops is below $30 per acre.
The CBO projections are looking forward in years yet to come. In contrast, this report uses actual
historical data to construct a series of charts and tables that provide information on the
distribution of commodity-specific outlays under the farm safety-net programs of the 2014 farm
bill during its first three years of operation (2014 through 2016). This information is intended to
provide statistical context for evaluating the distribution of current farm program payments. This
report does not assess the merit or fairness of this distribution, nor does it evaluate the social
welfare outcome of federal farm payments.
The first section of this report briefly describes the U.S. agricultural sector relative to USDA farm
programs. The second section discusses why an understanding of commodity-specific support has
merit. The third section summarizes the specific federal programs involved in the farm safety
net—which crops are eligible for payments and whether payments are coupled with, or decoupled
from, actual production. The fourth section of this report uses a series of charts to compare
commodity-specific outlays that have occurred during the first three years of the 2014 farm bill
using several different measures. The final section compares the relative levels of market price
protection provided by marketing assistance loan rates and Price Loss Coverage (PLC) reference

1
  See CRS Report R43758, Farm Safety Net Programs: Background and Issues, coordinated by Randy Schnepf. While
many critics of farm subsidies take issue with what does and does not constitute a safety net and whether current farm
programs actually perform as such, the term safety net is used here for all farm commodity and risk management
programs as a catchall descriptor rather than as an assessment of the merits. The issue of how the current programs
perform as a “safety net” is explored in more detail in the section of this report entitled “
Hypothetical Equity Adjustments to Program Parameters.”
2
  For more information on specific farm commodity programs, see CRS Report R43448, Farm Commodity Provisions
in the 2014 Farm Bill (P.L. 113-79), coordinated by Randy Schnepf.
3
  CBO, June 2017 Baseline for Farm Programs, June 24, 2017.
4
  J. Coppess et al., “Reviewing the June 2017 CBO Baseline,” farmdocdaily, vol. 7, no. 127,
http://farmdocdaily.illinois.edu/2017/07/reviewing-the-june-2017-cbo-baseline.html.

Congressional Research Service                                                                                       1
Farm Safety-Net Payments Under the 2014 Farm Bill: Comparison by Program Crop

prices—all of which are fixed in statute—among program crops and relative to recent market
conditions. Although significant differences in support across program crops are revealed, this
report does not assess the merit or fairness of such differences. Several supplementary data tables
are included at the end of the report and referenced throughout the text.

Overview of U.S. Agricultural Sector
U.S. agricultural production value has averaged $385.1 billion during the first three years (2014
through 2016) of the 2014 farm bill (Table 1). Field crops eligible for USDA revenue support
programs (discussed later in this report) have accounted for $115.7 billion, or 30% of the total.
When combined with milk production—milk is eligible for potential federal payments under the
Margin Protection Program (MPP)—the average value of program commodity production is
$155.5 billion and represents 40.3% of U.S. agricultural production. The remaining nearly 60% of
U.S. agricultural production is not eligible for USDA revenue support programs but is potentially
eligible for either disaster assistance or crop insurance.

              Table 1. U.S. Farm Sector Cash Receipts by Agricultural Category
                      (Annual average values priced at farm-gate for crop years 2014-2016)
                                                                 Average Annual Value                     Share
                Commodity or Activity                                   ($ billions)                       (%)

Total Crop Production                                                      $194.9                          50.6%
Field Crops                                                                $120.4                          31.3%
Feed Grains: corn, sorghum, barley, and oats                                $59.7                          15.5%
Oil Crops: soybeans and other oilseeds                                      $39.8                          10.3%
Food Grains: wheat and rice                                                 $13.2                           3.4%
Cotton (lint and seed)                                                       $6.0                           1.6%
Tobacco                                                                      $1.8                           0.5%
Fruits, Tree Nuts, and Vegetables                                           $47.2                          12.3%
All Other Crop Production                                                   $27.3                           7.1%
Subset: Major Program    Cropsa                                            $115.7                         30.0%
Total Livestock Production                                                 $190.2                          49.4%
Cattle and Calves                                                           $75.8                          19.7%
Poultry and Eggs                                                            $45.4                          11.8%
Dairy                                                                       $39.8                          10.3%
Hogs                                                                        $22.4                           5.8%
Miscellaneous   Livestockb                                                   $6.9                           1.8%
Total Agricultural Production                                              $385.1                        100%

    Source: Calculations by CRS, using data from: USDA, Economic Research Service, “Farm Income and Wealth
    Statistics: Cash Receipts by Commodity,” as of February 7, 2017, https://www.ers.usda.gov/data-products/farm-
    income-and-wealth-statistics/data-files-us-and-state-level-farm-income-and-wealth-statistics/.
    Notes:
    a. A subset of Total Crop Production, “Major Program Crops” includes corn and other feed grains (sorghum,
          barley, and oats), wheat, rice, upland cotton, soybeans, peanuts, and other oilseeds (sunflower, flaxseed,

Congressional Research Service                                                                                         2
Farm Safety-Net Payments Under the 2014 Farm Bill: Comparison by Program Crop
canola, rapeseed, mustard, safflower, crambe, and sesame), pulse crops (dry peas, lentils, and large and small
chickpeas), and sugar crops (sugar beets and sugar cane).
b. Includes sheep, goats, and other minor livestock commodities.
Why Examine Commodity-Specific Support?
While federal agricultural policy may have specific national goals—such as ensuring abundant
agricultural output and safeguarding America’s agricultural resources—when the supporting
program outlays vary significantly across eligible crops, there is potential for unintended policy
consequences. In particular, when farm program payments are linked to specific crops, they can
influence relative market incentives and resource allocations. The stronger the payment-to-crop
linkage, the greater the potential for producers to alter their crop choices based on the relative
likelihood of program payments. Also, significant differences in support levels across program
crops may have strong regional or geographic implications, because not all agricultural activities
may be undertaken successfully in all agro-climatic settings, as these vary widely across the
United States.5 Finally, the size of annual U.S. farm program outlays increases the potential
severity of any unintended consequences.
Substantial Funding Has Supported the Farm Safety Net
Over the years, substantial federal resources have been spent under federal commodity programs.
Since U.S. farm support programs were first authorized in the 1930s, USDA’s Commodity Credit
Corporation (CCC)6 has provided over $500 billion in taxpayer dollars in support of farm
programs.7 Nearly $303 billion (or about 60%) of total CCC commodity support payments have
occurred since the 1996 farm bill (Federal Agriculture Improvement and Reform Act of 1996,
commonly referred to as the Freedom to Farm Act; P.L. 104-127) was signed into law, including
over $188 billion in payments to a select group of major field crops—feed grains (corn, sorghum,
barley, and oats), cotton, wheat, rice, soybeans, and peanuts.
The Federal Crop Insurance Act of 1980 (P.L. 96-365) created the current public-private
partnership between the federal government and private insurance companies and established
federal support for crop insurance that includes substantial premium subsidies.8 Under this
framework, private insurance companies deliver and service crop insurance policies that are
regulated and supported by USDA’s Federal Crop Insurance Corporation (FCIC).9 Since 1980, the
5
A region’s agro-climatic setting encompasses the physical characteristics of its climate and natural resource
endowment. Key characteristics include temperature, precipitation, sunlight, growing season, day length, latitude and
seasonal variations, soil types, topography, and elevation. These features determine the agronomic feasibility of various
agricultural activities such as crop or livestock production.
6
The CCC is a U.S. government-owned and -operated corporation, created in 1933, with broad powers to support farm
income and prices and to assist in the export of U.S. agricultural products. To this end, the CCC finances USDA’s farm
revenue support and export programs using its permanent authority to borrow up to $30 billion at any one time from the
U.S. Treasury. See CRS Report R44606, The Commodity Credit Corporation: In Brief, by Megan Stubbs.
7
CRS calculations based on farm income data through 2016 from the Economic Research Service (ERS), available at
https://www.ers.usda.gov/data-products/farm-income-and-wealth-statistics/. The $500 billion total represents all CCC
functions in support of production agriculture including various conservation payments, export programs, operating
expenses, etc., in addition to the commodity support programs examined in detail in this report.
8
For details, see CRS Report R40532, Federal Crop Insurance: Background, coordinated by Randy Schnepf.
9
The FCIC is a U.S. government-owned and -operated corporation created by the Agricultural Adjustment Act of 1938
(P.L. 75-430; §503) to promote the economic stability of agriculture through a sound system of crop insurance and to
provide the means for the research and experience helpful in devising and establishing such insurance. Management is
(continued...)
Congressional Research Service 3Farm Safety-Net Payments Under the 2014 Farm Bill: Comparison by Program Crop FCIC has paid over $80 billion in premium subsidies to support federal crop insurance policies. The traditional CCC farm program crops (cited in the previous paragraph) have been the beneficiaries of over 85% of federal crop insurance premium subsidies. Prior to the 2014 farm bill, agricultural disaster assistance programs were usually ad hoc (meaning both unanticipated and off-budget)10 and often targeted to the same set of crops covered by farm programs and crop insurance. From 1978 through 2013, USDA spent nearly $45 billion on various agricultural disaster assistance programs.11 The 2014 farm bill changed this approach and created a set of permanent agricultural disaster assistance programs that focus assistance on livestock, orchards, and vineyards rather than on the traditional farm program crops.12 Public vs. Private Resource Allocation Market prices—determined by the intersection of supply and demand—are the primary signal by which a market-based economy allocates resources.13 U.S. farm commodity programs were intended to provide a safety net under, rather than supersede, market forces. However, USDA’s combined CCC and FCIC outlays represent a substantial investment in the U.S. agricultural sector, particularly for a subset of commodities. The magnitude of federal support payments may have kept some resources in the agricultural sector that would have otherwise moved to other sectors of the economy. Proponents of farm support programs have argued that producer vulnerability to seasonal weather uncertainty and global market conditions—particularly when substantial land and capital resources are invested in a single year’s crop activity—merits public intervention. They contend that a single bad weather event or unexpected disruption in international markets could potentially drive significant irreplaceable resources from the agricultural sector. In contrast, critics contend that producers may choose from ample private sector risk-management tactics to offset weather risk while other sectors of the U.S. economy also face tough competition in international markets. Apart from the policy choice of making a large public investment in a single sector of the nation’s economy, the intensive focus on a small number of field crops raises the question of whether all U.S. farm commodities (and hence certain geographic regions of the country) have been treated equitably by the various farm programs. Significant funding differences across programs and commodities raise the question of whether potential unintended incentives might divert producer behavior from the production choices that would otherwise prevail in the absence of government programs. For example, some farm subsidy critics claim that, by focusing federal farm support (...continued) vested in a Board of Directors subject to the general supervision of the Secretary of Agriculture. See USDA, Risk Management Agency (RMA), “Federal Crop Insurance Corporation (FCIC),” https://www.rma.usda.gov/fcic/. 10 Ad hoc disaster assistance is supplementary to normal budget processes and, therefore, does not count against federal deficit scores until the money is actually spent. 11 CRS calculations using USDA data from “Table 35—CCC Net Outlays by Commodity and Function, Fiscal Years 1978 through 2016 Forecast,” February 27, 2014. Data includes payments under Market Loss Assistance ($19.7 billion); 1988-2005 Crop Disaster assistance ($18.8 billion), Livestock Indemnity and Forage assistance ($3.8 billion), and 2005-2007 disaster assistance ($2.4 billion) programs. 12 For more information, see CRS Report RS21212, Agricultural Disaster Assistance, by Megan Stubbs. 13 Economic theory holds that market efficiency is improved when there are a large number of buyers and sellers, homogeneous commodities, a large number of close substitutes, storable commodities, transparency of price formation, ease of transfer between buyers and sellers, no artificial restrictions on the market processes, and no externalities. Congressional Research Service 4
Farm Safety-Net Payments Under the 2014 Farm Bill: Comparison by Program Crop

primarily on feedstuffs (feed grains and protein meals), U.S. farm policy has lowered the cost for
American consumers of meat relative to fruits and vegetables—which have been essentially
unsubsidized. If true, this would suggest that current farm price and income support programs
have indirect nutritional consequences.14 Similarly, critics of federal intervention in crop
insurance markets have argued that by removing a substantial portion of the risk of farming on
land with high yield variability, large federal crop insurance subsidies have encouraged
production on marginal and environmentally sensitive crop land or discouraged the adoption of
more environmentally friendly production techniques.15

Regional Differences in Agricultural Activities
Most of the United States lies within a temperate zone, but agro-climatic variations still result in
important regional specialization.16 For example, the rich, deep soils of the U.S. Corn Belt—
stretching from Ohio westward through Indiana, Illinois, Iowa, southern Minnesota, and northern
Missouri to Nebraska and Kansas—make it one of the world’s most productive corn- and
soybean-growing regions. The warm, humid conditions of the U.S. Cotton Belt stretch from the
Carolinas westward across the southern United States through the delta states and into northern
Texas, while a Hard Wheat Belt encompasses the arid northern and southern plains states. High-
protein spring wheat thrives in a northern tier from Montana to Minnesota, while soft wheat
production is spread throughout the wetter environments of both the Corn and Cotton Belts and
the Pacific Northwest. Irrigation has allowed agriculture to flourish in California, Arizona, New
Mexico, and arid portions of the states bordering the eastern and western Rocky Mountains.
Livestock activities are also determined, in large part, by a region’s resources and climate: The
most marginal lands serve as a base for cow-calf operations, while hog, poultry, and cattle
operations are determined by the interplay of feed availability, proximity to markets, land
opportunity costs, and animal waste management and environmental considerations.
With these agro-climatic conditions in mind, significant funding differences across program crops
raise questions about whether federal resources are being used equitably and in the most efficient
manner possible to achieve their policy goals.

Commodity-Specific Farm Safety-Net Programs
USDA’s three farm safety-net components are funded through two principal entities within the
USDA: the CCC and the FCIC. Only farm safety-net outlays that can be linked to specific crops
are included in the charts and data tables of this report, with the exception of Figure 1, which
examines all farm safety-net outlays—commodity- and non-commodity-specific—since 1996.

14
   See for example, Michael Pollan, 2006, The Omnivore’s Dilemma, London: Bloomsbury Publishing Plc., or Eric
Schlosser, 2001, Fast Food Nation: The Dark Side of the All-American Meal, New York, NY: Houghton Mifflin
Company. CRS neither endorses nor refutes any of the claims described here but merely references them to highlight
viewpoints of the potential for both disparity and unintended consequences of policy outcomes.
15
   See for example, Is Federal Crop Insurance Policy Leading To Another Dust Bowl? Environmental Working Group,
Anne Weir and Craig Cox, March 22, 2017, or Soil Matters: How The Federal Crop Insurance Program Should Be
Reformed To Encourage Low-Risk Farming Methods With High-Reward Environmental Outcomes by Claire
O’Connor, Natural Resources Defense Fund, NRDC Issue paper, ip:13-04-a, August 2013.
16
   For U.S. crop maps, see USDA, Office of the Chief Economist, “Major World Crop Areas and Climate Profiles
(MWCACP),” https://www.usda.gov/oce/weather/pubs/Other/MWCACP/namerica.htm.

Congressional Research Service                                                                                   5
Farm Safety-Net Payments Under the 2014 Farm Bill: Comparison by Program Crop

The commodity-specific data exclude CCC outlays on conservation, trade, renewable energy,
rural development, farm credit, and other general farm programs. Also excluded are CCC disaster
assistance outlays that focus on livestock, tree crops, and orchards rather than farm program
commodities. Similarly, FCIC outlays for the annual administration and delivery costs of private
insurers and the costs associated with sharing the underwriting risk with private insurers are not
included.17
The commodity-specific programs funded by the CCC and FCIC are briefly described in the
following two sections. The outlays across programs and by commodities are summarized in
Table 4, Table 5, and Table 6 and discussed later in this report in “Comparison of Farm Safety-
Net Program Outlays.”18

Commodity-Specific CCC Support
CCC-funded commodity support programs include the marketing assistance loan (MAL) program
and two revenue support programs—the Agricultural Risk Coverage (ARC) and Price Loss
Coverage (PLC) programs. The MAL, ARC, and PLC programs are authorized by provisions of
Title I of the 2014 farm bill and are mandated for 26 farm commodities. However, not all
commodities are eligible for all three commodity programs.
Section 1111 of the 2014 farm bill defines a set of 22 “covered commodities” that are eligible for
the ARC and PLC programs. Covered commodities include wheat, oats, barley (including wheat,
oats, and barley used for haying and grazing), corn, grain sorghum, long-grain rice, medium-grain
rice, pulse crops, soybeans, peanuts, and other oilseeds. Other oilseeds include sunflower seed,
rapeseed, canola, safflower, flaxseed, mustard seed, crambe, sesame seed, and any other seed
designated by the Secretary of Agriculture. Pulse crops include dry peas, lentils, small chickpeas,
and large chickpeas. Noticeably absence from CCC revenue program eligibility is upland cotton,
which was removed from eligibility for CCC revenue support programs under the 2014 farm bill
as the result of a final ruling from a World Trade Organization (WTO) dispute settlement case
successfully brought by Brazil against U.S. cotton support programs.19 However, cotton
producers have been eligible for several cotton-only program payments described below in
“Cotton-Specific Programs.”
An expanded list of “loan commodities” is eligible for MAL benefits. Loan commodities include
all covered commodities plus upland cotton, wool, mohair, and honey.

Coupled Price Protection: Marketing Assistance Loan (MAL) Program
The MAL program provides both a floor price and interim financing for so-called loan
commodities. A participating producer may put a harvested “loan” crop under a nine-month,
nonrecourse loan valued at a statutory commodity loan rate.20 The loan uses the crop as collateral
(in other words, the payments are “coupled” to current production) and the loan rate, in effect,
establishes a price guarantee. The producer has the option to repay the loan and reclaim the crop
when local market prices are above the loan rate plus interest. However, when local market prices

17
   FCIC delivery cost outlays are $1.4 billion per year. FCIC costs for the shared underwriting risk vary from year to
year based on the distribution of losses and indemnity payments.
18
   See Figure 1 and Figure 2 for a comparison of total versus commodity-specific farm safety-net outlays since 1996.
19
   See CRS In Focus IF10193, The WTO Brazil-U.S. Cotton Case, by Randy Schnepf.
20
   See Table 5 at the end of this report for a list of loan rates by loan commodity.

Congressional Research Service                                                                                           6
Farm Safety-Net Payments Under the 2014 Farm Bill: Comparison by Program Crop

fall below the statutorily fixed loan rate prior to loan maturity, then four potential MAL benefits
become available to a producer with a crop under loan:
     1. A participating farmer can repay the loan at a repayment rate based on local
        market conditions and pocket the difference as a marketing loan gain (MLG).21
     2. Rather than taking the loan when the posted local price is below the loan rate,
        farmers may request a loan deficiency payment (LDP), with the payment rate
        equal to the difference between the loan rate and the loan repayment rate.
     3. As a third alternative, a participating farmer may use commodity certificates to
        repay the loan at the lower local market price and avoid any potential program
        payment limit associated with the market gain.22
     4. As a final option, to avoid any potential program payment limits, a producer
        could forfeit the pledged crop to USDA at the end of the loan period and keep
        any price gains associated with forfeiture.
MAL program benefits are available on the entire crop produced, which means a farmer receives
no benefits in the event of a crop loss.

Decoupled Revenue Support: ARC and PLC Programs
In contrast to the MAL benefits, the ARC and PLC programs make payments based on historical
acres and yields and therefore are not dependent on current production. In other words, they are
decoupled from current producer production choices. In addition, both ARC and PLC use annual
prices in their payment formulas rather than daily or weekly prices used by the MAL program.
PLC payments make up the difference between a crop’s statutory “reference price” and its
national season average farm price (SAFP).23 ARC payments make up the difference between a
county revenue guarantee (based on 86% of the product of the five-year Olympic moving
averages of historical data for national SAFPs and county yields) and actual crop revenue
(defined as the average county yield times the national SAFP).24 The county ARC program is
referred to as ARC-CO. ARC-CO and PLC payments to a producer are paid on 85% of the farm’s
acreage history (referred to as the farm’s base acres)25 times the farm’s historical crop yield
(referred to as the payment yield) times the payment rate. For each program crop, eligible
producers (those with base acres for program crops) had a one-time choice in early 2015 between
the PLC and ARC programs depending on their preference for protection against a decline in
either (a) crop prices or (b) crop revenue, respectively. Alternately, rather than selecting between
21
   USDA announces daily posted county prices (terminal prices adjusted for transportation costs from the county to the
terminal) as reference prices for operating its grain and oilseed MAL repayment provisions. The situation is very
different for operating the MAL repayment provisions for cotton and rice. In their case, world prices are determined in
markets outside the United States. Then USDA converts their international reference prices to a U.S. location by
adjusting for transportation costs. It is these “adjusted world prices” that are used for operating the cotton and rice
MAL repayment provisions.
22
   Commodity certificates and payment limit issues are discussed in more detail in CRS Report R44739, U.S. Farm
Program Eligibility and Payment Limits, by Randy Schnepf and Megan Stubbs.
23
   See Table 5 at the end of this report for a list of PLC reference prices by covered commodity.
24
   An Olympic average excludes the high and low data points from the calculation of the average.
25
   For calculating ARC and PLC program payments, the term base acres is the historical planted acreage on each farm
using a multi-year average from as far back as the 1980s. A farm’s base with respect to a covered commodity is the
number of acres in effect under the 2008 farm bill (7 U.S.C. 8702, 8751) as of September 30, 2013, subject to any
reallocation, adjustment, or reduction under the 2014 farm bill. Base acreage is calculated for each covered commodity
and transfers to the new owner when land is sold, making the new landowner eligible for farm programs.

Congressional Research Service                                                                                        7
Farm Safety-Net Payments Under the 2014 Farm Bill: Comparison by Program Crop
PLC and the ARC-CO guarantee for each covered commodity, a farmer could select a farm-level
“individual” ARC guarantee (ARC-IC), which combines all covered crops into a single, whole-
farm revenue guarantee. ARC-IC payment is based on 65% of base acres and program yields.
Generic Base Recouples Program Payments
As mentioned earlier, the 2014 farm bill excluded upland cotton from eligibility for PLC and
ARC payments. Instead, the former upland cotton base (totaling 17.5 million acres) was renamed
as “generic” base. Generic base is eligible for ARC and PLC payments if a covered crop is
planted on the farm. Thus, program crop choices made on generic base recouple ARC and PLC
payments to plantings. A rational producer will consider potential program payments in addition
to market conditions and crop rotations when making crop choices for generic base.
Coupled vs. Decoupled Payment Data
When program payments are based on current plantings or production, then economists describe such payments as
“coupled” to producer behavior. If coupled program support levels are set too high relative to market conditions, a
producer may have greater incentive to make crop choices based on potential program payments, rather than on
relative market prices. When this happens, the program support level can be said to have stifled the market signal
that reflects relative supply and demand conditions.
In contrast, “decoupled” payments try to break the linkage between producer behavior and federal programs. A
decoupled program may use a current-year payment trigger but make payments based on historical acreage and
yields. In this manner, decoupled payments attempt to minimize the link to producer crop choices. Because ARC and
PLC programs make payments (when triggered) on historical base acres of a specific crop or crops, rather than on
actual production, they are generally considered to be “decoupled” from current production.
USDA argues that ARC and PLC payments on base acres are decoupled as evidenced by how it notified 2014 crop
year outlays to the WTO. ARC and PLC outlays on base acres were notified as non-commodity-specific program
spending, whereas ARC and PLC payments on generic base were notified as fully coupled commodity-specific
spending.26 However, if producers are allowed to routinely update their historical base acres and program yields (or
to reallocate their base acres across the various program crops) with each new farm bill, then the decoupling is
weakened and the linkage between producer behavior and program payments is strengthened. Even if producers
simply have the “expectation” that they will be allowed to update or recalculate their base acres and program yields
with each new farm bill, then the decoupling is weakened, since producers would have an incentive to make planting
choices so as to maximize their expected crop program payment prospects under future farm bills.
Producers were given a one-time choice between ARC and PLC by commodity for their base acres for the life of the
2014 farm bill (2014-2018). There is already an expectation by CBO that producers will be allowed to make a new
choice between ARC and PLC for base acres under the next farm bill. 27
To facilitate comparisons, this report treats ARC and PLC partially decoupled data as commodity-specific and tied to
each program crop’s base acres. In so doing, the results may overstate the linkage between ARC and PLC payments
and potential producer behavior.
Cotton-Specific Programs
Although upland cotton was excluded from eligibility for ARC or PLC payments under the 2014
farm bill, producers of upland cotton remain eligible for MAL benefits and derive benefit from
payments under a provision that provides economic adjustment assistance to users (EAAU) of
26
U.S. notification to the WTO Committee on Agriculture for marketing year 2014, document G/AG/N/USA/109,
January 19, 2017.
27
CBO—in both its January and June 2017 farm baseline projections—assumes that producers will be allowed to alter
their current ARC-PLC selections by commodity. For example, corn producers switch from 93% participation in ARC
and 6.6% in PLC under the 2014 farm bill to 17.6% ARC and 82.1% PLC under the next farm bill.
Congressional Research Service 8Farm Safety-Net Payments Under the 2014 Farm Bill: Comparison by Program Crop upland cotton (P.L. 113-79, Section 1207(c)) and cotton storage cost reimbursements (Section 1204(g)). EAAU payments are made to domestic users for all documented use of upland cotton on a monthly basis, regardless of the origin of the upland cotton. The payment rate is $0.03 per pound and results in CCC outlays of about $49 million per year. Although the payments are made to cotton users, at least a portion of the payment is likely returned to producers in the form of higher prices associated with the increased demand from domestic users. In addition, the 2014 farm bill (Section 1119) established Cotton Transition Assistance Payments (CTAP) as an offset for the loss of ARC and PLC program eligibility. Under CTAP, upland cotton producers were eligible for payments on a percentage of former cotton base acres for crop years 2014 and 2015: For 2014, 60% of base received payments; for 2015, payments were made on 36.5% of base. CTAP was valued at a combined $484 million during 2014 and 2015. In 2016, USDA used its administrative authority under the CCC Charter Act to offer U.S. upland cotton producers a one-time cotton ginning cost-share (CGCS) payment program valued at $328 million.28 The CGCS program provides cost-share payments for cotton producers’ cotton ginning costs based on their 2015 cotton plantings multiplied by 40% of average regional ginning costs. Dairy Programs Under the 2014 farm bill, milk production is supported by the Margin Protection Program (MPP) and the Dairy Product Donation Program (DPDP). The MPP is a voluntary program that makes payments to participating farmers when a formula-based national margin—calculated as the national average farm price for all milk29 minus a national-average feed cost ration30—falls below a producer-selected insured margin that can range from $4.00 per one hundred pounds (cwt.) to $8.00/cwt. Producer payments are based on a farm’s historical milk production and are, thus, partially decoupled from current production behavior. However, producers may change their coverage level each year (within the $4 to $8 range), thus integrating current market conditions into the producer’s program and production choices. Whereas participation in MAL, ARC, and PLC is free, the MPP program operates more like an insurance program: Milk producers must pay an annual administrative fee of $100 for each participating dairy operation and statutorily fixed premiums that rise steadily for higher margin protection levels and greater volumes of insured milk. As a result, there is the potential for a producer to experience MPP costs associated with participation without any benefits if national margin payments are not triggered. Through the first three years of the 2014 farm bill, MPP payments have been triggered only at high margin levels where producer participation has been low. As a result, producer-paid MPP premiums have actually exceeded program payments. Sugar Current farm law mandates that raw cane and refined beet sugar prices are supported through a combination of limits on domestic output that can be sold (marketing allotments), nonrecourse 28 USDA, Farm Service Agency,“Cotton Ginning Cost-Share (CGCS) Program, Fact Sheet, June 2016; https://www.fsa.usda.gov/Assets/USDA-FSA-Public/usdafiles/FactSheets/2016/CGCS_Program_Fact_Sheet.pdf. 29 “All milk” represents the average price for all milk sold by producers irrespective of the end use—whether for fluid milk consumption or for processing into butter, cheese, powder, or soft products such as ice cream or yogurt. 30 The feed-cost ration is determined by a statutorily fixed formula set by the 2014 farm bill that uses USDA national average farm prices to calculate a value. Congressional Research Service 9
Farm Safety-Net Payments Under the 2014 Farm Bill: Comparison by Program Crop

marketing assistance loans for domestic sugar (but at the processor level), quotas that limit
imports, and a sugar-to-ethanol backstop program (Feedstock Flexibility Program).31 These sugar
program features result in essentially no CCC outlays.
U.S. producers of both sugar and milk receive important price support via import protection from
low-price international products under tariff-rate quotas (TRQs).32 Such TRQ support does not
appear as a CCC outlay; instead, the costs are borne by domestic consumers. For example, sugar
TRQ protection is notified annually as market price support (valued at over $1.4 billion in 2014)
to the WTO by the U.S. government.33 The potential costs of TRQ protection are not included
with the data used in this report.

Agricultural Commodities Without CCC Program Support
In contrast to producers of traditional program crops, producers of specialty crops (e.g., fruits,
vegetables, and tree nuts) and livestock have generally received little or no direct government
price or revenue support through commodity programs. Instead, these commodities benefit more
generally from federal investments in agricultural research and extension programs and from
federal support for domestic food and nutrition programs. Specialty crop and livestock farms may
manage risks through business diversification and the purchase of federal crop insurance and may
benefit from participation in federal disaster assistance programs.

Commodity-Specific FCIC Support
The FCIC directs and finances federal crop insurance programs.34 The largest federal cost in
support of federal crop insurance programs is federal subsidies on producer premiums. The
federal government, through the FCIC, has paid on average 62% of all crop insurance premiums
from 2014 to 2016. As both participation in crop insurance programs and the value of insured
crops have grown over time, so too has the absolute level of federal premium subsidies.
Premium subsidies are crop-specific. In 2016, crop insurance policies covered 290 million acres
and over 100 commodities including fruit trees, nursery crops, pasture, rangeland, forage, and
dairy and livestock margins. However, the major farm program crops (i.e., the covered crops)
account for over 90% of all federal premium subsidies. Federally subsidized policies protect
producers against losses during a particular season, with price guarantee levels established early
in the year using the preplanting values of harvest-time futures contracts. As a result, the revenue
guarantee protected by federal crop insurance moves up and down with market conditions. This
contrasts with commodity programs where protection levels are fixed in statute (e.g., PLC
reference prices and MAL loan rates) or use a five-year Olympic moving average for national
farm prices and county yields to determine a revenue guarantee (e.g., ARC-CO).

31
   See CRS In Focus IF10223, Fundamental Elements of the U.S. Sugar Program, by Mark A. McMinimy.
32
   For a discussion of the cost of TRQ protection, see CRS Report R43817, 2014 Farm Bill Provisions and WTO
Compliance, by Randy Schnepf.
33
   WTO, G/AG/N/USA/109, Supporting Table DS:5, Product-Specific Market Price Support, January 19, 2017.
34
   Federal crop insurance is permanently authorized by the Federal Crop Insurance Act as amended (7 U.S.C. 1501 et
seq.) but is periodically modified by new farm bill legislation. Insurance policies are serviced through approved private
insurance companies. The insurance companies’ losses are partially reinsured by USDA, and their administrative and
operating costs are reimbursed by the government. The program is administered by the USDA’s Risk Management
Agency (RMA) and financed through USDA’s FCIC. For details, see CRS Report R40532, Federal Crop Insurance:
Background, coordinated by Randy Schnepf.

Congressional Research Service                                                                                         10
Farm Safety-Net Payments Under the 2014 Farm Bill: Comparison by Program Crop

                        Note on Commodity-Specific Farm Payment Data
Since the starting point for the next farm bill debate will likely be the current set of farm programs as defined under
the 2014 farm bill, this report limits its analysis to commodity-specific outlays under the 2014 farm bill programs—in
particular, for the crop years 2014 through 2016 for which program data are available. This limitation is adopted
primarily because the farm safety-net programs underwent substantial revision under the 2014 farm bill. Including data
from previous years could potentially result in mixing policy goals and outcomes from now-obsolete programs.
CCC data, as reported by USDA’s Farm Service Agency (FSA), are used for all CCC outlays with the exception of
ARC-CO and PLC payments for 2016. Instead, CBO projections of ARC-CO and PLC outlays for FY2018 (from
CBO’s June 29, 2017, baseline for farm programs) are used to represent crop year 2016 payment data due to the
delayed timing of payments.
An important feature of ARC and PLC programs is that they make payments on a delayed basis: Their payment
formulas require an entire marketing year’s worth of monthly price data before the final SAFP is available and
payments can be determined. Furthermore, two provisions in the 2014 farm bill—Sections 1116(e) and 1117(f)—
prohibit any payments before October 1 following completion of a program crop’s market year. For example, the
marketing year for 2016 spring and summer-grown crops ends in mid-2017. Thus, related ARC-CO and PLC
payments for the 2016 crop year will not be made prior to October 1, 2017.35 As a result, the 2016 ARC and PLC
payments are made in FY2018.

Comparison of Farm Safety-Net Program Outlays
From 199636 through 2017, total outlays for farm safety-net programs (including non-commodity-
specific spending) were on average $16 billion per year including $8.6 billion for commodity
programs, $2.5 billion for disaster assistance, and $4.9 billion for crop insurance (Figure 1).

                Figure 1. USDA Farm Safety-Net Total Outlays, 1996 to 2017

35
   When the 2016 crop year ARC-CO and PLC payment data is publicly reported by FSA, they will be incorporated
into the CCC payment estimates of this report.
36
   Data begin with the 1996 farm bill (P.L. 104-127).

Congressional Research Service                                                                                      11
Farm Safety-Net Payments Under the 2014 Farm Bill: Comparison by Program Crop
Source: CCC data are from ERS, Farm Income and Wealth Statistics, as of February 7, 2017; FCIC data are from
Summary of Business Data, RMA, as of April 24, 2017; projected FCIC data for 2017 are from CBO, June 2017
Baseline for Farm Programs.
Note: CCC non-commodity-specific farm safety-net outlays include minor funding for bioenergy and trade
programs and $2.5 billion/year for disaster assistance programs. FCIC non-commodity-specific outlays (referred
to as “Other”) include administration and operating expenses of $1.4 billion annually and shared underwriting
risk, which varies from year to year.
After removing the non-commodity-specific outlays, the remaining commodity-specific outlays
for that same period averaged $12.3 billion per year, including $8.6 billion for revenue support
programs and $3.8 billion for crop insurance premium subsidies (Figure 2).
Figure 2. Commodity-Specific Farm Safety-Net Outlays, 1996 to 2017
Source: CCC data are from ERS, Farm Income and Wealth Statistics, as of February 7, 2017; FCIC data are from
Summary of Business Data, RMA, as of April 24, 2017; projected FCIC data for 2017 are from CBO, June 2017
Baseline for Farm Programs.
Note: Only commodity-specific outlays are included. CCC data exclude outlays for bioenergy, trade programs,
and disaster assistance. FCIC data exclude shared underwriting risk and A&O costs.
USDA commodity programs operate counter-cyclically to commodity prices: Payments increase
when commodity prices fall below support levels and decline when prices rise. In contrast,
federal crop insurance outlays are pro-cyclical to commodity prices: Liability, premiums, and
federal support outlays increase or decrease with commodity prices. As a result of their opposing
cyclical behavior, CCC and FCIC outlays tend to counter-balance each other.
Between 2006 through 2013, CCC-funded program outlays declined while FCIC support for crop
insurance expanded. This shift was primarily the result of market conditions and the associated
rise in commodity prices that occurred during that same period (Figure 3) rather than a change in
Congressional Research Service 12Farm Safety-Net Payments Under the 2014 Farm Bill: Comparison by Program Crop
policy.37 Since 2014, farm prices have again turned downward and CCC outlays have increased
relative to FCIC outlays.
Figure 3. Index of Monthly Average Farm-Prices Received (2011 = 100)
Source: USDA, National Agricultural Statistics Service (NASS), Index for all commodities, monthly average farm
price received, 2011 = 100, Agricultural Prices, various issues.
Note: NASS uses the monthly price estimates for 48 commodities to calculate prices received indexes for
overall farm prices. The index measures the change in the prices agricultural producers receive compared to a
base period (1990-1992 = 100). The base period is adjusted to 2011 by CRS. For more information, see
https://www.nass.usda.gov/Surveys/Guide_to_NASS_Surveys/Prices_Received_and_Prices_Received_Indexes/.
The index is dominated by major program crops, especially corn and soybeans, and is reflective of market
conditions underlying the farm support programs.
Program-Specific Outlays
The 2014 farm bill’s safety-net programs cover the five crop years of 2014 through 2018.
Through the first three years (2014 through 2016), CCC and FCIC outlays are a combined $38.1
billion.38 In annual terms, commodity-specific outlays are estimated at $12.7 billion per year,
including $7.5 billion for CCC programs plus $5.2 billion in FCIC crop insurance premium
subsidies (Figure 4 and Table 6).39
CCC programs accounted for 59% of commodity-specific outlays (see Figure 5 for program
breakouts), with FCIC outlays accounting for the balance of 41%.
37
These market conditions include globalization of agricultural markets and the rapid expansion of U.S. agricultural
exports, the equally rapid rise of the U.S. ethanol industry and its associated demand for corn as the primary feedstock,
and the severe and widespread U.S. drought of 2012 whose supply-diminishing effects lingered into 2014.
38
Note that the data source for CCC outlays in Figure 1 is ERS Farm Income data, which reports calendar and fiscal
year data, whereas the CCC data cited here and used in all commodity-specific figures and detailed in Table 5 is FSA,
which reports outlays on a crop year basis.
39
See the Shaded Box “Note on Farm Safety-Net Payment Data” for a description of the data sources.
Congressional Research Service 13You can also read