SITUATION ANALYSIS 2 - Unicef
←
→
Page content transcription
If your browser does not render page correctly, please read the page content below
Approach to Nutrition Programming     Volume

                                       2
in the East Asia and Pacific Region
2014 - 2025

SITUATION
ANALYSIS
Approach to Nutrition Programming     Volume

                                       2
in the East Asia and Pacific Region
2014 - 2025

SITUATION
ANALYSIS
© United Nations Children’s Fund
August 2014

Permission to reproduce any part of this document is required.

Structure of the three volumes

The “Approach to Nutrition Programming for the East Asia – Pacific Region” comprises
three volumes. Volume 1 articulates a set of packages of nutrition interventions for different
contexts, and provides more specific guidance on how UNICEF can work with national
governments to scale up effective nutrition interventions in multiple sectors. Volume 2
provides a detailed analysis of the situation in the region, and Volume 3 contains a detailed
discussion of the causes and consequences of maternal and child under and over nutrition
and the evidence base for the interventions proposed in the different packages.

The glossary, list of acronyms and full bibliography for all three volumes are found in
Volume 1; each Volume also contains all the cited references as footnotes.

All data was current as of August 2014 and it is acknowledged that new data may become
available in the future.

Acknowledgements

This three-volume Approach to Nutrition Programming was produced by the UNICEF EAPRO
Nutrition team. France Begin, Regional Nutrition Advisor (to 2013) and Christiane Rudert,
Regional Nutrition Advisor (from 2014) provided technical inputs, guidance and oversight.
Karen Codling and Roger Shrimpton, Public Nutrition Solutions Ltd., prepared the drafts of
the documents. The drafts were shared with all country offices to validate country specific
information and get their inputs on proposed approaches. Special thanks is extended to all
the country office colleagues who provided feedback, and also to the UNICEF EAPRO and
New York colleagues who contributed their insights and suggestions.

Design and pre-press production was undertaken by Quo, Bangkok. www.quo-global.com

Photo credits

Cover: © UNICEF/NYHQ2013-0899/Ferguson
Page 6: © UNICEF/NYHQ2012-1874/Noorani
Page 26: © UNICEF/UKLA2014 - 1116/Lovell
Page 37 : © UNICEF EAPRO/2015/ Dorothy Foote

United Nations Children’s Fund
UNICEF East Asia and Regional Office (EAPRO)

19 Phra Atit Road
Bangkok 10200
Thailand

Website: www.unicef.org/eapro
E-mail: asiapacificinfo@unicef.org
CONTENTS

Introduction                                                         06

Child Nutritional Status in the Region – Anthropometry               08

Adult Nutritional Status in the Region – Anthropometry               14

Adolescent Nutrition                                                 18

Birth Weight                                                         22

The Burden of Malnutrition                                           24

Disparities in the Nutritional Situation                             27

Nutritional Situation in the Region – Micronutrient Deficiencies     30

Status of Nutrition Practices and Programmes in the Region           37

Infant and young child feeding practices and programmes              39
Implementation of micronutrient programmes                           48
Coverage of management of severe acute malnutrition                  51
Coverage of health interventions                                     52
Water and sanitation access and hygiene practices                    54
Dietary intake                                                       57

Annex                                                                61

Existing data on prevalence of other micronutrient deficiencies in   61
the region

INTRODUCTION

6              Approach to Nutrition Programming in the East Asia and Pacific Region, 2014 - 2025
In the East Asia and Pacific (EAP) region, despite economic growth, and achievements in health and
nutrition indicators, maternal and child malnutrition rates and burden remain high. Over 27 million
children are stunted in the EAP region, with one third of those children in China and another third
in Indonesia. Three of the top 10 countries with the greatest number of stunted children are in this
region. Eight countries in the region have a stunting prevalence above 30%, and if China is removed
from the dataset, the average regional prevalence is also over 30%. Just over 7 million children are
wasted, with 2 million of them severely wasted; the majority in Indonesia. It is of great concern that
the coverage of the treatment of severe acute malnutrition is extremely low (
CHILD NUTRITIONAL
STATUS IN THE REGION –
ANTHROPOMETRY
As a region, East Asia has experienced a 71% reduction in stunting prevalence between 1990 and
2012; the largest reduction, by far, of all regions. However, it is recognized that a large proportion of
this reduction is due to the influence of China and its large decline from 30% in 1990 to 10% in 2011
(see Figure 1). If China is excluded from the EAP region average, stunting prevalence is estimated
to be above 30%, which is similar to the rates in South Asia and Africa and the rate in least
developed countries.

Figure 1: Global and regional stunting prevalence, 1990 and 2012

                                             70

                                                  38% decline
                                             60                  19% decline
        Percentage of under-5 children (%)

                                             50                                71% decline                                                       38% decline

                                                                                             42% decline
                                             40                                                                          50% decline
                                                                                                           59% decline

                                             30

                                             20

                                             10

                                              0
                                                    South       Sub-Saharian East Asia       Middle East   CEE/CIS   Latin America                World
                                                    Asia           Africa      and Pacific   and North                    and the
                                                                                               Africa                    Caribbean

                                                                                              1990          2012

Source: UNICEF-WHO-World Bank Joint Child Malnutrition Estimates, 2011 revision and State of the World’s Children 2014. NB. Prevalence
estimates are calculated according to the WHO Child Growth Standards.

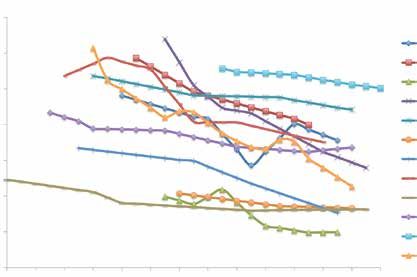
As suggested by the annual rates of reduction, nutrition is improving slowly in most countries of
the region. The above trend graph also shows the overall slow decline in stunting reduction for the
majority of countries (see Figure 2).

8                                                                                      Approach to Nutrition Programming in the East Asia and Pacific Region, 2014 - 2025
Figure 2: Trends in reductions in stunting

                                                     70

                                                                                                                              Indonesia
                                                     60
                                                                                                                              Cambodia
                                                                                                                              China
                Percentage of under 5 children (%)

                                                     50
                                                                                                                              DPRK
                                                                                                                              Lao PDR
                                                     40
                                                                                                                              Malaysia

                                                     30                                                                       Mongolia
                                                                                                                              Myanmar
                                                     20                                                                       Thailand
                                                                                                                              Philippines
                                                     10
                                                                                                                              Timor-Leste
                                                                                                                              Viet Nam
                                                      0
                                                      1987 1989 1991 1993 1995 1997 1999 2001 2003 2005 2007 2009 2011 2013

Ref: Created by EAPRO based on data in the UNICEF Childinfo database, MICS Thailand 2012, Timor-Leste NNS 20-13 and Philippines NNS 2011.
http://data.unicef.org/index.php?section=topics&suptopicid=55

Most countries have achieved annual reductions in stunting of less than one percentage point per
year; only Mongolia, Myanmar, Cambodia, Viet Nam, and Democratic People’s Republic of Korea have
achieved faster reductions. Even these rates compare unfavourably to the global average annual rate
of reduction of 2.1% between 1990 and 20111 (see Figure 3). Stunting rates are relatively stagnant in
countries such as Lao PDR, the Philippines, Malaysia, Thailand, and Timor-Leste.

Despite these improvements in stunting and some impressive achievements by some countries,
stunting rates remain >40%, categorized by WHO as “very high”, in Papua New Guinea (PNG), Lao
PDR and Timor-Leste, and 30-40%, categorized by WHO as “high prevalence”, in five other countries
in the region (the Philippines, Solomon Islands, Myanmar, Indonesia, and Cambodia). Other countries
like China, Tuvalu, Mongolia, Thailand, and Malaysia have a stunting prevalence considered as
“low prevalence”.2

1
    Black et al. Maternal and child undernutrition and overweight in low-income and middle-income countries. Lancet 2013.
2
    WHO. Nutrition Landscape Information System (NLIS) Country Profile Indicators: Interpretation Guide. 2010.

Strategic Approach and Implementation Guidance                                                                                              9
Figure 3: Annual percentage points of decline in stunting
3.00
2.57
2.50 2.28
2.1
Percentage points
2.00
1.50 1.34
0.97 1.01 1.03
1.00 0.83
0.75
0.50 0.52
0.46
0.50 0.33 0.34
0.00
nd
a
es
te
R
a
a
il
ia
ar
a
e
am
RK
si
in
si
az
di
ag
PD
l
es
nm
in
go
la
ay
ne
DP
Ch
bo
tN
Br
er
-L
pp
ai
o
on
al
do
ya
m
av
or
Th
La
e
ili
M
Vi
M
M
Ca
In
m
Ph
l
ba
Ti
lo
G
Ref: Calculated by EAPRO based on data in the UNICEF database. Period of comparison varies from 11 years in Timor Leste to 25 years in
Thailand. Period of comparison for Brazil is 31 years. Start year was in the 1990s for all countries except Timor-Leste and end year varied between
2005 and 2012. Ref for global average is Lancet 2013, Paper 1.
Figure 4: Stunting prevalence
70
Percentage of under five children (%)
60
50
50
44 44
≥ 40% WHO category: “very high prevalance”
40
40 35 36
33 34
30-39% WHO category: “high prevalence”
26 28
30
3 24
20-29% WHO category: “medium prevalence”
20
20 16 17Figure 5: Improvements in social indicators that may have contributed to improvements in nutrition
100 80
90 70
80
60
70
50
Percent (%)
60
50 40
40
30
30
20
20
10 10
0 0
1970s 1980s 1990s 2010 1970s 1980s 1990s 2010
Safe water access Female secondary school enrolment
9000
3500 8000
7000
3000 6000
Kilocalorie/person
5000
2500 4000
3000
2000 2000
1000
1500 0
1970s 1980s 1990s 1970s 1980s 1990s 2010
Per capita caloric intake GDP or GNI per capita
South Asia East Asia
Sub-Saharan Africa MENA
LAC
It is likely that some of the achievements in stunting reduction have been at least partially driven
by the high economic growth experienced, although it is known that economic growth does not
automatically improve nutrition and it often takes time.3 Average annual percentage growth of GDP
in East Asia and the Pacific was 8.5% in 1990-2000 and 9.4% in 2000-2010; these rates are significantly
higher than any other region.4 This strong economic development has contributed to the number of
people living in poverty being cut in half in the last decade.5 East Asia and the Pacific has experienced
the most rapid decline in poverty of all regions, driven largely by China, where extreme poverty fell
from 60% in 1990 to 13% in 2012.6 East Asia has also seen improvements in other key social indicators
such as safe water access, female school enrolment, and per capita caloric intakes. Caloric intakes
(measured by food availability because actual consumption data is not available) in the 1990s were
about 2,600 kcal/person, which is significantly higher than 1,800 kcal/person, which is the average
minimum energy requirement used by FAO.
3
The World Bank. Repositioning Nutrition as Central to Development: A Strategy for Large-Scale Action. Washington DC. The World Bank. 2006.
4
http://www.scribd.com/doc/91495960/World-Development-Indicators-2012#outer_page_238
5
http://www.worldbank.org/en/news/2012/05/23/east-asia-and-pacific-economic-update-may-2012
6
http://www.scribd.com/doc/91495960/World-Development-Indicators-2012#outer_page_238
Strategic Approach and Implementation Guidance 11Figure 6: Comparison of stunting rate and GDP per capita (PPP) in the EAP region
60 Country Stunting (%) Year
Percentage of under five children (%)
Timor-Leste 58.1 2009/2010
50
Lao PDR 44.2 2011/2012
40 PNG 43.6 2005
Myanmar 35.1 2009/2010
30
Indonesia 35.6 2010
Cambodia 39.9 2010
20
Solomon Is. 32.8 2006/2007
10 Philippines 32.4 2008
Viet Nam 22.7 2010/2011
0
0 2,000 4,000 6,000 8,000 10,000 12,000 14,000 Vanuatu 26.3 2007
Mongolia 15.3 2010
GDP per capita PPP in constant 2005 international dollars Malaysia 16.6 2011
Thailand 16 2005-2006
< 20% : Low prevalence 30-39% : High prevalence
China 9.9 2010
20-29% : Medium prevalence => 40% : Very high prevalence
Prevalence of stunting (moderate and severe) among under five year old children (WHO standards)
Ref: Prevalence of stunting: UNICEF database reflecting national surveys in the year shown. GDP per capita (PPP): World Bank , World
Development Indicators Database, May 2012 Update (Data for 2010)
Nevertheless, several countries in the region appear to have stunting levels in excess of what might
be expected based on their GDP, such as Malaysia, Thailand, the Philippines, and Indonesia. Those that
appear to have improved nutrition despite lower GDP are Myanmar, Viet Nam, and Mongolia.
Some countries also have a problem of wasting and overweight in young children. Wasting levels
in children 0-5 years are at a “serious” level in Timor-Leste, Indonesia, Malaysia, and Cambodia. It is
also important to recognize that with the shift to the new WHO child growth curves, it is now clear
that wasting peaks at a much earlier age (often in children less than 6 months old) than previously
thought (18-24 months). Thus data on wasting in children under five potentially masks a much
higher prevalence in the youngest children.7 The determinants of wasting, especially in the upper
middle income countries like Malaysia and Thailand, need to be investigated to appropriately target
prevention strategies.
Meanwhile, several countries are starting to experience high levels of child overweight, most notably
Mongolia, China, Brunei Darussalam, Tuvalu, Thailand, and Indonesia (see Figure 7). The regional
average of 5.3% overweight among children is still lower than some other UNICEF regions (e.g.
Central and Eastern Europe and the Commonwealth of Independent States with 15% prevalence and
the Middle East and North Africa with 11%).8 If action is not taken urgently, the number of overweight
children is likely to rise rapidly.
7
Young MF. And Martorell R. The public health challenge of early growth failure in India. EJCN 2013.
8
State of the World’s Children 2014.
12 Approach to Nutrition Programming in the East Asia and Pacific Region, 2014 - 2025Figure 7: Child wasting and overweight prevalence (sorted by wasting)
14 13
Wasting - WHO category:
12 12
12 >10% : “serious public health problem”
Percentage of under 5 children (%)
11 11 11 11
>15% : “critical public health problem”
10
8
8
7 7
7 6
6 6
6
5
4 4 5 5
4 4
4 3 4 3 4
3 3 3
2 3
2 2 2
2 2
1
0
0
7)
0)
0)
)
0)
2)
)
7)
5)
)
)
1)
)
)
0)
)
1)
0)
07
/11
07
12
12
10
13
01
01
01
01
01
01
01
00
00
00
00
0
0
9/
1/
0
20
0
(2
(2
(2
(2
(2
(2
(2
(2
(2
(2
(2
.(2
(2
(2
01
01
00
(
es
a
lia
a
a
a
RK
nd
te
(2
(2
ru
lu
Is
a
u
e
(2
si
in
di
si
ne
or
at
es
in
va
go
au
on
am
ay
la
R
ne
DP
Ch
bo
ar
nu
ap
pp
ui
PD
-L
ai
Tu
N
on
al
m
nm
do
m
N
G
or
Va
ng
Th
ili
M
lo
M
o
Ca
In
m
et
ew
Ph
ya
Si
La
So
Vi
Ti
M
N
a
pu
Pa
Overweight Wasting
Ref: UNICEF database reflecting national surveys in the year shown such as DHS, MICS, national nutrition surveys or living standards surveys.
WHO categories of public health significance: WHO. Physical status: the use and interpretation of anthropometry. Report of a WHO Expert
Committee. Technical Report Series No 854. Geneva, WHO 1995.
As Figure 7 illustrates, Indonesia has almost equal rates of child wasting and overweight. Thus, an
increasing number of countries in the region are suffering from the double burden of malnutrition.
The double burden of malnutrition (DBM) refers to the co-existence of over and under nutrition,
be it in the individual, the family, or household, or at the population level, across the life course.9
At the individual level, the most common form of DBM seems to be energy overnutrition and iron
deficiency. At a community level DBM has been reported in the same household with mothers being
overweight while their children are underweight. In China, for example, this has been recorded in 8%
of households.10 It has also been recorded in Indonesia (11%) and Bangladesh (4%).11
In developing countries, overweight and obesity are most commonly found in the wealthier quintiles.
However as national income increases, the burden of obesity tends to shift towards lower socio-
income groups.12 Moreover, overweight seems to be increasing faster than underweight decreases
in most low, middle and lower income countries13, the prevalence of overweight is increasing at 2-4
times the rate of the industrial world.14 The Lancet Nutrition Series 2013 reports that child overweight
has increased 54% between 1990 and 2011.15 Trend data on child overweight in the EAP region is
relatively limited; the data that is available does not show a clear pattern. Although overweight
prevalence has increased in Indonesia, the Philippines, Thailand, and Viet Nam, it has remained
stagnant in China (with significant fluctuations), Lao PDR, Mongolia, and Timor-Leste and it has
decreased in Cambodia and Myanmar. (data not shown)
9
Shrimpton R. and Rokx C. The Double Burden of Malnutrition: a review of global evidence. HNP Discussion Paper. World Bank, June 2012.(in press).
10
Doak et al. Overweight and underweight co-exists within households in Brazil, China and Russia. J Nutr. 2000.
11
Oddo et al. Predictors of maternal and child double burden of malnutrition in rural Indonesia and Bangladesh. Am J Clin Nut. 2012.
12
Monteiro et al. Socio-economic status and obesity and adult populations of developing countries: a review. WHO Bulletin. 2004.
13
Popkin BM. The nutrition transition and obesity in the developing world. J Nutr. 2001.
14
Popkin BM. An overview on the nutrition transition and its health implications: the Bellagio meeting. Public Health Nutrition. 2002.
15
Black et al. Maternal and child undernutrition and overweight in low-income and middle-income countries. Lancet 2013.
Strategic Approach and Implementation Guidance 13ADULT NUTRITIONAL
STATUS IN THE REGION –
ANTHROPOMETRY
Adult nutritional status is measured by Body Mass Index (BMI), which is an index of weight-for-
height.16 International classifications of BMI rates have been established for adult underweight,
overweight, and obesity.17 However it has been recognized that BMI may not correspond to the same
degree of fatness in different populations due, in part, to different body proportions. The health risks
associated with increasing BMI are continuous and the interpretation of BMI grading in relation
to risk may differ for different populations. In particular, questions have been raised about the
appropriateness of international BMI classifications for Asian and Pacific populations. In 2002, WHO
convened an Expert Consultation on BMI in Asian populations,18 which concluded that the proportion
of Asian people with a high risk of type 2 diabetes and cardiovascular disease is substantial at BMIs
lower than the existing WHO cut-off point for overweight (≥ 25kg/m2). However, available data do
not necessarily indicate a clear BMI cut-off point for all Asians for overweight or obesity. The cut-off
point for observed risk varies from 22kg/m2 to 25kg/m2 in different Asian populations; for high risk it
varies from 26kg/m2 to 31kg/m2. No attempt was made therefore, to redefine cut-off points for each
population separately. The Consultation recommended that the current WHO BMI cut-off points for
Asia should be retained as the international classification. However the cut-off points of 23, 27.5, 32.5,
and 37.5 kg/m2 are recommended as points for public health action. Note that all data presented in
this report uses the global cut-offs.
Available BMI data for women in the region is shown in Figure 8 below. In general, a high proportion
of overweight and underweight women are not found in the same countries. Overweight in women is
predominantly a problem in the Pacific Islands and also appears to be developing in Mongolia, China,
Thailand, and Malaysia where more than 30% of women are either overweight or obese. Underweight
in women is the predominant problem in Cambodia, Viet Nam, and Timor-Leste. The global prevalence
of underweight in women is about 12%.19 The data shown below for Indonesia is actually from all adults
and not women only and obesity was categorized as BMI≥27 as opposed to ≥30 in other countries.
Unfortunately, trend data on adult BMI is limited for the region but overweight and obesity is believed
to be rising rapidly in Asia, as it is in the rest of the world. Although an OECD20 update reports that
the obesity epidemic has slowed down in several OECD countries in the past three years, it notes that
obesity rates doubled or tripled after 1980 such that in 19 of the 34 OECD countries, the majority of the
population is now overweight or obese. OECD projections estimate that more than two out of three
people will be overweight or obese in some OECD countries by 2020.21
16
Body Mass Index (BMI) is a simple index of weight-for-height that is commonly used to classify underweight, overweight and obesity in adults.
It is defined as the weight in kilograms divided by the square of the height in metres (kg/m2).
17
BMI levels are categorized as follows:Figure 8: BMI of adult women (sorted by BMI 27. Overweight and obesity prevalence is higher in women than men
in Indonesia.
In Asia, limited data suggests rising adult overweight and obesity. For example data from the WHO
BMI database indicates that the proportion of adults with BMI>25 (overweight and obesity) increased
in China from 14.6% in 1995 to 18.9% in 200422 and Bell et al. reported in 2001 that in the last eight
years the proportion of Chinese men with BMI >25kg/m2 had tripled from 4-15% and the proportion in
women had doubled from 10-20%.23
Finucane et al. have used recent national health examination surveys to estimate trends in mean
national, regional, and global BMI levels.24 Figures 9 and 10 show the BMIs estimated by this analysis
for EAP countries between 1980 and 2008. The figures show that BMI levels have increased in all
countries of the region except for Brunei, where it is essentially unchanged, and Singapore and
DPRK where it appears to have fallen. On average, women’s BMI increased by 1.4kg/m2 in East Asian
countries whereas it increased by 6kg/m2 in Pacific Island countries. The highest increases in East Asia
were in Indonesia, Thailand, and Myanmar and the Cook Islands and Tonga in the Pacific. Women in
Nauru have the highest mean BMI in the world, while women in Bangladesh have the lowest. The key
point of this data however is that mean BMI is increasing in basically all countries of the region and
alarmingly so in the Pacific where rates are already extremely high. (NB. The BMI range of the X-axis
of the two figures is not the same.)
In low-income countries, obesity is more common in people of higher socio-economic status and
in those living in urban communities. It is often first apparent among middle-aged women. In more
affluent countries it is associated with lower socio-economic status, especially in women and
rural communities.25, 26
22
WHO global database on BMI http://apps.who.int/bmi/
23
Bell et al. Weight gain and its predictors in Chinese adults. Int J of Obesity and Related Metabolic Disorders. 2001.
24
Finucane et al. National, regional, and global trends in body-mass index since 1980: systematic analysis of health examination surveys and
epidemiological studies with 960 country-years and 9.1 million participants. Lancet 2011.
25
Seidell JC and Rissanen A. Prevalence of obesity in adults: The global epidemic. In: Bray GA and Bouchard C. Eds. Handbook of Obesity, 2004.
26
Pena M and Bacallao J, ed. Obesity and Poverty: A new public health challenge. Washington DC: Pan American Health Organization (PAHO), 2000.
Strategic Approach and Implementation Guidance 15Figure 9: Trends in age-standardized mean BMI in women by country in East Asia
26
Brunei
25 Korea
Singapore
24
Mongolia
23 China
Mean BMI
DPRK
22
Cambodia
21
Indonesia
Lao PDR
20
Malaysia
19
Myanmar
18 Philippines
1980 1990 2000 2008
Ref: Finucane et al. National, regional, and global trends in body-mass index since 1980: systematic analysis of health examination surveys and
epidemiological studies with 960 country-years and 9.1 million participants. Lancet 2011 Calculated national mean BMIs extracted from Webtable 5.
Figure 10: Trends in age-standardized mean BMI in women by country in the Pacific
Cook Islands
34
Fiji
32 Kiribati
Marshall Islands
30
Micronesia
Mean BMI
28 Nauru
Palau
26
Papua New Guinea
24 Samoa
Solomon Islands
22
Tonga
20 Vanuatu
1980 1990 2000 2008
Ref: Finucane et al. National, regional, and global trends in body-mass index since 1980: systematic analysis of health examination surveys and
epidemiological studies with 960 country-years and 9.1 million participants. Lancet 2011 Calculated national mean BMIs extracted from Webtable 5.
16 Approach to Nutrition Programming in the East Asia and Pacific Region, 2014 - 2025Data from Indonesia indicates that overweight and obesity is much more common in women and in
urban areas. It also rises progressively with increasing wealth quintile (see Figure 11).
Figure 11: Prevalence of adult overweight and obesity (BMI >25) in Indonesia, 2007
30
25 24 24 24
21
% of population >15 years
20 19
18
16
15
14 14
15
10
5
18
Total Urban Rural Male Female Q1 Q2 Q3 Q4 Q5
Economic quintile
Ref: Indonesia Report on Results of the National Basic Health Research Survey (Riskesdas) 2007, National Institute of Health Research and
Development, MOH.
Strategic Approach and Implementation Guidance 17ADOLESCENT NUTRITION
Adolescents make up 14% of the total population in the EAP region; varying from 28% in
Timor-Leste to 13% in China and 14% in Thailand.27 In some countries, adolescent girls are at
particular risk of malnutrition due to lower autonomy and access to resources. A review of available
data28 for countries in the region indicates that while in some countries adolescents have a relatively
high prevalence of underweight, in others, adolescents have a high prevalence of overweight and
obesity. When comparing the nutritional status of adolescents with older women it appears that while
adolescence appears to protect girls/women from overweight/obesity, and to some extent anaemia,
more adolescents than older women are underweight. It should be noted, however, that during
adolescence nutrition status should be assessed using the WHO growth reference pattern of BMI for
10-19 year olds. Unfortunately, almost every national survey that includes BMI estimations have used
adult (>19 years) cutoff points for measuring populations above 15 years of age, which has produced
a serious bias in BMI estimations for 15-19 year olds, with undernutrition being overestimated in this
group. Available data shows the highest rates of low BMI in girls aged 15-19 in Timor-Leste, where a
third of girls are underweight (see Figure 12, blue areas). The Philippines is the only country in the
region that has assessed BMI in children aged 10-19 using the standards for 10-19 year olds, and has
found a prevalence of 12.7% for low BMI.29
Figure 12: Nutritional status of adolescent girls (15-19 years)
100 2 2
3 4
90 73 24
29
Percentage of adolescent girls 15-19 years
80
51 53
70
65
70
60
79 78
50
40 23 72
69
30
44
47
20 33
28
10 18 19
2 2 3 4 4
0
Nauru Solomon Is. Tuvalu PNG Vanuatu Mongolia Lao PDR Cambodia Timor-Leste
(2007) (2006/7) (2006) (2005) (2007) (2010) (2006) (2010) (2009/10)
Ref: National surveys such as DHS, MICS and national nutrition surveys in the years shown.
27
UNICEF. State of the World’s Children 2014: Table 11, Page 90.
28
MICS does not measure nutrition status among adolescents aged 10-19 and it also does not measure BMI among women aged over 15. DHS
does not measure BMI among adolescents aged 10-19 using the WHO standards for that age group and it only measures BMI among women aged
15-49 in selected countries, using the standards for adults aged over 19 years.
29
Updating Survey FNRI 2011.
18 Approach to Nutrition Programming in the East Asia and Pacific Region, 2014 - 2025Figure 13: BMI
Figure 14: Anaemia in reproductive age women by age group
60
Percentage of reproductive age women (%)
50 48
46
42 43
40 37 37
35 35 Years
30 15-19 30-39
23
22 20 20-29 40-49
19
20
16
15 13
12
10
0
Cambodia Mongolia Timor-Leste Papua New Guinea
(2010) (2010) (2009/10) (2005)
Ref: Cambodia DHS 2010, Mongolia National Nutrition Survey 2010, Timor-Leste DHS 2009/10 and Papua New Guinea National Nutrition Survey
2005. NB. Age group is 15-49 years.
Similarly, in all the countries shown, adolescents do not appear to be at higher risk of anaemia
(see Figure 14).
Figure 15: Adolescent girls (15-19 years) married/in a union (2002-2011) and % women (20-24 years) who gave
birth before 18 years (2008-2012)
30
25
25
2121 22
20 18 18
16 15
15 15 Adolescents married/in
15 14
13 13 13 13
union (%)
10 10
10 8 8 8 89 9
7 7 7 7 7 % 20-24 year old gave birth
5 5 6
5 3 before 18
3
2
0
am
a
Ca nes
i
4)
a
lia
u*
do a
a
*
te
r*
om a*
*
R*
*
ru
u
at
Ph mo
Is
di
si
nd
Is
si
at
es
00
ew ma
au
ne
go
al
rib
PD
ay
ne
bo
tN
nu
n
ll
i
la
-L
pp
v
(2
Sa
ha
N
o
ui
on
Ki
n
al
Tu
ai
m
Va
or
o
e
ya
ili
G
e
M
as
Vi
Th
La
M
In
m
or
M
l
M
So
Ti
ap
N
ng
a
Si
pu
Pa
Ref: State of the World’s Children 2014, based on data from MICS, DHS and other national surveys, 2005-2010. * Data on % of women who gave
birth before 18 years is from prior to 2008.
In many countries, a significant proportion of adolescent girls are married/in a union and/or start
childbearing before they are 18. Figure 15 shows available data on the proportion of adolescent girls
married/in a union and those who have started childbearing before they are 18 in the region. In view
of the risks associated with teenage pregnancy, for both the mother and the child, it is of concern that
more than 10% of women 20-24 have given birth before the age of 18 years in several Pacific Island
countries, Myanmar, Papua New guinea, and Lao PDR.
20 Approach to Nutrition Programming in the East Asia and Pacific Region, 2014 - 2025Figure 16: Number of births to girls aged 15-19 in East Asia and Pacific countries
600,000 552,916
500,000
400,000
251,538
300,000
244,495
200,000
153,650
109,994
100,000 41,360 23,730
3,835 1,890
43,680 37,366 1,200
15,360 2,603 1,275 1,014 261 80
0
a
es
a
am
nd
a
R
ar
a
ia
te
ia
s
a
ji
RK
oa
a
nd
ng
si
in
di
ne
si
Fi
PD
s
ol
es
m
in
m
la
ne
ay
ne
DP
Ch
bo
N
ui
g
la
To
n
-L
pp
ai
Sa
o
on
al
do
ya
ro
et
Is
G
m
or
Th
La
ili
M
Vi
ic
M
Ca
M
on
ew
In
m
Ph
M
Ti
m
N
lo
a
pu
So
Pa
State of the World’s Children 2011: Adolescence: An Age of Opportunity. Calculated. Girls population aged 15-19 based on UN World Population
Prospects data (2011).
While these percentages appear relatively low, they translate into high numbers in the larger
countries; more than half a million girls give birth before the age of 19 in Indonesia and the figure is
about a quarter of a million in the Philippines and China (see Figure 16).
Overall however, the majority of teenage girls in the region are not getting pregnant and the median
age at first birth is 20 years old and above.
This means that targeting adolescents or girls in secondary school is not on its own a sufficient
or appropriate strategy in many countries for reaching pre-pregnant women, a key target group
advocated by the Lancet Nutrition Series 2013. Additional strategies to reach pre-pregnant women
will be needed.
Strategic Approach and Implementation Guidance 21BIRTH WEIGHT Closely related to the nutrition of women is birth weight. In general the quality of birth weight data is poor, because, in many countries, a large proportion of newborns are not weighed at birth and it is not possible to weigh babies at birth in cross sectional surveys. Babies that are weighed at birth tend to be better off (more likely to be born in health facilities, urban areas and of better-educated mothers), which can lead to an underestimation of low birth weight incidence. Low birth weight data collected by national surveys is usually based on mothers’ recall or examination of birth records or child health cards. In addition, low birth weight data seldom excludes low birth weight due to prematurity, thus mixing up the two conditions. A recent publication has calculated the different risks of being born small for gestational age (SGA) (the lowest tenth percentile of the growth reference), preterm or both, illustrating the importance of differentiating small birth size due to SGA as compared to prematurity. Being born SGA increased the risk of neonatal mortality by two to five times, but being born preterm (
Figure 17: Low birth weight prevalence
30
27
25
Percentage of newborns (%)
21
20 18 18
15
15
12 13
11 11 11
10 10 10 10
10 9 9 9
8 8
6 6
5 5 5
5 4
3 3 3
0
0
ok (2 )
To s. (2 08)
go (20 )
DP 201 8)
)
Vi Kir ia ( 0)
(2 1)
M nga nd 07)
ar (20 )
( 0)
a (2 )
( 9)
M bo (2 9)
in (20 )
ew am i (2 7)
Ti ays ia ( 05)
M PD . (2 3)
N s ( 0 0)
7)
am (1 )
Si aila (20 )
nu (1 7)
00 )
Ca uin (20 )
So r-L (20 10)
La on (2 9)
M hal 201 7)
Ph ne (2 2)
(2 )
Co ina 0 0 0
2
7
00
nm re 012
8
N ati 10
9
(2 0 0
G oa 04
ru 08
RK 0/1
ei Ind alau 9/1
ic l I 1/1
M ore (20 0
( 99
ru esi 199
at 99
m ea 0
Th valu 0 0
Va lam 0 0
Fi 20 0
00
ili sia 0 0
00
-
( 00
0
lo es 0 0
et ib 20
20
0
d 0
0
au 20
ng 0
ya po (2
Ch e (2
K a
ss a
u
m te
ro s.
on a
s
j
e
iu
l
I
I
o a
ar R
N
i
P
Da n
pp
Tu
o
S
s
al
o
m
N
a
un
pu
Br
Pa
Ref: UNICEF database – most recent year available (1997-2011). Source is national surveys in the year shown such as DHS, MICS, national
nutrition surveys or living standards surveys. Data from DHS has been reanalysed.
Globally the prevalence of low birth weight (LBW) is 15%; the East Asia and Pacific regional
prevalence is 6%, which is relatively low compared, for example, to 28% in South Asia,31 where
maternal nutrition is particularly poor.
Available data on LBW for the region is shown in Figure 17. As shown, LBW rates are reported to be
10% or above in almost half of all countries and rates are particularly high in several of the Pacific
Islands, the Philippines, and Lao PDR. Prior to acceptance in UNICEF’s global database, household
survey data on birth weight from MICS and DHS are adjusted to account for under-reporting and
misreporting of birth weights using published methods.32
The assumptions implicit in this adjustment are the following:
• Births with numerical birth weights reported are as likely to be low as those without reported
birth weights.
• Within the same country, the relationship between birth weight and the mother’s assessment of
infant size does not depend on whether the infant was weighed.
It should be noted, however, that adjusted rates may still underestimate the true magnitude of
the problem.
31
UNICEF. State of the World’s Children 2014.
Blank AK and Wardlaw T. Monitoring low birth weight: an evaluation of international estimates and an updated estimation procedure. WHO
32
Bulletin. 2005.
Strategic Approach and Implementation Guidance 23THE BURDEN OF
MALNUTRITION
It is important for an analysis of the nutrition situation to consider not only the prevalence of
malnutrition but also the numbers of children and women affected.33 Highlighting the numbers
affected in certain countries, especially large countries with lower prevalence of malnutrition, is an
important advocacy opportunity to ensure that address malnutrition remains on or is elevated on the
national agenda. It is also important to analyse the distribution of the burden within a country. The
largest numbers of stunted or wasted children may be living in large cities with lower prevalence, as
opposed to the remote rural areas with the highest prevalence. This has implications for the targeting
of programmes and the allocation of resources.
Although the regional prevalence of stunting is only 12%,34 when the numbers of stunted children
in each country in the region are added together, EAP region has an estimated total of 27.5 million
stunted children. A third of them are in China, although China has the lowest stunting prevalence in
the region. Another third are in Indonesia with a stunting prevalence of 36%. Compared to the rest
of the world, three of the countries in the list of top 10 countries with the largest numbers of stunted
children are in the EAP region (see Figure 18).
Figure 18: Top 10 countries in the world by numbers of stunted children and where the stunted children of the
EAP region live
Tanzania 3,564,540
Philippines 3,572,800
Viet Nam 6%
Cambodia 2%
DR Congo 5,027,130 Thailand 2%
China 32%
6,180,340 Philippines 13%
Bangladesh
6,201,800 Papua New
Ethiopia
Guinea 2%
Indonesia 8,863,920 Myanmar 6%
China 8.893,400 Malaysia 1%
Pakistan 9.678,240
Lao PDR 1%
10,690,920 DPRK 2%
Nigeria
Indonesia 32%
India 57,878,880
0 10,000,000 20,000,000 30,000,000 40,000,000 50,000,000 60,000,000 70,000,000
Ref: Calculations by EAPRO using data from SOWC 2014.
33
The Burden of Malnutrition calculations were made using the latest available figures in the UNICEF database. The information portrayed is just
a raw estimation, based on population figures and averages and it is not backed up by UNICEF. Information will be adjusted accordingly, once
official estimates are released by UNICEF.
34
State of the Worlds’ Children 2014.
24 Approach to Nutrition Programming in the East Asia and Pacific Region, 2014 - 2025Thirteen percent of the region’s stunted children are in the Philippines, with 6% more in Viet Nam and
Myanmar; 2% are in Cambodia (see Figure 19).
Figure 19: Burden of malnutrition in the East Asia and Pacific region
China
9,000,000
Indonesia
8,000,000
Philippines
7,000,000 Viet Nam
Myanmar
Number of people
6,000,000
Cambodia
5,000,000 Thailand
DPRK
4,000,000
Papua New Guinea
3,000,000 Malaysia
Lao PDR
2,000,000
Timor-Leste
1,000,000 Mongolia
Solomon Is.
Stunting Wasting Overweight Singapore
Ref: Calculations by EAPRO using data from SOWC 2014.
Figure 20: Burden of poor infant and young child feeding in the East Asia and Pacific region (excluding China)
3,500,000
Indonesia
Philippines
3,000,000
Viet Nam
2,500,000 Thailand
Number of population
DPRK
2,000,000 Myanmar
Cambodia
1,500,000 Lao PDR
Papua New Guinea
1,000,000
Mongolia
Fiji
500,000
Timor-Leste
Solomon Is.
Not BF within 1 hour Non-EBF Un-timely CF Vanuatu
Ref: Calculations by EAPRO using data from SOWC 2014.
Strategic Approach and Implementation Guidance 25Co-existing with this high burden of undernutrition, almost 11 million children are overweight. Just over half of them are in China and a quarter are in Indonesia. More than 17 million children do not start breastfeeding within the first hour and over 20 million do not benefit from exclusive breastfeeding (EBF). Again the majority (about 65%) of them are in China, because of its large size, but the numbers are large in other countries also. For example, 600,000 and 700,000 children are not exclusively breastfed in Thailand and Myanmar respectively. A relatively large number of Lao children do not benefit from EBF compared to those in Cambodia although similar numbers were not breastfed within an hour of birth in both countries. Figure 20 excludes China in order to see the number of children affected in other countries more easily. Considerably fewer children are disadvantaged by untimely complementary feeding; about 13 million in total, but relative to other countries, more children in Viet Nam appear to receive late complementary feeding. More than 41 million children are believed to be anaemic, and nearly 5 million pregnant women are also anaemic. 26 Approach to Nutrition Programming in the East Asia and Pacific Region, 2014 - 2025
DISPARITIES IN THE
NUTRITIONAL SITUATION

The data quoted so far have all been national averages, which hide significant disparities within
countries. Stunting prevalence varies by wealth as shown in Figure 21. In most of the countries
shown, stunting prevalence is about 1.5 to 3 times higher in the poorest quintile compared to the
richest. However in Viet Nam it is more than six times higher, Nauru is five times higher and in
Mongolia it is almost four times higher. The country with the smallest disparity is the Solomon
Islands, followed by Indonesia. Globally, the difference is 2.47 times.35

Figure 21: Stunting prevalence by economic quintile in selected countries

                                                 70

                                                                                    51
                                                 60
            Percentage of under 5 children (%)

                                                      51
                                                 50                                                           47
                                                                     43
                                                                                                                                                             41
                                                 40
                                                                                                                                    34

                                                 30
                                                                                                25
                                                                23             24
                                                                                                                     21                       22 21
                                                                                           20                             19
                                                 20

                                                 10                                                                                                     9
                                                                                                          7                                                            6
                                                                                                                                4

                                                  0
                                                      Cambodia Indonesia            Lao PDR     Mongolia Myanmar           Nauru    Solomon Is. Thailand     Viet Nam
                                                       (2010)         (2010)        (2011/12)    (2010)       (2009/10)    (2007)        (2007)   (2005/6)   (2010/11)

                                                      Poorest                       Second                     Middle                    Fourth                   Richest

National surveys in the year shown such as DHS, MICS, national nutrition surveys or living standards surveys.

The rural prevalence of stunting is universally higher than the urban prevalence. In China it is almost
four times higher, whereas in most other countries it is not more than twice as high. Moreover, little is
known about the urban poor, which is often a highly disadvantaged group hidden in urban statistics
(see Figure 22).

In contrast, there is very little difference in stunting rates of boys and girls, with boys slightly more
stunted than girls (see Figure 23).

35
     Black et al. Maternal and child undernutrition and overweight in low-income and middle-income countries. Lancet 2013.

Strategic Approach and Implementation Guidance                                                                                                                              27
Figure 22 Disparities in stunting prevalence: urban-rural
60
Percentage of under 5 children (%)
48 49
50
42
40
40 39 38
34
31
30 28 28 28
27 27 27
26
22 23
20 18
12 13 12
11 10 11
10
3
0
7)
0)
2)
0)
1)
)
)
3)
)
0)
0)
5)
2)
07
07
10
01
01
01
01
01
01
01
01
00
00
9/
20
20
(2
(2
(2
(2
(2
(2
(2
(2
(2
(2
00
(
.(
am
a
ia
a
a
nd
e
R
lu
u
a
(2
Is
in
si
di
t
ne
PD
at
l
es
va
go
la
ne
tN
Ch
bo
on
ar
nu
ui
-L
ai
Tu
o
on
nm
do
m
m
G
or
e
Va
Th
La
Vi
M
Ca
lo
In
m
ew
ya
So
Ti
M
N
a
pu
Pa
Rural Urban
Ref: National surveys in the year shown such as DHS, MICS, national nutrition surveys or living standards surveys.
Figure 23 Disparities in stunting prevalence: male-female
60
Percentage of under 5 children (%)
53
50 47 47
46
42 43
40
40 37 37 38 38
36
32 32 33
30 29
30 26 27
26
22 23 22
20
20 16 16 18
14
1010
10
0
7)
2)
0)
8)
8)
0)
1)
7)
)
)
0)
0)
2)
5)
3)
07
10
01
01
01
01
01
01
01
01
00
00
00
00
00
9/
20
(2
(2
(2
(2
(2
(2
(2
(2
(2
(2
(2
(2
(2
00
.(
am
lia
RK
a
a
nd
R
te
u
ru
es
tu
a
(2
Is
si
di
PD
ne
al
es
ua
go
au
in
la
DP
ne
tN
bo
on
ar
v
ui
-L
ai
pp
Tu
n
N
o
on
nm
do
m
om
G
or
e
Va
Th
La
ili
Vi
M
Ca
In
m
ew
ya
Ph
l
So
Ti
M
N
p ua
Pa
Male Female
Ref: National surveys in the year shown such as DHS, MICS, national nutrition surveys or living standards surveys.
28 Approach to Nutrition Programming in the East Asia and Pacific Region, 2014 - 2025Figure 24: Disparities in the reduction in stunting in Lao PDR by wealth quintile
70.0
52.6
50.0
49.1 44.1 43.1
37.4 37.9
41.3
Percent of the quintile stunted
37.4
30.0 32.2
7.1 6.8 16.8
10.0
-10.0 -13.2
-13.9
-30.0 Lowest Second Middle Fourth Highest
-50.0
-55.7
-70.0
% change 2000 2006
Ref: Lao PDR MICS 2000, 2006. UNICEF calculations.
There is also evidence that, in some countries at least, disparities have increased; in Lao PDR for
example, reductions in stunting prevalence between 2000 and 2006 were mainly in the wealthiest
quintile where stunting prevalence fell by 56%. In the poorest and second poorest quintiles it actually
increased by 7%36 (see Figure 24).
36
Teerapong Praphotjanaporn, 2011. An analysis of chronic undernutrition. Report to UNICEF EAPRO.
Strategic Approach and Implementation Guidance 29NUTRITIONAL SITUATION IN
THE REGION – MICRONUTRIENT
DEFICIENCIES
Anaemia/iron deficiency: Anaemia in young children and/or women is a severe public health problem
in about a third of all countries in the region and it is a moderate public health problem in basically all
countries of the region (see Figure 25).
Figure 25: Anaemia prevalence (sorted by children 40%: severe public health problem
70
>20-40%: moderate public health problem
60
50
Percent
40
30
20
10
0
m
ng ia
e
a
e
au
s
d
es
on a
lia
K
am
al s
Sa a
Ki a
do ti
a
a
DR
s
ji
ru
Va ia
u
u
te
ar
nd
d
nd
ng
or
in
iu
si
o
si
ne
Fi
Ph ilan
a
at
l
R
s
d
va
es
a
nm
au
in
go
an
al
m
rib
DP
ne
ay
ne
m oP
Ch
N
bo
Co sal
nu
sh t N
ap
la
la
ui
To
-L
pp
P
Tu
N
sl
a
ya
ro
Is
Is
G
m
or
s
Th
e
La
lI
ili
M
ru
Vi
ic
M
ok
on
Ca
M
ew
In
m
al
Si
M
Da
Ti
N
lo
ar
ei
a
So
pu
un
M
Pa
Br
Non pregnant Pregnant Under 5
Ref: WHO, Worldwide prevalence of anaemia 1993-2005, based on WHO’s Global Database on Anaemia, 2008, plus additional data from national
surveys, such as DHS or national health or nutrition surveys in the year shown.
30 Approach to Nutrition Programming in the East Asia and Pacific Region, 2014 - 2025In children under five (see Figure 26) prevalence is generally highest in children under one year and
has generally halved by the time the child is two and the highest prevalence is almost universally
in children < 1 year. Mongolia is one the few countries with data on anaemia prevalence in children
under 6 months; already in this age group, it is highly prevalent.
This highlights the need to address anaemia in the youngest children.
Figure 26: Prevalence of anaemia in young children by age group
Cambodia 2010 Mongolia 2010
100 50
80 40
60 30
40 20
20 10
0 0
6-8 9-11 12-17 18-23 24-35 36-47 48-59 2-5 6-11 12-17 18-23 24-29 30-35 36-41 42-47 48-53 54-59
Months Months
Philippines 2008 Viet Nam 2009/2010
50
35
40
30
30 25
20
20 15
10
10
5
0 0
1 2 3 4 5In addition to the problem of the high prevalence of anaemia in both women and children, few
countries have achieved and maintained significant declines in anaemia, in either women or young
children (see Figures 27 and 28).
Analysis of global, regional, and national trends in haemoglobin concentration and anaemia
prevalence illustrates the continued high prevalence of anaemia and the very slow rate of
improvement in most regions.37 Mason et al suggest that the improvements that have been seen are
attributable to increased national income and more diversified diets, in particular meat consumption,
and reduced infectious disease, rather than supplementation programmes.38
Figure 27: Trends in anaemia in young children
70
Percentage of under 5 children (%)
60
50
40
30
20
10
0
Year 1 Year 2 Year 3 Year 4
Ref: National surveys - Philippines: 1993, 1998, 2003, 2008; Cambodia: 2000, 2005, 2010; Timor-Leste: 2003, 2009/10; Mongolia: 1999, 2001, 2004,
2011; Viet Nam: 1995, 2000, 2006, 2009-11.
Figure 28: Trends in anaemia in women
70
Percentage of target population (%)
60
50
40
30
20
10
0
Year 1 Year 2 Year 3 Year 4
Ref: National surveys - Philippines: 1993, 1998, 2003, 2008; Cambodia: 2000, 2005, 2010; Timor-Leste: 2003, 2009/10; Viet Nam: 1995, 2000, 2006,
2009-11. RAW = reproductive age women.
37
Stevens et al. Global, regional and national trends in haemoglobin concentration and prevalence of total and severe anaemia in children and
pregnant and non-pregnant women for 1995-2011: a systematic analysis of population-representative data. Lancet 2013.
38
Mason et al. Reduction of anaemia. Comment on Stevens et al. Lancet 2013.
32 Approach to Nutrition Programming in the East Asia and Pacific Region, 2014 - 2025It is important to recognize that the above figures all refer to anaemia, which is caused by a variety of
conditions, including iron deficiency, and that some iron deficiency can exist without anaemia. Recent
analysis found that globally “the proportion of anaemia amenable to iron” was about 50% in non-
pregnant women and pregnant women and 42% in children and the iron-amenable share of anaemia
was largest where other causes of anaemia were fewer (e.g. >55% in pregnant women and children
in east and southeast Asia).39 However a limited amount of national data on iron deficiency (from
Indonesia, Mongolia and Lao PDR) suggests that a lower proportion of anaemia may be due to iron
deficiency. Conversely, in this region, it appears that in some countries, such as Thailand, a significant
proportion of anaemia may be due to haemoglobinopathies or thalassemia, which will not respond to
iron interventions.
Not many countries have data on iron deficiency (as opposed to anaemia) but the Indonesia
Riskesdas survey of 2007 revealed that 60% of anaemia in women and 70% in children was microcytic
anaemia, likely due to iron deficiency or thalassemia.40 Mongolia’s 4th National Nutrition Survey 2011
measured both anaemia (haemoglobin) and iron deficiency (serum ferritin) in 433 children. The results
are shown below. They indicate that about a fifth of children with anaemia were iron deficient and in
total 21.4% of children were iron deficient.41 Similar analysis from the Lao PDR National Maternal and
Child Nutrition Survey (MICS 3/NNS) 2006 found that 43% of non-pregnant women and 35% of young
children with anaemia had iron deficiency.42 In Lao PDR and Mongolia, therefore, iron deficiency was
the cause of less than half of the anaemia, contrary to the traditional assumption mentioned above.
It is assumed that the remaining anaemia is due to other causes such as vitamin B12 or folic acid
deficiency, haemoglobinopathies or thalassemia, anaemia of chronic diseases.
Figure 29: Anaemia and iron deficiency children 2-59 months old in Mongolia
Iron deficiency
only 16.4%
Iron
deficiency and
anaemia 5%
59.5% Anaemia
Total population only 19.1%
Ref: Public Health Institute, Nutrition Research Centre. Nutrition Status of Mongolian Population: Fourth National Nutrition Survey Report.
Ulaanbaatar 2011.
39
Stevens et al. Global, regional and national trends in haemoglobin concentration and prevalence of total and severe anaemia in children and
pregnant and non-pregnant women for 1995-2011: a systematic analysis of population-representative data. Lancet 2013.
40
Microcytic anaemia is characterized by pale and small red blood cells. http://en.wikipedia.org/wiki/Microcytic_anemia
41
Children with infection (as indicated by CRP) were excluded from the analysis.
42
Knowles et al. Impact of inflammation on biomarkers of iron status in a cross-sectional survey of Lao women and children. Brit J Nutr (under
review for publication).
Strategic Approach and Implementation Guidance 33As noted, another potential cause of anaemia is haemoglobinopathies or thalassemias.
Haemoglobinopathies are genetic defects that result in the abnormal structure of the haemoglobin,
such as sickle cell anaemia, while thalassemias are conditions that result in the underproduction of
normal globin proteins. Some haemoglobinopathies and thalassemias are particularly prevalent in
Southeast Asia.The haemoglobinopathy haemoglobin E, in particular, has a high frequency amongst
Thai and Khmer groups, followed by Burmese and Malays, then Vietnamese and Bengalis. The gene
does not occur in ethnic Han Chinese or Japanese. Beta thalassemia is also very common amongst
Southeast Asians.43 A number of studies have tried to quantify the amount of anaemia caused by
these conditions, as opposed to iron deficiency. Thalassemia and haemoglobinopathies were found
to be the cause of 88% of anaemia in school children 10-11 years old in Northeast Thailand.44 The
results of two further studies also in Northeast Thailand are shown in Table 1 below. All three studies
concluded that thalassemia and haemoglobinopathies were more prevalent causes of anaemia in
this area than iron deficiency. A study of children 6-59 months in Cambodia found 60% of rural and
40% of urban children respectively to have an abnormal genetic haemoglobin disorder45 and 57.8% of
anaemic patients (aged 0-46+) in Bangladesh had either haemoglobinopathies or thalassemias.46 The
high prevalence of haemoglobinopathies and thalassemias demonstrated by these data and reported
in the literature will reduce the potential impact of iron interventions and complicate identification of
iron deficiency.
Table 1: Prevalences of thalassemia and iron deficiency in anaemic pregnant women and adolescents
in Thailand
Anaemic pregnant women47 Anaemic adolescents (15-17 years)48
Mukdahan Roi Et
Thalassemia 59.2 53.8 67.3
Iron deficiency (ID) 7.0 10.2 7.7
Combined thalassemia ID 25.4 30.8 9.6
No thalassemia or ID 8.5 5.2 15.4
43
http://web2.airmail.net/uthman/hemoglobinopathy/hemoglobinopathy.html
44
Panomai et al. Thalassemia and iron deficiency in a group of northeast Thai schoolchildren: relationship to the occurrence of anaemia. Eur J
Paediatrics, 2010.
45
George et al. Genetic hemoglobin disorders, infection, and deficiencies of iron and vitamin A determine anaemia in young Cambodian children.
JoN 2012.
Uddin et al. Pattern of thalassemia and other haemoglobinopathies: a cross-sectional study in Bangladesh. International Scholarly Research
46
Network. 2012.
47
Sanchaisuriya et al. Thalassemia and hemoglobinopathies rather than iron deficiency are major causes of pregnancy-related anaemia in
northeast Thailand. Blood Cells Mol Dis. 2006.
Pansuwan et al. Anaemia, iron deficiency, and thalassemia among adolescents in Northeast Thailand: Results from two independent surveys.
48
Acta Haematol, 2011.
34 Approach to Nutrition Programming in the East Asia and Pacific Region, 2014 - 2025Iodine deficiency: In contrast to anaemia rates in the region, urinary iodine excretion levels, as a
measure of iodine deficiency, have improved, such that the majority of countries in the region now
have adequate iodine status, at least in school age children at the national level. There is growing
awareness that it is important to also measure the iodine status of reproductive age women to
ensure that they are entering pregnancy with adequate iodine nutrition in order to protect foetal
development. At this time, a minority of countries has data on the iodine status of reproductive age or
pregnant women.
The improved iodine status is the result of increased coverage with iodized salt. Salt iodization is
mandatory in 14 out of the 29 countries in the EAP region. The regional average coverage is 91%,
the highest of all UNICEF regions.49 In most countries coverage with iodized salt has been steadily
increasing such that today four countries have coverage in excess of 90% and only four have
coverage of less than 50%. As Figure 30 shows however, not all salt is adequately iodized. There are
also several countries without data on this indicator. In some countries the proportion that is not
adequately iodized is significant e.g. in the Philippines, Indonesia, and Malaysia. In Lao PDR, and
Cambodia the survey results do not provide an assessment of adequacy of iodization. In recognition
that rapid test kits do not provide an accurate assessment of the adequacy of iodization, most of the
surveys now test at least a sub-sample of salt samples with a quantitative test such as titration or the
WYD checker machine.
Figure 30: Coverage with iodized salt
100
90
80
Percentage of households (%)
70 25.3 46.2
60
75.1
50 92.5
59.9 83 96.6
40 79.5 82.7
24.5 45.1
30 47.2 55.8
6.8 22.9 34.4 45.8
20
10 21.4 23.5
9.8 15.8 17.3 17.9
9.5 7.7 6.1 7.4
0 0 2.2
0
*
7)
7)
9)
6)
)
7)
)
*
0)
*
*
1)
*
*
11
12
8)
8)
0)
2)
2)
5)
01
01
00
00
00
5/
00
0/
01
1/
01
01
00
00
00
00
(2
(2
(2
(2
(2
(2
01
01
(2
(2
(2
(2
(2
(2
(2
ar
a
(2
(2
tu
u
RK
te
di
lia
a
a
a
es
a
al
nm
nd
es
ua
si
in
am
si
ne
R
bo
DP
v
go
in
ne
PD
ay
Ch
-L
Tu
la
n
ya
ui
pp
m
tN
Va
or
on
ai
do
al
G
M
o
Ca
Th
ili
m
M
M
e
La
In
ew
Vi
Ph
Ti
N
ua
p
Pa
iodized (adequacy adequately inadequately
unknown) iodized iodized
Ref: National surveys such as DHS, MICS, Living Standards, National Nutrition or IDD. Surveys assessing adequately of iodine with a quantitative
methodology, such as titration, shown with an asterix *
49
It is not mandatory in Brunei, South Korea, and Singapore, most of the Pacific Islands or Viet Nam. In Malaysia it is currently only mandatory in
two states and in Myanmar it is only mandatory for those licensed to produce iodized salt.
Strategic Approach and Implementation Guidance 35You can also read


