Kimberley Health Profile - Planning and Evaluation Unit January 2018 - WA Health
←
→
Page content transcription
If your browser does not render page correctly, please read the page content below
Kimberley Health Profile
Planning and Evaluation Unit
January 2018
Kimberley Health Profile 2018

Prepared by

Campbell Anderson, Nancy Bineham, Tia Lockwood, Aqif Mukhtar
and Nina Waenerberg of the WA Country Health Service Planning
and Evaluation Unit.
Acknowledgements

Thanks are extended to our colleagues and specialists in the field
who reviewed and commented on the report.

Special thanks to Tyana Lawless for final proof reading and
editing.

i    ONCE PRINTED THIS DOCUMENT MAY BECOME OUT OF DATE     Trim Record No: ED-CO-17-17829
     REFER TO THE ONLINE SOURCE FOR THE CURRENT VERSION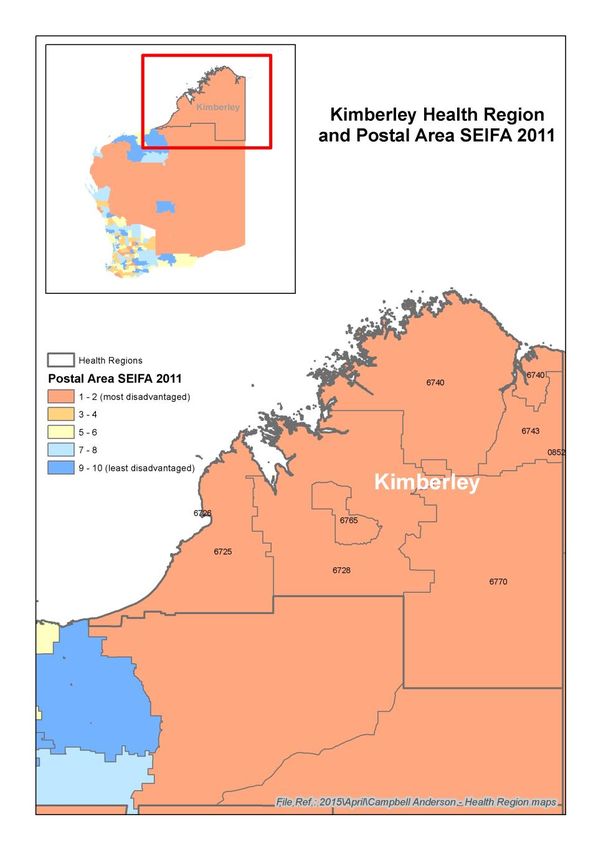
Kimberley Health Profile 2018

Contents
Key facts for Kimberley Residents ................................................................................... 3
Executive Summary ........................................................................................................... 4
Introduction ........................................................................................................................ 7
Overview of the region ...................................................................................................... 8
    Remoteness ..................................................................................................................... 8
Population .......................................................................................................................... 9
Economic, demographic and social factors .................................................................. 13
    Socio-Economic Disadvantage ....................................................................................... 13
Maternal Health Status .................................................................................................... 15
    Births .............................................................................................................................. 15
    Teenage mothers ........................................................................................................... 16
    Smoking in pregnancy .................................................................................................... 16
    Alcohol in pregnancy ...................................................................................................... 16
    Gestational Diabetes Mellitus (GDM) ............................................................................. 17
Health Status - Child and Adolescent ............................................................................ 18
    Low birth weight ............................................................................................................. 18
    Australian Early Childhood Development Census (AEDC) ............................................. 18
    Childhood Vaccinations .................................................................................................. 19
    Health and Wellbeing Surveillance System (HWSS), 0-15 years ................................... 20
    Potentially Preventable Hospitalisations (PPH), 0-14 years ........................................... 21
    Injuries, 0-14 years ......................................................................................................... 24
    Notifiable Infections, 0-14 years ..................................................................................... 25
Health of Adults ............................................................................................................... 27
    Self-reported risk factors, 16 years and over .................................................................. 27
    Self-reported chronic conditions, 16 years and over....................................................... 28
    Self-reported service utilisation, 16 years and over ........................................................ 29
    Hospitalisations, 15-64 years ......................................................................................... 31
    Alcohol and tobacco related hospitalisations, 15-64 years ............................................. 32
    Potentially preventable hospitalisations, 15-64 years ..................................................... 33
    Notifiable Infections and Events, 15-64 years ................................................................ 36
    Vector-borne diseases, 15-64 years ............................................................................... 36
    Vaccine preventable diseases, 15-64 years ................................................................... 37
    Sexually Transmitted Infections, all ages ....................................................................... 37
    Cancer Incidence, 15-64 years ....................................................................................... 39
    Mental Health, 15-64 years ............................................................................................ 40

1       ONCE PRINTED THIS DOCUMENT MAY BECOME OUT OF DATE                                 Trim Record No: ED-CO-17-17829
        REFER TO THE ONLINE SOURCE FOR THE CURRENT VERSION
Kimberley Health Profile 2018

       Youth Suicide, 15-24 years ......................................................................................... 40
       Mental Health, 16 years and over ............................................................................... 40
       Community Mental Health Activity, 15-64 years ......................................................... 41
    Mortality, 15-64 years ..................................................................................................... 41
    Alcohol and tobacco related mortality, 15-64 years ........................................................ 41
    Avoidable Mortality, 15-64 years .................................................................................... 41
Health Status of Older People ......................................................................................... 43
    Vaccinations, 65 years and over .................................................................................... 43
    Hospitalisations, 65 years and over ................................................................................ 43
    Potentially Preventable Hospitalisations (PPH), 65 years and over ............................... 43
    Mental Health, older people ............................................................................................ 45
       Dementia, over 45 years of age .................................................................................. 45
       Community Mental Health Activity, 65 years and over ................................................ 45
Disability and Carers ....................................................................................................... 46
Where Kimberley Residents Accessed Care ................................................................. 47
    Emergency Department Attendances ............................................................................. 47
    Hospitalisations .............................................................................................................. 49
       Alcohol and tobacco related hospitalisations .............................................................. 50
       Potentially preventable hospitalisations ...................................................................... 50
    Where Kimberley residents used hospital services ........................................................ 52
    Hospitalisations within the region ................................................................................... 53
Mortality ............................................................................................................................ 54
    Alcohol and tobacco related mortality ............................................................................. 56
    Avoidable Mortality, 0-74 years ...................................................................................... 56
Abbreviations ................................................................................................................... 59
Glossary............................................................................................................................ 60
References........................................................................................................................ 62

NOTE:
Unless otherwise stated within this document the term rate refers to an age standardised rate.
This means that the differing age and sex structures of the populations have been taken into
account enabling two different areas or time periods to be compared.
© Department of Health 201

                             This document can be made available in alternative
                             formats on request for a person with a disability.

2       ONCE PRINTED THIS DOCUMENT MAY BECOME OUT OF DATE                               Trim Record No: ED-CO-17-17829
        REFER TO THE ONLINE SOURCE FOR THE CURRENT VERSION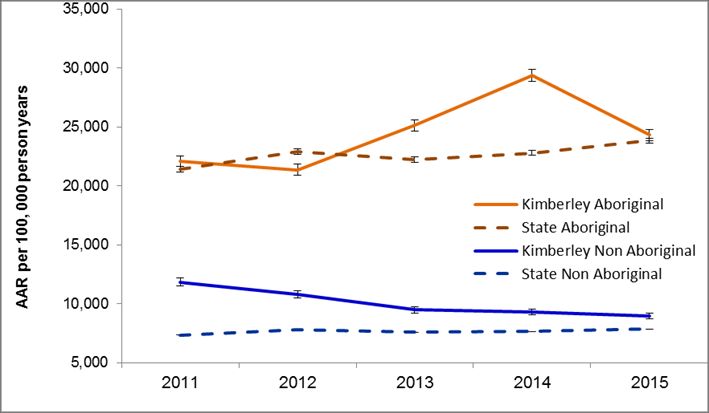
Kimberley Health Profile 2018

Key facts for Kimberley residents

3   ONCE PRINTED THIS DOCUMENT MAY BECOME OUT OF DATE    Trim Record No: ED-CO-17-17829
    REFER TO THE ONLINE SOURCE FOR THE CURRENT VERSION
Kimberley Health Profile 2018
Executive Summary
This report presents an overview of the health of Kimberley residents, to inform evidence-based
health service planning and delivery. Additional information about the region and districts within
the region may be found in service plan documents located on the WA Country Health Service
(WACHS) Publications page. The 2017 WACHS Child Health Profile and WACHS Health Profile
Summary 2017 are also available.
Note: When State rates are referred to, the State rate is always set at 1.0 when compared
against a regional rate. A higher regional rate is generally worse than the State rate and a lower
regional rate is generally better than the State rate. Poor access to health care may mean a
lower rate does not indicate the true health need.
Population
The Kimberley region had an Estimated Resident Population (ERP) of 36,392 in 2016.
From 2011 to 2016 the population decreased by three per cent due to the downturn in
the mining sector.
The region has a younger age structure than the rest of the State. Kimberley’s Aboriginal
population was 45 per cent in 2016 (state 3%) which contributes in part to the younger
age structure.
Based on Based on WA Tomorrow 2017 Projections, the region’s resident population is
projected to grow by 1.6 per cent per annum between 2017and 2026.i
Economic, demographic and social factors
Based on the 2011 census, the Kimberley region has a very low Socio-Economic
Indexes for Areas (SEIFA) scores, particularly Halls Creek, and the south western portion
of West Kimberley.
57 per cent (about 20,000) of Kimberley residents live in LGAs with a score in the lowest
10 per cent in Australia.
Maternal Health
In the period 2011-2015, the age-specific birth rate for Aboriginal women in the
Kimberley was significantly higher (1.5 times) than the non-Aboriginal rate.
The proportion of births to Aboriginal teenage women in the Kimberley was significantly
higher (17%) than non-Aboriginal teenage women (1%).
For the period 2011-2015, 53 per cent of Aboriginal and nine per cent of non-Aboriginal
women from the Kimberley who gave birth reported smoking during pregnancy. The
Aboriginal rate increased significantly from 40 per cent in 2011/12 to 61 per cent in
2013/14.
Child and Adolescent
In 2015, the proportion of Kimberley children rated as developmentally vulnerable on one
or more domains ranged from 34 per cent in Broome to 69 per cent in Halls Creek. All
Kimberley, communities with valid data had a higher rate of vulnerability than the national
average (22%), with three out of four being over double the National average
4 ONCE PRINTED THIS DOCUMENT MAY BECOME OUT OF DATE Trim Record No: ED-CO-17-17829
REFER TO THE ONLINE SOURCE FOR THE CURRENT VERSIONKimberley Health Profile 2018
The proportion of children accessing primary care was significantly less than (1.1 times)
the State and the proportion accessing hospital care was significantly more than (1.3
times) the State. This indicates a relative lack of access to primary care.
For the period 2006-2015, the rate of overall hospitalisations for disease of the ear and
mastoid process for Kimberley Aboriginal children aged 0-14 years was significantly
higher (3.7 times) than the non-Aboriginal rate, and also significantly higher than the rate
for State Aboriginal children.
The rate of all PPH was significantly higher (3.2 times) for Kimberley children than for
children in the State. The leading conditions for Kimberley children were ENT infections
(4.8 times the State rate), cellulitis (9.8 times the State rate), and dental (1.6 times).
The PPH for both acute and chronic conditions were significantly higher than the State
rate. The hospitalisation rates were significantly higher for Kimberley than the State for
falls (1.4 times) and transport accidents (3.4 times), the State rate.
For the period 2011-2015, the rate of notifiable diseases was significantly higher (4.5
times) for Kimberley children than for children in the State. The two most common were
enteric and vaccine preventable. All notifiable diseases were significantly higher (at least
3 times) than their respective State rates.
Adult
For the period 2013-2016, Kimberley adults were more likely, when compared to the
State to report drinking at risk of harm and smoking and less likely to eat sufficient fruit.
For the period 2011-2015 the proportion of adults accessing primary care was
significantly less than (1.1 times) the State and the proportion accessing hospital care
was significantly more than (2.4 times) the State. The leading cause of hospitalisation by
major category was injury and poisoning and by diagnosis code, was renal dialysis
The rates for alcohol and tobacco-related hospitalisations were significantly higher (3.7
and 2.6 times respectively) than the State rates. Kimberley Aboriginal adult rates were
significantly higher (7.1 and 5.3 times respectively) than non-Aboriginal adult rates.
For the period 2011-2015, the potentially preventable hospitalisation (PPH) rate was
significantly higher for all three categories vaccine preventable (6.8 times), acute (3.7
times) and chronic (4 times), compared with the rest of the State.
The leading PPH for Kimberley adults was ‘Cellulitis which made up 17 per cent of PPH
in this age group, 6.2 times the State rate.
Notifiable Diseases
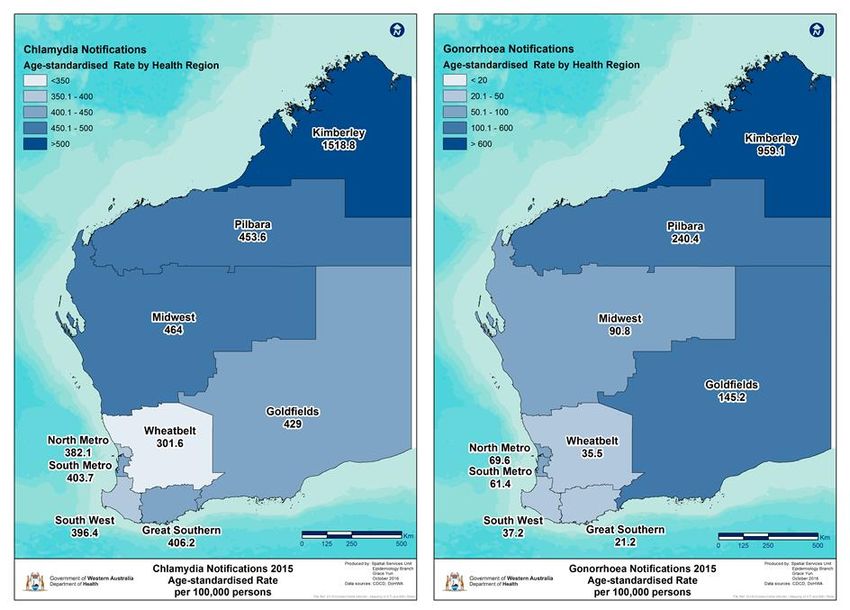
For the period 2011-2015, the rate for notifiable diseases for adults aged 15-64 years
was significantly higher (3.8 times) in the Kimberley compared with the State.
The sexually transmitted infection (STI) notification rate (mainly chlamydia and
gonorrhoea) was significantly higher (5.0 times), and the vaccine preventable rates (2.5
times) were significantly higher (2.8 times), compared with the rest of the State.
Mental Health
For the period 2011-2015 suicide was the leading cause of death in Kimberley 15-24
year olds causing 34 deaths in the region (8.9 times the State rate).
For the period 2011-2015, Kimberley residents aged 15-64 years accessed community
mental health services at a significantly higher rate (1.5 times) than the State.
5 ONCE PRINTED THIS DOCUMENT MAY BECOME OUT OF DATE Trim Record No: ED-CO-17-17829
REFER TO THE ONLINE SOURCE FOR THE CURRENT VERSIONKimberley Health Profile 2018
Aboriginal residents aged 15-64 years accessed community mental health services 3.2
times the rate of non-Aboriginal residents.
Older People
For the period 2011-2015 the leading causes of hospitalisations in older age groups of
Kimberley residents was significantly higher (1.7 times), than the State rate.
More than half of the hospitalisations for Kimberley residents were for renal dialysis.
Older Kimberley residents had higher rates than the State for dialysis (5.5 times), and
influenza/pneumonia (2.9 times).
The rate of PPH was significantly higher for Kimberley residents aged 65 years and over
(2.0 times) than for the State. The most common PPH was COPD (21% of all PPH and
2.6 times the State rate)
Emergency Departments (ED) – all ages
During 2016/17, 78 per cent of ED attendancs were classified as semi or non-urgent
(triage 4 or 5). The proportion was significantly higher than WACHS (66%).
The rate for triage 4 was four times higher than the State, and triage 5 was nine times
higher than the State which was statistically significant.
Hospitalisations – all ages
For the period 2011-2015 the hospitalisation rate for all Kimberley residents was
significantly higher (2.0 times) than the State rate.
The leading cause of hospitalisation for Kimberley residents was ‘injury and poisoning’
(8% of hospitalisations). Respiratory diseases, and digestive diseases each accounted
for six per cent.
Dialysis accounts for nearly half the hospitalisations of Aboriginal Kimberley residents for
the period 2006-2015 (50%). For non-Aboriginal Kimberley residents, dialysis
hospitalisations comprised less than three per cent for the period 2011-2015.
In 2016/17, 89 per cent of Kimberley residents’ hospitalisations to public hospitals
occurred within the region. The WACHS average was 76 per cent.
Mortality
For the period 2011-2015, the mortality rate of the Kimberley region was significantly
higher (1.7 times) the State rate.
For the period 2006-2015, the mortality rate in Kimberley residents for alcohol and
tobacco-related causes were significantly higher than (2.3 times and 1.6 times) the State
rate.
For the period 2011-2015, 380 of the 628 deaths were classified as avoidable. The
leading cause of avoidable mortality was suicide and self-inflicted injuries followed by
ischaemic heart disease (3.4 times and 2.7 times the State rate respectively).
6 ONCE PRINTED THIS DOCUMENT MAY BECOME OUT OF DATE Trim Record No: ED-CO-17-17829
REFER TO THE ONLINE SOURCE FOR THE CURRENT VERSIONKimberley Health Profile 2018
Introduction
This profile includes regional information on the population, demographics, determinants of
health and health statistics such as immunisation rates, mortality and hospitalisation rates for
residents of the Kimberley. Where practicable the information is provided in the sequence of the
continuity of care, and is provided by age group.
The information can be used to support business cases and to focus services where they can
best affect a positive outcome.
Additional information about the region and districts within the region may be found in service
plan documents also published on WACHS Publications page. WACHS Child Health Profile and
WACHS Profile Summary Report 2017.
7 ONCE PRINTED THIS DOCUMENT MAY BECOME OUT OF DATE Trim Record No: ED-CO-17-17829
REFER TO THE ONLINE SOURCE FOR THE CURRENT VERSIONKimberley Health Profile 2018
Overview of the region
The Kimberley region of Western Australia is the State's most northern region. The coastline
faces the Indian Ocean to the west and the Timor Sea to the north. The region encompasses an
area of 421,451 square kilometres (one sixth of the State's total landmass) and is bordered by
the Great Sandy Desert in the south and the Northern Territory in the east. ii
The Kimberley is almost twice the size of Victoria and three times that of the United Kingdom.
The geography of the Kimberley region includes arid desert areas, gorges, sandy beaches,
escarpments, rainforests, waterfalls, vast open plains, river valleys and cave systems. The
region is remote from major metropolitan areas. Broome is 2,213 km by road from Perth.
Kununurra is 3,205 km by road from Perth, 1042 km from Broome, but only 829 km by road
from Darwin. WACHS has formal arrangements in place with Royal Darwin Hospital to facilitate
access to services closer to home than Perth. In 2013/14, there were 170 transfers to Darwin
from the Kimberley region. 134 of these were from East Kimberley. These distances are
important in understanding where people access health services.
The Kimberley consists of four Local Government Areas being the Shires of Broome,
Derby/West Kimberley, Halls Creek and Wyndham/East Kimberley. The major population
centres are the towns of Broome, Derby, Fitzroy Crossing, Halls Creek, Kununurra and
Wyndham. There are also hundreds of Aboriginal communities of various population sizes
scattered throughout the region and nearly 100 stations servicing the pastoral industry.
Diamond production and Tourism are the largest producers of economic wealth for the region.
However, iron ore at Cockatoo Island and crude oil production in the Canning Basin also are
important. The fishing, pearling and large prawning industries provide a thriving export
business. The pastoral industry is one of the region’s oldest having been established in the late
1800's and is the largest in the State. Horticultural industries, largely based around the Ord
River Irrigation Area, continue to grow with a wide range of crops in production. These
industries and various other major projects, development and tourism contribute to a transient
population in the Kimberley region.ii
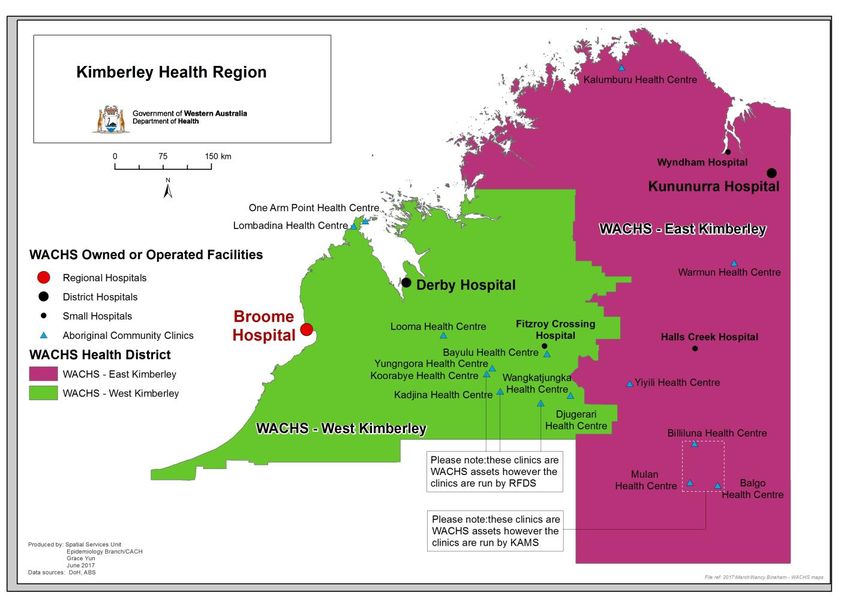
Remoteness
According to the Accessibility/Remoteness Index of Australia (ARIA), almost the entire
Kimberley region (97%) is classified by the ABS as Very Remote. The other three per cent
(areas around Broome and Kununurra) is remote (Figure 1). iii
8 ONCE PRINTED THIS DOCUMENT MAY BECOME OUT OF DATE Trim Record No: ED-CO-17-17829
REFER TO THE ONLINE SOURCE FOR THE CURRENT VERSIONKimberley Health Profile 2018
Figure 1: Map of Kimberley showing health districts and WACHS health facilities.
Source: Department of Health, Spatial services Unit Epidemiology Branch, Public Health Division, June 2017.
Population
The 2016 Estimated Residential Population (ERP) of the Kimberley is 36,392 which represents
seven per cent of the WACHS population and 1.4 per cent of the State's population. This is an
increase of 14 per cent (4,464) since 2006. However the growth has not been uniform and there
has been a net decrease of three per cent since 2011 following a strong period of growth. iv
The 2016 Kimberley region population density is 0.09 people per sq km which is lower than
State and WACHS average (1.0 per sq km; WA Rural: 0.24 per sq km).v
There is a higher proportion of males than females in Kimberley, 52 per cent males compared
with females.iv
Kimberley has a younger population compared to other regions (Figure 2). The age-structure
differs from that of the State by having a higher percentage of children aged 0-14 years and
people aged 20-44 years, and lower proportion of adults aged 50-74 years and 75 years and
over. The proportion of the Kimberley population aged 50-74 years is 19 per cent (State 25%)
while two per cent are aged 75 years and over (State 6%).iv
9 ONCE PRINTED THIS DOCUMENT MAY BECOME OUT OF DATE Trim Record No: ED-CO-17-17829
REFER TO THE ONLINE SOURCE FOR THE CURRENT VERSIONKimberley Health Profile 2018
Figure 2: Kimberley vs. State population age distribution 2016
iv
Source: ABS, ERP 2016
Table 1: Kimberley Estimated Resident Population 2016
Age Group 0-4 5-14 15-49 50-74 75+ Grand Total
Number 3,274 5,827 19,114 7626 551 36,392
Proportion 9% 16% 53% 21% 2% 100%
iv
Source: ABS, ERP 2016
The Aboriginal population makes up 45% of the Kimberley region’s population and is greater
than the State proportion (3.6%) based on 2015 ERP. The Aboriginal population has a younger
age structure than the non-Aboriginal population (Figure 3).vi
Figure 3: Kimberley 2015 Estimated Resident Population by Aboriginality
80 yrs +
Non Aboriginal Aboriginal
70-79 yrs
60-69 yrs
50-59 yrs
40-49 yrs
30-39 yrs
20-29 yrs
10-19 yrs
0-9 yrs
25% 20% 15% 10% 5% 0% 0% 10% 20% 30%
Male Female
vi
Source: ABS via DoH Epi Calculator
10 ONCE PRINTED THIS DOCUMENT MAY BECOME OUT OF DATE Trim Record No: ED-CO-17-17829
REFER TO THE ONLINE SOURCE FOR THE CURRENT VERSIONKimberley Health Profile 2018
From 2016, population growth is expected to be 1.6 per cent per annum projected until 2026
(Figure 4). The West Kimberley is projected to increase by 1.6 per cent per annum and the East
Kimberley by 1.0 per cent per annum.iv
Figure 4: Kimberley population projections 2006-2026
iv
Source: Western Australia Tomorrow 2017, Population Report No. 10 (Band ‘C’. and ABS, ERP 2016
Younger age groups (0-14 and 20-44 years) in the Kimberley region are projected to grow at a
slower rate than the older age groups. The number of people aged 70- and over is projected to
grow by 111 per cent between 2016 and 2026 compared with a 15 per cent increase in 15-44
year olds and a six per cent increase in 0-14 year olds (Figure 5).
Figure 5: Kimberley population projections by age group 2006-2026
iv
Source: Western Australia Tomorrow 2017, Population Report No. 10 (Band ‘C’. and ABS, ERP 2016
11 ONCE PRINTED THIS DOCUMENT MAY BECOME OUT OF DATE Trim Record No: ED-CO-17-17829
REFER TO THE ONLINE SOURCE FOR THE CURRENT VERSIONKimberley Health Profile 2018
Table 2: Kimberley Population Projections by health district 2017, 2021 and 2026
Kimberley health region 2017 2021 2026
WA Tomorrow Population Projection 38,997 41,172 44,999
Population increase 2,175 6,002
Percentage increase 5.6% 15.4%
Average annual increase 1.4% 1.6%
East Kimberley health district
WA Tomorrow Population Projection 12,595 12,990 13,715
Population increase 396 1,120
Percentage increase 3.1% 8.9%
Average annual increase 0.8% 1.0%
West Kimberley health district
WA Tomorrow Population Projection 26,402 28,181 31,284
Population increase 1,779 4,881
Percentage increase 6.7% 18.5%
Average annual increase 1.6% 1.9%
Source: WA Tomorrow 2017
Implications for health service planning:
Kimberley has a very high proportion of Aboriginal people (45% compared to the State
proportion of 3.6%). The Aboriginal population of the Kimberley has a much younger age
structure than the non-Aboriginal population, with nearly half the population aged under 20
(42% compared with 18% for non-Aboriginal). The differing cultural make-up and age structure
is taken into account in the planning of primary health services and programs.
The population of the Kimberley is projected to grow at 1.6 per cent per year. Most of the
growth will be in West Kimberley but this will be dependent on mining processing industries
expanding. The number of people 70 years and over is projected to increase by 111% between
2017 and 2026 (1,267 to 2,669). Seasonal population increases during the ‘dry’ season need to
be better monitored to provide a complete picture of service demand. This changing age
structure is taken into account in the commencement and placement of services particularly in
Aged Care.
12 ONCE PRINTED THIS DOCUMENT MAY BECOME OUT OF DATE Trim Record No: ED-CO-17-17829
REFER TO THE ONLINE SOURCE FOR THE CURRENT VERSIONKimberley Health Profile 2018
Economic, demographic and social factors
There are many factors that influence a person’s health, including genetics, lifestyle and
environmental, economic and social factors.vii
The demographics within the Kimberley are very diverse. While long travel distances are
common to remote communities, they can differ in function and infrastructure for example a
coastal fishing port and harbour will differ from a mining town or a desert Aboriginal community.
The level of isolation and impact on health by environmental conditions is often more marked for
remote communities than those seen in rural and metropolitan communities.v
Table 3 lists some of the socio-demographic factors for Kimberley compared to the rest of the
State.
Table 3: Kimberley vs. State vs. WACHS vs. Metro socio demographic factors 2011
Measure Kimberley Health Region Metro Country State
Counts % % % %
Born overseas 4,931 14.2 34.9 18.8 30.7
People who don't speak English
6,200 17.8 17.1 7.1 14.5
at home
At primary school 3,714 10.7 8.2 9.2 8.4
At secondary school 1,347 3.9 5.7 5.1 5.5
At TAFE, CAE or Uni 1,158 3.3 7.3 3.5 6.3
Left school aged less than 15
3,484 13.3 8.1 10.6 8.7
years old
Persons with tertiary qualification 8,979 34.2 45.3 38.3 43.6
Families with annual income <
633 8.9 3.9 5.1 4.2
$20,800
One-parent families 1,622 22.8 14.7 14.1 14.5
Unemployed 819 5.4 4.8 4.4 4.7
v
Source: ABS Census 2011 results via DoH, Health Tracks
Socio-Economic Disadvantage
The Index of Relative Socio-Economic Advantage and Disadvantage (IRSAD) as a product of
the Socio-Economic Indexes for Areas (SEIFA), is calculated from responses to the ABS
Census. The more disadvantaged an area, the higher self-reported ill health or risk factors for ill
health. A score below 1,000 indicates an area is relatively disadvantaged compared to an area
with a score of at least 1000 or more .viii
Based on the 2011 Census, the lowest score for a Kimberley LGA is 598 for Halls Creek and
the highest is Broome with 947. Broome is the only LGA that has a score above the lowest 10
per cent of scores in Australia. Consequently 57 per cent (about 20,000) of Kimberley residents
live in LGAs with a score in the lowest 10 per cent in Australia. An indication of the distribution
can be seen in Figure 6.ix
13 ONCE PRINTED THIS DOCUMENT MAY BECOME OUT OF DATE Trim Record No: ED-CO-17-17829
REFER TO THE ONLINE SOURCE FOR THE CURRENT VERSIONKimberley Health Profile 2018
Figure 6: Kimberley Socio-Economic Indexes for Areas distribution 2011
Source: DoH, Epidemiology GIS branch, 2015.
Note: SEIFA 2011 is released according to the Australian Statistical Geography Standard (ASGS).
Implications for health service planning:
The SEIFA Index demonstrates that most of Kimberley has high levels of disadvantage. Within
that, there are smaller areas that have extremely high levels of disadvantage. Services and
programs need to be targeted to areas of highest disadvantage.
14 ONCE PRINTED THIS DOCUMENT MAY BECOME OUT OF DATE Trim Record No: ED-CO-17-17829
REFER TO THE ONLINE SOURCE FOR THE CURRENT VERSIONKimberley Health Profile 2018
Maternal Health Status
Births
In 2015, the overall Kimberley age-specific birth rate was 72 per 1,000 women (Table 4:
Kimberley vs. State vs. Metro maternity data 2011-2015). This was significantly higher than the State (64
per 1,000 women). For the period 2011-2015, the age-specific birth rate for Aboriginal women in
the Kimberley was 92 per 1,000 women which is 1.5 times higher than the non-Aboriginal rate
(60 per 1,000 women). With a high proportion of the region’s population being Aboriginal this
could explain why the region has a higher birth rate than the State.v
In 2015/16, in the Kimberley, the mean maternal age was 25.9 years for Aboriginal women and
30.8 years for non-Aboriginal women.x
In the Kimberley, the proportion of births to women aged less than 20 years was significantly
higher (3.7 times) than the State (Table 4). Over the period 2006-2015 teenage pregnancy has
not changed significantly within the Kimberley region.v
In 2015/16, the proportion of births to non-Aboriginal teenage women was one per cent and to
Aboriginal teenage women it was 17 per cent. The high proportion of births to Aboriginal
teenage women explains the high proportion of Kimberley teenage births. v
Table 4: Kimberley vs. State vs. Metro maternity data 2011-2015
Kimberley Health Perth
Maternity data Region Metropolitan Area WA State
Age-specificic birth rate (per 1,000 women aged
15-44 years, not having had hysterectomy) 71.9 62.0 63.6
Teenage births (%) >20 years old 10.4% 2.2% 2.8%
Birth in women aged 35 years and older (%) 13.1% 22.2% 20.7%
Within the Kimberley, there was an increase in births of 16 per cent between 2011/12 and
2015/16, an average annual increase of 3.8 per cent. Aboriginal women had an average annual
increase of 3.2 per cent and in non-Aboriginal women the increase was 4.7 per cent on average
per annum.xi
Table 5: Kimberley births by Aboriginal status of mother 2012 - 2016
Births in a Kimberley hospital All births by Kimberley residents
Birth Year
Aboriginal Non-Aboriginal Total Aboriginal Non-Aboriginal Total
2012 349 240 589 399 297 696
2013 382 263 645 418 293 711
2014 348 268 616 373 297 670
2015 359 245 604 374 277 651
2016 351 275 626 382 302 684
Increase 1% 15% 6% -4% 2% -2%
Average annual increase 0.1% 3.5% 1.5% -1.1% 0.4% -0.4%
Source: Midwives Notification System, WA Department of Health.x
15 ONCE PRINTED THIS DOCUMENT MAY BECOME OUT OF DATE Trim Record No: ED-CO-17-17829
REFER TO THE ONLINE SOURCE FOR THE CURRENT VERSIONKimberley Health Profile 2018
Teenage mothers
Smoking in pregnancy
Smoking during pregnancy is associated with low birth weight, pre-term birth, placental
complications and perinatal mortality.xii
In the Kimberley, the proportion births to Aboriginal women who reported smoking during
pregnancy between 2011/12 and 2015/16 had an upward trend peaking at 61 per cent in
2013/14. The five year average proportion of births to smoking Aboriginal mothers was 53 per
cent. For non-Aboriginal mothers, the proportion of births to women who reported smoking
during pregnancy had a downward trend and the five year average was 9 per cent (Figure 7).
The WACHS rate for births to Aboriginal mothers who reported smoking during pregnancy was
48 per cent and for births to non-Aboriginal mothers was 13 per cent for the five year period.x
Figure 7: Kimberley proportion of women smoking during pregnancy 2011/12 to 2015/16
x
Source: Midwives Notification System, Department of Health
Alcohol in pregnancy
High rates of alcohol consumption while pregnant, is associated with Foetal Alcohol Spectrum
Disorder (FASD) and various other impairments of the central nervous system. A 2014 report
using data from 1980-2010 obtained from the WA Register of Developmental Anomalies and
the Midwives Notification System, showed a birth prevalence of FASD in WA of 0.26 per 1000
births. The majority were Aboriginal (89%). The prevalence rate has doubled over the last 30
years in WA..xiii & xiv
In 2017 a pioneering Western Australian study, ‘Prevalence and profile of Neurodevelopment
and Fetal Alcohol Spectrum Disorder (FASD) amongst Australian Aboriginal children living in
remote communities’, found that in remote Australian Aboriginal communities, where high rates
of prenatal alcohol exposure have been recorded, FASD/partial FASD prevalence rates of 120.4
per 1,000 children have been reported.xiv
Figure 8demonstrates an initial indication of the use of alcohol in pregnancy, with the data that is
currently available by Aboriginality in the Kimberley region compared to WACHS. The data
should be interpreted with caution as the question was only made compulsory to answer from
June 2017 onward and regional response rates vary. In the Kimberley region, 68 per cent of
16 ONCE PRINTED THIS DOCUMENT MAY BECOME OUT OF DATE Trim Record No: ED-CO-17-17829
REFER TO THE ONLINE SOURCE FOR THE CURRENT VERSIONKimberley Health Profile 2018
mothers responded to the question, which is lower than WACHS (72 % response rate out of
9,810 women who gave birth in the time period).
The data shows that the majority (77%) of Kimberley respondents did not report using alcohol
during pregnancy. Of those who used alcohol, a significantly higher proportion of Kimberley
Aboriginal mothers (95 mothers or 35% of respondents) used alcohol compared with WACHS
Aboriginal mothers (340 mothers or 26% of respondents). Out of the 95 who had used alcohol,
58 (or 11% of Aboriginal respondents) had had occasional alcohol, less than one standard drink
a week during pregnancy. One in four Kimberley Aboriginal respondents, or 124 mothers,
reported alcohol use at higher risk levels compared with one in six WACHS Aboriginal mothers.
Thirty (7% of region’s non-Aboriginal respondents) Kimberley non-Aboriginal mothers used
alcohol during pregnancy. Out of those who had used alcohol, 21 (5% of total non-Aboriginal
respondents) had had occasional alcohol, less than one standard drink a week during
pregnancy. Two in a hundred non-Aboriginal mothers used higher levels, and this rate was
similar with WACHS non-Aboriginal mothers.
Figure 8: Kimberley vs. WACHS proportion of mothers who used alcohol during pregnancy 2014-2015
*Proportion of mothers who responded to the question, not proportion of all mothers who gave birth. WACHS response rate was 72% and
Kimberley response rate 78%. No validation was carried out on the responses. Alcohol use became a compulsory field in June 2017 and will in
the future provide more reliable data.
Note: The error bars represent the 95% confidence interval of the proportion
Source: Stork Perinatal Database as at 2 June 2017, accessed via Health Support Services
A number of projects are being conducted in the Kimberley and other regions of the State to
address alcohol use during pregnancy and to find out more about FASD. Details can be
obtained from the Australian Indigenous HealthInfoNet website and the Telethon Kids Institute
website. xv&xvi
Gestational Diabetes Mellitus (GDM)
In 2010, the Australian Institute of Health and Welfare (AIHW) released a report on GDM
discussing its impact on Australian woman and their babies. The report concluded that mothers
with diabetes in pregnancy and their babies were at higher risk of adverse effects of pregnancy,
17 ONCE PRINTED THIS DOCUMENT MAY BECOME OUT OF DATE Trim Record No: ED-CO-17-17829
REFER TO THE ONLINE SOURCE FOR THE CURRENT VERSIONKimberley Health Profile 2018
labour and delivery, compared with those not affected by diabetes in pregnancy. Those with
pre-existing diabetes who had diabetes in pregnancy and their babies were at higher risk of
developing these adverse effects.
Aboriginal mothers and their babies experienced generally higher rates of the adverse effects of
pregnancy, labour and delivery compared with non-Aboriginal mothers and their babies. The
report stated that diabetes in pregnancy is an indicator of increased risk of developing Type 2
diabetes (also known as adult onset diabetes) later in life, and therefore provides an opportunity
to intervene to improve health outcomes.
In 2011/12–2015/16, 6.6 per cent of Kimberley Aboriginal women who gave birth had GDM. The
proportion of GDM in Non-Aboriginal Kimberley women who gave birth was 6.1 per cent.x
The prevalence of GDM in WACHS Aboriginal mothers was 7.1 per cent and in WACHS non-
Aboriginal mothers it was 5.9 per cent for the same time period.x
Implications for health service planning:
In the Kimberley, Aboriginal women are more likely than non-Aboriginal women to be teenage
mothers and to smoke during pregnancy. Alcohol consumption and diabetes in pregnancy are
risk factors for all women. Targeted and culturally appropriate health promotion strategies and
ante-natal services for these women are provided. Strengthening partnerships with primary care
providers, including local GPs and Aboriginal Medical Services is particularly important,
particularly given the high Aboriginal population.
Resources to tackle Aboriginal maternal smoking in WA have been developed such as the
Australian Indigenous HealthInfoNet new portal launched recently.
(Source: Australian Indigenous HealthInfoNet accessed June 2015:
http://www.healthinfonet.ecu.edu.au/about/news/3305
http://www.healthinfonet.ecu.edu.au/population-groups/preventing-aboriginal-maternal-
smoking).
Health Status - Child and Adolescent
Low birth weight
Babies born with a low birth weight (less than 2,500g) have a higher risk of health
complications. For the period 2007/08-2015/16, the low birth weight rate for full term babies
born to women in the Kimberley was 3.8 per cent and the State rate was two per cent. The low
birth weight rate for Kimberley Aboriginal babies born full term was 6.1 per cent and for State
Aboriginal babies it was 5.1.x
Australian Early Childhood Development Census (AEDC)
The AEDC uses the early development instrument tool to measure how young children have
developed as they start their first year of full-time school. A teacher completes a checklist for
each child across each of the five domains of early childhood development: physical health and
wellbeing, social competence, emotional maturity, language and cognitive skills, communication
skills and general knowledge. The scores of all Australian children are ranked and children
ranked in the bottom 10 per cent are classed as “developmentally vulnerable” whereas those in
18 ONCE PRINTED THIS DOCUMENT MAY BECOME OUT OF DATE Trim Record No: ED-CO-17-17829
REFER TO THE ONLINE SOURCE FOR THE CURRENT VERSIONKimberley Health Profile 2018
the top 75 per cent are classed as “on track” while those in between are classed as “at risk”.
Results are reported by a child’s community of residence.
Across Australia in 2015, one in five children (22%) was developmentally vulnerable on one or
more domains of the AEDC. Furthermore, 11 per cent were developmentally vulnerable on two
or more domains. The results for the Kimberley local communities are shown in Table 6.
Four local communities had sufficient data for publishing, all of which had a higher proportion
vulnerable on one or more domains than the overall Australian proportion. The total published
number of Kimberley children vulnerable in at least one domain was 262 (170 in at least two
domains).
Within the Kimberley the proportion of children rated as developmentally vulnerable on one or
more domains ranged from 34 per cent in Broome to 69 per cent in Halls Creek. The proportion
rated vulnerable on two or more domains ranged from 22 per cent in Broome to 50 per cent in
Halls Creek.xvii As mentioned in the Socio-economic disadvantage section, the proportion of
Aboriginal people is high in these vulnerable areas.
Table 6: Kimberley AEDC children developmentally vulnerable on at least one domain 2015
Children Vulnerable Total
Local Community One or more domains Two or more domains children
Number % Number % surveyed
Broome 91 33.7% 60 22.1% 270
Derby-West Kimberley 66 47.8% 41 30.0% 138
Halls Creek 50 69.4% 36 50.0% 72
Wyndham-East Kimberley 55 44.7% 33 27.0% 123
Australia 22.0% 11.1%
Source: AEDCxvii
Note: AEDC data are not reported for locations in which three or fewer children had been assessed.
* Suppression of AEDC data also occurs when one or more of the following have not been met:
Fewer than fifteen children had valid AEDC scores /Less than two teachers had completed AEDC instruments for children in that location/AEDC
instruments were completed for less than 80% of all non-special needs children.
Additional minor suppressions have occurred where necessary to preserve confidentiality of related suppressed cells
These tables and more information may be found at http://www.aedc.gov.au/
Implications for health service planning:
The AEDC results indicate the high need for child development services including
access to multidisciplinary teams made up of medical services, child health
nurses, speech pathology, physiotherapy and occupational therapy.
Childhood Vaccinations
Immunisation against communicable disease is an effective public health intervention that
reduces the mortality and morbidity associated with vaccine preventable conditions. Australian
vaccination coverage targets of greater than 90 per cent of children at two years of age and
near 100 per cent of children at school entry age are recommended. The coverage needs to
exceed 90 per cent to create the community immunity necessary to stop ongoing transmission
of these diseases.xviii
19 ONCE PRINTED THIS DOCUMENT MAY BECOME OUT OF DATE Trim Record No: ED-CO-17-17829
REFER TO THE ONLINE SOURCE FOR THE CURRENT VERSIONKimberley Health Profile 2018
In 2017, the childhood vaccination coverage for Kimberley region is above the 90% target for all
age groups. In this region the majority of vaccinations are provided by community health centres
(Table 7).v
Table 7: Kimberley vs. WACHS vs State childhood immunisation 2017
Kimberley Health Region WACHS WA State
Age Group Non- Non- Non-
Aboriginal Persons Aboriginal Persons Aboriginal Persons
Aboriginal Aboriginal Aboriginal
12 to < 15 Months 91% 96% 93% 90% 94% 94% 88% 94% 94%
24 to < 27 Months 90% 92% 91% 85% 92% 91% 83% 90% 89%
60 to < 63 Months 96% 96% 96% 96% 92% 93% 95% 92% 92%
Source: Immunise Australia Program website, Department of Health, Australian Governmentxix
Health and Wellbeing Surveillance System (HWSS), 0-15 years
The Department of Health in WA conducts a continuous HWSS. This is a population survey
carried out by phone, which is designed to provide results and examine trends at a population
level. It is unlikely to be representative of minority groups such as Aboriginal people and the
homeless as they are less likely to have phone access. Parents/guardians report on behalf of
children aged 0-15 years. Due to the high proportion of Aboriginal people in the Kimberley, the
prevalence count and rates are more likely to be an underestimate.xx
The HWSS (2010-2015), showed a significantly higher proportion reported as having used a
hospital service in the last 12 months (38% compared with 27%). A significantly lower
proportion reported using a primary health care service (72% compared with 81%) (Table 8).
For the Kimberley region, the HWSS also showed:
one in three children (31%) had a parent who smoked during their pregnancy although the
proportion of people who reported their home was smoke free was 99%;
most children (94%) did not eat the recommended daily serves of vegetables;
one in four children (28%) did not eat the recommended daily serves of fruit;
nearly half of children (46%) did not do sufficient physical activity;
and one in twenty children (5%) reported height and weight measurements that classified
them as obese;
one in four children (25%) reported an injury requiring treatment from a medical professional
in the previous year;
and one in fourteen children (7%) had asthma; and
these proportions were similar to the State.
20 ONCE PRINTED THIS DOCUMENT MAY BECOME OUT OF DATE Trim Record No: ED-CO-17-17829
REFER TO THE ONLINE SOURCE FOR THE CURRENT VERSIONKimberley Health Profile 2018
Table 8: Kimberley vs. State Health and Wellbeing Surveillance System (HWSS) child population profile
2010-2015
Western
Kimberley Significant
Australia
difference from
Prevalence Prevalence WA*
(% ) (% )
Health Enhancing Behaviours
Health is rated excellent or very good 85.8 87.0 -
Home is smoke free 98.8 98.2 -
Eats recommended serves of fruit daily 5-15 years (a) 72.2 67.4 -
Eats recommended serves of vegetables daily 5-15 years (b) 5.5 8.1 -
Sufficient physical activity 5-15 years (c ) 53.6 46.1 -
Risk factors
Either or both parents smoked during pregnancy 31.4 24.9 -
Sedentary for more than two hours a day 5-15 years 21.8 24.5 -
Overweight 5-15 years 20.3 16.1 -
Obese 5-15 years 4.9 6.5 -
Conditions and injury
Current asthma 6.7 9.2 -
Injury 24.6 20.7 -
Health Service Utilisation in the last 12 months
Used a primary health care service (e ) 72.2 80.7 Lower
Used a dental health care service 50.2 58.5 -
Used a mental health care service (f) 3.3 4.2 -
Used an allied health care service (g) 23.4 27.3 -
Used a hospital health care service (h) 38.4 27.2 Higher
Results significantly better than the State are highlighted green, significantly worse are highlighted red. Where results could not be interpreted
as either better or worse, or results are similar to the State, they have not been highlighted. Notes:
(a) The number of serves of fruit recommended for sufficient consumption in the 2013 Australian Dietary Guidelines by the National Health and
Medical Research Council varies dependent on age and sex. For reporting purposes, this table just presents the prevalence of children aged 5-
15 years who consume 2 serves of fruit daily, this is not equivalent to 'sufficient intake'.
(b) The number of serves of vegetables recommended for sufficient consumption in the 2013 Australian Dietary Guidelines by the National
Health and Medical Research Council varies dependent on age and gender. For reporting purposes, this table just presents the prevalence of
children aged 5-15 years who consume 5 serves of vegetables daily, this is not equivalent to 'sufficient intake'.
(c) Based on the 2014 Australian Physical Activity and Sedentary Behaviour Guidelines, children aged between 5 and 15 years are required to
complete at least 60 minutes of moderate to vigorous physical activity each day to achieve good health. Table 5 presents the prevalence of
children who are physically active 7 or more sessions per week and for at least 60 minutes a session.
(d) Injury in the last 12 months requiring treatment from a health professional
(e) Primary health care service includes medical specialist, general practitioner, community health centre, community or district nurse.
(f) Mental health care services include psychiatrist, psychologist or counsellor.
(g) Allied health care services include optician, physiotherapist, chiropractor, podiatrist, dietitian, nutritionist, occupational therapist or diabetes/
other health educator.
(h) Hospital based health care service includes an overnight stay in hospital, an attendance at the emergency department or an outpatient clinic.
Source: WA Health and Wellbeing Surveillance Systemxx
Potentially Preventable Hospitalisations (PPH), 0-14 years
Hospitalisations are an indicator of severe conditions in the community and assist in targeting
primary care resources to prevent hospitalisations. Many hospitalisations result from conditions
where hospitalisations could potentially be avoided using preventive care and early disease
management. These hospitalisations are known as PPH and are grouped into three major
categories:
- Acute: This category includes dehydration and gastroenteritis, pyelonephritis (kidney
infection), pelvic inflammatory disease (PID), ear, nose and throat (ENT) infections,
dental conditions, appendicitis, epilepsy, gangrene and cellulitis (skin infection).
- Chronic: This category includes asthma, diabetes (excluding renal dialysis), chronic
obstructive pulmonary disease (COPD), iron deficiency anaemia, nutritional deficiencies
and rheumatic heart disease.
- Vaccine preventable: This category includes mumps, measles, rubella, whooping cough,
influenza and pneumonia.
21 ONCE PRINTED THIS DOCUMENT MAY BECOME OUT OF DATE Trim Record No: ED-CO-17-17829
REFER TO THE ONLINE SOURCE FOR THE CURRENT VERSIONKimberley Health Profile 2018
Public health measures have the greatest influence on vaccine preventable conditions. While
effective clinical care with regular review is essential to reduce avoidable admissions for people
with chronic conditions.
For the period 2011-2015, PPH accounted for 3,153 hospitalisations of Kimberley children aged
0-14 years (21% of all hospitalisations in children). The rate of all PPH was significantly higher
(3.2 times) for Kimberley children than for children in the State.v
Figure 9 compares age-adjusted rates from 2011 to 2015 for the Kimberley and State by
Aboriginality. Kimberley Aboriginal children had significantly higher rates than Kimberley non-
Aboriginal children, State Aboriginal children and State non-Aboriginal children.v
Figure 9: Kimberley vs. State PPH by Aboriginality 0-14 years 2011-2015
Note: The error bars represent the 95% confidence interval of the rate.
v
Source: DoH, Health Tracks
Between 2011 and 2015, PPH rates were significantly higher than the State for both chronic
and acute conditions. The PPH rates for acute conditions increased significantly for children in
the Kimberley. The main conditions contributing to the high rates of acute conditions were ENT
infections, cellulitis, dental conditions, convulsions and epilepsy and urinary tract infections
(Figure 10 and Table 9).v
22 ONCE PRINTED THIS DOCUMENT MAY BECOME OUT OF DATE Trim Record No: ED-CO-17-17829
REFER TO THE ONLINE SOURCE FOR THE CURRENT VERSIONKimberley Health Profile 2018
Figure 10: Kimberley vs. State PPH Acute and Chronic 0-14 years 2011-2015
v
Source: DoH, Health Tracks (The error bars represent the 95% confidence interval of the rate.)
The Kimberley children’s PPH rate for dental conditions fluctuated between 2011 and 2015 but
remained significantly higher than the State rate throughout the five year period. There was a
peak in the PPH rate for ENT infections in 2012 for both Kimberley and State children but the
Kimberley rates were very much higher than the State rates in all five years. Kimberley cellulitis
rate was also significantly higher than the State rate throughout the five year period.v
Figure 11: Kimberley vs. State PPH dental, ENT and cellulitis 0-14 years 2011-2015
Source: DoH, Health Tracksv (The error bars represent the 95% confidence interval of the rate.)
The overall leading PPH condition for the period 2011-2015 was ENT infections, which
accounted for 38 per cent (or 1,188 hospitalisations) of all PPH in children in the Kimberley and
the rate was 4.8 times the State rate. The overall PPH rate was significantly higher than the
State (3.2 times) rate (Table 9Table 9: ). Most (75%) of the hospitalisations for ENT infections in
this age-group were in the very young children aged 0-4 years.v
Data from a national survey in 2012-13, focussing on Aboriginal populations show that hearing
problems and ear diseases, caused by chronic otitis media (middle ear infection) in childhood, is
considerably higher among Aboriginal children aged 0-14 years (7%) than non-Aboriginal
23 ONCE PRINTED THIS DOCUMENT MAY BECOME OUT OF DATE Trim Record No: ED-CO-17-17829
REFER TO THE ONLINE SOURCE FOR THE CURRENT VERSIONKimberley Health Profile 2018
children (3.6%). This is of key concern as hearing loss resultant from otitis media has significant
consequences for child language, social development and education.xxi
For 2006-2015, the rate of hospitalisations for disease of the ear and mastoid process for
Aboriginal children aged 0-14 years in the Kimberley was significantly higher (3.7 times) than
the non-Aboriginal rate for children.v
Table 9 below shows that the leading PPH for chronic conditions were rheumatic heart disease
(3%) and asthma (3% of all child PPH). The PPH rate for all the selected ten conditions were
significantly higher than the State rates and rheumatic heart disease was rate over 22 times the
State rate.v
Table 9: Kimberley leading PPH 0-14 years 2011-2015
% all child
PPH Condition Number of PPH SRR
PPH
ENT infections (acute) 1,188 38% 4.8
cellulitis (acute) 585 19% 9.8
dental conditions (acute) 537 17% 1.6
convulsions and epilepsy (acute) 181 6% 2.0
urinary tract infections, including pyelonephritis (acute) 176 6% 2.4
pneumonia and influenza (vaccine) 112 4% 5.7
rheumatic heart disease (chronic) 99 3% 22.3
asthma (chronic) 91 3% 1.1
diabetes complications (chronic) 45 1% 2.0
bronchiectasis (chronic) 23 1% 7.3
All Potentially Preventable Hospitalisations (PPH)
3,153 100% 3.2
(0-14 years)
Note: The standardised rate ratio (SRR) is the ratio between a particular health region (or district) and the State. A ratio of 1 means the regional
rate is the same as the State, a value of 2 indicates the regional rate is twice that of the State, and an SRR of 0.5 indicates the rate in a region is
half that of the State population.
Note: Local rates are compared to the rate of all residents of the State using the SRR and the 95% confidence interval of the SRR. Those that
are significantly different to the State rate (1.0) have black font, and those that are not significantly different to the State have white font. Those
between 1 and 1.5 times the State rate are highlighted orange, higher than 1.5 times the State are highlighted red while those rates less than
the State are highlighted green.
v
Source: DoH, Health Tracks
Injuries, 0-14 years
For the period 2011-2015, injury and poisoning hospitalisations in children aged 0-14 years in
the Kimberley accounted for 1,515 hospitalisations (10% of all hospitalisations in children). The
hospitalisation rate of all injury and poisoning was significantly higher for Kimberley children
(3,354 per 100,000 person years) than for children in the State (1,664 per 100,000 person
years).v
The leading causes of injury and poisoning hospitalisations for children in the Kimberley were
accidental falls, exposure to mechanical forces and transport accidents. The hospitalisation
rates were significantly higher than the State for each of these external causes and transport
accidents were 3.4 times the State rate.v
The rate of hospitalisations for accidental falls in children in the Kimberley was 979 per 100,000
person years and peaked in 2012 before stabilising for 2013-2015 (Figure 12). The State rate
24 ONCE PRINTED THIS DOCUMENT MAY BECOME OUT OF DATE Trim Record No: ED-CO-17-17829
REFER TO THE ONLINE SOURCE FOR THE CURRENT VERSIONKimberley Health Profile 2018
was also at its highest in 2012 before decreasing significantly thereafter. For children aged 0-4
years, the rate was 996 per 100,000 person years, also significantly (1.5 times) higher than the
State rate.v
The rate of hospitalisations for exposure to mechanical forces in children aged 0-14 years in the
Kimberley was 748 per 100,000 person years and the main forces were cutting/piercing objects,
animals and being hit, struck or crushed by an object.v
Motor vehicle/motorcycle accidents were the main transport accident hospitalisations in
Kimberley children at a rate of 311 per 100,000 person years, which was 6.1 times higher than
the State rate. The rate for transport accidents was at its highest in 2012, 2013 and 2015.v
Figure 12: Kimberley vs. State hospitalisations for leading causes of injury and poisoning 0-14 years 2011-
2015
v
Source: DoH, Health Tracks (The error bars represent the 95% confidence interval of the rate.)
Notifiable Infections, 0-14 years
Death and illness resulting from communicable diseases are a major public health problem.
Effective containment of many communicable diseases has occurred due to public health
legislation requiring reporting of these diseases. ‘Notifiable’ diseases include a range of vaccine
preventable diseases, vector borne diseases, food and water borne diseases, sexually
transmitted infections and infections such as Severe Acute Respiratory Syndrome (SARS).
Under the provisions of the Public Health Act 2016xxii, any medical practitioner or nurse
practitioner attending a patient known or suspected to have a notifiable communicable disease
has a legal obligation to report the diagnosis to the Department of Health. The Act states that
notifications must also be made in the case of post mortem examination and by Pathologists
who identify a patient may have a notifiable condition. A complete list of the current notifiable
diseases can be accessed via the WA Department of Health.xxiii
25 ONCE PRINTED THIS DOCUMENT MAY BECOME OUT OF DATE Trim Record No: ED-CO-17-17829
REFER TO THE ONLINE SOURCE FOR THE CURRENT VERSIONYou can also read