Review of Central Hawke's Bay District District Plan - District Economic Assessment - EPA NZ
←
→
Page content transcription
If your browser does not render page correctly, please read the page content below
Attachment 1

Review of Central Hawke's Bay District
                         District Plan
      District Economic Assessment

                    August 2013

                    Report Prepared by
                    Sean Bevin, Consulting Economic Analyst
                    Economic Solutions Ltd, Napier
                    Email: sean.bevin@economicsolutions.co.nz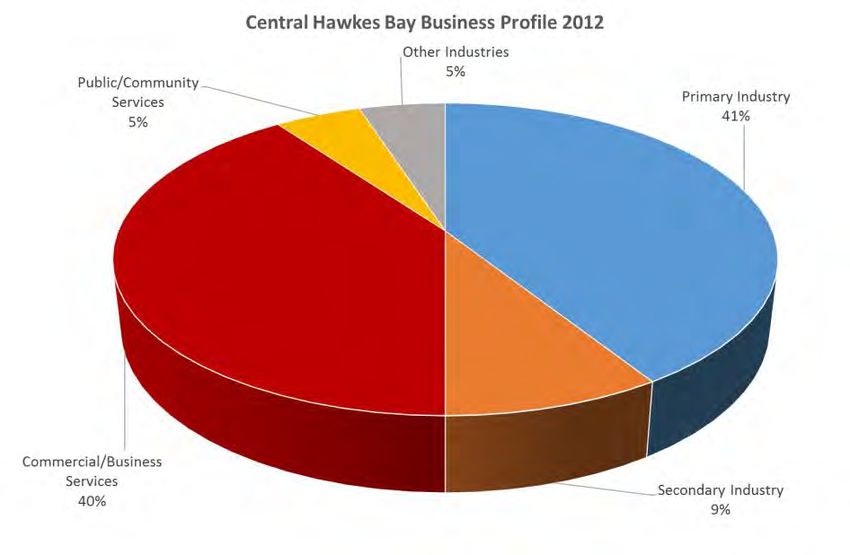
Contents
Executive Summary ........................................................................................................................ i

1-                Introduction ............................................................................................................... 1

2-                Economic Profile and Trends ..................................................................................... 2

3-                Growth ‘Drivers’ and Development Opportunities ................................................. 13

4-                Economic Growth Outlook ...................................................................................... 23

5-                Accommodating Additional Business/Industry Development ................................ 26

6-                Conclusion and Recommendations ......................................................................... 30

Appendices

CHBD District Plan Aug131.doc                                                                                               Economic Solutions Ltd
i
Executive Summary
1. This report provides an economic assessment of the historical, current and forecast future situation
of the Central Hawke’s Bay district, for the purposes of the review of the District Plan for the area
that is now being undertaken by the Central Hawke’s Bay District Council. The report is also
intended to inform the formulation and implementation of the Council’s important Economic
Development Strategy.
2. The specific economic matters that are addressed in the assessment include the current
demographic and economic profile of the district, trends in key economic indicators for the district
over the past decade or so, the main drivers of economic and social/community development in the
area, forecast future demographic and economic growth in the area over the longer-term, district
advantages and strengths for additional industrial development, implications of the analysis for the
District Plan review and also future economic development policy, and associated
recommendations.
3. District Profile – the main findings of the report in respect of this matter are as follows:
The main demographic characterisatics of the district include its relatively small population
base, limited population growth, majority rural population, ageing population, significant Maori
population, household growth significantly ahead of population growth and an increasing
number of single-person households.
Rural economic activity accounts for the vast majority of the total district land area and pastoral
farming and associated cropping account for most of the total rural production land.
Horticultural land uses have grown considerably over the past decade but nevertheless still
account for a relatively small proportion of the total rural production land area. The total rural
land area under irrigation is currently in the order of 7,500ha or 3% of the total pastoral/
cropping/horticultural land area in the district.
Primary production and commercial/ business services account for over 80% of all businesses in
the district, with sheep/beef/grain farming accounting for the highest proportion of total
agricultural sector business numbers. The district has a limited base of manufacturing
businesses. Grape-growing, mixed sheep/beef and dairying enterprises have increased in
number noticeably during the past ten years. The dominant manufacturing activity is meat
processing, followed well behind by log sawmilling, and the manufacturing of fabricated metal
products and plant and equipment. The district also has a predominantly small business profile.
The direct wealth-creating sectors of primary production and processing-manufacturing
collectively account for about 55% of total economic activity and employment in the district.
Changing external market conditions impacting these sectors result in a considerably fluctuating
economic growth track in the area. As with the rest of the Hawke’s Bay region, overall earnings
levels and the standard of living in the district are noticeably below the overall national
situation. Tourism adds to the much needed economic diversification of the district.
Over the past decade, annual employment in the district has generally been in the range 6,000-
7,000. Unemployment has been increasing since 2006/2007 and the annualised rate of
unemployment in 2012 stood at 8.3%. Employment seasonality is a particular feature of the
district, as it is across the Hawke’s Bay region as a whole.
CHBD District Plan Aug131.doc Economic Solutions Ltd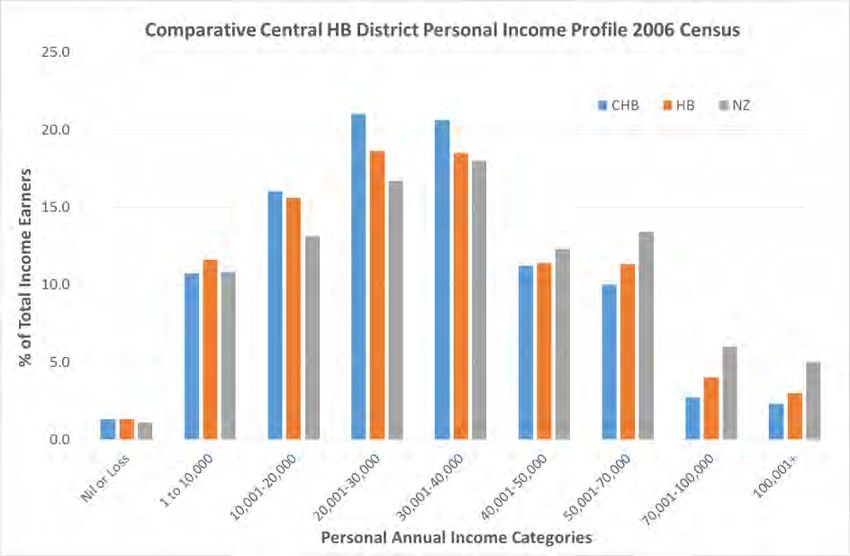
ii
4. Economic and Social Development ‘Drivers’ – the detailed report identifies the main ‘drivers’ over
time of economic and social development in the district as including:
Historically, the economic state of the dominant primary production sector (especially sheep
and beef farming) and the related primary processing and rural servicing sectors.
The primary production and processing sectors have in turn been significantly influenced over
time by a range of internal and external factors such as climatic vagaries, livestock numbers,
international market conditions, exchange rate levels, labour availability, processing capacity,
farm management and farming practices, degree of land use intensification and technology
change (including irrigation).
Population and household growth, and the availability of employment opportunities.
5. Future Population and Household Growth – the main findings of the analysis in the report on this
matter, are as follows:
Both population and household growth in the district are currently tracking Statistics New
Zealand ‘Medium’ or ‘middle of the road’ growth projections for these two indicators, which
indicate total population decline of close to 8% over 2013-2031 accompanied by limited total
household growth of under 3%. The population of both the 0-14 and 15-64 (traditional working-
age cohort) age-groups is projected to fall significantly whilst the 65+ population is projected to
double. The district’s Maori population is projected to increase by 10% over the period.
The amount of zoned and serviced land currently available in the district for additional housing
is considerably in excess of even the Statistics New Zealand most optimistic household growth
projection for the area.
The proposed Ruataniwha Water Storage Scheme, if implemented, will result in a considerable
additional labour requirement for the district.
Whilst the analysis in the report infers, on the basis of prevailing and projected population
growth trends, a good case for the formulation and implementation of a focused population
growth and attraction strategy in the district, nevertheless, it is considered that this should
await the provision by Statistics New Zealand of the detailed population results for the area
from the 2013 Census and a detailed analysis of the results and their implications for the future
development of the district.
It is also considered that a future population growth strategy in the district should also be
closely linked to, amongst other factors, addressing specific development requirements and
opportunities in the area (such as the proposed major water storage project), in order that the
strategy contributes to sustainable population, residential and economic growth and
development in Central Hawke’s Bay.
6. Ruataniwha Water Storage Scheme – the main points to note from the analysis on this matter are
as follows:
One of the objectives of the Scheme, which is now being assessed by the Government’s
Environmental Protection Authority, is to provide a major and secure supply of irrigation water
for future rural land use in its catchment. Current planning is that the Scheme could potentially
irrigate 20,000 to 30,000ha of farmland with associated productivity gains extending to a
CHBD District Plan Aug131.doc Economic Solutions Ltd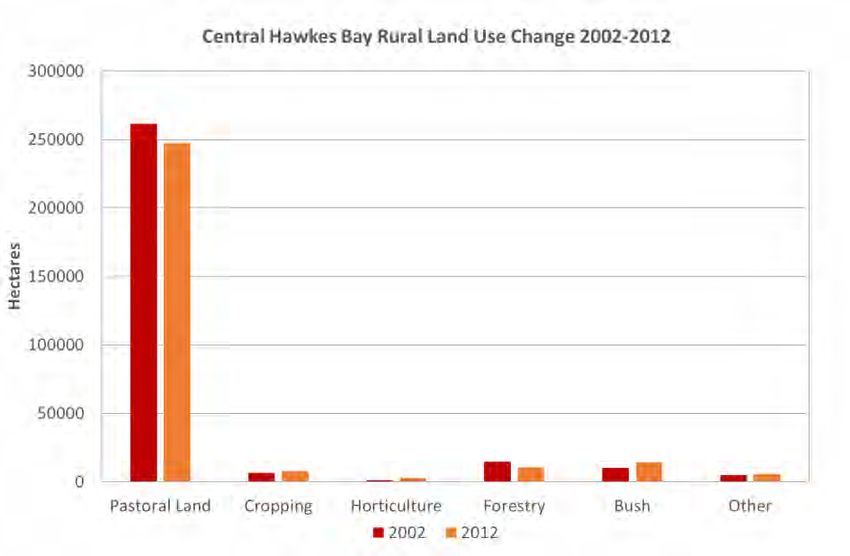
iii
greater area. As with other significant irrigation initiatives in New Zealand, the Scheme should
facilitate a wider range of and more intensive agricultural land uses in the district (e.g. grazing,
mixed use/cropping, vegetable growing, dairying, pipfruit and viticulture), resulting in a
currently estimated $160 million annual increase in farm-gate production in the area.
The total multiplied or flow-on regional GDP and employment impacts of the Scheme are
currently respectively assessed at, at the present time: construction ($350 million GDP spread
over 12 years and a total employment impact of 4000 job-years or the equivalent of 4000
people each working on a particular job for one year), increased farm production (an annual
GDP gain of $127 million and an associated total fulltime equivalent employment impact of
1,160) and allied additional processing activity (potential maximum annual impacts of GDP $108
million and employment 1,090).
The multiplied or flow-on impacts cover the business activity required to service the total
construction stage for the Scheme (construction of the dam and the irrigation network),
agricultural activity once the network is operational, any allied ‘processing’ activity and the
household spending of personnel involved in some capacity with the construction and ongoing
operation (including additional agricultural activity) of the Scheme. The impacts therefore
represent a significant additional or new commercial opportunity for local and regional
businesses, as well as providing further employment opportunities in the district and region.
The detailed report identifies a range of other socio-economic gains potentially arising for the
district/region from the Scheme’s construction and operation, as well as the positive on-farm
and off-farm financial and economic gains generated by other major irrigation initiatives in the
South Island.
7. District Growth and Employment Outlook – for the purposes of the District Plan review, Chapter 4
of the report provides an assessment of the long-term economic growth outlook for the Central
Hawke’s Bay district using three different but interrelated growth scenarios. The first scenario,
based on a continuation of the district’s historical long-term annual average real GDP growth record
of approximately 1%, results in overall GDP growth of $113 million or 32% for the period 2012-2040.
The second scenario, incorporating the above GDP impact and also a 10% lift in pastoral farming
production in the district due to non-irrigation related on-farm productivity improvements, results
in a total GDP gain over the period of $164 million or 47%. The third scenario, building on the
previous two scenarios and also incorporating the water storage project, results in a total GDP gain
for the period of $330 million or 94%. The first scenario results in an overall small fall in total district
employment for the period whilst the second and third scenarios result in 4% and 38% (+2,400)
gains respectively in district employment.
8. Accommodating New Business/Industry Development – the report was requested to consider,
amongst a number of related matters, the advantages afforded by the Central Hawke’s Bay district
for potential further industrial and business development in the area, whether originating from the
water storage project or for other reasons, and the capacity of the district to cater for this
development in the future. The key points to note from the detailed commentary in the report on
these matters are as follows:
Approximately 45% of the existing zoned and serviced Business Zone 2 industrial/commercial
Takapau Rd area land in Waipukurau is still available for further appropriate business and
CHBD District Plan Aug131.doc Economic Solutions Ltdiv
industrial development (ESL understands that there is currently no Business Zone 2 land readily
available for development within the main Waipawa urban area).
It is understood that the Central Hawke’s Bay District Council is considering upgrading and
extending infrastructural services in the Takapau Rd industrial-commercial area, as the situation
warrants this.
Other business and industrial location attributes of the district include possible use of suitable
land in rural centres in the district, potential use of some of the existing building stock in the
industrial zones, ready access to major state highway and rail networks, relatively central
location vis-à-vis the Napier-Hastings (including the Port of Napier) and Tararua/Manawatu
areas/markets/supply sources, the potential additional labour supply in these areas for Central
Hawke’s Bay based enterprises, close proximity of the district’s primary production sector for
industries and business services closely linked to the sector, and lower business operation costs
(e.g. land purchase and building purchase/rental costs, and labour costs).
Potential industrial local disadvantages of the district include transport costs to market or
overseas shipping facilities, local labour supply limitations and the limited local industrial
infrastructure.
The Council is in the process of implementing a more proactive, structured and strategic
economic development approach/plan for the district, in order to address requirements
associated with new business development and attraction including those associated with the
proposed water storage project, future district labour and skill/skill training needs in relation to
the project and other district developments, further tourism and events sector development in
the district, and the provision of residential accommodation and community services to meet
theneeds of the water storage project construction workforce.
It is suggested that if the Central Hawke’s Bay District Council, following the recommended
analysis of the detailed population results for the district from the 2013 Census, decides to
proceed with a focused population and residential population growth strategy for the area, then
this should be incorporated within the Council’s overall focused Economic Development Plan for
the district.
9. Recommendations – Section 6.3 of the detailed report contains some recommendations arising
from the report’s analysis, for Council consideration as part of the District Plan Review and/or
implementation of the Economic Development Plan. The recommendations are as follows:
i) The main findings of the report be reflected as appropriate in the District Plan Review including,
as appropriate, an initial base commentary profiling the district at the present time and
commenting on its future growth outlook;
ii) The importance of sustained economic growth and development of the district should be one of
the key themes underpinning the District Plan Review;
iii) The Council implements a proactive and strategic economic development approach in the
district via the proposed Economic Development Strategy and that this approach includes a
dedicated resource to lead the ‘on the ground’ work with the implementation of the Strategy,
ongoing close liaison with regional economic development entities and the development of a
structured Council industry support package;
CHBD District Plan Aug131.doc Economic Solutions Ltdv
iv) As part of the implementation of the Strategy, major emphasis be placed on addressing future
district requirements associated with the proposed Ruataniwha Water Storage Project, including
implications of the project for the District Plan Review and the future availability of serviced
industrial land;
v) Close consideration be given by the Council to the need for a focused and proactive population
growth and urban land development strategy in the district, and its linkages to the Economic
Development Strategy; and
vi) As part of v) above, a suitably detailed analysis of the 2013 Census demographic results for the
district and their local community and economic development implications, should be
undertaken.
CHBD District Plan Aug131.doc Economic Solutions Ltd1
1- Introduction
1.1 The Central Hawke’s Bay District Council is undertaking a review of its District Plan and as part of
and informing the review, has requested this specific Economic Assessment of the Central Hawke’s
Bay district.
1.2 The review of the District Plan has three main components, comprising reviews of the district’s
major and minor urban centres, the Coastal Zone of the district and the area’s rural sector. It is
intended that the Economic Assessment be relevant to all of these aspects. It is also intended to be
important for the Council’s Economic Development Strategy and associated initiatives.
1.3 Consistent with the Council’s brief for the Assessment, it comprises the following specific
elements:
i) A profile of the demographic, residential/urban, physical/land, business/industry, growth
and labourforce basis of the Central Hawke’s Bay district and its economy;
ii) An analysis of the main historical longer-term trends occurring within these aspects of the
district economy since around Year 2000;
iii) An assessment of the key ‘drivers’ or influences on the social/community and
economic/industry development of the district historically and in the future;
iv) Future population and household growth in the district;
v) An assessment of the longer-term economic and industry growth outlook for the district
under different growth and development scenarios (including agricultural sector impacts
of the potential Ruataniwha Water Storage Project) and the associated economic
implications for the district;
vi) An assessment of the economic advantages and opportunities for the Central Hawke’s Bay
district in terms of additional/new industrial development in the area in the future,
relative to other parts of the Hawke’s Bay region;
vii) An assessment of the main implications of the analysis undertaken in parts i) to vi) above
in relation to planning for future urban and economic growth and development in the
Central Hawke’s Bay district; and
viii) In light of the results of the overall analysis and assessment of key policy implications,
broad recommendations for future District Plan attention to the district’s economy, urban
centres and industry sectors.
1.4 The above matters are addressed in the following main sections of the report, either on their own
or as part of an interrelated analysis.
1.5 It is noted that the long-term planning horizon for the District Plan review is in the order of 35-40
years. As far as possible, the Economic Assessment is also broadly consistent with this time-frame.
1.6 The main information sources used for the analysis include Statistics New Zealand, Central Hawke’s
Bay District Council, local consultation with Council representatives and community/business
personnel, New Zealand Institute of Economic Research, Hawke’s Bay Regional Council
documentation, Ministry of Primary Industries and the Ministry of Social Development.
CHBD District Plan Aug131.doc Economic Solutions Ltd2
2- Economic Profile and Trends
2.1 This chapter provides a detailed analysis of the current profile of the Central Hawke's Bay district
community and economy, and key trends in the area since Year 2000. The commentary provides
the basis for the rest of the analysis in the report.
Population
2.2 In June 2012, the estimated population of the Central Hawke's Bay district stood at 13,350. This
represented approximately 9% of the total Hawke's Bay regional population. Since 2000, the
annual district population has remained relatively stable, within the range 13,150 to 13,500. The
latter figure was recorded in both 2010 and 2011; last year, the district’s population fell by 150 or -
1.1%. The total population change of 200 over the long-term period 2000-2012 has comprised
natural population increase (births-deaths) of 1,016 and a total net migration loss of -816. This loss
comprised a net internal population migration loss to other New Zealand localities of -446 and a net
migration loss to overseas destinations of -370. Since 2000, the years for most net external
(overseas) migration loss have been 2002, 2009, 2011 and 2012.
2.3 Since 2000, Central Hawke's Bay district’s population has increased overall by 1.5%. In comparison,
throughout the rest of the Hawke’s Bay region Wairoa district’s population has fallen by 14.6%
whilst the Napier City and Hastings district populations have risen by 4.5% and 8.9% respectively.
The total regional population has increased by 5.2%, in comparison to 14.9% nationally.
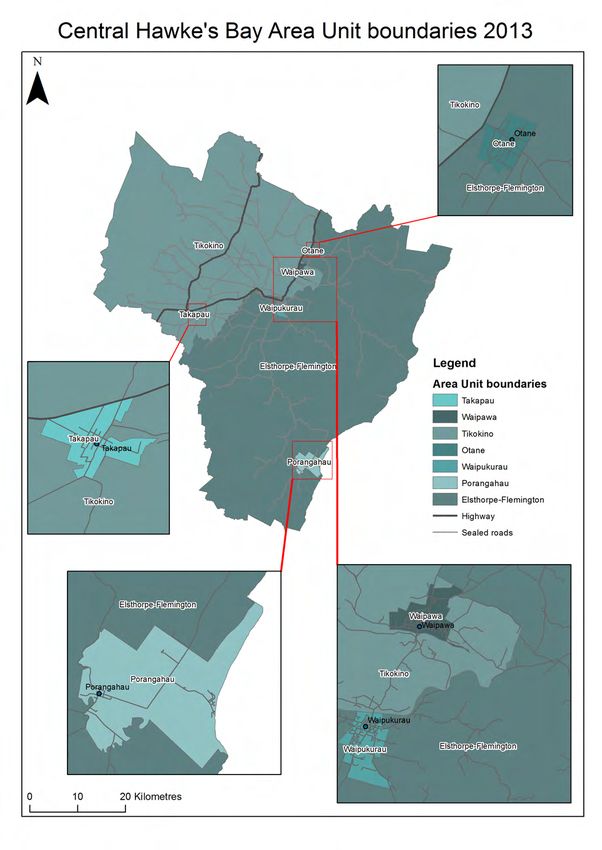
2.4 Table 1 indicates the population changes that have occurred inside the district at the ‘Census Area
Unit’ level since 2000 and also the current locational profile of the population. Appendix 1 contains
a map of the areas listed in the table. The information source is Statistics New Zealand.
Table 1: Central Hawke's Bay District Population Location Profile 2000-2012
Resident Population Population
Population Share
Area Change (%)
2000 2013 % 2013
2000-2013
Waipawa 1,925 2,040 15.3 6.0
Waipukurau 4,010 4,070 30.5 1.5
Sub-Total 5,935 6,110 45.8 2.9
Elsthorpe-Flemington 3,010 3,260 24.4 8.3
Otane 560 560 4.2 0.0
Porangahau 270 220 1.6 -18.5
Takapau 595 490 3.7 -17.6
Tikokino 2,780 2,710 20.3 -2.5
Sub-Total 7,215 7,240 54.2 0.3
TOTAL DISTRICT 13,150 13,350 - 1.5
Last year, the combined main urban area of Waipawa-Waipukurau accounted for approximately
46% of the total district population and the remaining primarily rural parts of the district the
balance of 54%. Population growth within the district has been highest over the 2000-2012 period
in the Elsthorpe-Flemington, Waipawa and Waipukurau areas, in this order. The population of the
remaining (rural) centres as a group, has fallen by 5.4%.
CHBD District Plan Aug131.doc Economic Solutions Ltd3
2.5 In 2012, the broad age-group profile of the Central Hawke's Bay district population was 0-14 years
(21% of the total population), 15-39 years (27%), 40-64 years (36%) and 65 years plus (16%). In
2001, the respective proportions were 0-14 years (24%), 15-39 years (31%), 40-64 years (33%) and
65+ years (12%). The proportions for the first two age-groups have thus fallen over the period,
whilst the proportions for the last two groups have increased. The median or ‘middle’ age of the
district population was estimated at 41 years in 2011, compared to 39 years in 2006. The Hawke's
Bay region figure in 2011 was 39 years.
2.6 Based on Statistics New Zealand ethnic group population projections, the Maori population of
Central Hawke's Bay district currently stands at an estimated 3,140 or 24% of its total population.
This represents a gain of 240 or 8.3% since 2001, compared to the European/ Other Ethnicities gain
of 1.8%.
Households
2.7 The total number of households/dwellings in the district currently stands at an estimated 5,360 and
has increased by an estimated 420 or 8.5% since Year 2000, compared to the population gain of
1.5%.
2.8 At the same time, average household occupancy (average number of persons per household) in the
district has fallen from 2.66 to 2.49. This is due to social factors occurring in the community such as
the ageing population, changing marriage and family structures, and changing housing preferences.
2.9 Table 2 indicates the Census Area Unit profile of household growth within the Central Hawke’s Bay
district since Year 2000. Over the period, the total number of households in the combined main
Waipukurau-Waipawa urban area, which currently accounts for 46% of all households in the
district, has risen by 122 or 5.2%. Total households in the remainder of the district as a whole,
which account for 54% of all district households, have increased by 298 or 11.6%. Within the
general rural area of the district, the fastest growing areas in terms of household numbers have
been, in order, Porangahau, Elsthorpe-Flemington, Tikokino and Otane. Elsthorp-Flemington and
Tikokino together currently account for just over 80% of all households in the rural part of the
district. The information source is Statistics New Zealand.
Table 2: Central Hawke's Bay District Household Growth 2000-2013
Household Growth Household
Household Share
Area Change (%)
2000 2013 % 2013
2000-2013
Waipawa 777 815 15.2 4.9
Waipukurau 1,586 1,670 31.2 5.3
Sub-Total 2,363 2,485 46.4 5.2
Elsthorpe-Flemington 1,123 1,280 23.9 14.0
Otane 190 205 3.8 7.9
Porangahau 105 120 2.2 14.3
Takapau 209 215 4.0 2.9
Tikokino 950 1,055 19.7 11.1
Sub-Total 2,577 2,875 53.6 11.6
TOTAL DISTRICT 4,940 5,360 - 8.5
CHBD District Plan Aug131.doc Economic Solutions Ltd4
2.10 Within the district, family-based households comprise 72% of all households, single-person 26%
and other household types 2%. The comparative national figures are 71%, 24% and 5%
respectively. Over the next 20 years, the number of ‘family’ households in Central Hawke’s Bay is
projected to fall by about 8% whilst the number of single-person households is projected to rise by
almost 30%. ‘Couple without children’ families are projected to increase in number by 10% with
the number of single and two-parent families declining significantly.
Economic
Land Use
2.11 The total land area of the Central Hawke’s Bay district is approximately 332,800 hectares, of which
the area in rural land use comprises the vast majority at 87%. The remainder comprises the major
and minor urban centres in the district including their commercial, industrial, community and other
parts, and other non-rural land uses.
2.12 According to the results of the Statistics New Zealand 2012 Agricultural Production Census, pastoral
farming and associated cropping land accounts for 88% of the total district land area in rural
production/land use, followed well behind by native bush/scrub 5%, exotic forest land 4%,
horticultural land 1% and other rural land the balance of 2%.
2.13 Figure 1 below indicates the area changes over the 2002-2012 period for the different rural land
use categories in the district. Those categories recording an increased area are pastoral cropping
land +20%, horticultural land +191% and land in native bush and scrub +41%. Pastoral/grassland
land declined in land area by 5.4% and the area in exotic forest land by 26.2%. The area in all other
rural land use increased by 15%. Over the period, the total rural land use area in the district fell by
3.3%.
Figure 1:
2.14 In 2012, Central Hawke’s Bay district accounted for a third of the total rural land use area in the
Hawke’s Bay region, compared to 40% for Hastings district, 26% for Wairoa district and 1% for
Napier City. Central Hawke’s Bay also accounted for 40% of the total pastoral and associated
cropping land in the region, slightly ahead of Hastings district at 38%. Central Hawke’s Bay district
also accounted for 14% of total regional horticultural land, 9% of exotic forest land, 29% of all
native bush/scrub land and 19% of all the other regional rural land.
CHBD District Plan Aug131.doc Economic Solutions Ltd5
Business/Industry
2.15 In February 2012, Statistics New Zealand figures show that the total number of businesses in
Central Hawke's Bay district was recorded at 2,254. Figure 2 indicates the broad industry/business
profile of the district. The dominant categories are rural/land based production and commercial/
business services, which account for 41% and 40% respectively of total district business numbers.
Secondary industry (manufacturing, utility services and construction) accounts for 9%, public-
community services 5% and ‘other’ industry activities the balance of 5%. Appendix 2 provides
more detailed information on industry business numbers in the district at the Census Area Unit
level. The leading individual industries in the district in terms of business numbers are, in order,
pastoral farming; leasing of residential and non-residential property and equipment; construction;
retailing; financial and insurance services, rural servicing, professional, scientific and technical
services; wholesaling; health care/social services; transport/storage and horticulture/fruit
production.
Figure 2:
The firms that are most likely to be found in the rural parts of the district currently account for
approximately 40% of all businesses in the area. Those industries traditionally located within
defined industrial/business ‘zones’ within or close to main urban centres account for an estimated
25%. The balance of 35% are located in more central business parts of the district.
2.16 Total business numbers in the district increased overall by 9% between 2000 and 2012. However,
there has been a gradual fall in the number of businesses from 2007, overall by approximately 6%.
Since 2000, the total number of rural production businesses has fallen by 14.3%. Manufacturing
business numbers have been relatively stable. The combined number of utility (power, gas, water,
drainage services) and construction industry businesses has increased by 47%. The total number of
commercial services enterprises has risen by 51%. The number of community-based public and
services industries has risen by 11%.
2.17 Within the broad rural production sector, the largest industries in the district in terms of business
numbers are currently, in order, agriculture (which accounts for almost 85% of all businesses within
the sector), followed a long way behind by rural industry support services, horticultural activity and
forestry/logging. Sheep/beef/grain farming accounts for almost 80% of all agricultural businesses
CHBD District Plan Aug131.doc Economic Solutions Ltd6
in the district and 87% of all pastoral farming enterprises. Other significant agricultural industries in
terms of business numbers include dairy cattle farming, pipfruit and grape growing, deer farming,
vegetable growing and a range of crop growing.
2.18 Additional relevant results for the district from the 2012 Statistics New Zealand Agricultural
Production Census include as follows:
In terms of farm numbers, the leading farming activities are mixed sheep/beef, specialised
beef cattle farming and specialised sheep farming, in this order. These farming activities
account for 80% of total pastoral livestock farming. The district accounts for almost 40% of
all Hawke’s Bay pastoral farms within these three categories(2007 Census).
Sheep account for 84% of total livestock numbers in Central Hawke’s Bay, beef cattle 10%,
dairy cattle 3%, deer 2% and all other livestock 1%.
The range of livestock and other feed crops grown in the district includes hay, silage, balage,
maize, forage brassicas, wheat, barley, oats, cereal and maize grains, peas and seeds/seed
crops.
Fruit crops grown in the district include wine grapes, pipfruit, summerfruit, cherries and
plums, olives and nuts.
Horticultural crops grown in the area include peas, squash and a range of other basic
vegetables.
The total land area under an irrigation system is approximately 7,500ha or approximately 3%
of the total land area currently in pastoral farming, associated cropping and horticulture.
2.19 The latest Statistics New Zealand Agricultural Census also indicates a total forestry area in the
Central Hawke’s Bay district of some 10,600 hectares, representing approximately 9% of the
regional total. In 2012, there were some 28 forestry and logging enterprises in the Central Hawke’s
Bay district, accounting for 9.6% of the Hawke’s Bay total. The number of such enterprises has
been relatively stable in the district over the past decade.
2.20 In the western ranges and foothills area of the district, pastoral farming activity includes breeding
and the finishing of lambs and cattle. The middle part of the district and lower rolling to flat
country is mainly finishing with some breeding. The coastal hill country in the district is
predominantly breeding with some finishing when the season allows. Dairying is located primarily
in the Tikokino area of Central Hawke’s Bay. Horticultural activity is also centred on the Tikokino
area and to a lesser extent the Elsthorp-Flemington area.
2.21 Within the agricultural sector in the district, there has been an overall noticeable increase in
business numbers since 2000 in the rural support service industries, grape growing, mixed sheep-
beef farming, grain and other crop growing, dairy cattle farming and horse farming. At the same
time, business numbers have fallen significantly in nursery and floricultural production, outdoor
vegetable production, pipfruit growing, specialised sheep and specialised beef farming, deer
farming and pig farming. It is noted that business numbers in the district’s rural sector have
generally fallen since the 2006-2008 period, as a result of, amongst a range of factors, the impact of
the major international and domestic economic downturn.
2.22 Business numbers for the manufacturing sector are currently highest in the district for the meat
and bakery product processing industries, log sawmilling and the manufacturing of fabricated metal
CHBD District Plan Aug131.doc Economic Solutions Ltd7
products, machinery/equipment and furniture items. Either small gains or declines in business
numbers have been the order of the day for the main manufacturing categories in the district, since
2000. The major meat processing firm in the district, Silver Fern Farms, is based in Takapau
township and employs up to 700 staff at the peak of the season.
2.23 Individual service industries in Central Hawke’s Bay district containing the highest number of
businesses at the present time are, in order, rental/hiring/real estate services, construction,
retailing, financial and insurance services, professional/scientific/technical services, education and
training, wholesaling, visitor accommodation and food services, health care and social assistance,
and transport/postal/warehousing services. Those industries that have recorded a significant
increase in business numbers over the past twelve years include construction; financial and
insurance services; rental, hiring, real estate services; professional, scientific, technical services; and
administrative and support services.
2.24 Appendix 2 also indicates the Census Area Unit based distribution of business activity across the
Central Hawke’s Bay district. Last year, the Elsthorpe-Flemington area accounted for the highest
proportion (37%) of total business numbers across the district, followed by Tikokino (29%),
Waipukurau (21%) and Waipawa (8%). Otane/Porangahau/Takapau combined accounted for the
balance of 5%. The largest business categories in Elsthorpe-Flemington are pastoral farming and
property/equipment leasing services; similarly in Tikokino; Waipukurau – property/equipment
leasing services, construction services, retailing and financial/insurance services; and Waipawa-
property/equipment leasing services and construction services. For the combined
Otane/Takapau/Porangahau area, the leading business categories are pastoral farming,
construction services, retailing, food services and property/equipment leasing services.
2.25 Figure 3 illustrates the current industry employment size profile for Central Hawke's Bay district. As
indicated, businesses/industries employing no staff account for the majority of employers in the
district; these include, for example, contractors and the self-employed. Businesses employing 1-5
staff are the next largest group, accounting for 25% of all businesses in the district.
Figure 3:
CHBD District Plan Aug131.doc Economic Solutions Ltd8
Economic Activity and Growth
2.26 This section indicates the current contribution of the different broad industry groups in Central
Hawke's Bay to total nominal (current dollar terms) GDP (Gross Domestic Product) in the district.
Statistics New Zealand industry based GDP and employment estimates for the Hawke's Bay region,
have been used as the base for the analysis. Table 3 details the respective industry contributions to
district GDP in both value and percentage terms, along with their employment contributions. The
latter aspect is examined in the next section of this chapter.
Table 3: Central Hawke's Bay District Industry GDP and Employment Profile 2012
Gross Domestic Product (GDP) Total Employment
Industry
$M % of Total # % of Total
Rural Production 119 25.8 1,755 27.6
Processing/Manufacturing 130 28.2 1,530 24.0
Utilities & Construction 37 8.0 371 5.8
1
Trade & Hospitality Services 34 7.4 802 12.6
Transport/Storage/Coms 18 3.9 224 3.5
Commercial Services 32 6.9 216 3.4
2
Community Services 43 9.1 1,288 20.2
Public Administration 9 2.0 156 2.5
Other Industry 10 2.2 23 0.4
3
Owner Occupied Dwellings 29 6.5 - -
GST On Production & Taxes 39 - - -
TOTAL 500 - 6,365 -
Notes:
1. Comprises wholesale trade, retailing, visitor accommodation and cafes/restaurants
2. Comprises health, education, welfare, recreational, arts and household services
3. Consistent with national income accounting process
2.27 Rural production and processing/manufacturing together account for 54% of total Central Hawke's
Bay GDP. This is followed by, in order, community services, utilities/construction services, trade
and hospitality services and commercial services.
2.28 Figure 4 tracks the trend in annual economic growth as a whole for the Central Hawke's Bay
district, since 2002. The comparative growth trend for the full Hawke's Bay region is also shown.
Economic growth in the district has fluctuated considerably during the period; significant positive
growth was experienced over 2002-2004, followed by economic decline over the next four years;
however, positive annual growth rates have mostly been recorded since 2009 although to varying
degrees. The fluctuating pattern of growth in the district over the past decade or so is reflective of
its relatively small overall economy, heavy reliance on rural/sheep-beef production and industries
servicing this sector, and resulting major exposure to changing external forces such as climatic
conditions, exchange rates and commodity price levels.
CHBD District Plan Aug131.doc Economic Solutions Ltd9
Figure 4:
2.29 ‘GDP Per Capita’ is a formal measure of the economic standard of living within a particular
community jurisdiction. The current level for the Central Hawke’s Bay district is approximately
$37,453 in nominal terms. This compares to $37,683 for the full Hawke’s Bay region and $47,076
for the country as a whole. The district has a slightly lower overall standard of living compared to
the regional level and both areas are well below the national level for this indicator.
2.30 The Central Hawke’s Bay district makes a valuable contribution to the Hawke’s Bay region’s export
performance via its fruit-growing, sheep/beef farming, dairying and meat processing industries.
2.31 Table 4 provides annual results for the period since 2000 for different categories of consented new
building activity in the district and also consented building alterations. The data source is Statistics
New Zealand. This information provides a valuable additional indication of the performance of the
district economy over time.
Table 4: Central Hawke's Bay District Consented New Building Activity and Building Alterations 2000-2012
Number of Buildings Consented
Year New Comm- New Farm New Buildgs Building
New Dwellings
Industrial Bldgs Buildings Total Alterations
2000 57 7 42 106 194
2001 51 16 57 124 233
2002 43 9 45 97 220
2003 32 9 39 80 231
2004 81 9 82 172 261
2005 70 4 79 153 294
2006 93 9 61 163 267
2007 80 10 46 136 240
2008 58 2 43 103 208
2009 33 7 33 73 140
2010 46 9 30 85 163
2011 38 2 35 75 114
2012 19 2 32 53 104
CHBD District Plan Aug131.doc Economic Solutions Ltd10
New home building peaked over 2004 until 2007 but has fallen quite noticeably since then,
particularly last year. New commercial/industrial building fell noticeably in 2002, 2005, 2008 and
2011-2012. New farm building has been steady at a significantly lower level from 2009. Across
these three building sectors, there has been a gradual decline in activity from the peak years of
2004-2006. Consented building alterations have followed a similar trend. However, despite this,
the period since 2006 has still seen a total of 274 new dwellings consented, 32 new
commercial/industrial buildings and 219 new farm buildings.
2.32 Tourism – despite its relatively small overall contribution to the district economy (estimated at 5%
of total district employment from a broad visitor industry perspective), this sector is nevertheless
still a valuable component of the Central Hawke's Bay district economy, from the point of view of
adding to the diversity of the local economy beyond its heavy reliance on rural production. In 2012,
Statistics New Zealand information indicates that a total of 8,636 visitors stayed in commercial
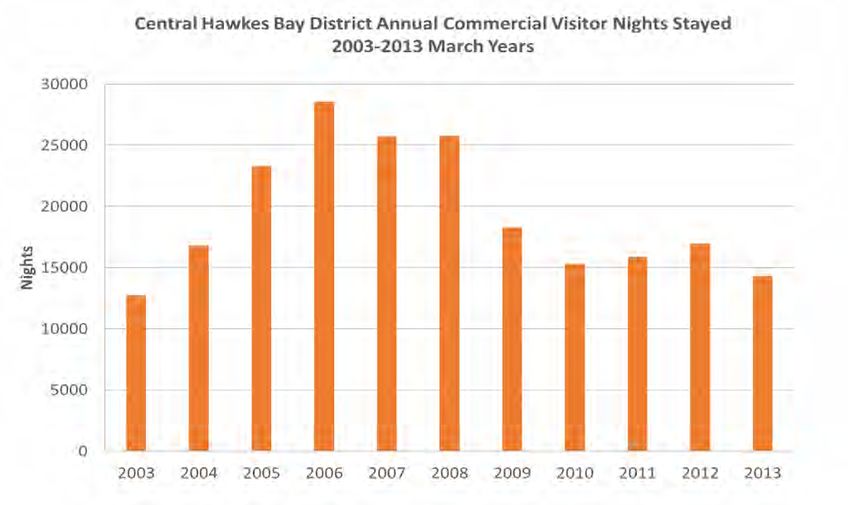
accommodation in the district, with a total night-stays impact of approximately 13,510. Figure 5
shows the annual trend in total commercial accommodation night-stays in the district, since 2003.
This indicator increased steadily over 2003-2006. It was then steady at a lower level over
2007/2008. Visitor-nights dropped sharply in 2009 but recovered a little in 2010. Since then, they
have again fallen steadily.
Figure 5:
Labour Market
2.33 Table 2 on page 3 also provides a Year 2012 industry based employment profile of Central Hawke's
Bay district. Last year, total full and part-time employment in the district was recorded at 6,365.
The largest employing industry groups were, in order, rural production, processing and
manufacturing, community services and trade/hospitality services. Together, these industries
accounted for 84% of total district employment. The largest individual employing activities in the
district are currently meat processing, sheep and beef farming, pipfruit growing, specialised sheep
farming, dairying, supermarkets, primary education, the ‘caring’ industry, shearing services and
road freight services, in this order.
CHBD District Plan Aug131.doc Economic Solutions Ltd11
2.34 Figure 6 indicates the trend since 2002 in total full/part-time employment and unemployment in
Central Hawke's Bay district. Employment rose steadily over 2001-2004, fell back from then until
2008, increased the following two years and has stabilised since then. It is noted in this context that
the closure of the major Ovation New Zealand meat processing plant in Waipukurau in mid 2011
resulted in a total local job loss of over 300 staff, although not all of these would have resided in
the district .
Figure 6:
Unemployment has fluctuated throughout the period and has ranged from a low of 301 in 2007 to
a high of 583 in 2009. Over the monitoring period, the annualised rate of unemployment in the
district has also fluctuated noticeably, within the range 4.8% to the peak figure of 8.3% recorded in
2009 and again in 2012. The combined Hawke's Bay-Gisborne figure for 2012 was 8.1%. The rate
of unemployment in the district generally fell over 2001-2006 but has since increased. Ministry of
Social Development figures indicate a total of 198 Central Hawke’s Bay residents receiving the
unemployment benefit in June 2012, 237 in September 2012, 177 in December last year and 97 in
March 2013. The figure for the March quarters since 2009 has been increasing steadily, peaking at
186 in March last year. These results are also indicative of the significant seasonality of the labour-
market in an area such as Central Hawke’s Bay with a strong rural production orientation. It is
noted that the profile of unemployment benefit recipients in the district in March this year
included 55% male, 41% Maori and 67% in the 40-64 age-range.
2.35 Earnings Levels – the annual median earnings figure for continuing jobs in Central Hawke's Bay
district in 2011, was approximately $40,000 in nominal terms. The comparable Hawke's Bay region
and national figures were $41,300 and $45,440 respectively. At the regional level, the sectors with
the highest annual median earnings levels in that year were, in order, education and training,
finance/insurance/hiring/rental services, mining/utility services/construction, manufacturing,
public administration/arts and recreation services and wholesaling. The median earnings level for
these sectors was above the $45,000 mark; the level for the overall rural production sector was
$37,720. As Table 2 indicates, this sector accounts for over a quarter of total employment in
Central Hawke's Bay. The four sectors with the lowest median earnings levels in Hawke's Bay (rural
production, retailing, visitor accommodation and health care/social assistance) account for 56% of
total employment in Central Hawke's Bay. In June this year, the number of Central Hawke’s Bay
people receiving a Government benefit stood at 876, including unemployment benefit 155,
domestic purposes benefit 287, sickness benefit 126 and invalids benefit 243.
CHBD District Plan Aug131.doc Economic Solutions Ltd12
2.36 Income Distribution- Figure 7 indicates the comparative Central Hawke’s Bay district, total Hawke’s
Bay region and national personal income profiles in the full year preceding the 2006 Census. This is
the latest information available. The graph indicates a number of noticeable differences between
the incomes profiles of the three areas. The full Hawke’s Bay region has a greater proportion of
income-earners in the $1-10,000 category than the other two areas. The district and region have
significantly higher proportions of income-earners in the next three categories, than at the national
level. The district and region have noticeably lower proportions of income-earners compared to the
national level, in the $40,000+ income groups. Central Hawke’s Bay district has a higher proportion
of income-earners in the $10,001-40,000 categories than at the regional level and a lower
proportion than that regionally for the other income categories above this income range.
Figure 7:
It is noted that in 2005/06, approximately 70% of Central Hawke’s Bay district income-earners had
an annual personal income level below $40,000, compared to 66% for the Hawke’s Bay case and
60% for the country as a whole.
The Ministry of Social Development’s national Social Report 2010 indicated that in 2006, the latest
date for which this information is available, 20.2% of the Central Hawke’s Bay district population
lived in low-income households, compared to the 20.4% figure for the whole Hawke’s Bay region
and the national figure of 18.1%. The lowest regional figures in the country were Wellington at
14.1%, Auckland at 15.6% and Marlborough at 18%. The Central Hawke’s Bay district figure in 1991
was 32.3%. The proportion for the district has therefore declined considerably since that time.
CHBD District Plan Aug131.doc Economic Solutions Ltd13
3- Growth ‘Drivers’ and Development Opportunities
3.1 This section indicates the key ‘drivers’/influences on economic growth and development in Central
Hawke's Bay district and the considered main development opportunities for the area over the
longer-term.
Rural Sector
3.2 Chapter 2 of the report indicated amongst other things the major economic importance to the
district of the primary production industries and related processing and servicing industries.
Together, they account for an estimated 45% of all businesses in the district and 55-60% of total
employment in the area.
3.3 The broad agricultural industry in turn accounts for approximately 90% of all businesses and
employment in the total rural production/ processing/servicing sectors.
3.4 The sheep and beef farming industry within agriculture in turn accounts for over 80% of all
agricultural production sector businesses in the district and 56% of total employment in the sector.
Sheep and beef farming also accounts for 87% of all pastoral farming businesses in Central Hawke's
Bay and 81% of total pastoral farming employment.
3.5 Since 2000, the contribution of the rural production and related processing sectors to total sector
employment in the district has generally remained in the range 50-60%. Last year saw a noticeable
increase in the proportion from around 50% to 55%.
3.6 Thus, the rural sector generally and the pastoral (in particular, sheep and beef) farming industry has
historically been and continues to be, a key driver and influence on overall economic growth and
development in the district. Given this situation and also the natural resource base and physical
profile of the district, ongoing international export demand for New Zealand rural/food production
and continuing initiatives to increase productivity and financial returns in the country’s primary
production sector generally, the critical influence of the rural sector on the district’s overall
economic performance over the longer-term is expected to continue.
3.7 One of the implications of this is that the district will continue to be significantly exposed to (and
need to manage) the effects of significant internal and external changes impacting the local primary
production sector, such as climatic conditions, livestock supply, international market conditions,
international commodity price levels, exchange rate levels, local processing capacity and labour
availability. A number of these factors are referred to in Section 3.9 below which indicates most
recent Ministry of Primary Industries medium-term growth forecasts for New Zealand rural
industries.
3.8 It is noted that the NZ Institute of Economic Research is presently forecasting annual average
growth for the national agricultural production sector of around 2% over the next decade.
3.9 The Ministry of Primary Industries latest (2013) SONZAF ‘Situation and Outlook for New Zealand
Agriculture and Forestry’ report indicates the following national outlook to 2017 for those
CHBD District Plan Aug131.doc Economic Solutions Ltd14
industries that also have a presence in the Central Hawke’s Bay district. The impacts of this year’s
major drought in the North Island are incorporated in the forecasts:
Sheep: sheep breeding numbers are forecast to increase slightly this year, drop back a little in
2014/2015 and fall further over 2016/2017. The lamb schedule price is forecast to increase
over the next four years, following this year’s expected significant decline. Sheep meat export
volumes are forecast to decline significantly during the coming year but then lift in 2015 and
stabilise from that point. The value of sheep meat exports is also forecast to decline sharply
this coming year but then increase gradually from 2015.
Wool: total sheep numbers are forecast to fall gradually over the next four years. The average
sale price for wool is expected to fall sharply this year but then increase steadily over 2014-
2017. Export volumes for wool are forecast to fall next year, recover in 2015 and fall back
slightly in 2016/2017. Export values are forecast to increase steadily over the next four years.
Beef: total beef cattle numbers are forecast to continue to decline over the next five years.
The price of schedule prime beef is forecast to fall further this year but then pick-up from 2015.
Beef meat export volumes are forecast to drop sharply in 2014 and then stabilise from that
point. Export values are also forecast to fall over the coming year but then lift gradually over
2015-2017.
Dairying and Venison: following the fall this year in the dairy price, it is forecast to rise again in
2014 and continue to increase further from that point. Consequently, the value of exports is
also expected to increase. Venison export values are forecast to fall over the next two years
due to reduced production levels; they are then expected to recover over 2016/2017 due to
increased prices.
Horticulture: wine exports are forecast to increase in value terms over the next three years due
to increased production and prices. Pipfruit production is forecast to be relatively stable over
the next four years; prices are forecast to increase slightly during the period whilst export
returns increase significantly overall.
Forestry and Logging: both log prices and export volumes are forecast to increase gradually
over the medium-term; timber prices are forecast to rise steadily over the period but export
volumes are forecast to remain unchanged.
3.10 It is noted that the SONZAF report also comments that ‘An increase in irrigable land could facilitate
an expansion in New Zealand’s vegetable growing capacity and hence potential investment in
vegetable growing capacity’ (P44).
3.11 With regards to pastoral farming in the Central Hawke’s Bay district, opportunities for further
growth and development of the sector are considered to include:
Greater alignment and integration of supply chains from on-farm to processors and to
consumers.
Active farmer participation in the national ‘Red Meat Sector’ development strategy (greater
in-market coordination, more efficient and aligned procurement, and implementation of
sector ‘best practice’ systems).
Improved livestock and environmental management practices.
Greater technology application.
Continuing conversion to mixed sheep-beef farming systems.
CHBD District Plan Aug131.doc Economic Solutions Ltd15
Further farm aggregation.
Participation in the Government’s Primary Growth Partnership funding programme.
More intensive farming practices encouraged by, amongst other things, increased use of
irrigation.
3.12 Processing/Manufacturing
Processing activity in Central Hawke’s Bay is dominated by the food sector and within this meat
processing. The latter is currently represented by, for example, the Silver Fern Farms Company
based in Takapau which processes lamb and mutton and employs some 700 staff at the peak of the
season, and the Ovation operation in Waipukurau. Reference has been made earlier in the report
to the closure in 2011 of the major 26 year-old Bernard Matthews meat processing operation at the
facility now owned by Ovation. It is noted that the reasons given at that time for the closure of the
Waipukurau enterprise included changing consumer tastes in the marketplace, significant decline in
lamb kill numbers and the relatively isolated plant location. It is understood that a small pet food
operation is currently being run at the facility.
Other processing and manufacturing industries operating in the district include small bakery,
timber product/sawmill, printing, chemical, metal fabrication and machinery/equipment
operations. As most of these activities are orientated to the rural or local community sectors, their
future growth is essentially dependent on activity in these sectors. Much the same can be said for
many of the commercial and community based services operating in the district. Within both the
generally light industrial and commercial services base in the district, the opportunity may continue
to exist for specialised business activity servicing national or possibly international markets.
3.13 Population Growth and Residential Development
The district’s population is currently tracking between the current Statistics New Zealand ‘Low’ and
‘Medium’ projection population growth scenarios.
On this basis, the projected population figure in 2021 is approximately 13,000, down on the current
level (13,350). The figure in 2031 is projected at 12,300, representing a further fall from the Year
2021 figure. Statistics NZ’s ‘High’ most optimistic projection results in a Year 2031 population figure
for the district of 15,150, a gain of 1,800 or 13.5% on the current level.
Under the Medium ‘middle of the road’ projection, the district’s 0-14 population is projected to fall
by 14% between 2011 and 2031, the 15-39 population by 16% and the 40-64 population by 24%,
whilst the 65+ population is projected to almost double. The traditional 15-64 working-age
population is projected to fall by 21% whilst the population of the broader working-age 15+ group
is projected to increase only slightly. The Maori population of the district is projected to increase
by approximately 10% during the 2011-2021 period.
On the basis of the number of households currently estimated for the district, as indicated in Table
2, this indicator is currently tracking the Statistics New Zealand ‘Medium’ growth projection for the
district. Household growth over the period 2013-2031 is projected to range from -560 for the ‘Low’
projection to +1,040 for the ‘High’ most optimistic projection, with the ‘Medium’ projection
resulting in a total of 140 additional households in the district. Figure 8 indicates the projected
household growth trend for the long-term period under the different projection scenarios.
CHBD District Plan Aug131.doc Economic Solutions LtdYou can also read