Modeling and prediction of COVID-19 in the United States considering population behavior and vaccination
←
→
Page content transcription
If your browser does not render page correctly, please read the page content below
February, 2021
                                                                                                                                                             Research Article

                                           Modeling and prediction of COVID-19 in the United
                                           States considering population behavior and
                                           vaccination
                                           Thomas Usherwood1,2,+ , Zachary LaJoie1,2,+ ,Vikas Srivastava1,2 *

                                            Abstract
                                            COVID-19 has devastated the entire global community. Vaccines present an opportunity to mitigate the pandemic;
arXiv:2103.00677v1 [q-bio.PE] 1 Mar 2021

                                            however, the effect of vaccination coupled with the behavioral response of the population is not well understood.
                                            We propose a model that incorporates two important dynamically varying population behaviors: level of caution
                                            and sense of safety. Level of caution increases with the number of infectious cases, while an increasing sense of
                                            safety with increased vaccination lowers precautionary behaviors. To the best of our knowledge, this is the first
                                            modeling approach that can effectively reproduce the complete time history of COVID-19 infections for various
                                            regions of the United States and provides relatable measures of dynamic changes in the population behavior
                                            and disease transmission rates. We propose a parameter dI as a direct measure of a population’s caution
                                            against an infectious disease, that can be obtained from the ongoing new infectious cases. The model provides
                                            a method for quantitative measure of critical infectious disease attributes for a population including highest
                                            disease transmission rate, effective disease transmission rate, and disease related precautionary behavior. We
                                            predict future COVID-19 pandemic trends in the United States accounting for vaccine rollout and behavioral
                                            response. Although a high rate of vaccination is critical to quickly end the pandemic, we find that a return
                                            towards pre-pandemic social behavior due to increased sense of safety during vaccine deployment, can cause
                                            an alarming surge in infections. Our results indicate that at the current rate of vaccination, the new infection
                                            cases for COVID-19 in the United States will approach zero by the end of August 2021. The model can be used
                                            for predicting future epidemic and pandemic dynamics before and during vaccination.
                                             Keywords
                                             COVID-19 | Infectious Disease Model | Behavior Model | Vaccination Model | SARS-CoV-2 | Pandemic | Epidemic
                                            1 School of Engineering, Brown University, Providence, RI 02912, USA
                                            2 Center for Biomedical Engineering, Brown University, Providence, RI 02912, USA
                                            + Both authors contributed equally

                                            *Corresponding author: Vikas Srivastava
                                            Email: vikas srivastava@brown.edu
                                            Brown University, 184 Hope Street, Box D, Providence, RI 02912

                                                                  Introduction                                        In the last year, many papers have been published on mod-
                                                                                                                 eling the COVID-19 pandemic [4, 5, 6, 7, 8, 9, 10, 11, 12, 13].
                                           Coronavirus Disease 2019 (COVID-19) began as a localized              Several modeling studies are based on differential equation
                                           outbreak in Wuhan, China in December 2019 and quickly                 compartment models involving compartments for susceptible,
                                           spread internationally to become a global pandemic. More              infectious, and recovered individuals, commonly referred to
                                           than a year later, over 113 million people have become in-            as SIR models [14, 15, 16, 17, 18, 19]. Introducing additional
                                           fected with COVID-19 with more than 2.5 million deaths                compartments allows researchers to study the effect of vacci-
                                           worldwide [1]. To combat the spread of this virus, the Pfizer         nation and examine how to optimally distribute a vaccine. Ma-
                                           – BioNTech COVID-19 vaccine was approved in the United                trajt et al. [20] used an age-stratified population to determine
                                           Kingdom on December 2, 2020 [2] , and the Pfizer – BioN-              the consequence of vaccine effectiveness and population cov-
                                           Tech and Moderna vaccines were subsequently approved for              erage of the vaccine to indicate the optimal vaccine allocation.
                                           emergency use authorization in the United States [3]. In light        Bubar et al. [21] accounted for the possibility of ruling out
                                           of these recent developments, the potential impact of the dis-        individuals with antibodies from receiving the vaccine using
                                           tribution for COVID-19 vaccines is tremendous. Giving the             a serological test, and added an age-dependent effectiveness
                                           public, health officials and government, model-based trend            of the vaccine. Effects of vaccination have been examined in
                                           predictions and additional guidance on effective vaccine dis-         past outbreaks such as the 2009 H1N1 Swine Flu outbreak
                                           tribution and potential problems is critical.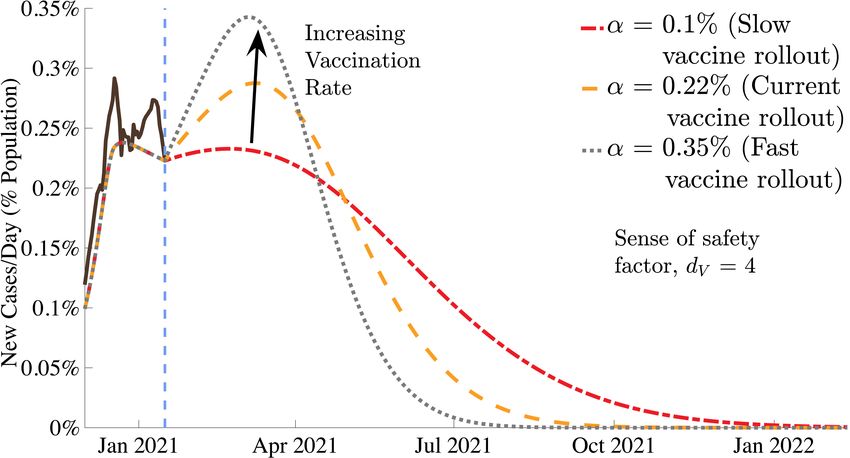
Modeling and prediction of COVID-19 in the United States considering population behavior and vaccination — 2/11

and the 2014-2016 Ebola epidemic [22, 23, 24, 25, 26, 27].                                 1. Results
These studies have introduced population compartments that
                                                                   We find that the time dependent infectious disease transmis-
separate the population by their location and give insights into
                                                                   sion rate β (t) is best given by β = β0 fI fV , where β0 is the
what locations should receive vaccines first [28].
                                                                   population maximum infection transmission rate observed in
    A critical aspect of COVID-19 vaccination that remains         the absence of any preventative societal measures. fI and fV
unexplored is a population’s behavioral changes during the         are level of caution and sense of safety functions, respectively,
prolonged period of vaccination. While behavioral responses        proposed as:
have not been addressed with respect to vaccines, efforts have
been made to study the effects of non vaccine related behav-               fI = e−dI I
ioral changes for previous pandemics. These studies vary                         1       1

                                                                                                                                (1)
from the models on the effectiveness of social measures like               fV = + 1 −         e−dV V .
                                                                                 fI      fI
quarantining and social distancing [29, 30, 31] to characteriz-
ing the nature of spread of the disease [32, 33]. One particular   The function fI models caution in a population, where its indi-
example that was reasonably effective in modeling behavioral       viduals take measures to reduce disease transmission through
changes during a pandemic was the closed-loop feedback in          social distancing, personal protective equipment, hygiene and
the compartmental SIR model presented by Perra et al. [29].        local government mandates. The population’s level of cau-
The authors examined behavioral changes by modeling the            tion to the number of infectious cases is determined by a
rate at which individuals enter self-imposed quarantine depen-     factor dI , which was observed to change several times over a
dent on the number of infectious individuals.                      long duration in a given population due to changing popula-
    Over the last year, the time history of new infected re-       tion awareness and response, pandemic fatigue, seasons, and
gional cases has fluctuated drastically and has posed signifi-     changing government mandates. These changes in sensitivity
cant challenges for the infectious disease modeling commu-         of the population to the number of infectious cases gives rise
nity. A model that can represent the region/population specific    to the multiple peaks in the number of new infected cases ob-
COVID-19 cases accurately for the entire period of this pan-       served nearly universally during the COVID-19 pandemic. fI
demic has not yet been reported. We propose a mathematical         approaches 0 in the limiting case of very high values of level
model and a framework that incorporates the naturally occur-       of caution factor dI , reflecting extreme cautionary measures
ring behavioral responses of a population to infectious cases      by the population against the pandemic and leads to negligi-
coupled with possible additional behavioral changes exhibited      ble disease transmission. A dI value approaching 0 gives fI
during vaccination that has the ability to represent infection     as 1, reflecting a population whose behavior is approaching
dynamics for the entirety of available COVID-19 case data in       pre-pandemic levels of minimal disease related precautionary
the United States (US) regions. We define “level of caution”       actions.
to represent a population’s precautionary/safe behavior dur-            In addition, we included a competing sense of safety in
ing an ongoing pandemic that results from a combination of         our model, in which measures to reduce disease transmission
increased social distancing, use of personal protection equip-     are gradually decreased due to an increasing proportion of the
ment, improved hygiene, and lockdown regulations. We also          population becoming vaccinated, offsetting the effects of a
introduce “sense of safety” to represent a population’s return     reduced transmission rate arising from an underlying level of
to normal, pre-pandemic behavior as more and more people           caution. However, as modeled in equations 1, the net transmis-
are vaccinated. We introduce suitable mathematical forms to        sion rate will never exceed the base maximum transmission
represent these two important behavioral aspects and incor-        rate β0 . As the sense of safety factor dV approaches a very
porate these dynamic functions into our differential SIRDV         small value (population not dropping its guards down due to
model framework.                                                   vaccinations), the sense of safety function fV approaches 1
    Fitting our model to available daily new infection case data   and fV has no effect on β . On the contrary, a high dV reflects
for four major US states (Massachusetts, California, Florida       an increased sense of safety, causing cautionary measures
and South Dakota) and two major US cities (Atlanta and New         against the disease transmission to be significantly reduced,
York City) for the first year of the pandemic, we show that our    leading to fV = f1I . In this case, infection-related level of
modeling framework is versatile at capturing a large range of      caution is completely negated and the disease transmission
developments of the COVID-19 pandemic over time, and it            rate β approaches the population’s highest transmission rate
provides valuable insights into each population’s underlying       β0 .
social behavior. Introducing a vaccine to the population in our
model, we analyzed the interaction between vaccine distribu-       1.1 Infection data fit and interpretation for COVID-
tion rate and vaccine related additional behavioral responses           19 in the United States
of the population. We used our model to predict future trends      We show that our modeling framework that mathematically
for the pandemic with the advent of vaccine distribution.          incorporates the dynamic level of caution within a SIRDV
                                                                   differential framework (shown in Figure 7, represented by
                                                                   equations 2 and discussed in detail in Section 2) is able to fit

                                       T. Usherwood, Z. LaJoie, and V. Srivastava, 2021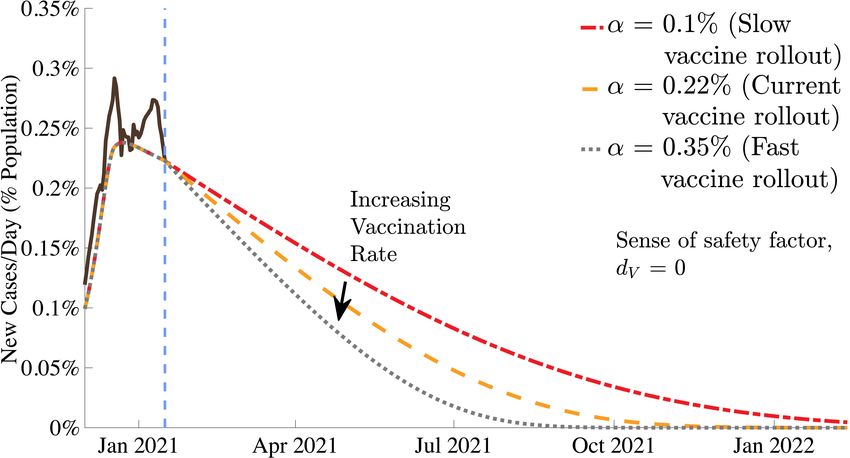
Modeling and prediction of COVID-19 in the United States considering population behavior and vaccination — 3/11

and predict the entire COVID-19 case history1 for the selected                   found that bustling New York City, was on the higher end of
representative populations2 within the US. The model was                         the baseline transmission rate with basic reproductive ratio
fit to four US states (Massachusetts, California, Florida and                    for New York City obtained to be R0 = βγ = 4.5), whereas a
South Dakota) and two major US cities (New York City and                         less densely populated state like South Dakota has a much
Atlanta). These regions were chosen to represent a variety                       lower baseline transmission rate and a lower R0 value of 2.5.
of population densities and varying geographical locations.                      R0 values for other regions can be found from Table 1.
We accounted for the fact that the reported cases were lower
than the actual infection cases in the population due to lack                        Region       µ [%]   1/γ [days]   β0 [1/days]   dI     (Behavioral Period)
of testing and asymptomatic cases using a factor M. M has                                                                            40      (March 15 - Apr 24)
                                                                                  Massachusetts                           0.28       500     (Aug 2 - Aug 3)
a high value at the beginning of the pandemic due to lack of                                                                         38      (Dec 21 - )
testing and reduces to a lower value as testing becomes more                                                                          450     (March 15 - Apr 9)
                                                                                                                                      110     (Jul 18 - Jul 19)
available. The simplified M shown in Figure 1a is assumed                           California                            0.35
                                                                                                                                      470     (Oct 6 - Oct 7)
following CDC’s assessment that only 1 out of 4.6 COVID-19                                                                            40      (Dec 18 - )
                                                                                                   0.5       10                      160      (March 15 - Jul 30)
cases were reported in the US for 2020. As shown in Figure                         South Dakota                           0.25       17      (Nov 7 - Nov 8)
1, our behavioral model was able to accurately model and fit                                                                         63       (Jan 26 - )
                                                                                                                                     410    (March 15 - May 17)
representative states and cities across the United States with                                                                       54     (Jul 3 - Jul 16)
                                                                                     Florida                              0.38
few parameters for each region. Estimated parameters for                                                                             350    (Sep 20 - Sep 22)
                                                                                                                                     62     (Jan 6 - )
each region are shown in Table 1.                                                                                                    30      (March 15 - Apr 11)
     The level of caution factor dI in equation 1 is shown in Fig-                New York City                           0.45       600     (Aug 9 - Sep 1)
                                                                                                                                     60      (Jan 19 - )
ure 2a for different regions over the first year of the COVID-                                                                       290      (March 15 - Jun 11)
19 pandemic. A high level of caution factor indicates that                           Atlanta                              0.35
                                                                                                                                     92      (Jul 4 - Jul 27)
                                                                                                                                     420      (Sep 14 - Sep 15)
the population was quick to adapt their behavior in response                                                                         58      (Jan 8 - )
to an increase in infections by taking increasingly stringent
                                                                                 Table 1. Parameters for the four states and two cities for the
measures to reduce their transmission rate. Level of caution
                                                                                 2020 COVID-19 pandemic. The initial basic reproduction
in a specific population changes due to addition or removal
                                                                                 number, R0 = βγ0 , represents the expected number of
of local government regulations, new information regarding
                                                                                 secondary infections if an infectious individual was placed in
the disease, seasonal changes in behavior, pandemic fatigue,
                                                                                 the population, without any social preventative measures. dI
news leading to additional fear or any other factor that causes
                                                                                 values represent its constant value in each of the
widespread changes in behavior and disease transmission rate.
                                                                                 corresponding behavioral periods. Smooth transitions
As expected, the results show that sudden drops in level of
                                                                                 between constant values of dI were applied.
caution factor dI tend to precede surges in new cases due to
relaxed social measures. Conversely, a reduction in the influx
of new cases will occur due to significant increase in dI . This
level of caution is independent of the baseline maximum trans-                       To illustrate direct correlations between our model fit pre-
mission rate, β0 , and therefore provides a measure to compare                   dictions and real life events, we take New York City as an
social outlook towards the disease between different popu-                       example. Starting March 22, New York implemented the
lations/regions. Time varying COVID-19 transmission rate                         “New York State on PAUSE” executive order, closing all non-
β for each of the selected regions is shown in Figure 2b. β0                     essential businesses, canceling all non-essential gatherings,
describes transmission in the earliest stages of the pandemic                    and mandated social distancing. This local government regu-
for a population, when knowledge of the disease and social                       lation is directly represented in the model results for level of
measures against it were limited. Therefore, this value also                     caution which shows a significant increase in dI following this
describes the transmission that a specific population can be                     mandate (Figure 2a). Corresponding model results also show
expected to return to when the precautions against the infec-                    a sharp transition from one of the highest levels of disease
tion becomes minimal, either as infectious cases approaches                      transmission rates (Figure 2b) to one of the lowest levels of
zero or as social response to the disease becomes very low. In                   transmission rates following this government mandate. Be-
addition to the infectious disease inherent contagious charac-                   tween September 1, 2020 and January 15, 2021, the model
teristics, the base transmission rate depends on factors such as                 based dI values show that the level of caution in New York
population density, contact rate, and everyday pre-pandemic                      City transitioned from one of the highest values to one of
behavior of its individuals. Likely due to such factors, we                      the lowest. When we examine real events, we find that start-
                                                                                 ing September 2020, a series of citywide re-openings were
   1 The same model works for both pre-vaccine and during vaccination            introduced, including the opening of gyms, malls (at 50%
periods. Before vaccines become available, the vaccinated population fraction    capacity), public K-12 schools, and indoor dining (25% occu-
V in equation 1 stays zero giving fV = 1 and naturally leading to no effects     pancy). This reopening coincided with the holiday season in
from vaccine related sense of safety.
   2 For brevity we show results for selected key populations. The model can     the US at the end of the year 2020 and resulted in a significant
be applied to other regions/populations within or outside of the United States   spike in the new infection cases directly correlating with our
as well.                                                                         model predictions. Therefore, the level of caution parame-

                                                T. Usherwood, Z. LaJoie, and V. Srivastava, 2021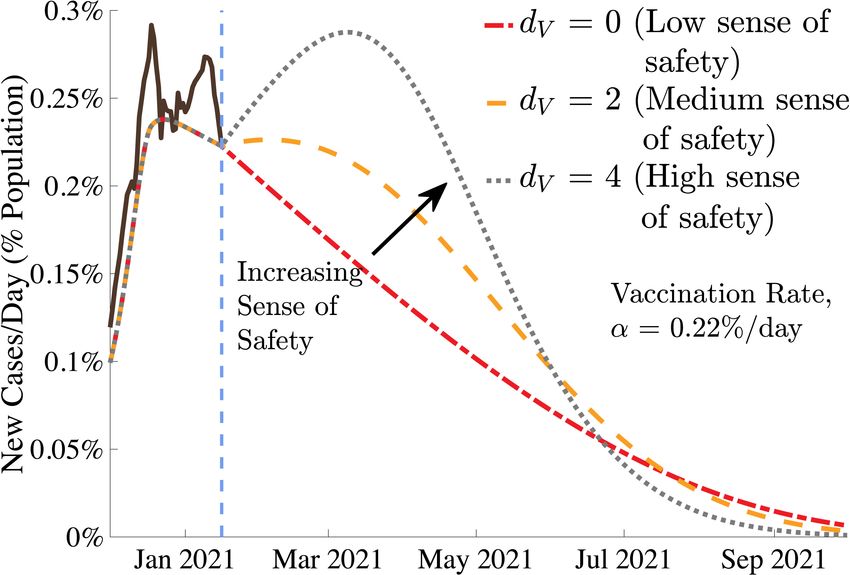
Modeling and prediction of COVID-19 in the United States considering population behavior and vaccination — 4/11

                                                                                  8

                                                       Actual/Reported Cases, M
                                                                                  6                        Increased testing

                                                                                  4

                                                                                  2   Average 4.6 actual cases per reported case [CDC]
                                                                                       May 2020 Jul 2020     Sep 2020 Nov 2020 Jan 2021

                                                       (a)

                          10000
                                             Massachusetts                                                                           30000                     Florida
                           8000
         Reported Cases

                                                                                                                    Reported Cases
                           6000                                                                                                      20000

                           4000
                                                                                                                                     10000
                           2000

                              0                                                                                                          0
                              Apr 2020   Jul 2020     Oct 2020                                 Jan 2021                                  Apr 2020    Jul 2020        Oct 2020    Jan 2021

         (b)                                                                                                     (c)
                           2500                                                                                                      60000
                                             South Dakota                                                                                                  California
                           2000
          Reported Cases

                                                                                                                    Reported Cases

                                                                                                                                     40000
                           1500

                           1000
                                                                                                                                     20000
                           500

                             0                                                                                                           0
                             Apr 2020    Jul 2020     Oct 2020                                 Jan 2021                                  Apr 2020    Jul 2020        Oct 2020    Jan 2021

         (d)                                                                                                     (e)
                          10000             New York City                                                                       3000                       Atlanta
         Reported Cases

                                                                                                               Reported Cases

                           8000
                                                                                                                                2000
                           6000

                           4000
                                                                                                                                1000
                           2000

                              0                                                                                                        0
                              Apr 2020   Jul 2020     Oct 2020                                 Jan 2021                                Apr 2020     Jul 2020        Oct 2020    Jan 2021

         (f)                                                                                                  (g)

Figure 1. Results of our behavioral model’s fit to COVID-19 data across six populations in the United States. (a) Shows M
representing the ratio of actual infectious cases to reported cases. Reported new infection case data versus model fit for (b)
Massachusetts, (c) Florida, (d) South Dakota, (e) California, (f) New York City, and (g) Atlanta. Gray bars represent the daily
reports of new COVID-19 cases. The dashed brown lines are the corresponding 7-day average. Our model’s predictions for
reported daily cases are shown as the solid red lines.

                                                    T. Usherwood, Z. LaJoie, and V. Srivastava, 2021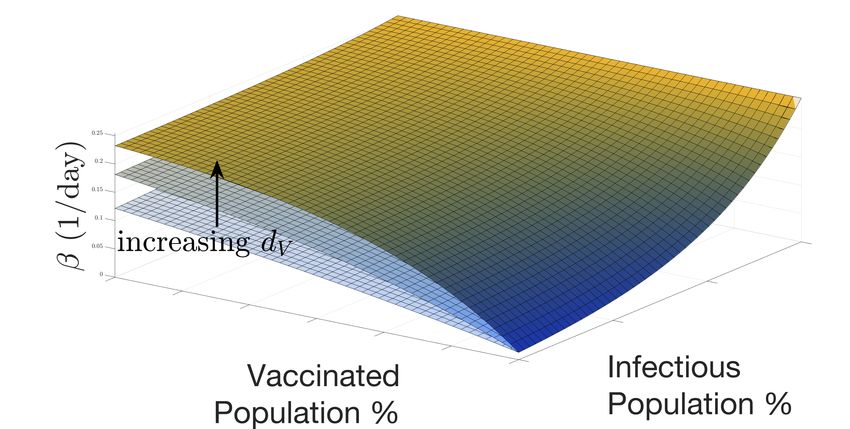
Modeling and prediction of COVID-19 in the United States considering population behavior and vaccination — 5/11

ter dI is a metric that quantifies a population’s behavior in       the peak number of cases while progressing toward this point
response to an infectious disease outbreak; estimates of future     is very different for different dV values.
dI values will allow predictions of new infectious cases.                We treat vaccination as a one-time event where an individ-
    Overall, there are clear trends in COVID-19 cases cap-          ual would receive an entire dose of the vaccine, despite the
tured by our model that directly relate to local government         fact that some current vaccines require two doses that must be
mandated health regulations. These results suggest that we          delivered at different times [35]3 . Unless otherwise noted, all
may be able to incorporate possible behavioral changes into         vaccine distribution in this paper was modeled at a fixed rate
our model representing future government regulations, along         of 0.22% of the population per day (0.44% per day in terms
with changes in vaccination rates, to predict infection out-        of doses for two dose vaccines). This number represents
comes.                                                              approximately 1.5 million vaccine doses that are currently
                                                                    administered in the US. Because of the asymptomatic and
                                                                    unreported cases, the constant rate vaccination was applied
1.2 Future COVID-19 dynamics with vaccination
                                                                    proportionally to both the susceptible (αs ) and recovered (αR )
The model incorporates the effect of vaccination and the be-        populations. For the remainder of the simulations, we assume
havioral response of the population to growing number of            that sense of caution, dI , remains fixed at one of it’s recent
people getting vaccinated due to the population’s sense of          (January) estimate (dI = 40).
safety. This sense of safety counteracts the underlying level            The effects of the vaccination rate α were examined (Fig-
of caution that a population always has in response to the          ure 4). We chose three values of α: the current rate of vacci-
number of infectious cases. Predictions from our model with         nation of 0.22% of the population per day [36], a low (0.10%
the presence of vaccination show that the future trajectory of      per day), and a high rate (0.35% per day). Note, the vacci-
the pandemic will strongly depend on population’s behavior          nation rate of 0.1% is not expected in US but is shown to
in response to the disease and vaccination. In Figure 3, we         illustrate the consequences of low vaccination rate. As the
show a range of potential infection outcomes for different          vaccine distribution rate increases, the number of cases per
levels of caution to the infection and different senses of safety   day tends to zero quickly. However, as is shown in Figure 4a
due to vaccination. The selected range of dI and dV represent       and 4b, the population’s social response to the vaccine, dV , has
reasonable extremes of the level of caution and sense of safety     a significant effect on the pandemic trajectory. In cases where
factors. For the future trend predictions, we use starting values   preventative measures were abandoned more quickly and the
based on California’s data, as a representative population (to      population had an increased sense of safety in response to
avoid multiple curves and repetition) which has reasonable          the vaccines (high values of dV ), increased vaccination rates
correlation with overall United States COVID-19 trends. The         still result in cases quickly tending toward zero, but before
results, normalized as population fractions, provide critical       this happens, the number of cases per day increases rapidly.
COVID-19 future trends and insights that will be applicable         This behavior worsens as dV increases, and this sharp increase
to other regions as well. We have assumed a vaccine effec-          occurs earlier as vaccination rate α increases. Our results
tiveness η of 95% based on the initial estimates of the two         show that in the US, COVID-19 can be reasonably controlled
leading vaccines [34]. η can be suitably selected for any other     by late summer of 2021 proceeding with the currently planned
vaccination types or in the case of a different pandemic or         vaccination rate.
endemic with different vaccine effectiveness. The results are            Our results elucidate the importance of local health and
shown for estimated actual cases.                                   government authorities becoming aware of the fact that the
    Figure 3a models a population that does not alter their         sense of safety and vaccine distribution rate are related pa-
underlying behavior in response to introduction of a vaccine,       rameters. As has been shown, a faster vaccination rate sig-
and instead only responds to the increasing infectious cases        nificantly decreases the duration of the pandemic. However,
by increasing personal safety measures. All simulated curves        if authorities intend to distribute a vaccine very quickly, they
show a swift reduction in cases following the vaccine, though       must be extra cognizant of the population’s behavioral re-
decisive action and stronger level of caution in response to        sponse to it, as population relaxing it’s cautious practices
the infection does show a considerable reduction in total in-       could result in a noticeable increase in cases post vaccine
fections. Figure 3b shows a scenario in which the population        rollout. If neglected, this peak under extreme circumstances
responds to the introduction of a vaccine by relaxing the social    could be disastrous. Therefore, based on our results, we rec-
measures meant to slow the transmission. Although this sense        ommend that proper disease transmission mitigating behavior
of safety and increased normalcy may be a natural response to       be maintained, while welcoming a fast vaccine distribution
vaccines becoming more available, our predictions show that         rate.
unfailing and continuing commitment to social preventative               To further quantify the relative effects of the sense of
measures can significantly reduce the total number of future
                                                                       3 Given the much longer time scale of COVID-19 predictive curves, com-
infections and even prevent a new surge and new peak that can
                                                                    pared to the time gap between the two doses of m-RNA vaccines, it is
happen if the population relaxes too soon. Note, regardless of      reasonable to model vaccination rate by ignoring the time gap between the
the value of the sense of safety factor dV , the number of new      two doses and take the two doses combined as a single completed vaccine
cases per day drops to zero around the same time; however,          without significant loss of predictive accuracy.

                                        T. Usherwood, Z. LaJoie, and V. Srivastava, 2021
Modeling and prediction of COVID-19 in the United States considering population behavior and vaccination — 6/11

                                           Massachusetts               California            Florida      South Dakota       New York City       Atlanta

                                          600
                                                                                                            0.4
                                          500

                                          400                                                               0.3

                                          300
                                                                                                            0.2
                                          200
                                                                                                            0.1
                                          100

                                            0                                                                   0
                                            Apr 2020         Jul 2020       Oct 2020          Jan 2021          Apr 2020   Jul 2020   Oct 2020   Jan 2021
          (a)                                                                                             (b)

Figure 2. (a) Level of caution factor dI and (b) disease transmission rate β over the course of COVID-19 in six populations
across the United States.

                                         0.3%
          New Cases/Day (% Population)

                                         0.25%

                                         0.2%

                                         0.15%

                                         0.1%

                                         0.05%

                                           0%
                                                 Jan 2021   Mar 2021   May 2021   Jul 2021     Sep 2021

          (a)                                                                                             (b)

Figure 3. Effect of (a) sense of caution factor, dI , and (b) sense of safety factor, dV on pandemic trajectory. The dashed blue
bar represents the introduction of a vaccine with 95% effectiveness, at a fixed rate of 0.22% of the population per day. Extreme
values of dI represent the extremes of social behavior: the most responsive (black dotted) and the least (red solid).

                                                                         T. Usherwood, Z. LaJoie, and V. Srivastava, 2021
Modeling and prediction of COVID-19 in the United States considering population behavior and vaccination — 7/11

       (a)                                                                   (b)

Figure 4. Impact of vaccination rate, α, with two social responses to the vaccine. The population in (a) shows no changes in
behavior in response to the vaccine, while the population in (b) relaxes its preventative measures as the vaccine is distributed.

     0.3%
                                                                              behavioral effects are limited due to our proposed relation for
                                                      7

                                                                              the sense of safety function fV , but quickly increase as the
                                                     0.1

    0.25%
                                                               3
                                        7

                                                                     8
                                                              0.2
                                              0.12

                                                                    0.2
                                       0.0

     0.2%
                                                                              vaccinated individuals increase. This explains the increase in
                                                                              the total infections as one travels vertically in the pink box
    0.15%
                                                                              in Figure 5. However, total infections then begin to decrease
     0.1%                                                                     due to a critical vaccination rate being achieved, shown in the
                                                                              teal box. This reinforces the argument for the necessity of
    0.05%
                                                                              maximizing vaccine distribution; low vaccination rates can
                                                       0.17
      0%
        0      0.5    1     1.5    2         2.5       3       3.5       4
                                                                              lead to behavior-related spikes in total cases, but these ef-
                                                           Sense of Safety    fects are mitigated as widespread vaccination outweighs these
Figure 5. Contour plot of the sense of normalcy, dV , and                     behavioral factors.
vaccination rate, α, versus the total infections since the start
of vaccination (red values shown as proportion of the total                                               0.35%
                                                                               New Cases/Day (% Population)

population). Shown for a high level of caution case                                                           0.3%
(dI =1000). Pink box shows a possibility of increasing number
                                                                                                          0.25%
of total infected cases with increasing vaccination rate at very
                                                                                                              0.2%
high sense of safety, and the teal box shows that once the
vaccination rate crosses a threshold, the total number of                                                 0.15%

infection cases drop with vaccination rate even at a very high                                                0.1%
sense of safety.                                                                                          0.05%

                                                                                                               0%
                                                                                                                Apr 2020 Jul 2020 Oct 2020 Jan 2021 Apr 2021 Jul 2021 Oct 2021 Jan 2022

safety and the vaccine distribution rate on the total number of               Figure 6. Results for certain fractions of the population
infectious cases, the total number of individuals infected (as                remaining unvaccinated. The entire COVID-19 case history
population fraction) after the start of vaccination were plotted              and future predictions are shown in terms of estimated actual
with respect to α and dV in Figure 5. This was done for a                     new infection cases for California as a representative example.
special case of a very high level of caution during vaccine                   Gray bars represent the daily reports of new COVID-19 cases.
rollout. As expected, for a given value of vaccination rate, the              The dashed brown lines are the corresponding 7-day average.
number of total infected cases increases as the sense of safety               Our model predictions for the entire duration are also shown
factor increases along the x-axis. This behavior is especially                as red, green, grey and yellow curves.
pronounced for low vaccination rates, when large increases in
the sense of safety can result in significant numbers of total in-                We can expect some portion of the population to be unwill-
fections, up to 28% as is shown in the yellow region of Figure                ing or unable to receive a COVID-19 vaccine. The effect of
5). Also, note that for very high value of dV , as the vaccination            the size of this group on the duration and severity of the pan-
rate increases from 0, the number of infected cases quickly                   demic was examined in Figure 6. If large populations refuse
increases and then start to decrease again (pink box). For a                  vaccination, the duration of the pandemic can be increased by
very slow vaccination rate, vaccinated population dependent                   several months.

                                             T. Usherwood, Z. LaJoie, and V. Srivastava, 2021
Modeling and prediction of COVID-19 in the United States considering population behavior and vaccination — 8/11
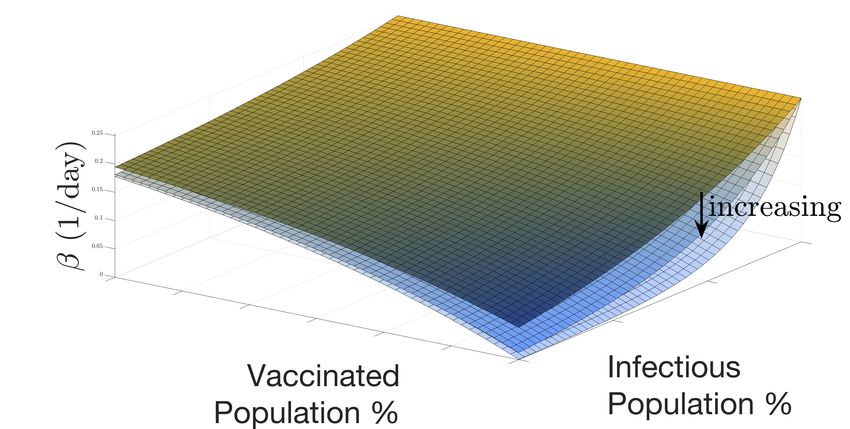
2. Method and fV (1 ≤ fV ≤ f1I ) as sense of safety function, we propose
the following mathematical forms for behavior dependent
2.1 Modeling approach transmission rate:
As shown in Figure 7a, our model extends the general SIRD
framework by adding the effect of vaccination and incorpo-
rating behavior based dynamics as an important capability fI = e−dI I ,
specific to our study. The model consists of five compart- 1 1
fV = + 1 − e−dV V , (3)
ments: Susceptible (S), Vaccinated (V), Infectious (I), Recov- fI fI
ered (R), and Deceased (D). Here S,V, I, R, and D represent β = β0 fI fV .
time dependent fractional variables with respect to the total
population of the region of interest. Beginning in the sus- The resultant effects of infectious and vaccinated popula-
ceptible compartment, individuals can follow the standard tions on disease transmission rate β are shown in Figures 7b
infection pathway through the infectious compartment then to and 7c for a range of dI and dV values. As shown, transmission
either recovered or deceased. Alternatively, they can enter the rate decays to a smaller value at high infectious populations
vaccinated compartment following a fixed rate of vaccination due to more cautionary and preventive actions with a higher
α, where depending on the vaccine efficacy η, a subset of level of caution. This decay slows significantly as a higher
the vaccinated population Vs can become infected again. The percentage of the population gets vaccinated due to the sense
remainder of the vaccinated group VR is successfully vacci- of safety from vaccination. The sensitivity of β to infectious
nated and have no risk of becoming infected. The known population size is determined by the population’s dI , while
reinfection rate is very low and it’s effect can be neglected for the extent to which preventative measures are abandoned due
the timescale of our study. Note that given the uncertainty in to vaccine distribution is determined by dV . Note, from the
how rapidly the vaccines will be deployed in the future, for mathematical form in equation 3, in the absence of vaccines,
our predictions, we have used constant vaccination rates and V = 0 =⇒ fV = 1, which is physically and intuitively correct.
have shown sensitivities to different vaccination rates. Time All the model parameters are described in Table 2.
dependent vaccination rates can be easily implemented by se-
Parameter Description
lecting a suitable function for α(t) in our model. Our SIRDV
µ mortality due to COVID-19
model for a region/population is described by the following γ recovery rate—inverse of the average infectious period
equations: baseline transmission rate—product of the transmission
β0 probability and contact rate in a relatively unrestricted
population before any behavioral response to the disease occurs
dS
= −β SI − α sense of caution factor—at higher values, the population will
dt dI tend to decrease their contact rate and take more preventive
dV measures more quickly in response to a high infectious population
= −β (1 − η)V I + α α vaccination rate
dt η vaccine effectiveness
dR sense of safety factor—at higher values, the population will
= γI dV tend to reduce personal safety measures more quickly in response to a
dt (2) high vaccinated population. This effect counteracts the effects of dI
dI
a factor representing ratio of actual cases to reported cases
= β S + β (1 − η)V − µγ − γ I M
due to asymptomatic cases and limited COVID-19 testing availability
dt
dD Table 2. Parameters in the model.
= µγI
dt
where β represents the dynamic transmission rate, µ repre- 2.2 Model fit to specific regions
sents the mortality rate, and γ represents the recovery rate. Combining equations 2 with our dynamic behavior model
The family of curves represented by this set of equations with in equations 3, we are able to fit the complex, multimodal
constant parameters is considerably limited as it assumes that infection curves observed during the course of the COVID-19
the population does not change its behavior at all over the pandemic.
course of the outbreak. We take the disease mortality rate and infectious period, µ
The significant differences and variations in disease trans- and γ (inverse of γ represents infectious period) as constants.
mission across different populations and over the course of the The baseline transmission rate β0 was determined to be the
COVID-19 pandemic have shown that an understanding and parameter which was able to best fit the first rise in cases,
modeling of dynamic population behavior changes is critical where there was limited social response to the rise in infec-
in predicting a real-world pandemic. To model these popu- tions. To represent the behavioral changes that were evident
lation behavioral attributes, we have incorporated a simple in the multiple peaks of the pandemic, we introduced mul-
framework for a behavior-based, time-dependent net disease tiple behavioral regions for each population. The model fit
transmission rate β that is dependent on both the current in- shows that each region had different level of caution factors
fectious and vaccinated populations. With β0 as population (infection responsiveness) dI , which provides an estimate of
maximum transmission rate, fI (≤ 1) level of caution function how public perception of the disease varied in each region
T. Usherwood, Z. LaJoie, and V. Srivastava, 2021
Modeling and prediction of COVID-19 in the United States considering population behavior and vaccination — 9/11

                                                                            μ
                                                                                   D
                                                             β               γ
                                                      S                I            R
                                                  αSη αS(1-η)
                                                                  β                   αR

                                                  VR VS
                                                V=VS+VR

                                (a)

               (b)                                                (c)

Figure 7. (a) SIRDV compartment model with susceptible (S), vaccinated (V ), infectious (I), recovered (R), and deceased (D)
populations during an infection outbreak. Flow between between compartments is shown with arrows. (b) and (c) Show
variations in disease transmission rate β , due to social response to infectious and vaccinated populations. (b) β for a range of
level of caution factor dI (100, 200, 400), and (c) β for a range of sense of safety factor dV (1, 2, 4).

over the course of the pandemic. Each behavioral response             against the reported case, we introduced a factor M, which
is represented by a fixed dI and smooth transitions were im-          represents the number of actual cases per reported case. At
plemented via cosine interpolation, as displayed in Figure 2a.        the early stages of the pandemic, the awareness and testing
To reduce the risk of overfitting our model, we limited the           was lacking but later on it improved significantly. We account
number of behavioral response changes for each location and           for this by using a value of M = M0 for the initial stages of the
found that, for the locations that were selected, a minimum           pandemic which transition to a lower value of M = M f well
of either three or four behavioral regions was sufficient to          into the pandemic when testing becomes widely available.
accurately represent the complete reported infection data. The        The transition between the two values of M is taken to be
differential equation model was implemented in MATLAB.                smooth using a sigmoidal function and is shown in Figure 1a.
     Model parameters were fit to daily new cases time se-            The variation of M with time can be represented with
ries of four states and two cities: Massachusetts, California,
Florida, South Dakota, New York City, and Atlanta. These                                  M0 − M f
regions were chosen to represent a variety of population den-               M = Mf +                    ,                          (4)
                                                                                        1 + eδM (t−tM )
sities, locations across the US, and responses to the pandemic.
To determine the parameters, we used MATLAB’s bound-                  where δM and tM describe the smooth transition from M0 to
constrained optimization function [37], minimizing the root           Mf .
mean square error between our model predictions and the re-
ported number of cases per day. Simulations for each popula-          2.3 Disease dynamics with vaccination
tion began on March 15 and had an initial infected population         After fitting the model to reported real-world data, the effects
equal to the number of new cases in the previous 1γ days, to          of vaccination and its potential effects on behavioral response
estimate those who were still in the infectious period.               (sense of safety) were examined. Specifically, we chose the
     The reported infection case data is limited by the fact          state of California as a representative case, which displayed
that tests were not universally available during the beginning        an average infectivity rate of COVID-19 among the states
stages of the pandemic. Additionally, certain infected popu-          and cities that we surveyed and an infection curve that was
lations did not show any symptoms [38], but still may have            somewhat representative of the overall United States. Varying
transmitted the disease, further complicating estimates of new        the vaccine distribution rate α, the sense of safety parameter
cases. To compare the actual case predictions from the model          dV , and the fraction of unvaccinated individuals Sunvaccinated

                                       T. Usherwood, Z. LaJoie, and V. Srivastava, 2021
Modeling and prediction of COVID-19 in the United States considering population behavior and vaccination — 10/11
in our model, we evaluated the progression of the disease by Funding Information
examining the predicted number of cases reported per day in No external funding was used for this study.
the future. The predicted results are presented in Figure 3
through 6. Author Contributions
T.U. and Z.L. performed simulations and helped develop the
model. V.S. conceptualized and led this research study and
3. Closing Remarks the development of the model.
We have developed an infectious disease dynamics model
which accounts for behavioral changes in a population consid- Competing Interest
ering level of caution due to growing infectious individuals The authors declare no competing interests.
as well as a counteracting trend towards increasing normalcy,
relaxing precautionary measures due to a sense of safety from Data Archival
increasing vaccine deployment. Our mathematical model COVID data was obtained from the Center for Systems Sci-
accurately captures the infection trends for the first year of ence and Engineering (CSSE) COVID-19 Data Repository at
the COVID-19 pandemic for all of the US regions examined Johns Hopkins University [39]. Estimates for the total pop-
with a small number of parameters. A comparison of model ulation of each region were obtained from the United States
parameters between different regions allows comparative in- Census Bureau [40].
sights between them. It demonstrates direct relationships
between population behavior model parameters and major Materials and Correspondence
government actions that impact population behavior. It allows All correspondence should be addressed to Vikas Srivastava
measurement of several important population and infectious (vikas srivastava@brown.edu)
disease specific quantities including highest disease transmis-
sion rate β0 , disease transmission rate at any given time β , References
and a measure of population’s behavior to reduce the disease [1] World Health Organization. WHO Coronavirus Disease (COVID-19)
transmission through parameter dI , where, in the absence of Dashboard, 2021.
dI
significant vaccination, 100 >> 1 indicates safe response, and [2] Heidi Ledford, David Cyranoski, and Richard Van Noorden. The UK
dI has approved a COVID vaccine — here’s what scientists now want to
100 < 1 represents lack of caution.
know. Nature, 588(7837):205–206, December 2020.
We found that although faster vaccine rollout will bring [3] Office of the Commissioner. COVID-19 Vaccines. FDA, January 2021.
the COVID-19 end more quickly, there exist scenarios where [4] Andrea L. Bertozzi, Elisa Franco, George Mohler, Martin B. Short,
fast vaccine rollout can give false sense of safety to the popu- and Daniel Sledge. The challenges of modeling and forecasting the
lation, which will lead to a large short-term increase in infec- spread of covid-19. Proceedings of the National Academy of Sciences,
tious cases. Prudence is required on the part of authorities to 117(29):16732–16738, 2020.
[5] Ernesto Estrada. Covid-19 and sars-cov-2. modeling the present, looking
understand, predict, and limit any potential surge by increas-
at the future. Physics Reports, 869:1 – 51, 2020.
ing encouragement of all cautionary measures to prevent the [6] Giulia Giordano, Franco Blanchini, Raffaele Bruno, Patrizio Colaneri,
spread of the virus. Our results indicate that in the United Alessandro Di Filippo, Angela Di Matteo, and Marta Colaneri. Mod-
States, current COVID-19 strain can be reasonably controlled elling the covid-19 epidemic and implementation of population-wide
by August 2021 with the planned fast vaccination roll out. interventions in italy. Nature Medicine, 26(6):855–860, 2020.
[7]
While our model is built on significant physical insights, Efthimios Kaxiras, Georgios Neofotistos, and Eleni Angelaki. The first
population’s future behavioral aspects, presence of unknown 100 days: Modeling the evolution of the covid-19 pandemic. Chaos,
Solitons & Fractals, 138:110114, 2020.
asymptomatic cases, a lack of exact knowledge about future [8] Ivan Korolev. Identification and estimation of the seird epidemic model
vaccination rates, and other factors create some uncertain- for covid-19. Journal of Econometrics, 220(1):63 – 85, 2021.
ties. Therefore, although the quantitative predictions from our [9] Calvin Tsay, Fernando Lejarza, Mark A. Stadtherr, and Michael Baldea.
study are important, all possible uncertainties should be con- Modeling, state estimation, and optimal control for the us covid-19
sidered. The results allow new insights into future COVID-19 outbreak. Scientific Reports, 10(1):10711, 2020.
[10] Adam J Kucharski, Timothy W Russell, Charlie Diamond, Yang Liu,
trends and sensitivity of pandemic dynamics to various behav-
John Edmunds, Sebastian Funk, Rosalind M Eggo, Fiona Sun, Mark Jit,
ioral and other model parameters. As more exact information James D Munday, Nicholas Davies, Amy Gimma, Kevin van Zandvoort,
becomes available, new data can be directly incorporated in Hamish Gibbs, Joel Hellewell, Christopher I Jarvis, Sam Clifford, Billy J
our model to produce more accurate results. Our model pro- Quilty, Nikos I Bosse, Sam Abbott, Petra Klepac, and Stefan Flasche.
vides a new framework for predicting infection dynamics of Early dynamics of transmission and control of covid-19: a mathematical
modelling study. The Lancet Infectious Diseases, 20(5):553 – 558, 2020.
future epidemics and pandemics. [11] Shaobo He, Yuexi Peng, and Kehui Sun. Seir modeling of the covid-19
and its dynamics. Nonlinear Dynamics, 101(3):1667–1680, 2020.
Acknowledgments [12] Kiesha Prem, Yang Liu, Timothy W Russell, Adam J Kucharski, Ros-
Authors would like to thank John Antolik and Thomas Bohac alind M Eggo, Nicholas Davies, Stefan Flasche, Samuel Clifford, Carl
A B Pearson, James D Munday, Sam Abbott, Hamish Gibbs, Alicia
for discussions during the early phase of this research project.
Rosello, Billy J Quilty, Thibaut Jombart, Fiona Sun, Charlie Diamond,
Amy Gimma, Kevin van Zandvoort, Sebastian Funk, Christopher I Jarvis,
T. Usherwood, Z. LaJoie, and V. Srivastava, 2021Modeling and prediction of COVID-19 in the United States considering population behavior and vaccination — 11/11
W John Edmunds, Nikos I Bosse, Joel Hellewell, Mark Jit, and Petra [32] Kankan Sarkar, Subhas Khajanchi, and Juan J. Nieto. Modeling and fore-
Klepac. The effect of control strategies to reduce social mixing on casting the COVID-19 pandemic in India. Chaos, Solitons & Fractals,
outcomes of the covid-19 epidemic in wuhan, china: a modelling study. 139:110049, October 2020.
The Lancet Public Health, 5(5):e261 – e270, 2020. [33] Robert C. Reiner, Ryan M. Barber, James K. Collins, Peng Zheng,
[13] Deanna M. Kennedy, Gustavo José Zambrano, Yiyu Wang, and Os- Christopher Adolph, James Albright, Catherine M. Antony, Aleksandr Y.
mar Pinto Neto. Modeling the effects of intervention strategies on covid- Aravkin, Steven D. Bachmeier, Bree Bang-Jensen, Marlena S. Ban-
19 transmission dynamics. Journal of Clinical Virology, 128:104440, nick, Sabina Bloom, Austin Carter, Emma Castro, Kate Causey, Suman
2020. Chakrabarti, Fiona J. Charlson, Rebecca M. Cogen, Emily Combs, Xi-
[14] Weston C. Roda, Marie B. Varughese, Donglin Han, and Michael Y. aochen Dai, William James Dangel, Lucas Earl, Samuel B. Ewald,
Li. Why is it difficult to accurately predict the covid-19 epidemic? Maha Ezalarab, Alize J. Ferrari, Abraham Flaxman, Joseph Jon Frostad,
Infectious Disease Modelling, 5:271 – 281, 2020. Nancy Fullman, Emmanuela Gakidou, John Gallagher, Scott D. Glenn,
[15] Erik A. Goosmann, Jiawei He, Nathaniel J. Henry, Erin N. Hulland,
Meng Liu, Raphael Thomadsen, and Song Yao. Forecasting the spread
Benjamin Hurst, Casey Johanns, Parkes J. Kendrick, Apurva Khemani,
of covid-19 under different reopening strategies. Scientific Reports,
Samantha Leigh Larson, Alice Lazzar-Atwood, Kate E. LeGrand, Ha-
10(1):20367, 2020.
[16]
ley Lescinsky, Akiaja Lindstrom, Emily Linebarger, Rafael Lozano,
Daron Acemoglu, Victor Chernozhukov, Iván Werning, and Michael D Rui Ma, Johan Månsson, Beatrice Magistro, Ana M. Mantilla Her-
Whinston. Optimal targeted lockdowns in a multi-group sir model. rera, Laurie B. Marczak, Molly K. Miller-Petrie, Ali H. Mokdad, Ju-
Working Paper 27102, National Bureau of Economic Research, May lia Deryn Morgan, Paulami Naik, Christopher M. Odell, James K.
2020. O’Halloran, Aaron E. Osgood-Zimmerman, Samuel M. Ostroff, Maja
[17] Eugene B. Postnikov. Estimation of covid-19 dynamics “on a back-of- Pasovic, Louise Penberthy, Geoffrey Phipps, David M. Pigott, Ian Pol-
envelope”: Does the simplest sir model provide quantitative parameters lock, Rebecca E. Ramshaw, Sofia Boston Redford, Grace Reinke, Sam
and predictions? Chaos, Solitons & Fractals, 135:109841, 2020. Rolfe, Damian Francesco Santomauro, John R. Shackleton, David H.
[18] Fred Brauer. Mathematical epidemiology: Past, present, and future. Shaw, Brittney S. Sheena, Aleksei Sholokhov, Reed J. D. Sorensen,
Infectious Disease Modelling, 2(2):113–127, 2017. Gianna Sparks, Emma Elizabeth SpNONONONOURLock, Michelle L.
[19] William O. Kermack and A.G. McKendrick. A contribution to the Subart, Ruri Syailendrawati, Anna E. Torre, Christopher E. Troeger,
mathematical theory of epidemics. Proceedings of the Royal Society A, Theo Vos, Alexandrea Watson, Stefanie Watson, Kirsten E. Wiens, Lau-
115:700–721, 1927. ren Woyczynski, Liming Xu, Jize Zhang, Simon I. Hay, Stephen S.
[20] Lim, Christopher J. L. Murray, and IHME COVID-19 Forecasting Team.
Laura Matrajt, Julia Eaton, Tiffany Leung, and Elizabeth R. Brown.
Modeling COVID-19 scenarios for the United States. Nature Medicine,
Vaccine optimization for COVID-19: who to vaccinate first? medRxiv,
pages 1–12, October 2020.
page 2020.08.14.20175257, November 2020. [34]
[21] Jerome H. Kim, Florian Marks, and John D. Clemens. Looking beyond
Kate M. Bubar, Kyle Reinholt, Stephen M. Kissler, Marc Lipsitch,
covid-19 vaccine phase 3 trials. Nature Medicine, 2021.
Sarah Cobey, Yonatan H. Grad, and Daniel B. Larremore. Model- [35]
informed COVID-19 vaccine prioritization strategies by age and serosta- Victoria Knight News, Kaiser Health. Biden Aims for 100 Million
tus. medRxiv, page 2020.09.08.20190629, December 2020. COVID Vaccinations in First 100 Days, 2021.
[36] Massachusetts Department of Public Health. COVID-19 Vaccination
[22] Z. Feng, S. Towers, and Y. Yang. Modeling the Effects of Vaccination
and Treatment on Pandemic Influenza. The AAPS Journal, 13:427–437, Program | Mass.gov, 2021.
[37] MathWorks. Matlab bound constrained optimization using fminsearch,
2002.
[23] Almut Scherer and Angela McLean. Mathematical models of vaccina- 2021.
[38] Bianca Nogrady. What the data say about asymptomatic COVID infec-
tion. British Medical Bulletin, 62(1):187–199, 07 2002.
[24] Gerardo Chowell, Amna Tariq, and Maria Kiskowski. Vaccination tions. Nature, 587(7835):534–535, November 2020.
[39] Ensheng Dong, Hongru Du, and Lauren Gardner. An interactive web-
strategies to control Ebola epidemics in the context of variable house-
hold inaccessibility levels. PLoS Neglected Tropical Diseases, 13(11), based dashboard to track COVID-19 in real time. The Lancet Infectious
November 2019. Diseases, 20(5):533–534, May 2020.
[25] [40] US Census Bureau. County Population Totals: 2010-2019, 2019.
B. Y. Lee, L. A. Haidari, and M. S. Lee. Modelling during an emergency:
the 2009 H1N1 influenza pandemic. Clinical Microbiology and Infection,
19(11):1014–1022, 2013.
[26] Richard C. Larson and Anna Teytelman. Modeling the effects of H1N1
influenza vaccine distribution in the United States. Value in Health:
The Journal of the International Society for Pharmacoeconomics and
Outcomes Research, 15(1):158–166, January 2012.
[27] Ravi Potluri, Amit Kumar, Vikalp Maheshwari, Charlie Smith, Valerie
Oriol Mathieu, Kerstin Luhn, Benoit Callendret, and Hitesh Bhandari.
Impact of prophylactic vaccination strategies on Ebola virus transmis-
sion: A modeling analysis. PloS One, 15(4):e0230406, 2020.
[28] Zhiwen Yu, Jiming Liu, Xiaowei Wang, Xianjun Zhu, Daxing Wang,
and Guoqiang Han. Efficient Vaccine Distribution Based on a Hybrid
Compartmental Model. PLoS ONE, 11(5), May 2016.
[29] Nicola Perra, Duygu Balcan, Bruno Gonçalves, and Alessandro Vespig-
nani. Towards a Characterization of Behavior-Disease Models. PLOS
ONE, 6(8):e23084, August 2011.
[30] Tridip Sardar, Sk Shahid Nadim, Sourav Rana, and Joydev Chattopad-
hyay. Assessment of lockdown effect in some states and overall India: A
predictive mathematical study on COVID-19 outbreak. Chaos, Solitons,
& Fractals, 139:110078, October 2020.
[31] Soyoung Kim, Yu Bin Seo, and Eunok Jung. Prediction of COVID-19
transmission dynamics using a mathematical model considering behavior
changes in Korea. Epidemiology and Health, 42, April 2020.
T. Usherwood, Z. LaJoie, and V. Srivastava, 2021You can also read