Influence of Pre-Existing Nuclei on the Crystallization Kinetics of Primitive Alkaline Magmas: Insights on the Deep Feeding System of the Campi ...
←
→
Page content transcription
If your browser does not render page correctly, please read the page content below
minerals
Article
Influence of Pre-Existing Nuclei on the Crystallization
Kinetics of Primitive Alkaline Magmas: Insights on
the Deep Feeding System of the Campi Flegrei
Volcanic District
Barbara Bonechi
 Dipartimento di Scienze della Terra, Sapienza Università di Roma, P.le Aldo Moro 5, 00185 Rome, Italy;
 barbara.bonechi@uniroma1.it

 Received: 4 February 2020; Accepted: 2 March 2020; Published: 4 March 2020

 Abstract: Aiming to evaluate the influence of pre-existing nuclei on the clinopyroxene crystallization
 kinetics, time-series experiments were performed using both natural and vitrified starting materials.
 Experiments were carried out at pressure of 0.8 GPa, temperatures between 1220 and 1250 ◦ C, and
 dwell times ranging from 0.16 to 12 h. Clinopyroxene growth rates of the runs performed using the
 natural starting material containing pre-existing nuclei (~2 × 10⁻⁷ to ~6 × 10⁻⁸ cm·s−1 ) are higher
 than those of the runs performed using the vitrified one (~3 × 10⁻⁷ to ~2 × 10⁻⁸ cm·s−1 ). In both cases
 the growth rates decrease with increasing time. Conversely, clinopyroxene nucleation rates are lower
 in the experiments performed using the natural powder (102 and 10 mm−3 ·s−1 ) compared to those
 performed with the glassy starting material (105 and 103 mm−3 ·s−1 ). The nucleation rates tend to
 decrease increasing dwell time in all the series up to ~3 h, after which it remains nearly constant.
 Finally, the combination of the obtained clinopyroxene growth rates with the crystal size analysis
 of natural clinopyroxenes, allowed to estimate the magma ascent rate and the recharge rate of the
 Campi Flegrei Volcanic District deep reservoir.

 Keywords: pre-existing nuclei; heterogeneous nucleation; crystal growth rate; clinopyroxene; high
 pressure; Procida island

1. Introduction
      Knowledge of crystallization kinetics in silicate melts is a fundamental tool in the Earth and
material sciences due to the importance of crystallization processes in both natural and synthetic
melts [1,2]. Crystallization consists of two main processes, nucleation and growth, that are both
strongly influenced by composition, temperature, volatile components [3–6] and thermal history
(e.g., [7–11]). Concerning the nucleation kinetic, it includes two basic mechanisms: homogeneous
nucleation during which spontaneous new crystals form in the liquid and heterogeneous nucleation
during which, instead, new crystals form on pre-existing surfaces [12]. This latter has long been
recognized as an important and more efficient means of nucleation of crystals and bubbles under
magmatic conditions (e.g., [3,8,13–15]). Due to this, it is critical for magma crystallization experiments
the choice to use as starting material powder of raw or vitrified natural samples or synthetically
reconstructed compositions. Glassy starting materials (synthetic composition prepared from oxide and
carbonate reagents or vitrified natural samples) have the advantage of being completely homogeneous
and able to achieve a state of total chemical equilibrium [16,17]; however, the preparation of these
glasses requires multiple fusion cycles at high temperature that strongly affect the nucleation behavior
of aluminosilicate melts (e.g., [2,17–19]). This is reflected in the experimental products that could be
difficult to correlate to crystallization path of natural magmas. Furthermore, the nucleation behavior

Minerals 2020, 10, 234; doi:10.3390/min10030234                                 www.mdpi.com/journal/minerals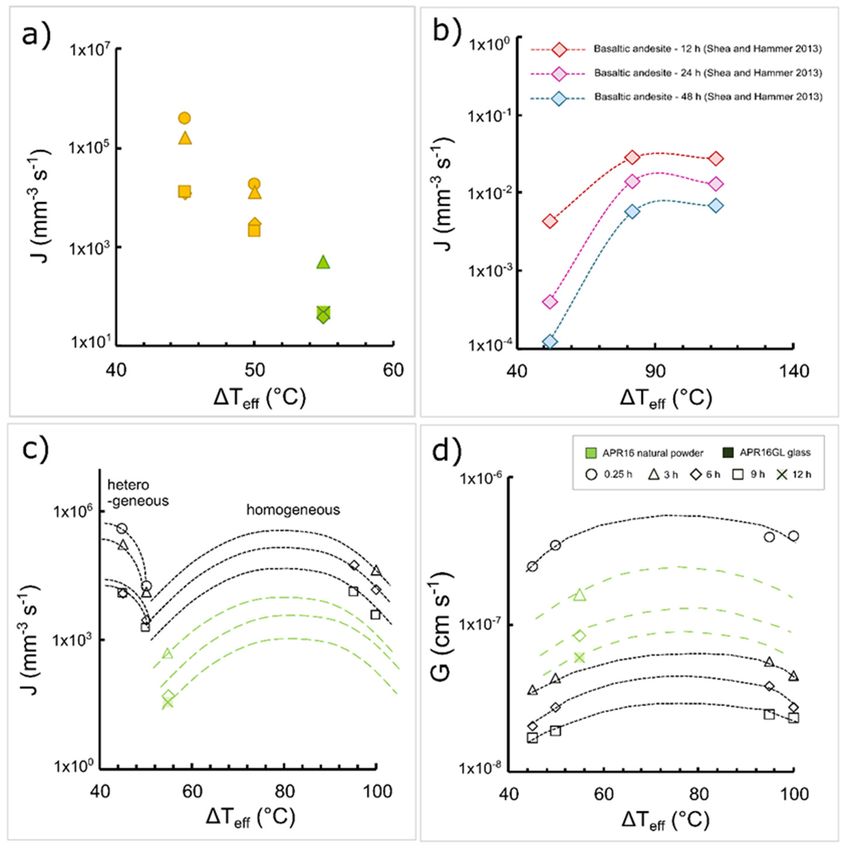
Minerals 2020, 10, 234                                                                                   2 of 21

and, consequently, the textures observed in some experimental products performed using glassy
starting material, result to be also influenced by the thermal path before crystallization [20,21]. Indeed,
as shown by Masotta et al. [20], in isothermal experiments the crystallization starts before resting
temperature (Trest ) is reached (T < Trest ). If the crystallized mineral (cpx in this case) remains within its
stability field, the further heating up to the Trest does not allow the dissolution of these early crystals
(pre-existing nuclei) favoring a texture formed by many crystals with small sizes (~10 µm). During
undercooling experiments, instead, the sample is initially heated at superliquidus conditions (generally
~15–30 min of pre-annealing time) before cooling it to the resting temperature. In this condition
the crystallization starts at T > Trest favoring the formation of few crystals with big sizes (>100 µm).
Conversely, natural crushed starting materials are more easily comparable to natural magmas in terms
of crystallization kinetics [16,17,21]; however, they are able to reach only a state of partial equilibrium
since they are not completely homogenous due to the possible presence of phenocryst cores that
may be in disequilibrium with the groundmass. Considering that both natural and vitrified starting
materials have advantages and disadvantages, several authors (e.g., [17,22–24]) preferred to use natural
starting materials because, due to the virtual presence of nuclei also in aphyric lavas, they yield initial
conditions more akin to those of natural magmas.
      As observed in the literature (e.g., [8,15,20,25–27]), the occurrence of pre-existing nuclei strongly
affects the crystallization kinetics (i.e., nucleation and growth). In the presence of pre-existing nuclei,
indeed, the low interfacial energy between them and the nucleating phase concentrates the supply of
chemical elements in the liquid near the new growing crystals, limiting in this way the formation of
new nucleation sites and favoring, instead, the growth. Many of the works in the literature deal with
the influence of pre-existing nuclei on the crystallization kinetics (e.g., [17,25–28]), but they are mainly
focused on feldspar crystals. Clinopyroxene is a common mineral in basaltic systems and, due to its
wide crystallization range, it may fully record the evolutionary history of a magma. Therefore, in order
to evaluate the influence of pre-existing nuclei on the clinopyroxene crystallization kinetics at high
pressure, here are reported the results of an experimental investigation performed using both natural
and vitrified starting material, which is an alkaline basalt (APR16 sample) [29–32] representative of
the least-evolved rocks of the Campi Flegrei Volcanic District (CFVD). The experimental runs were
grouped in two series carried out at the same pressure (0.8 GPa): (i) natural starting material series
that includes the runs performed in this study at 1225 ◦ C and at dwell times between 0.16 and 12 h;
(ii) glassy starting material series that includes the runs performed by Bonechi et al. [31] at 1250 and
1220 ◦ C and at dwell times between 0.25 and 9 h, using as starting material the vitrified APR16 powder.
Among the experiments of Bonechi et al. [31], the APR16-C1A and APR16-C2A series were chosen
to be compared with that performed in this study due to their similar temperatures and effective
undercoolings. Moreover, using the clinopyroxene experimental growth rates obtained from natural
and synthetic starting materials and the crystal size distribution analysis of clinopyroxenes occurring
in the most primitive scoria clasts of the CFVD, an estimate of the deep magma ascent rate and of the
recharge rate of the CFVD deep reservoir was made.

2. Materials and Methods

2.1. Starting Material
      The starting material used in this study is a natural rock powder with alkali basaltic composition [29–32]
(Table 1). In particular, the natural sample is a primitive K-basalt (APR16 sample) found as scoria
clast in the deposits of the Solchiaro eruption (~22 ka; [33]) located in Procida island, (Campi Flegrei,
Italy). The sample consists of 12 vol. % of forsteritic olivine and diopsidic clinopyroxene phenocrysts
dispersed in a groundmass made of olivine, clinopyroxene, plagioclase, Ti-magnetite, alkali feldspar
and glass [34,35]. The powder, used as starting material in the runs of natural starting material series,
was obtained by grinding the APR16 rock sample in an agate mortar under acetone. The glass, instead,
was prepared by Bonechi et al. [31] by melting for 15 min the APR16 natural powder in a 1-atm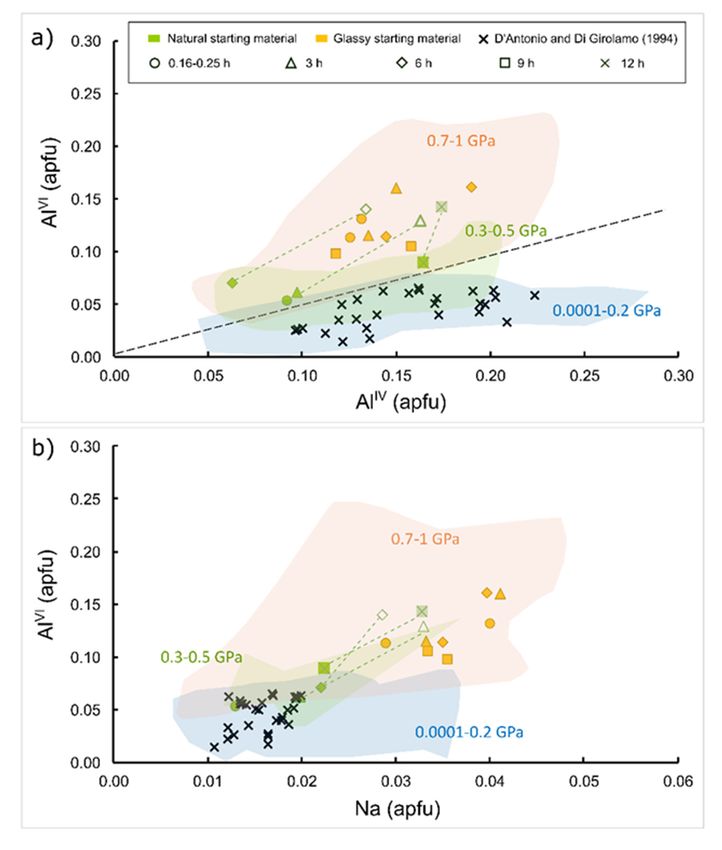
Minerals 2020, 10, 234                                                                                            3 of 21

gas-mixing furnace (Bayerisches Geoinstitut, Bayreuth, Germany) at 1400 ◦ C and oxygen fugacity
buffered at the Nickel-Nickel Oxide level using a CO/CO2 gas mixture.

               Table 1. Composition (wt. %) of APR16 rock sample and APR16GL starting material.

                                  Sample               APR16               APR16GL
                                    SiO2                48.89                 49.30
                                    TiO2                 1.23                  1.33
                                   Al2 O3               15.65                 15.31
                                   FeOtot                8.08                  7.79
                                   MnO                  0.14                  0.14
                                   MgO                  8.89                  9.31
                                    CaO                 11.64                 12.02
                                   Na2 O                 2.88                  2.86
                                    K2 O                1.52                  1.60
                                   P2 O 5                0.31                  0.33
                                    Sum                 99.99                 99.23
                                   L.O.I.               0.61                    nd
                                   Mg# 1                 0.66                  0.68
      Notes: 1 [MgO/(MgO + FeOtot )] molar, assuming all Fe2+ and Fe3+ as FeOtot . Chemical composition of APR16 is
      from D’Antonio et al. [34]; APR16GL composition is from Perinelli et al. [32]; nd: not determined.

2.2. Experimental Procedure
      Experiments were carried out at pressure of 0.8 GPa, as function of temperature and time by
using the 12 inch end loaded piston cylinder apparatus at the HP-HT Laboratory of the Earth Sciences
Department (Sapienza University, Rome, Italy). The assembly consists of an outer CaF2 cell, graphite
furnace and MgO crushable spacers. About 40–50 mg of powdered starting material was dried at 110 ◦ C
for at least 2 h to remove the moisture before being loaded and pressed into Au75 Pd25 capsules and
then welded. For each experiment, the capsule was put in the MgO crushable spacers and surrounded
by powder of alumina. Temperature was measured using a type D W3 Re97 -W25 Re75 thermocouple
and maintained with an uncertainty of ±5 ◦ C. The experimental assembly was first pressurized to
the target pressure by a piston-out procedure [36,37] that applies an overpressure of ~10% of the run
pressure and temperature was gradually increased to the resting temperature, while correcting for
pressure drops due to stress relaxation within the assembly during heating. The heating rate was set at
150 ◦ C/min. The sample was maintained at the pressure and temperature for a given duration (nominal
duration), and then quenched by turning off the power. The temperature dropped to below 500 ◦ C
within < 5 s with an average cooling rate of 150 ◦ C/s. All the runs were self-buffered; when possible
ƒO2 was estimated through the equation of Kress and Carmichael [38] using the liquid Fe3+ /Fetot mole
ratios from KD Fe-Mg ol/liq calculated following Toplis [39]. This procedure yielded ƒO2 values of
∆NNO +0.12 to +2, in agreement with those estimated for similar furnace assemblages [40,41]. A total
of 12 experiments, whose experimental conditions are reported in Table 2, were considered in this
study. The experiments were grouped into two main series carried out at a constant pressure and
at different dwell times: experiments of natural starting material series carried out in this study at
temperatures of 1225 ◦ C and dwell times of 0.16, 3, 6 and 12 h; experiments of glassy starting material
series performed by Bonechi et al. [31] at temperatures of 1250 and 1220 ◦ C, respectively, and dwell
times of 0.25, 3, 6 and 9 h.

2.3. Analytical Techniques
     The recovered charges were mounted in epoxy resin, ground flat and polished. Textural features of
the recovered samples were analyzed by Scanning Electron Microscopy (SEM) using a FEI Quanta-400
equipped for microanalysis with an EDAX Genesis system at the Earth Sciences Department (Sapienza
University, Rome, Italy). At least eight back-scattered electron (BSE) images were acquired for each
experimental run in order to accurately measure the number of clinopyroxene nuclei and other mineral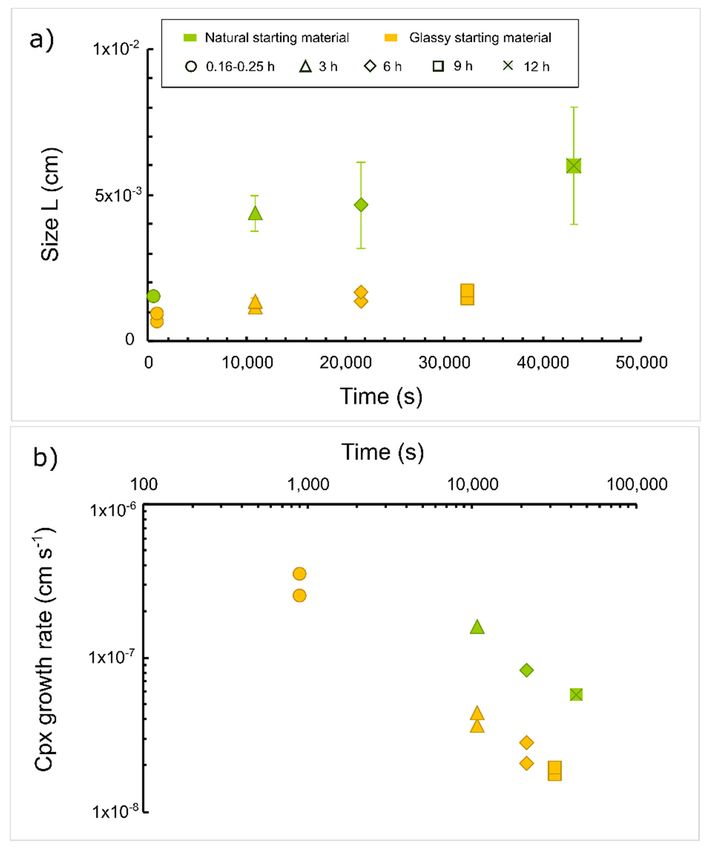
Minerals 2020, 10, 234                                                                               4 of 21

phases (e.g., [42–44]). Phase compositions were analyzed at the CNR-Istituto di Geologia Ambientale e
Geoingegneria (Rome, Italy), with a Cameca SX50 electron microprobe equipped with five wavelength
dispersive spectrometers (WDS). Quantitative compositional analyses were performed using 15 kV
accelerating voltage and 15 nA beam current. As standards we employed metals for Mn and Cr, jadeite
for Na, wollastonite for Si and Ca, orthoclase for K, corundum for Al, magnetite for Fe, rutile for Ti and
periclase for Mg. Counting times were 20 s for elements and 10 s for backgrounds. Light elements
were counted first to prevent loss by volatilization. The PAP correction method was used. Mineral
phases were analyzed using a beam diameter of 1 µm while for glasses a defocused electron beam
of 10 to 15 µm was used. The water contents of experimental glasses were estimated from chemical
analyses according to the by difference method [45].

2.4. Growth and Nucleation Rate Calculation
     Crystal dimensions were measured in SEM images by using the measure tool of the ImageJ®
software (version 1.50i). The maximum growth rate (GL ) values were calculated using a common
method reported in literature (e.g., [23,46,47]) based on the dimensions of the largest crystals (i.e.,
major and minor axes of best fit ellipse):

                                           GL = (L·W)0.5 /t × 2                                         (1)

where L and W are the mean length and width, respectively, of the ten largest crystals for each BSE
image and t is the duration of the experiments (s). As also observed in the literature, most of the growth
often occurs at the beginning of the experiment, since diffusion- or interface controlled growth normally
display lower incremental growth rates as the system approaches equilibrium [20,28,30,31,46,48,49].
Therefore, long lasting experiments could show an apparent decrease in GL with increasing time.
The nucleation rate of the Cpx crystallized in the runs of natural starting material series were calculated
following the procedure reported in Bonechi et al. [31], through which the nucleation rate of Cpx
crystallized in glassy starting material series has been calculated. Textural analyses were performed
by using ImageJ® software [50,51] on BSE images from which binary images of each mineral phase
were constructed following the procedure of Philpotts and Ague [13]. Manual reconstruction of edges
of overlapping crystals was necessary before conversion into binary images. Successively, the data
were transferred to the CSDcorrections® software (version 1.6 2018) [52,53] to perform the 2D to 3D
conversion and the calculation of CSD plots for each mineral phase.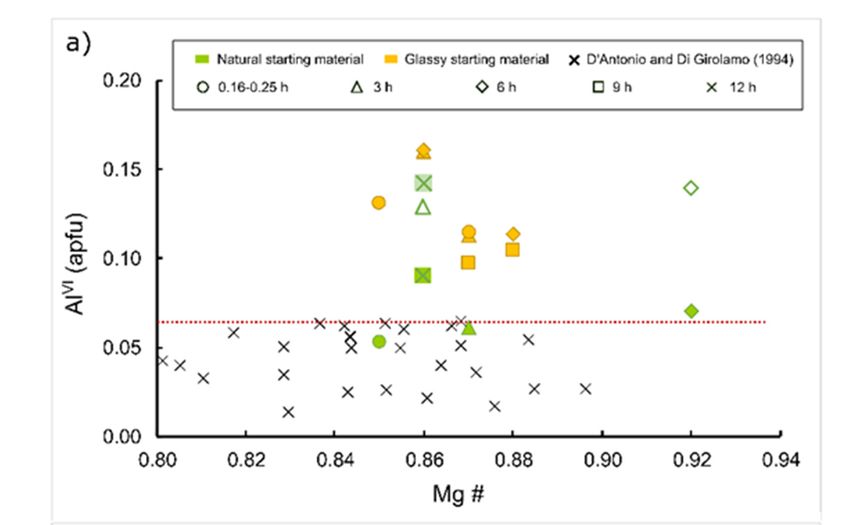
Minerals 2020, 10, 234                                                                                                        5 of 21

      Table 2. Experimental run conditions, calculated water contents, phases assemblage and proportions
      in run products.

                              TCpxL      ∆T eff   Time   H2 Oi                                               H2 Of            %
     Run #         T (◦ C)                                                       Phases                               ∆r2
                               (◦ C)     (◦ C)     (h)   (wt%)                                              (wt. %)          ΣFe §
             Natural starting material
   APR16-3B         1225       1280       55      0.16   NWA            Gl + Cpx # + Ol # + Ox #             1.77
   APR16-1C         1225       1280       55       3     NWA         Gl(94) + Cpx(6) + Ol + Ox
                                                                                           #        #        0.96     0.38    −5
   APR16-35         1225       1280       55       6     NWA             Gl(96) + Cpx(4) + Ol   #            1.70     0.14   −22
   APR16-2B         1225       1280       55       12    NWA             Gl(90) + Cpx(10) + Ol #             2.13     0.11   −35
             Glassy starting material
  APR16-C1Aa        1250       1295       45      0.25   NWA                 Gl(97) + Cpx(3)                 1.61     1.75    −7
  APR16-C1Ab        1250       1295       45       3     NWA                Gl(75) + Cpx(25)                 0.90     0.62   −12
  APR16-C1Ac        1250       1295       45       6     NWA            Gl(83) + Cpx(15) + Ol(2)             2.03     0.83   −20
  APR16-C1Ad        1250       1295       45       9     NWA                Gl(90) + Cpx(10)                 1.95     0.65   −19
  APR16-C2Aa        1220       1270       50      0.25     2        Gl(91) + Cpx(4) + Ol(1) + Ox(4)          1.92     0.02   −25
  APR16-C2Ab        1220       1270       50       3      1.9    Gl(68) + Cpx(23) + Ol(4) + Plg(1) + Ox *    1.56     0.66   −17
  APR16-C2Ac        1220       1270       50       6      2.1       Gl(65) + Cpx(27) + Ol(5) + Plg(3)        2.47     0.93   −25
  APR16-C2Ad        1220       1270       50       9      1.9       Gl(80) + Cpx(17) + Ol(3) + Ox *          1.30     0.25   −26
      Notes: NWA natural water rock; Gl glass; Cpx clinopyroxene; Ol Olivine; Plg plagioclase; Ox oxide. TCpxL is
      the equilibrium Cpx liquidus temperature (◦ C) determined on the basis of phase relations experimental data from
      Perinelli et al. [32] and on the calculations by using MELTS software [54,55]. ∆Teff is the difference between the
      Cpx liquidus temperature and the nominal temperature of the runs. H2 Oi % of water added to the charge. H2 Of
      as determined by the by-difference method (respect to the total of EMP analyses). Σr2 values from mass balance
      calculation. § Percent of relative Fe loss from starting material based on difference between the starting material and
      calculated bulk composition of experiment obtained from mass-balance calculations. * crystals present in trace;
      # pre-existing crystals. Data for glassy starting material runs from Bonechi et al. [31].

3. Results

3.1. Textural Features of the Experimental Runs

3.1.1. Natural Starting Material Series
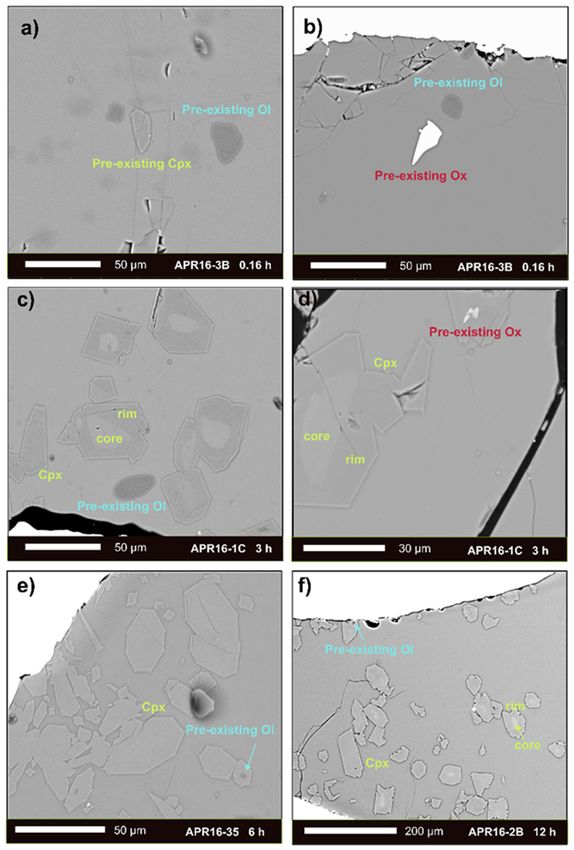
     In APR16-3B run (1225 ◦ C, 0.16 h; Figure 1a,b) the mineral phases occurring in the charge are
Ol, Cpx and Ox. Olivine size ranges from 10 to 30 µm and shows anhedral and subhedral habit.
Clinopyroxene is present in small quantity and shows anhedral and subhedral habit with size up to
20 µm. Oxide is present in trace with size up to 20 µm and anhedral shape. The phase assemblage
in APR16-1C run (1225 ◦ C, 3 h; Figure 1c,d) is Cpx, Ol and Ox crystals and large amount of glass.
Olivine size ranges from 10 to 30 µm and the habit is anhedral. Clinopyroxene (size up to 50 µm)
are zoned and show euhedral habit. Oxide is very small in size (~5 µm) with subhedral to anhedral
shape. In APR16-35 run (1225 ◦ C, 6 h; Figure 1e) it was observed the occurrence of Cpx sometimes
characterized by inclusion of rounded Ol. Homogeneous and zoned clinopyroxenes show euhedral
habit reaching sizes up to 80 µm. Finally, the phase assemblage of APR16-2B run (1225 ◦ C, 12 h;
Figure 1f) is Cpx and glass. As seen in the APR16-35 run, rare small olivines (~10 µm in size) are
present as resorbed mineral into Cpx grains. Clinopyroxene are both homogeneous and zoned and
show euhedral and subhedral habits. The size of these crystals is up to 90 µm. By analyzing the
textural features of Ol and Cpx in the four experiments at 1225 ◦ C (NWA) it was possible to note that
olivine tends to be resorbed from APR16-3B (0.16 h) to APR16-2B (12 h) runs, decreasing in size from
40 µm to 5 µm, whereas Cpx increases in size from 20 µm up to 80 µm. Moreover, it is visible a change
of the habit of both minerals increasing the duration of the experiments: at 0.16 h Ol and Cpx have
both anhedral and/or subhedral habit; after three hours Ol habit becomes anhedral while Cpx shows
a noticeable core-rim zoning; after 6 h, instead, anhedral Ol is almost disappeared, while Cpx has
euhedral habit pointing out to a crystal-melt equilibrium.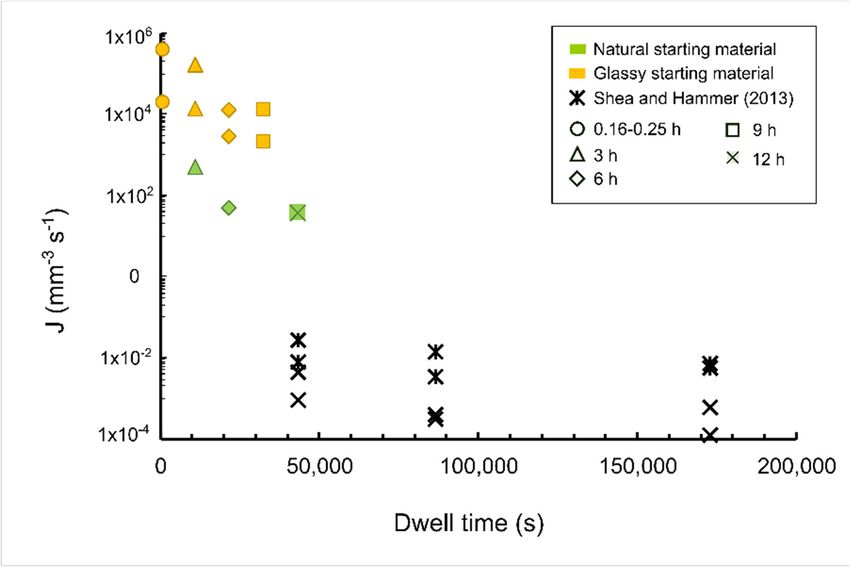
Minerals 2020, 10, 234                                                                                             6 of 21
   Minerals 2020, 10, 234                                                                                      7 of 22

          Figure
      Figure      1. BackscatteredSEM
               1. Backscattered    SEMimage
                                        imageof ofnatural
                                                  natural starting
                                                          starting material
                                                                   materialruns:
                                                                             runs:(a,b) APR16‐3B
                                                                                    (a,b)        runrun
                                                                                          APR16-3B    (0.16 h) is
                                                                                                         (0.16 h) is
          characterized by the presence of pre‐existing nuclei of Cpx, Ol and Ox with anhedral and subhedral
      characterized by the presence of pre-existing nuclei of Cpx, Ol and Ox with anhedral and subhedral
          habit; (c,d) APR16‐1C run (3 h) is characterized by the presence of both zoned Cpx grown on the pre‐
      habit; (c,d) APR16-1C run (3 h) is characterized by the presence of both zoned Cpx grown on the
          exiting nuclei and new Cpx, pre‐existing Ol and Ox; (e) APR16‐35 run (6 h) shows euhedral Cpx with
      pre-exiting nuclei and new Cpx, pre-existing Ol and Ox; (e) APR16-35 run (6 h) shows euhedral
          homogenous and zoned compositions, while Ol is present as resorbing crystal inside Cpx; (f) APR16‐
      Cpx with homogenous and zoned compositions, while Ol is present as resorbing crystal inside Cpx;
          2B run (12 h) is characterized by zoned and homogenous Cpx and resorbed Ol included in Cpx
      (f) APR16-2B run (12 h) is characterized by zoned and homogenous Cpx and resorbed Ol included in
          crystals.
      Cpx crystals.
   3.2. Phases Composition
3.1.2. Glassy Starting Material Series
         Chemical compositions of Cpx, glass and Ol of natural starting material and glassy starting
     Textural features of these two series are described in detail in Bonechi et al. [32]. Here a briefly
   material runs are reported in Tables S1 in the Supplementary Material. Chemical compositions of the
description of the fundamental aspects is reported. In the runs of APR16-C1A (1250 ◦ C) series the
   other phases crystallized in glassy starting material runs are reported in Bonechi et al. [31].
dominant phase is Cpx (Table 2), whose habit and sizes vary with time: subhedral with sizes of 5 µm
in the shortest
   3.2.1. Naturalrun   (APR16-C1Aa;
                  Starting              0.25 h), and euhedral with sizes up to 15 µm in the longest run
                            Material Series
(APR16-C1Ad; 9 h). In the APR16-C1Ac run (6 h) Ol, characterized by euhedral habit and sizes of
        Clinopyroxene. Clinopyroxene crystals in natural starting material runs are classified as diopsides
~10 µm, occurs together with the Cpx. The mineral phases crystallized in APR16-C2A (1220 ◦ C) series
   (Wo41–49En44–50Fs4–9) according to the classification scheme of Morimoto et al. [56]. Some clinopyroxene
are Cpx + Ol + Plg + Ox (Table 2). In these runs Cpx and Ol are ubiquitous, while Plg occurs only in
   crystals show core‐rim compositional variations. For example, in APR16‐1C and APR16‐2B runs the
the runs at 3 and 6 h and Ox is absent in the run at 6 h. Clinopyroxene has subhedral habit in the run
   Cpx core is characterized by higher CaO and lower Al2O3 and Na2O content than those of the rim
with the shortest
   (Tables S1 in theduration  and euhedral
                     Supplementary            in the
                                      Material).      other runs, in
                                                  As highlighted  with
                                                                     the sizes between
                                                                         previous       ~10textural
                                                                                  sections, and 20 evidences
                                                                                                    µm. Olivine
and Plg crystals are euhedral with sizes of ~15 and ~40 µm, respectively.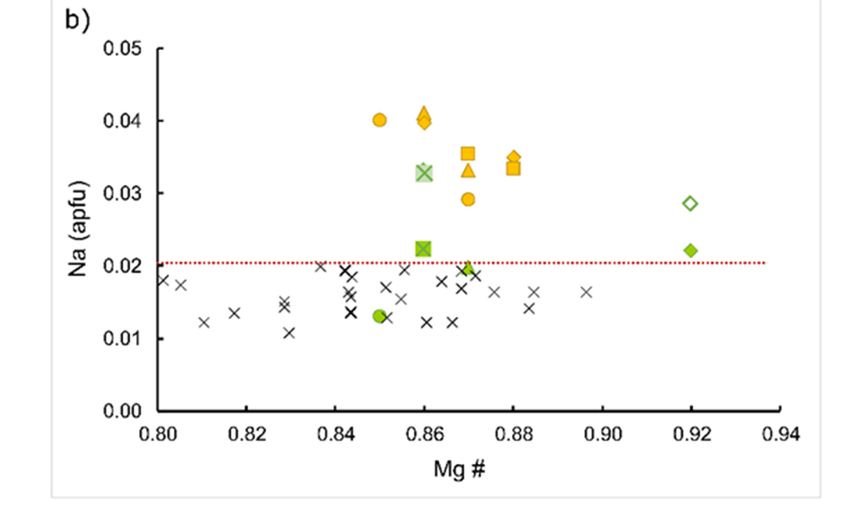
Minerals 2020, 10, 234 7 of 21
3.2. Phases Composition
Chemical compositions of Cpx, glass and Ol of natural starting material and glassy starting
material runs are reported in Table S1 in the Supplementary Material. Chemical compositions of the
other phases crystallized in glassy starting material runs are reported in Bonechi et al. [31].
3.2.1. Natural Starting Material Series
Clinopyroxene. Clinopyroxene crystals in natural starting material runs are classified as diopsides
(Wo41–49 En44–50 Fs4–9 ) according to the classification scheme of Morimoto et al. [56]. Some clinopyroxene
crystals show core-rim compositional variations. For example, in APR16-1C and APR16-2B runs
the Cpx core is characterized by higher CaO and lower Al2 O3 and Na2 O content than those of the
rimMinerals
(Table2020,
S1 10,
in234
the Supplementary Material). As highlighted in the previous sections, 8textural of 22
evidences suggest mineral-melt disequilibrium in the short experiments (≤ 3 h runs) and also the
suggest in
chemistry mineral‐melt disequilibrium in the
term of clinopyroxene-liquid shortexchange
Fe-Mg experiments (≤ 3 h runs)
coefficient, and also
calculated bythe chemistry
using in
the formula
term of clinopyroxene‐liquid Fe‐Mg exchange coefficient,
(FeO/MgO) /(FeO/MgO) , is quite in agreement with textural evidences. The
Cpx liq calculated by using
Cpx-liq the formula
KDFe-Mg value
(FeO/MgO)
in the APR16-3B/(FeO/MgO)
Cpx
run (0.16 h), is
liq
is quite
0.43, in
in agreement
APR16-1Cwithruntextural
(3 h) isevidences.
0.28 ± 0.02The for theKcore
Cpx‐liq DFe‐Mg value in
and 0.33 ±
the APR16‐3B run (0.16 h) is 0.43, in APR16‐1C run (3 h) is 0.28 ± 0.02 for the core and 0.33 ± 0.02 for
0.02 for the rim, in APR16-35 run (6 h) is 0.33 ± 0.06 for the core and 0.32 ± 0.02 for the rim, and in
the rim, in APR16‐35 run (6 h) is 0.33 ± 0.06 for the core and 0.32 ± 0.02 for the rim, and in APR16‐2B
APR16-2B run (12 h) is 0.56 ± 0.21 and 0.47 ± 0.02 for the core and for the rim, respectively. According
run (12 h) is 0.56 ± 0.21 and 0.47 ± 0.02 for the core and for the rim, respectively. According to Putirka
to Putirka [57], the calculated KD value for APR16-35 and APR16-1C indicate equilibrium between
[57], the calculated KD value for APR16‐35 and APR16‐1C indicate equilibrium between
clinopyroxene and liquid, whereas only in the shortest (APR16-3B) and in the longest (APR16-2B)
clinopyroxene and liquid, whereas only in the shortest (APR16‐3B) and in the longest (APR16‐2B)
experiment
experiment thethechemical
chemicalCpx-liquid
Cpx‐liquidequilibrium
equilibrium has been not
has been notachieved
achieved(Figure
(Figure2).2).Notably,
Notably, KDKD
thethe
calculated
calculatedforfor
thethe
APR16-2B
APR16‐2Brun run(12
(12h)
h)could
could be
be due to the
due to thesignificant
significantloss
lossofofFeFe
inin
the the melt
melt related
related to to
thethe
long experimental dwell
long experimental dwell time.time.
Figure 2. Relation
Figure 2. Relation betweenKK
between DD(Fe-Mg)Cpx-liq
(Fe‐Mg)Cpx‐liq and timetime (s).
(s).The
Theduration
durationofofeach
each
runrun is indicated
is indicated withwith
different symbols: circle for 0.16 and 0.25 h runs, triangle for 3 h runs, diamond for 6 h
different symbols: circle for 0.16 and 0.25 h runs, triangle for 3 h runs, diamond for 6 h runs, square for runs, square
9 h for 9 hand
runs runs and square
square with internal
with internal cross
cross for 12 hfor 12 Series
run. h run. are
Series are indicated
indicated with different
with different colors: colors:
green for
greenstarting
natural for natural starting
material, andmaterial, andglassy
yellow for yellowstarting
for glassy starting
material. Formaterial.
natural For natural
starting starting
material runs
arematerial
used emptyruns symbols
are used empty
for Cpxsymbols
rims andfor full
Cpxsymbols
rims andfor fullCpx
symbols
cores.for Cpx
The cores.
grey fieldThe grey fieldthe
represents
representsrange
equilibrium the equilibrium
according torange according
Putirka to Putirka
[57], while [57],line
the dotted while the dotted
represents the line represents
average KD valuethe for
average K D value for Cpx (0.28 ± 0.08; [57]).
Cpx (0.28 ± 0.08; [57]).
Olivine.
Olivine. Olivinecrystals
Olivine crystalsshow
showaavariation
variation in
in their
their forsteritic
forsteriticcontent
contentfrom
from~91
~91(APR16‐35;
(APR16-35;6 h)6 to
h) to
87 (APR16‐3B; 0.16 h) decreasing the experimental time. These values suggest a dissolution of
87 (APR16-3B; 0.16 h) decreasing the experimental time. These values suggest a dissolution of Ol that Ol that
becomes more restitic increasing the duration of the experiments. Moreover, the forsteritic content of
becomes more restitic increasing the duration of the experiments. Moreover, the forsteritic content
Ol present in the APR16‐3B run (Fo87), that is the same value reported by D’Antonio et al. [34] for
of Ol present in the APR16-3B run (Fo87 ), that is the same value reported by D’Antonio et al. [34] for
natural olivines in APR16 sample, confirms that they are remnant of the natural starting material
rather than phases crystallized during the experiment.
3.2.2. Glassy Starting Material Series
Clinopyroxene. Clinopyroxene crystals are augitic (Wo42En41Fs18) and diopsidic (Wo47En43Fs10) in
composition according to the classification scheme of Morimoto et al. [56]. Generally, the Mg# of Cpx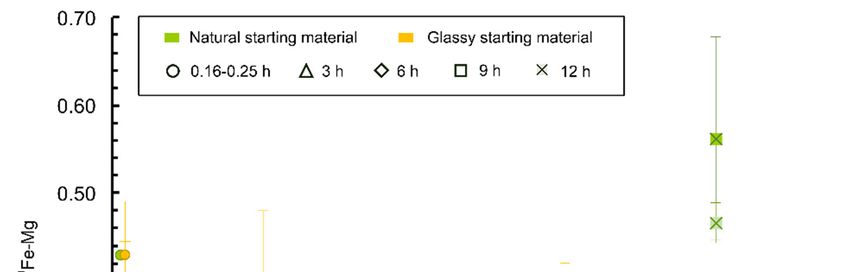
Minerals 2020, 10, 234                                                                               8 of 21

natural olivines in APR16 sample, confirms that they are remnant of the natural starting material rather
than phases crystallized during the experiment.

3.2.2. Glassy Starting Material Series
     Clinopyroxene. Clinopyroxene crystals are augitic (Wo42 En41 Fs18 ) and diopsidic (Wo47 En43 Fs10 )
in composition according to the classification scheme of Morimoto et al. [56]. Generally, the Mg# of
Cpx (calculated as the molar MgO/(MgO + FeOtot ) ratio) varies between 0.76 and 0.88, whilst the Mg#
of glass varies between 0.52 and 0.77. The Fe–Mg distribution coefficients between Cpx and melt
(KD (Fe-Mg)Cpx-liq = FeCpx ×Mgliq /MgCpx × Feliq , calculated assuming all Fe as Fe2+ in both phases),
varies between 0.39 ± 0.05 and 0.30 ± 0.05 for APR16-C1A runs, and between 0.43 ± 0.06 and 0.31 ±
0.06 for APR16-C2A runs. As illustrated in Figure 2, all the shortest runs deviate significantly from
the equilibrium range (KD (Fe-Mg)Cpx-liq = 0.28 ± 0.08 according to Putirka [57]), whereas runs of 3 h
or more progressively reach equilibrium conditions. As previously observed for the longest run of
natural starting material series (APR16-2B; 12 h), the slightly deviation from the equilibrium range
of the KD calculated in the run at 9 h, could be due to the loss of Fe in the melt related to the long
experimental dwell time.
     Other phases: Oxide crystals are generally spinels (APR16-C1Ab, APR16-C2Aa and APR16-C2Ab)
and hercynites (APR16-C2Ab). Olivine is present in the run APR16-C1Ac with a forsteritic content
of Fo89 and in the runs APR16-C1Aa, APR16-C1Ab and APR16-C1Ac with compositions of Fo86-90 .
Plagioclase grains occurring only in the runs APR16-C2Ab and APR16-C2Ac are bytownitic and
labradoritic in composition.

3.3. Textural and Chemical Evidences of the Occurrence of Pre-Existing Nuclei
     In the runs of natural starting material series, the use of a natural starting material containing
pre-existing nuclei results in growth around pre-existing crystals. Textural and chemical evidences
suggest that the Cpx observed in the APR16-3B run (0.16 h, 1225 ◦ C) are pre-existing Cpx, while in the
other runs the pre-existing crystals constitute the cores of the zoned Cpx. As regards textural features,
the scarce abundance of the Cpx crystals observed in APR16-3B run (Figure 1a) and their anhedral and
subhedral habits with size of ~10–20 µm, suggest that they are not crystallized during the experiments
but are relic of the phenocrysts present in the natural starting material. Indeed, in comparison, the
Cpx crystallized in APR16-C1Aa run (0.25 h, 1250 ◦ C) obtained using the glassy starting material, are
more abundant and show subhedral and euhedral habit with maximum size of 10 µm. As regards
chemical evidences, the AlIV vs AlVI and Na vs AlVI diagrams (Figure 3), in which both natural starting
material and glassy starting material series and some natural Cpx belonging to the same deposits of the
APR16 sample [58] are reported, allowed to identify the presence of pre-existing nuclei. In particular,
the AlIV vs AlVI diagram represents a good indicator of pressure conditions at which clinopyroxene
crystallizes, due to the preference of Al to occupy tetrahedral and octahedral sites at high T and
P, respectively [59,60]. Moreover, it is important to stress that the Al concentration in Cpx can be
influenced not only by pressure, but also by kinetic effects (e.g., [49]). Similar function has the diagram
in which AlVI is plotted versus Na, suggested to be a pressure-sensitive element [57]. As possible to
see in these diagrams, the Cpx of the APR16-3B run and the cores of the zoned Cpx of the APR16-1C,
APR16-35 and APR16-2B runs fall in the field corresponding to a pressure ≤ 0.5 GPa as well as the
natural Cpx. Conversely, the rim of natural starting material series and the Cpx of the glassy starting
material series fall in the field corresponding to a pressure ≥ 0.7 GPa. Moreover, both AlIV and Na
content allowed to discriminate between pre-existing Cpx and Cpx crystallized during the experiments,
as shown also in Figure 4. In particular, in the diagrams of Figure 4 (AlIV vs Mg# and Na vs Mg#) these
two kinds of Cpx are separated by a red dotted lines, drawn in correspondence of the higher AlVI
and Na values (0.06 and 0.02 apfu, respectively) of natural Cpx [58]. The pre-existing nuclei, indeed,
are located near the red dotted lines while the rims and the Cpx crystallized in the glassy starting
material series are located far from the lines, showing higher AlVI and Na values. The Cpx cores of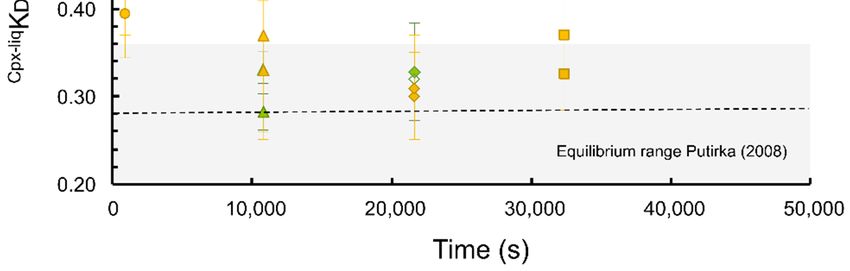
Minerals 2020, 10, 234 9 of 21
APR16-35 (6 h) and APR16-2B (12 h) runs, however, are slightly different from the cores of APR16-3B
and APR16-1C runs. This difference could be due to the loss of Fe occurred in their melt during
the experiments but also to kinetic effects, as stated by Pontesilli et al. [49]. These authors, indeed,
observed that in time-series experiments, but also in experiments performed at constant dwell time,
compositional changes in Cpx crystals are function of dwell time, according to the cation exchange
+ Mg) 2020,
(Si Minerals → (T10, and Fe3+ ).
Al234 10 of 22
IVIVvs AlVIVI (a) and Na vs AlVI
3. 3.AlAl (b) diagrams.
diagrams.Literature
Literature data (black crosses)
Figure
Figure vs Al (a) and Na vs AlVI (b) data (black crosses) areare
fromfrom
D’Antonio
D’Antonio andandDiDiGirolamo
Girolamo[58]. [58]. The
The new
new forming
forming CpxCpxcancanbe bedistinguished
distinguished from
from thethe pre-existing
pre‐existing
nuclei: thethe
nuclei: former
formerfallfallininthe
thehigh-pressure
high‐pressure fieldfield (P >>0.7
0.7GPa),
GPa),while
whilethe
the latter
latter in in
thethe
low low pressure
pressure oneone
(P0.5
(P ≤ ≤ 0.5 GPa).The
GPa). Theblack
blackdotted
dotted line
line bounding
bounding the thefields
fieldsofofhigh‐low
high-lowpressure
pressure CpxCpxis an
is anarbitrary limit
arbitrary limit
drawn
drawn onon thethe basis
basis of results
of results of of experiments
experiments onon APR16
APR16 compositionatat
composition 0.2,0.4
0.2, 0.4(low-P
(low‐Pfield)
field)andand0.8
0.8GPa
GPa (high‐P
(high-P field) [32].The
field) [32].The green green
dotteddotted
lines, lines,
instead,instead, connect
connect CpxCpx corecore
andandrim.rim. Series
Series areare indicated
indicated with
with different colors: green for natural starting material, and yellow for glassy starting
different colors: green for natural starting material, and yellow for glassy starting material. The duration material. The
duration
of each runof is each run is with
indicated indicated with different
different symbols:symbols:
circle forcircle
0.16for 0.16
and andh 0.25
0.25 runs,h runs,
triangle triangle
for 3for 3
h runs,
h runs, diamond for 6 h runs, square for 9 h runs and square with internal cross for
diamond for 6 h runs, square for 9 h runs and square with internal cross for 12 h run. In natural starting 12 h run. In natural
starting
material material
series emptyseries emptyindicate
symbols symbols Cpx indicate Cpx rim,
rim, while while full
full symbols symbols
indicate Cpxindicate
cores. Cpx cores.
Colored field
Colored field represents literature experimental data [32]. Error bars are smaller than symbol size.
represents literature experimental data [32]. Error bars are smaller than symbol size.Minerals 2020, 10, 234 10 of 21
Minerals 2020, 10, 234 11 of 22
VIVI (apfu) vs Mg# (a) and Na (apfu) vs Mg# (b). Symbols are as in Figure 3. The red dotted
Figure4.4.Al
Figure Al (apfu) Mg# (a) and Na (apfu) vs Mg# (b). Symbols are as in Figure 3. The red dotted
line allows
line allowstotodiscriminate
discriminate between pre-existingnuclei
between pre‐existing nucleiandandnew
new forming
forming crystals.
crystals. This
This isarbitrary
is an an arbitrary
limit
limit drawnononthe
drawn thebasis
basisofofthe
theobtained
obtainedresults
resultsof
of this study and literature
this study literature data
datafrom
fromD’Antonio
D’Antonioandand Di
Di Girolamo
Girolamo [58]. [58].
3.4. Clinopyroxene
3.4. ClinopyroxeneGrowth
Growthand
and Nucleation Rates
Nucleation Rates
Maximum
Maximumgrowth growth rates determined
rates determined for for
clinopyroxene
clinopyroxene are reported
are reportedin Table 3. Figure
in Table 5 illustrates
3. Figure 5
illustrates
the relation the relation
between a)between a) crystal
crystal size (L) and sizeexperimental
(L) and experimental
time, and time, and b) crystal
b) crystal growthgrowth
rate (Grate
L and
)
(G ) and experiment time. In both series it was possible to observe an increase
experiment time. In both series it was possible to observe an increase in crystal size with increasing
L in crystal size with
increasing
time, while thetime, while rates
growth the growth
decrease ratesbydecrease
about an byorder
aboutofanmagnitude
order of magnitude with increasing
with increasing duration of
duration
the of the experiments.
experiments. In the runsIn ofthe runs of
natural naturalmaterial
starting starting material
series theseries
GL the GL decreases
decreases from from
~2 × ~210×−7 to
~610 to−8~6cm·s
× 10−1cm∙s as duration increases from 3 to1212h,h,while
while inin the
theruns
runsofofglassy starting material
−7 −8 −1
× 10 as duration increases from 3 to glassy starting material
series the GL decreases from ~3 × 10⁻⁷ −7 to ~2 × 10⁻⁸ cm∙s−1 as duration increases from 0.25 to 9 h [31].
−8 −1
series the GL decreases from ~3 × 10 to ~2 × 10 cm·s as duration increases from 0.25 to 9 h [31].
Moreover, it is possible to see that both the sizes and the GL values of natural starting material runs
Moreover, it is possible to see that both the sizes and the GL values of natural starting material runs are
are higher than those of glassy starting material ones. The growth rates obtained for the two series
higher than those of glassy starting material ones. The growth rates obtained for the two series are
are comparable with those available in literature for basaltic and trachybasaltic compositions
comparable with those available in literature for basaltic and trachybasaltic compositions [48,49,61–64].
[48,49,61–64]. In particular, the growth rates of the glassy starting material runs show values in
Inagreement
particular, withthe growth rates of the
those obtained glassy
in the staticstarting material
experiments of runs show[62]
Burkhard values in agreement
on re‐heated with those
anhydrous
obtained in the static experiments of Burkhard [62] on re-heated anhydrous
basalt (dwell times of 22–576 h, T = 930–990 °C and P = 1 atm) and of Orlando et al. [48] on anhydrous basalt (dwell times of
22–576 h, T = 930–990 ◦ C and P = 1 atm) and of Orlando et al. [48] on anhydrous trachybasalt (dwell
trachybasalt (dwell times of 3–40 h, T = 1170 °C, P = 1 atm and ΔT = 20 °C). The growth rates of the
times
naturalof 3–40 h, T
starting = 1170run,
material
◦ C, P = 1 atm and ∆T = 20 ◦ C). The growth rates of the natural starting
instead, are an order of magnitude higher than these latter. Their values,
material
indeed,run, are instead,
similar toare an order
those of magnitude
obtained in the dynamichigherexperiments
than these latter. Their values,
of Pontesilli indeed,
et al. [49] on a are
similar
anhydrousto thoseand obtained in the dynamic
hydrous trachybasalt (dwellexperiments
times of 0.5–24 of h,Pontesilli et al.
T = 1100 °C, P =[49] on a and
400 MPa anhydrous
ΔT = 80–and
120 °C),trachybasalt
hydrous of Shea and Hammer(dwell times [17] onof a0.5–24
hydrous = 1100 ◦ C, P =(dwell
h, Tbasaltic‐andesite 400 MPa times ∆T = 80–120
of 12–48
and ◦ C), of
h, T = 995–
1025and
Shea °C, P = 65–150 [17]
Hammer MPaon anda ΔT = 52–155
hydrous °C) and of Baker (dwell
basaltic-andesite [64] on times
a trachybasalt
of 12–48 (dwell = 995–1025
h, T times of 3.5– ◦ C,
P = 65–150 MPa and ∆T = 52–155 ◦ C) and of Baker [64] on a trachybasalt (dwell times of 3.5–14 h,Minerals 2020, 10, 234 11 of 21
T = 1150 ◦ C, P = 1000 MPa and ∆T = 75 ◦ C). Finally, growth rates of both natural and glassy starting
material runs show higher values than those obtained by Burkhard [61] on re-heated Hawaiian basalt
(~0.01–7 h of crystal residence times) and by Oze and Winter [63] on tholeiitic basalt (~0.04–9 h of
crystal residence times).
Table 3. Calculated growth rate values for clinopyroxene.
Minerals 2020, 10, 234 Time (s) H2 Of St. dev. St. dev. 12
St.of 22
dev.
Run # T (◦ C) L (cm) W (cm) GL (cm·s−1 )
(wt. %) (cm) (cm) (cm·s−1 )
14 h, TNatural
= 1150 starting
°C, Pmaterial
= 1000 MPa and ΔT =−375 °C). Finally, growth rates of both natural and glassy
APR16-3B 1225 600 1.77 1.55 × 10 6.3 × 10⁻⁴ 9.00 × 10⁻⁴ 1.4 × 10⁻⁴ - -
starting material
APR16-1C 1225 runs
10,800 show higher
0.96 values
4.37 × 10 −3 than those
5.9 × 10 −4 obtained
2.70 × 10⁻³ by Burkhard
6.5 × 10 −4 [61]
1.59 × 10on−7 re‐heated
3.0 × 10⁻⁸
Hawaiian1225
APR16-35 basalt (~0.01–7
21,600 h of1.70
crystal4.64
residence
× 10−3 times) and by
1.5 × 10⁻³ 2.83Oze and Winter
× 10−3 5.8 × 10⁻⁴[63]8.34
on ×tholeiitic
10−8 1.9basalt
× 10−8
APR16-2B 1225 43,200 2.13 6.01 × 10 −3 2.0 × 10 −3 4.16 × 10⁻³ 8.0 × 10⁻⁴ 5.76 × 10 −8 1.4 × 10⁻⁸
(~0.04–9 h of crystal residence times).
Glassy starting material
The nucleation
APR16-C1Aa1250 900rate (J)1.61
determined for clinopyroxene
6.48 × 10⁻⁴ 4.4 × 10⁻⁵ 3.13 ×are
10−4reported
6.8 × 10⁻⁵in Table 4.−7Calculated
2.50 × 10 2.9 × 10⁻⁸
APR16-C1Ab1250
nucleation rates for 10,800 2.33
natural starting × 10−3 runs
material
1.17 10−4 between
2.1 ×vary −4 2
5.30 × 10¹⁰ and
9.8 ×10¹⁰−5
mm−33.64 10−8 3 to
s−1×from 6.8 12 −9
× 10h,
APR16-C1Ac1250 21,600 2.03 1.35 × 10⁻³ 1.5 × 10⁻⁴ 5.86 × 10⁻⁴ 3 1.5 −3× 10⁻¹−4 2.06 × 10⁻⁸ 2.8 × 10⁻⁹
while for the glassy
APR16-C1Ad1250
starting material
32,400 1.95
runs vary 2.1
1.43 × 10⁻³
between
× 10−4
108.78and
5 10 mm
× 10−4
∙s from
1.2 × 10⁻⁴
the shortest
1.73 × 10⁻⁸
(0.25
2.0 × 10⁻⁹
h) to the longest (9 900
APR16-C2Aa1220 h) durations,
1.92 respectively.
8.40 × 10⁻⁴ Figures
1.1 × 10−46 and4.05
7a×show
10−4 the 9.2 nucleation
× 10−5 3.24rate
× 10−7 vs time
5.2 ×and
10−8
APR16-C2Ab1220 −3 −4 4.04 × 10⁻⁴In both −5 −8 −9
the nucleation rate10,800 1.56
vs undercooling 1.07
(ΔT)× 10diagrams,
2.3 × 10respectively. 6.5 × 10 3.04 ×
diagrams it 10
is 3.9 × 10to
possible
APR16-C2Ac1220 21,600 2.47 1.68 × 10⁻³ 1.3 × 10⁻⁴ 7.93 × 10⁻⁴ 3.0 × 10⁻⁴ 2.67 × 10⁻⁸ 5.1 × 10⁻⁹
note that Cpx nucleation
APR16-C2Ad1220 32,400 rates of natural
1.30 1.70 ×starting
10−3 material
1.6 × 10⁻⁴ runs 10−4lower
9.22 ×are 2.0than
× 10−4those of×glassy
1.93 10−8 starting
2.2 × 10⁻⁹
material runs.natural
In Figure 6,rock;
J tends
H2 Oto decrease increasing dwell time in all the series: in particular, the
Notes: NWA water f as determined by the by-difference calculation method (respect to the total
nucleation seems to
of EMP analyses). decrease
L and W are theuplength
to ~3 and
h, after which
the width it remains
of the crystals. quite constant.
GL is the Ingrowth
calculated Figurerate.
7a, St.
instead,
dev.
Standard
the deviation.
nucleation Data for glassy
rate decreases starting material
increasing the ΔT.runs from Bonechi et al. [31].
Figure
Figure 5. 5.Relation
Relationbetween
between (a)
(a) Cpx
Cpxsize
size(L)
(L)and
andexperimental
experimentaltime, and and
time, (b) Cpx
(b) growth rate (Grate
Cpx growth L) and(GL )
andexperimental
experimental time. Symbols
time. are are
Symbols as inasFigure 2. Error
in Figure bars bars
2. Error are not
areshown when when
not shown they are inside
they the
are inside
thesymbols.
symbols.Minerals 2020, 10, 234 12 of 21
The nucleation rate (J) determined for clinopyroxene are reported in Table 4. Calculated nucleation
rates for natural starting material runs vary between 102 and 10 mm−3 ·s−1 from 3 to 12 h, while for
the glassy starting material runs vary between 105 and 103 mm−3 ·s−1 from the shortest (0.25 h) to
the longest (9 h) durations, respectively. Figures 6 and 7a show the nucleation rate vs time and the
nucleation rate vs undercooling (∆T) diagrams, respectively. In both diagrams it is possible to note that
Cpx nucleation rates of natural starting material runs are lower than those of glassy starting material
runs. In Figure 6, J tends to decrease increasing dwell time in all the series: in particular, the nucleation
seems to decrease up to ~3 h, after which it remains quite constant. In Figure 7a, instead, the nucleation
rate decreases increasing the ∆T.
Table 4. Calculated nucleation rate values for clinopyroxene.
Run # T (◦ C) Time (s) Ln n0 (mm−4 ) n0 (mm−4 ) J (mm−3 ·s−1 )
Natural starting material
APR16-1C 1225 10,800 19.6 3.25 × 10⁸ 5.17 × 10²
APR16-35 1225 21,600 17.86 5.71 × 10⁷ 4.76 × 101
APR16-2B 1225 43,200 18.02 6.70 × 10⁷ 3.86 × 101
Glassy starting material
APR16-C1Aa 1250 900 25.78 1.57 × 10¹¹ 3.93 × 10⁵
APR16-C1Ab 1250 10,800 26.84 4.53 × 10¹¹ 1.65 × 10⁵
APR16-C1Ac 1250 21,600 24.8 5.90 × 10¹⁰ 1.21 × 10⁴
APR16-C1Ad 1250 32,400 25.05 7.57 × 10¹⁰ 1.31 × 10⁴
APR16-C2Aa 1220 900 22.4 5.35 × 10⁹ 1.85 × 10⁴
APR16-C2Ab 1220 10,800 24.13 3.00 × 10¹⁰ 1.32 × 10⁴
APR16-C2Ac 1220 21,600 23.09 1.06 × 10¹⁰ 2.96 × 10³
APR16-C2Ad 1220 32,400 23.13 1.10 × 10¹⁰ 2.13 × 10³
Notes: Ln n0 is the natural logarithm of nucleation density, n0 is the nucleation density and J is the nucleation rate.
Nucleation density and rate were calculated trough the equations: n0 = exp(ln(n0 )) and J = n0 × G, respectively. Ln n0
as derived by CSD Corrections 1.6 program [52,53]. Data for glassy starting material runs from Bonechi et al. [31].
Minerals 2020, 10, 234 13 of 22
Figure 6. Relation between the nucleation rate (J) and the experimental time. Symbols are as in Figure
Figure 6. Relation between the nucleation rate (J) and the experimental time. Symbols are as in Figure 2.
2. Black asterisks indicate the single step cooling runs (ΔTeff = 52–82 °C) of Shea and Hammer [17].
Black asterisks indicate the single step cooling runs (∆Teff = 52–82 ◦ C) of Shea and Hammer [17].Minerals 2020,
Figure10,6.234
Relation between the nucleation rate (J) and the experimental time. Symbols are as in Figure 13 of 21
2. Black asterisks indicate the single step cooling runs (ΔTeff = 52–82 °C) of Shea and Hammer [17].
Figure
Figure 7. 7. Variation
Variation ofof(a–c)
(a–c)the
thenucleation
nucleation rate
rate (J)
(J) with
with the
theundercooling
undercooling(ΔT(∆T eff) and (d) the growth rate
eff ) and (d) the growth rate
(G L) with the undercooling (ΔTeff). In Figure 7a are reported the runs of natural starting material series
(GL ) with the undercooling (∆Teff ). In Figure 7a are reported the runs of natural starting material series
(in (in green),
green), andand glassystarting
glassy startingmaterial
materialseries
series (in
(in yellow);
yellow);symbols
symbolsare
areasasininFigure
Figure 2. 2.
Figure 7b 7b
Figure shows
shows
the single step cooling runs of Shea and Hammer [17] for comparison; colors indicate
the single step cooling runs of Shea and Hammer [17] for comparison; colors indicate different duration different
duration of the runs: in red the 12 h‐runs, in purple the 24 h‐runs and in blue the 48 h‐runs. Figure
of the runs: in red the 12 h-runs, in purple the 24 h-runs and in blue the 48 h-runs. Figure 7c,d show the
7c,d show the runs investigated in this study (ΔTeff < 60 °C) and those of Bonechi et al. [31] (ΔTeff > 60
runs investigated in this study (∆Teff < 60 ◦ C) and those of Bonechi et al. [31] (∆Teff > 60 ◦ C); symbols
°C); symbols are as in Figure 2. Dotted lines indicate the hypothetical variation of J with ΔTeff (Figure
are as in Figure 2. Dotted lines indicate the hypothetical variation of J with ∆Teff (Figure 7c) and of G
7c) and of G with ΔTeff (Figure 7d). Green lines indicate runs obtained using natural starting material
with ∆Teff (Figure 7d). Green lines indicate runs obtained using natural starting material while black
while black ones run obtained using vitrified starting material.
ones run obtained using vitrified starting material.
4. Discussion
4.1. Influence of Pre-Existing Crystals on Nucleation and Growth Rate
Crystallization implies two successive processes: nucleation and crystal growth. While a rapid
cooling suppresses the nucleation process favoring the formation of a glass, a moderate to slow cooling,
instead, allows nucleation that can be either homogeneous or heterogeneous [26]. In the homogeneous
nucleation case nuclei have the same probability to form spontaneously in any part of the melt,
whereas in the second case nucleation occurs preferentially on pre-existing surfaces (e.g., [26,27,65–70]).
As stated by Špillar and Dolejš [15], in presence of pre-existing nuclei the interfacial energy between
the nucleating phase and the pre-existing nuclei is lower than that between the nucleating phase and
the melt because of lesser number of broken bonds between two solid phases. The pre-existing nuclei,
therefore, represent a site of energetically favorable nucleation, which is statistically preferred due to
the structural similarity between the substrates (e.g., [8,25,27]). As observed by Vetere et al. [25,26],
the structural similarities between the pre-existing nuclei and the nucleating phases concentrate the
supply of chemical elements in the liquid surrounding the new growing crystals, limiting in this way
the formation of new nucleation sites. Moreover, according to Masotta et al. [20], element diffusivity inMinerals 2020, 10, 234 14 of 21
the melt also play a fundamental role in determining either new nucleation or growth on pre-existing
nuclei. This influence of the pre-existing crystals on the nucleation has been observed also in this study.
Firstly, the Cpx crystallized in natural starting material series are present as big crystals (up to ~80 µm)
in smaller quantities than those crystallized in glassy starting material one, that are small in size (up to
~20 µm) and very abundant (Figures 1 and 3a and Table 2). Moreover, in the diagrams of Figure 6
it is possible to see that the Cpx of natural starting material runs show nucleation rates lower than
those of glassy starting material runs. The presence of these pre-existing crystals, thus, influencing the
nucleation rate, consequently, also affects the growth rate. As shown in Figure 5b, indeed, the Cpx
growth rates of natural starting material runs are higher than those of the other series. Since the series
were performed with similar time and water content conditions, the only different parameters able to
affect the growth rate are temperature and undercooling (e.g., [30,31]). However, neither can justify
the higher growth rate of natural starting material runs, since both temperature and undercooling
(∆T = Tliquidus −Texperiment ) of natural starting material series (1225 ◦ C and 55 ◦ C, respectively) are quite
similar to those of glassy starting material series (1250–1220 ◦ C and 45–50 ◦ C, respectively). Indeed,
considering how the nucleation should vary with the undercooling, in absence of pre-existing crystals,
the nucleation values should be slightly lower than those measured for lower ∆T (i.e., 45–50 ◦ C) but not
so different as those measured in natural starting material runs (~3 order of magnitude of difference;
Figure 7a). The same interpretation is applicable to the growth rate (Figure 7d): indeed, in absence
of pre-existing nuclei, the growth rate should be slightly higher than those measured for lower ∆T
(i.e., 45–50 ◦ C) but with a difference lower than an order of magnitude. The influence of pre-existing
crystals on nucleation and growth rate has also been observed for plagioclase crystals in the work of
Arzilli et al. [28], comparing the natural rhyolite of Hammer and Rutherford [23] with the vitrified
rhyolite of Mollard et al. [71]. Therefore, the different values of nucleation and growth rates in the
natural starting material series seems to be linked to the presence of pre-existing nuclei rather than to
the different undercooling.
4.2. Influence of Time on Nucleation and Growth Rates
Time is an important factor since it plays a crucial role in the crystallization processes of silicate
melts (e.g., [23,28,46,72]). As shown in Figure 6, the runs of this study show a decrease of the Cpx
nucleation rate with increasing the duration of the experiments as well as those (single-step cooling
runs) of Shea and Hammer [17]. J is relatively high during the initial nucleation event (0.25 and 3 h),
from 104 to 105 mm−3 ·s−1 , and rapidly decreases increasing the dwell time (6 and 9 h) remaining quite
constant (103 and 104 mm−3 ·s−1 for glassy starting material runs, respectively). This suggests that the
main event of nucleation occurred within the first three hours of the experiment, probably in the first
minutes at the beginning of the experiment as observed by Ni et al. [73] for a basaltic composition
through in situ experiments.
According to the results of Bonechi et al. [31], the Cpx growth rate calculated for the natural
starting material series follow the trend of the glassy starting material one, varying by an order of
magnitude between the runs with the shortest and those with the longest durations (Figure 5b), in
agreement with what has been observed in other studies available in literature (e.g., [17,48,49,61,74]).
In particular, starting from a dwell time ≥ 3 h, the runs begin to achieve conditions close to the textural
equilibrium, at which point an overall decay of the growth rate occurs [20,21,48]. The influence of time
on crystal growth rate, indeed, results to be strictly related to the equilibration time of the growing
phases, as observed by previous studies (e.g., [28,31,43,46,48]).
4.3. Influence of Undercooling on Nucleation and Growth Rates
Arzilli et al. [28] comparing plagioclase nucleation rates in a variety of experimental studies on
water-saturated compositions ranging from basaltic through rhyolitic, noted that nucleation rates of
8-h runs in basaltic melts increase with increasing ∆Teff (i.e., the difference between the phase liquidus
temperature and the nominal temperature of the runs), whereas the 1-h runs show an opposite trend,Minerals 2020, 10, 234 15 of 21
because the nucleation process was not able to be accomplished due to the limited experimental dwell
time. The authors, indeed, suggest that for the same ∆Teff the nucleation could be completed within
2 h. The increase of the nucleation rate with the undercooling has also been observed for clinopyroxene
by Masotta et al. [20] in a trachybasaltic melt in long-lasting runs (dwell time of 24 h). Although in
this study it was possible to calculate the nucleation rates at 0.25 h only for low undercoolings, it is
reasonable to assume that the ≤ 3-h runs behave like the 1-h runs of Arzilli et al. [28], in accordance
with what stated above. As shown in Figure 7c, the nucleation rate decreases with increasing the
undercooling up to 50 ◦ C while for higher undercooling the nucleation first increases (up to 100 ◦ C)
and then decreases, similarly to the trend of the runs of Shea and Hammer [17] (Figure 7b). At effective
degrees of undercooling ≤ 50 ◦ C, indeed, most phases fail to nucleate significantly probably due to the
dominance of crystal growth [8,17], rather than to a nucleation lag or incubation period as typically
considered [75–77]. Moreover, according to Shea and Hammer [17], at low undercoolings (≤50 ◦ C)
it is possible to hypothesize the occurrence of a heterogeneous nucleation due to the high energy
barrier required by homogeneous nucleation. The lack of the latter process in the natural starting
material runs is related to the presence of pre-existing nuclei in the starting melt, that favor growth
over nucleation. For undercoolings > 50 ◦ C (data from Bonechi et al. [31]), instead, the nucleation has a
bell shape suggesting that it probably occurs homogeneously (Figure 7c).
As regards the growth rate, it occurred both on pre-existing crystals as well as on new forming
nuclei during the experiments. As shown in Figure 7d, to the growth rate follows a bell-shaped trend
with increasing the undercooling, in agreement with what observed by previous studies (e.g., [17,28]).
Moreover, the Cpx growth rates of the run with pre-existing nuclei (natural starting material series) are
higher than those of the other runs (glassy starting material series) at similar T and time conditions,
according to what previously observed for the nucleation rate (i.e., pre-existing nuclei in the starting
melt favor growth over nucleation).
4.4. Application
In Bonechi et al. [31], data of Cpx growth rates have been combined with thermobarometric
data of natural Cpx (SCE and SOG samples) in order to provide an estimate of deep-level ascent
rate for CFVD primitive magmas. In particular, they assumed that a deep episode of magmatic
crystallization occurred at low undercooling, a condition verified by CSD investigations of SCE and
SOG samples that highlighted the presence of three main Cpx population: larger phenocrysts (sizes
~0.32 mm), smaller phenocrysts and microlites (sizes < 0.32 mm). The range of temperatures and
pressures of crystallization estimated for the larger population of Cpx are between 1141–1178 ◦ C and
0.7–0.9 GPa (20–25 km of depth assuming an average crustal density of 2.8 g/cm3 ), suggest together
with CSD analysis that this population formed during a crystallization stage at deep level. According
to the approach of Armienti et al. [78], for a ∆T of 37 ◦ C (∆T = 1178–1141 ◦ C), a ∆L of ~ 0.3 cm and
a growth rate of 2 × 10⁻⁸ cm·s−1 , the cooling rate during the ascent of Procida K-basaltic magmas
was estimated to be 0.3 × 10⁻⁵ ◦ C/s. This value, combined with the dP/dT from thermobarometry,
provided a deep-level ascent velocity of ~0.5 × 10⁻⁴ m·s−1 . In this work using the same crystallization
parameters but the growth rate obtained for the natural starting material series, influenced by the
presence of pre-existing nuclei (1.2 × 10⁻⁷ cm·s−1 ), a deep-level ascent velocity of ~6 × 10⁻⁴ m·s−1 was
obtained. However, the Ol/Cpx ratio (~1) of the SCE and SOG samples suggests, in accordance with the
experimental phase relations at 0.2–0.8 GPa [79], that primitive magmas of Procida pond at relatively
shallow level before the Solchiaro hydromagmatic eruption. This is validated by barometric estimation
on the smaller phenocrysts, whose crystallization occurred at 0.3–0.5 GPa (8–14 km of depth; [31]).
Therefore, the assessed residence time for the larger Cpx population (i.e., at least 5 months for a GL of
2 × 10⁻⁸ cm·s−1 and 1 months for a GL of 1.2 × 10⁻⁷ cm·s−1 ) multiplied for the magma volume erupted
from the CFVD tuff ring (0.1–1 km3 ; e.g., [80]) could represent the minimum recharge rate of the large
magmatic reservoir, whose top is situated in the CFVD at about 8 km of depth [81–88]. Considering the
mass balance model of Fedi et al. [84], according to which the source of the Campania Active VolcanicYou can also read


