Dublin Economic Monitor - EY
←
→
Page content transcription
If your browser does not render page correctly, please read the page content below
Dublin issue 14
       August 2018

Economic
Monitor

                          In this issue
                        LATEST DUBLIN
                      ECONOMIC DATA
                 IHS MARKIT DUBLIN PMI
      KBC/ESRI CONSUMER SENTIMENT
         MASTERCARD SPENDINGPULSE
       CONSTRUCTION DRIVES HIGHEST
              QUARTERLY INCREASE IN
             EMPLOYMENT IN 10 YEARS
                 SANDYFORD BUSINESS
               IMPROVEMENT DISTRICT
    DUBLIN BAY BIOSPHERE PARTNERSHIP
WELCOME

       HIGHLIGHTS
          Dublin's unemployment rate
          falls to 5.7% in Q1 2018.

          Residential rents continue on
          upward trend with tenants paying
          an average €1,500 in Q1 2018.

          Residential property prices
          inflation moderated in May 2018
          registering growth of 10.7% YoY.

          Public transport trips in Q1 2018
          53.9 million pubic transport trips
          were undertaken, an additional 2.4
          million trips over Q1 2017.
                                                     welcome to the august
                                                     2018 issue of the dublin
          Housing completions in Dublin
          totalled 5,600 in 2017 with a
          further 1,214 completions in the
          first quarter of 2018.
                                                     economic monitor
          Dublin Airport welcomed an

                                                     T
          additional 16,500 passengers in                      he Dublin Economic Monitor                  to the whole of Ireland (see centrefold
          March 2018 compared to March
                                                               is a joint initiative on behalf             supplement).
          2017.
                                                               of the four Dublin Local                        The special articles this quarter
          The Mastercard Dublin                      Authorities, and is designed to be                    include one from Sharon Scally,
          SpendingPulse                              of particular interest to those living                Chairperson of the Sandyford Business
          Consumer spending in the Dublin            and doing business in Dublin or                       Innovation District (BID) discussing
          economy grew 5.2% YoY in Q2                consideringlocating here. It is produced              how they are driving business
          2018 while tourist expenditure was         by EY-DKM Economic Advisory                           development in the area and trying to
          up 16.2% YoY, driven mainly by the         Services, with KBC/ESRI delivering the                achieve Innovation District status by
          US and French markets.                     Dublin Consumer Sentiment data and                    2021 (p.12). While Les Moore, Chair of
                                                     IHS MARKIT delivering the Dublin                      the Dublin Bay Biosphere Partnership
          The Dublin MARKIT PMI                      Purchasing Managers' Index (PMI).                     talks about the business & enterprise
          Output continued to rise sharply
                                                         We also partner with Mastercard to                opportunities in the unique UNESCO
          in the Dublin private sector in
                                                     use their SpendingPulse reports to better             urban site which covers over 300 km2 of
          Q2 2018, extending the current
          sequence of growth to 23 quarters.         understand retail and tourism spending                the Dublin region (p.14).
          The Dublin PMI moved up to 58.5            patterns. The SpendingPulse is derived                    We hope you find the Monitor
          from 58.0 in the opening quarter           from anonymised and aggregated card                   useful and welcome any feedback. You
          of the year.                               transaction data as well as other means               can sign up to our quarterly mailing
                                                     of payments such as cash and cheques.                 list and access the Monitor resources
          KBC/ESRI Consumer Sentiment                This data helps the city develop new                  online at www.dublineconomy.ie. The
          Overall, consumer sentiment                insights on the spending patterns                     next release will be published online on
          remains in positive territory but          of Dubliners and tourists, as well as                 November 8th 2018.
          Q2 2018 has seen a broad-based             comparing the Capital's performance
          downturn in confidence relative to
          Q1. The decline has occurred both
          in and outside Dublin suggesting           Dublin City              South Dublin County         Fingal County          Dún Laoghaire Rathdown
          a broad-based moderation in                Council                  Council                     Council                County Council
          sentiment.
                                                     This document provides general information on the Dublin economy. It is not intended to be used
                               image: nigel motyer   as a basis for any particular course of action or as a substitute for financial advice. The document is
        winner of the best photograph of a fish or   produced independently by EY-DKM Economic Advisory Services; the views and opinions expressed are
       mammal category in the dublin bay biosphere   those of the relevant author, and do not necessarily reflect the views of the Dublin Local Authorities.
         underwater photography competition 2018.    The Dublin Local Authorities disclaim all liability in connection with any action that may be
                                                     taken in reliance of this document, and for any error, deficiency, flaw or omission contained in it.

2 //
ECONOMY
GLOBAL ECONOMY NATIONAL ECONOMY
According to the IMF’s World Economic Outlook for April 2018, The latest results for Irish GDP show annual growth of 7.2% in 2017.
the global economic upswing of the past two years has become GNP increased at a rate of 4.4% for the same period, revised from
broader and stronger. Indeed their forecasts indicate growth of a preliminary estimate of 6.6%. Modified Gross National Income
approximately 4% over the next two years. (GNI*), an indicator designed to exclude globalization effects that
In the US growth is forecast to increase from 2.3% to 2.9% this disproportionally impact the measurement of the size of the Irish
year before a slight moderation in 2019. The IMF note that the economy, indicated more modest growth of 3.0% in 2017, while
expected macroeconomic impact of the December 2017 tax reform another alternative measure, Modified Domestic Demand (MDD),
– namely the lower corporate tax rate and firmer external demand which accounts for the effects of aircraft leasing and the import of
- is to boost short-term activity. Since the last publication, the US intellectual property, shows the economy grew by 1.4%. It is clear
and EU have declared a ceasefire in their trade war with both sides from both GNI* and MDD that the underlying rate of growth in
agreeing to put on hold any new tariffs. the Irish economy is much less than suggested by GDP or GNP.
The IMF has also revised upward their expectations of growth in Personal consumption, an important indicator of how the
the Euro Area, reflecting stronger-than-expected domestic demand, domestic economy is performing, increased by 1.6% in 2017. Over
supportive monetary policy and improved external demand the last six years, the largest increase in value added (the difference
prospects. As such, the Euro Area is forecast to grow by 2.4% in between production value and intermediate consumption) in the
2018 before falling back slightly in 2019 to 2%, considerably lower five key sectors has come in industry, as observed in the Figure below.
than growth rates forecast for Ireland. This is followed by professional, admin and support services and
information and communication. Increases in value added to public
administration, education and health, however, have been minimal.
eu (28) and irish gdp growth rates
35% trends in value added by sector 2011=100
240
30%
25% 220
20% 200
15%
180
10%
160
5%
140
0%
120
-5%
100
-10%
2005 2006 2007 2008 2009 2010 2011 2012 2013 2014 2015 2016 2017
80
2011
2012
2013
2014
2015
2016
2017
Ireland EU (28)
Industry excluding Professional, administration Information and
source: eurostat. note: current prices construction and support services communication
Distribution, transport, Public administration,
hotels and restaurants education and health
Forecasts for the UK remain broadly unchanged and indicate a
continued slow-down in growth in the UK over the next two years. source: central statistics office.
Business investment is expected to remain weak, while concerns Brexit remains one of the key risks to growth in the Irish economy.
over higher barriers to trade and lower foreign direct investment in Following the publication of a White Paper, in which the UK
the wake of Brexit are expected to leave the UK growing below its government had advocated for a softer Brexit than previously
potential growth rate. However, inflation remains at 2.7% in 2018, envisaged, on 19 July the EU issued a document underlining the
above the Bank of England target of 2%, on foot of diminishing need for Member States to prepare for a no-deal scenario. This
slack in the economy together with the pass-through effects of emphasizes that the risk of a no-deal and a significant shock to the
depreciation of the pound. Irish and UK economy remain very real.
major economies gdp growth forecasts irish macroeconomic growth forecasts
2017 2018 2019 2017 2018 2019
% %f %f %E %f %f
global 3.8 3.9 3.9 gnp 4.4% 5.9% 5.0%
gdp 7.2% 4.6% 4.0%
uk 1.8 1.6 1.5
private consumption 1.6% 2.1% 2.0%
us 2.3 2.9 2.7 public expenditure 3.9% 3.1% 2.9%
euro area 2.3 2.4 2.0 investment -31.0% 10.1% 8.0%
exports 7.8% 6.1% 5.9%
germany 2.5 2.5 2.0
imports -9.4% 6.5% 6.5%
japan 1.7 1.2 0.9
unemployment rate 6.7% 5.7% 4.9%
china 6.9 6.6 6.4
employment 2.9% 2.3% 2.0%
india 6.7 7.4 7.8 cpi inflation 0.3% 1.0% 2.1%
source: imf, april 2018. sources: ey-dkm forecasts. e: estimate f: forecast
// 3
DUBLIN ECONOMY

       CONSTRUCTION
       SECTOR PROVIDES
       EMPLOYMENT BOOST
       IN EARLY 2018

challenges persist in the housing market with
average rents at all-time high
The upward trends observed in Dublin’s labour market at the end               “Dublin consumers became a little more cautious in the
of 2017 have continued into 2018. The unemployment rate in                    second quarter of 2018 as increased uncertainty about
the Capital now stands at 5.7%, the lowest since early 2008. The              the global economy translated into some nervousness
labour market has seen strong improvements with a further 13,200              about the outlook for jobs and a greater caution in
people employed in the Capital in the quarter to Q1 2018. There               relation to household spending plans. While the survey
are currently 685,500 people in employment in Dublin, an increase             suggests confidence has slipped somewhat of late,
of 34,500 in the year.                                                        it is important to emphasise Dublin consumers remain
    The Human Health & Social Work sector continues to register               broadly positive in their thinking on the economy and
strong growth in employment with an additional 8,700 people                   their personal finances.”
added between Q1 2017 and Q1 2018. Construction has also been
a key driver of growth in employment with an additional 16.7%              Reflecting YoY improvements in consumer sentiment there has
(4,700) employed in the year.                                              been further strong growth in retail sales in Q2 2018 as measured
    House prices in Dublin increased by a further 10.7% in May             by the Mastercard Dublin SpendingPulse. According to Michael
2018, the 12th consecutive month of double digit YoY growth.               McNamara, Global Head of SpendingPulse, .the Mastercard data
However, it does represent a slowdown in the rate of inflation with        reflects the improvements in the first quarter 2018:
YoY growth of 13.0% recorded in April 2018. Growth rates are                  "Overall the retail environment in Ireland remains solid with
equally strong outside Dublin with 14.1% YoY growth recorded.                 a 4.5% growth rate for retail sales across the country with
Pressure continues in the rental market also.                                 Dublin’s performance particularly strong at 5.2% over Q2
    In Q1 2018 the average monthly rent in Dublin was €1,527,                 2017. On the tourism side, expenditure rose 16.2% YoY
a 7.8% increase in the year. Rental growth in the Greater Dublin              with some of the most exciting growth in tourism spend is
Area (GDA) and outside of the GDA have also remained strong,                  coming from the U.S and China”
registering 6.4% and 6.6% YoY growth respectively. Data from
the CSO indicate that 1,214 houses were completed in the                   According to Dublin’s IHS Markit Purchasing Managers’ Index
Dublin region in Q1 2018. With a total 14,420 houses completed             (PMI), output continued to rise sharply in the Dublin private sector
nationally in 2017 the market is still well below the targeted 35,000      during Q2 2018. Andrew Harker, Associate Director at IHS Markit,
completions required annually to meet demand.                              notes:
    Passenger numbers on Dublin’s four public transport systems and at        “The Dublin private sector continued to perform strongly
Dublin Airport have dipped slightly in Q2 2018. Passenger arrivals at         midway through the year, with output growth ticking up
Dublin airport dipped 0.07% in the month to March 2018, although              from that seen in the opening quarter. This improvement
they rose 16,500 YoY. On Dublin’s public transport, passenger numbers         was partly due to a marked rebound in the manufacturing
are also down marginally in the quarter by 0.2%, although they are up         sector, which saw growth recover from the weather-
4.6% YoY. It is too early to say whether this represents a change in the      effected slowdown in Q1. With new order inflows and
long-running upward trend in both indicators.                                 hiring continuing apace, the Dublin economy is in a
    According to KBC/ESRI, consumer sentiment in Dublin                       good position heading into the second half of 2018.
remains in positive territory in Q2 2018 compared to one year ago.            Data suggest that strength in the Irish economy is not
However there has been a broad-based downturn in confidence                   restricted to the capital, with rates of growth in output,
relative to Q1 2018. Austin Hughes, Chief Economist at KBC Bank               new orders and employment in the Rest of Ireland only
Ireland, explains:                                                            marginally weaker than recorded in Dublin.”

4 //
DUBLIN ECONOMIC INDICATORS
DUBLIN
ECONOMIC
INDICATORS
highest quarterly increase in dublin & national unemployment rate % (sa)
employment in 10 years 18%
National Max 15.9%
16%
q1 ' 18
Dublin Max 14.2%
dublin unemployment (sa) 5.7% 14%
year on year change % points (sa) -1.0 12%
dublin employment '000s (sa) 685.4 10%
year on year change '000s (sa) +34.5
8%
source: cso labour force survey (lfs). dublin seasonally adjusted by ey-dkm.
6%
Dublin registered a boost in employment levels in Q1 2018.
QoQ the number of people employed rose by 13,200, the 4%
strongest quarterly increase in the last 10 years. In the past 2%
year 34,500 additional people became employed bringing the 0%
total number employed to 685,400 – the highest in 10 years.
Q1 09
Q3 09
Q1 10
Q3 10
Q1 11
Q3 11
Q1 12
Q3 12
Q1 13
Q3 13
Q1 14
Q3 14
Q1 15
Q3 15
Q1 16
Q3 16
Q1 17
Q3 17
Q1 18
Unemployment has also declined in the past three months with
the rate in Dublin falling to 5.7% in Q1 2018 while the rate Dublin National
nationally is only marginally higher at 5.8%.
source: cso lfs. dublin seasonally adjusted by EY-DKM
construction sector returns to employment by broad sector '000s (sa)
the fore in employment growth 800
Max:
679,400
q1 ' 18 700
services employment '000s (sa) 434.9
600
year on year change '000s (sa) +23.0
industry & constr, employment '000s (sa) 78.5 500
year on year change '000s (sa) -1.0 400
source: cso lfs, seasonally adjusted by EY-DKM.
300
Public sector employment in the Capital registered 7.8% YoY
growth in Q1 2018, with private sector growth slightly more 200
subdued in the same period at 5.6%. Following similarly strong
100
growth at the end of 2017, construction grew by 4,700 or
16.7% while Industry continues to act as a drag with a YoY 0
Q1 09 Q1 10 Q1 11 Q1 12 Q1 13 Q1 14 Q1 15 Q1 16 Q1 17 Q1 18
decline of 11.2% in the year. Across the broad sectors of Public
Private Sector Services Public sector Industry Construction
Sector, Industry and Construction employment rose by 35,300
YoY, equivalent to 5.5% annual growth.
source: cso lfs seasonally adjusted
note: individual sector values may not sum to total due to rounding
// 5
DUBLIN ECONOMIC INDICATORS
property prices exceed residential property price index (2005 = 100)
2009 levels 110
Dublin Max 104.6
may ' 18 100
property price index dublin 104.6
year on year % change +10.7 90
property price index national excl dublin 96.3
80
year on year % change +14.1
source: cso.
note: this index includes both cash- and mortgage-based transactions. 70
Dublin’s residential property prices continue to register double 60
digit YoY growth in May 2018. The property price index in
50
Dublin now stands at 104.6, a 10.7% increase on the level
recorded in 12 months previously. While the rate of YoY 40
growth has moderated compared to April prices (up 13.7%
May 09
May 10
May 11
May 12
May 13
May 14
May 15
May 16
May 17
May 18
Nov 09
Nov 10
Nov 11
Nov 12
Nov 13
Nov 14
Nov 15
Nov 16
Nov 17
YoY) it does little to alleviate the pressures in the housing
market. Nationally (excl. Dublin) there was 14.1% YoY growth Dublin National excl. Dublin
in prices in May 2018. source: cso.
average dublin rents just shy residential rents € per month
of €1,530 in q1 2018 €1,550
Dublin Max: €1,527
€1,450
q1 ' 18
€1,350
dublin avg residential rent € per month 1,527
€1,250
year on year change € +111
source: rtb. €1,150
€1,050
Residential rents in Dublin show no signs of abating as YoY
€950
growth of 7.8% was recorded in Q1 2018. On a quarterly basis
€850
rents have declined marginally in the Greater Dublin Area
(GDA) by 0.7% but when compared to 12 months previous, €750
rents have increased by 6.4% YoY. While growth rates beyond €650
the GDA have tapered slightly since Q4 2017, YoY growth €550
Q3 09
Q1 10
Q3 10
Q1 11
Q3 11
Q1 12
Q3 12
Q1 13
Q3 13
Q1 14
Q3 14
Q1 15
Q3 15
Q1 16
Q3 16
Q1 17
Q3 17
Q1 18
rates of 6.6% and average rents of close to €800 per annum
were recorded in Q1 2018.
Dublin Greater Dublin Area (excl. Dublin) Outside GDA
source: rtb. note: gda (ex dublin) is kildare, meath and wicklow.
housing completions dublin housing commencements & completions
up 15% yoy in q1 2018 2,400
Commencements Max: 2,196
2,200
q1 ' 18
2,000
total house commencements 1,433 Completions Max: 1,758
1,800
year on year change -32
1,600
total house completions 1,214
1,400
year on year change 161
1,200
source: cso. note: data is not seasonally adjusted
1,000
New housing completions data from the CSO indicates that 800
1,214 houses were completed in Dublin in Q1 2018, an 600
increase of 161 completions, or 15.3%, on Q1 2017, and 400
represents the 11th quarter in a row of positive YoY growth in 200
housing completions. Over that period, since Q3 2015, a total 0
of 3,900 houses have been completed in Dublin. The level of
Q1 11
Q3 11
Q1 12
Q3 12
Q1 13
Q3 13
Q1 14
Q3 14
Q1 15
Q3 15
Q1 16
Q3 16
Q1 17
Q3 17
Q1 18
commencements remain volatile, down 2.2% YoY and 12.6%
QoQ and stands at 1,433 in Q1 2018. Completions Commencements
source: cso.
6 //
DUBLIN ECONOMIC INDICATORS
office rents unchanged dublin office rents index (2006 = 100)
in q2 2018 130
City Centre Max = 118.2
120
q2 '18 South Suburbs Max = 114
city centre office rent index 118.2 110
year on year % change +4.0 100
south suburbS office rent index 114.0
90
year on year % change +3.6
source: CBRE 80
70
Office rents in Dublin’s city centre and south suburbs stabilised
in Q2 2018 with rents in both districts remaining unchanged 60
QoQ. YoY growth rates also remain unchanged with city centre 50
rents increasing a further 4% and rents in the south suburbs
40
increasing by 3.6% in the 12 months since Q2 2017. Average
Q2 08
Q4 08
Q2 09
Q4 09
Q2 10
Q4 10
Q2 11
Q4 11
Q2 12
Q4 12
Q2 13
Q4 13
Q2 14
Q4 14
Q2 15
Q4 15
Q2 16
Q4 16
Q2 17
Q4 17
Q2 18
rents in both areas are now approximately 4% higher than they
were 10 years ago in Q2 2008. City Centre South Suburbs
source: cbre.
vacancies in dublin's suburbs dublin office space vacancy rates %
continue to decline yoy 30%
Dublin Suburbs Max = 25%
q2 '18 25%
Dublin 2/4 Max = 20.6%
vacancy rate % dublin 2/4 5.5
year on year change % points +0.5 20%
vacancy rate % dublin suburbs 8.6
year on year change % points -1.1 15%
source: cbre.
10%
After declining in Q1 2018, overall office vacancy in Dublin
increased very slightly in Q2 2018 to 6.2% from 5.9% last 5%
quarter. In Dublin 2/4 the vacancy rate has increased on both
a quarterly and annual basis, at 0.3% and 0.5% respectively. 0%
Q2 09
Q4 09
Q2 10
Q4 10
Q2 11
Q4 11
Q2 12
Q4 12
Q2 13
Q4 13
Q2 14
Q4 14
Q2 15
Q4 15
Q2 16
Q4 16
Q2 17
Q4 17
Q2 18
Similarly the vacancy rate in Dublin’s suburbs rose 0.7% QoQ
in Q2 2018 although a decline of 1.1% was recorded over the
year from Q2 2017. The public sector accounted for 36% of Dublin 2/4 Dublin Suburbs
suburban take-up in Q2. source: cbre.
public transport passenger public transport million trips (sa)
numbers remain stable in q1 2018 60
q1 '18
50
public transport million trips (sa) 53.9
year on year change million trips (sa) +2.4
40
source: nta seasonally adjusted by EY-DKM.
Total passenger trips in Dublin fell marginally in Q1 2018 by 30
0.2%, the first QoQ decline since Q2 2016. While passenger
numbers using Bus Éireann and Dublin Bus were down 20
slightly in the quarter, the greatest increase in trips occurred
on the LUAS which saw a 3.8% QoQ increase in Q1 2018, 10
the first quarter in which the LUAS cross-city was fully
operational. A total 53.9 million passengers used Dublin’s 0
four main transport systems in Q2 2018, up 4.6% YoY. Q1 15 Q2 15 Q3 15 Q4 15 Q1 16 Q2 16 Q3 16 Q4 16 Q1 17 Q2 17 Q3 17 Q4 17 Q1 18
Bus Éireann Dublin Bus Irish Rail Luas
source: nta. seasonally adjusted by ey-dkm
note: this series has been re-calibrated since the last issue
// 7
DUBLIN ECONOMIC INDICATORS
passenger arrivals at dublin airport dublin airport arrivals '000s (sa)
up in the year to march 2018 1,350
Max: 1,251
mar '18 1,250
total arrivals '000s (SA) 1,217.4 1,150
year on year change '000s (sa) +16.5
1,050
source: cso, seasonally adjusted by ey-dkm.
note: this series has been re-calibrated since the last issue
950
Passenger arrivals at Dublin Airport dipped slightly in March
850
2018 with 1.217 million (SA) passengers compared to
February figures of 1.218 million, representing a decline of 750
0.07% in the month. Despite the marginal decline recorded 650
Severe Winter Weather
in the month, there was an increase of 16,500 passengers Icelandic Ash Cloud
550
compared to March 2017. Passenger numbers may be given a
Nov 08
Jul 09
Mar 10
Nov 10
Jul 11
Mar 12
Nov 12
Jul 13
Mar 14
Nov 14
Jul 15
Mar 16
Nov 16
Jul 17
Mar 18
boost in the second half of the year with the introduction of
Dublin’s first direct services to Beijing and Hong Kong in June
2018. source: cso. seasonally adjusted by EY-DKM.
Note: this series has been re-calibrated since the last issue.
record throughput at dublin dublin port tonnage million tonnes (sa)
port in q2 2018 10.0
Max: 9.6 million tonnes
9.5
q2 ' 18
dublin port exports million tonnes (sa) 3.94 9.0
yoy change million tonnes (sa) 0.28 8.5
dublin port imports million tonnes (sa) 5.66
8.0
yoy change million tonnes (sa) 0.34
7.5
Source: Dublin Port. Seasonally Adjusted by EY-DKM.
Note: imports and exports may not add to total throughput due to seasonal
adjustment and rounding. 7.0
6.5
Total cargo handled at Dublin Port exceeded 9.6 million tonnes Min: 6.4 million tonnes
(seasonally adjusted) in Q2 2018 for the first time in the 10 6.0
year period analysed. Just over 9.6 million tonnes of cargo was 5.5
handled in the port in Q2 2018, equivalent to a 7.0% YoY
Q2 09
Q4 09
Q2 10
Q4 10
Q2 11
Q4 11
Q2 12
Q4 12
Q2 13
Q4 13
Q2 14
Q4 14
Q2 15
Q4 15
Q2 16
Q4 16
Q2 17
Q4 17
Q2 18
increase. The level of imports and exports through the Port
continues on a positive trend with YoY growth of 6.4% and source: dublin port. seasonally adjusted by ey-dkm.
7.8% respectively. note: this series has been re-calibrated since the last issue.
dublin hotel rates surpass dublin hotel average daily rates (sa)
2015 peak levels €150
Maximum: €145
jun ' 18
€140
hotel occupancy rate % (sa) 83.5%
year on year change %age point +0.3
€130
index of hotel room supply (sa, july 2013=100) 105.5
year on year change % 1.3%
€120
source: str global. seasonally adjusted by ey-dkm.
note: this series has been re-calibrated since the last issue.
€110
Average Daily Rates (ADR) for hotel accommodation in Dublin
reached a new high in May 2018 at €145, a 9.5% YoY increase
€100
and the strongest YoY increase in ADR since December 2016.
The daily rate has remained unchanged in June 2018. A 41%
€90
increase in ADR over the past three years is likely linked to
Aug 15
Dec 15
Feb 16
Aug 16
Dec 16
Feb 17
Aug 17
Dec 17
Feb 18
Jun 15
Oct 15
Apr 16
Jun 16
Oct 16
Apr 17
Jun 17
Oct 17
Apr 18
Jun 18
modest growth in room supply which increased by 6.3% in the
same period. Fáilte Ireland indicate that approximately 5,400 source: str. seasonally adjusted by EY-DKM.
Dublin hotel rooms are in the pipeline out to 2020. note: this series has been re-calibrated since the last issue.
8 //
A u g u st 2 0 1 8
DUBLIN
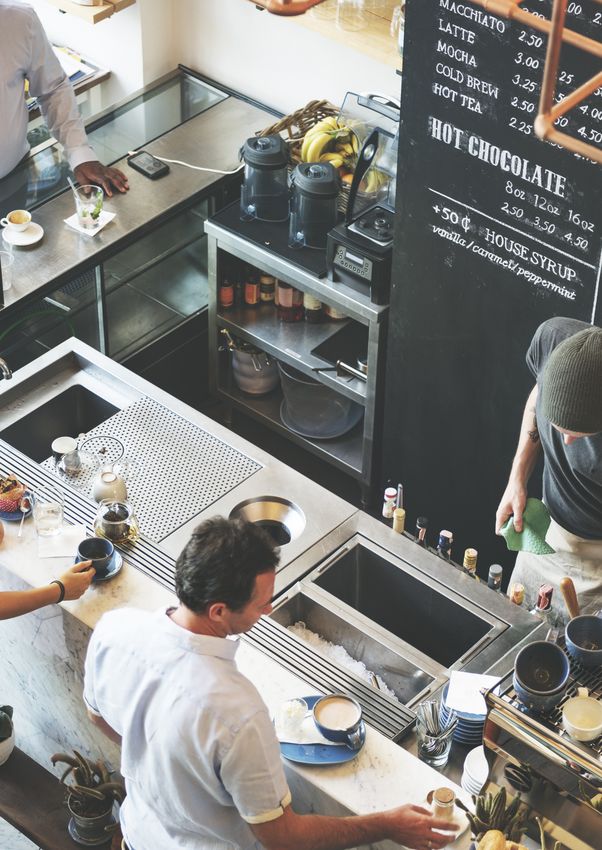
Mastercard SpendingPulse
TM
Dublin Mastercard SpendingPulse Delivering Unique
Insights for Consumer and Tourism Spend.
KEY HIGHLIGHTS YEAR-ON-YEAR Q2 2018*
+5.2%
OVERALL
+16.2%
OVERSEAS
SALES TOURISM SPEND
+7.6% +7.0% +9.1% +6.4%
NECESSITIES DISCRETIONARY HOUSEHOLD GOODS ENTERTAINMENT
*RETAIL SALES VALUE (SA)
+11.9%
ECOMMERCE
TM
DUBLIN Mastercard SpendingPulse                        | August 2018

TOTAL RETAIL SPEND IN DUBLIN
OUTPERFORMS THOSE NATIONALLY
                                                             TOTAL RETAIL SALES INDEX (SA)
                                                                                                                                                                 117
       120                                                                                                                                                       +5.2%
                                                                                                                                                                  YoY

       115

                                                                                                                                                                         115
       110                                                                                                                                                           +4.5%
                                                                                                                                                                      YoY

       105

       100

         95
              Q1 14

                      Q2 14

                                Q3 14

                                        Q4 14

                                                     Q1 15

                                                             Q2 15

                                                                     Q3 15

                                                                               Q4 15

                                                                                          Q1 16

                                                                                                  Q2 16

                                                                                                          Q3 16

                                                                                                                  Q4 16

                                                                                                                          Q1 17

                                                                                                                                     Q2 17

                                                                                                                                             Q3 17

                                                                                                                                                      Q4 17

                                                                                                                                                                 Q1 18

                                                                                                                                                                           Q2 18
                                                                             DUBLIN                    IRELAND

Consumer spending in the Dublin economy registered in excess
of 5% YoY growth in the first two quarters of 2018. Overall
expenditure increased by 5.2% YoY and by 1.3% QoQ in Q2                                               Overall the retail environment in Ireland remains
2018. Total sales in Dublin are now 17.1% higher than Q1                                            solid with 4.5% growth for retail sales across the
2014 levels, reflecting a strong upward trend in a strengthening
                                                                                                       country. Dublin‘s performance was particularly
Dublin Economy.
                                                                                                      strong at a 5.2% increase over Q2 2017. On the
Nationally (including Dublin), growth in total sales were not as                                    tourism side, some of the most exciting growth in
strong as in Dublin but continue to maintain a strong upward                                         tourism spend is coming from the U.S and China.
trend in Q2 2018 with YoY growth of 4.5%. On a quarterly                                            The only area of struggling growth is from the UK,
basis, expenditure nationally (including Dublin) registered                                                with negative growth continuing into 2018.
growth of 1.2%. At both a national and Dublin level, both YoY
and QoQ growth rates in Q2 2018 were at their strongest levels                                                                                                Michael McNamara
since the series began in Q1 2014.                                                                                                GLOBAL HEAD OF SPENDING PULSE, MASTERCARD

                                                DUBLIN RETAIL SALES VALUE INDEX (SA)

                  +5.19%      Q2 2018
                                                                                117.1  100 = Q1 2014
                                                                                                                                      +1.3%     QOQ

                   YOY GROWTH                                                  DUBLIN SALES                                        QOQ GROWTH
              IN DUBLIN SALES INDEX                                             INDEX VALUE                                   IN DUBLIN SALES INDEX

  METHODOLOGY
  A macro-economic indicator, SpendingPulse™ reports on national and Dublin retail sales and is based on aggregate sales activity in the Mastercard
  payments network, coupled with estimates for all other payment forms, including cash and cheque. This information has been grossed up to present
  an estimate of the total retail sales of retail businesses in Ireland and Dublin to both residents and tourists. Data is seasonally adjusted but is not
  adjusted for inflation. Mastercard SpendingPulse™ does not represent Mastercard financial performance. SpendingPulse™ is provided by Mastercard
  Advisors, the professional services arm of Mastercard International Incorporated. See www.dublineconomy.ie for more info on methodology.

                                                                                             2
TM
DUBLIN Mastercard SpendingPulse | August 2018
METHOD: ECOMMERCE SPENDINGPULSE:
180
170
171
+11.9%
SELECTED SUB-SECTORS
YoY
160 Dublin Consumer Spending in Q2 2018 was positively influenced
150 by growth in each of the four main sectors covered in the
Mastercard SpendingPulse. Each category of spending registered
140
154 in excess of 5% YoY growth in the quarter. Expenditure via
+14.1%
130
YoY eCommerce increased by 11.9% YoY, the lowest YoY increase
120 since Q1 2017.
110
Growth in the sale of household goods was particularly high
100 at 9.0% nationally (including Dublin) and 9.1% in Dublin,
90 signifying continued confidence and willingness by consumers
Q1 14
Q2 14
Q3 14
Q4 14
Q1 15
Q2 15
Q3 15
Q4 15
Q1 16
Q2 16
Q3 16
Q4 16
Q1 17
Q2 17
Q3 17
Q4 17
Q1 18
Q2 18
to spend on significant household items. Nationally, retail sales
via eCommerce were equally strong at 14.1% however the
IRELAND DUBLIN overall level continues to be eclipsed by that observed in Dublin.
Non store Retailers including Electronic Shopping and Mail-Order Houses,
Direct Selling Establishments.
RETAIL CATEGORY: DISCRETIONARY RETAIL CATEGORY: NECESSITIES
125 125
120 120
+7.0% +7.6%
120 YoY 120 YoY
115 115
116
110 +3.4% 110
YoY
112
105 105 +2.5%
YoY
100 100
95 95
Q1 14
Q2 14
Q3 14
Q4 14
Q1 15
Q2 15
Q3 15
Q4 15
Q1 16
Q2 16
Q3 16
Q4 16
Q1 17
Q2 17
Q3 17
Q4 17
Q1 18
Q2 18
Q1 14
Q2 14
Q3 14
Q4 14
Q1 15
Q2 15
Q3 15
Q4 15
Q1 16
Q2 16
Q3 16
Q4 16
Q1 17
Q2 17
Q3 17
Q4 17
Q1 18
Q2 18
IRELAND DUBLIN IRELAND DUBLIN
Discretionary Retail: Department Stores and Clothing Stores. Grocery: all food and beverage stores.
RETAIL CATEGORY: ENTERTAINMENT RETAIL CATEGORY: HOUSEHOLD GOODS
140 137 160
149
+6.4%
YoY +9.1%
150 YoY
130
140
128
120
+3.2%
YoY
130
142
+9.0%
YoY
120
110
110
100
100
90 90
Q1 14
Q2 14
Q3 14
Q4 14
Q1 15
Q2 15
Q3 15
Q4 15
Q1 16
Q2 16
Q3 16
Q4 16
Q1 17
Q2 17
Q3 17
Q4 17
Q1 18
Q2 18
Q1 14
Q2 14
Q3 14
Q4 14
Q1 15
Q2 15
Q3 15
Q4 15
Q1 16
Q2 16
Q3 16
Q4 16
Q1 17
Q2 17
Q3 17
Q4 17
Q1 18
Q2 18
IRELAND DUBLIN IRELAND DUBLIN
Hotels, restaurants and bars. Household furniture, electronics and hardware.
3TM
DUBLIN Mastercard SpendingPulse | August 2018
TOURISM RETAIL SPEND INDEX: US AND FRENCH
MARKETS CONTINUE TO DRIVE GROWTH
Tourist expenditure in the Dublin economy grew by 16.2% Similar trends are observed nationally (including Dublin) though
YoY in Q2 2018. Growth in the quarter was predominantly the rate of decline in spending by UK tourists is lower than that
driven by growth in the US market of 16.8% and 15.2% in recorded in Dublin. Following no growth in Q3 2017, there
the French market (seasonally adjusted) With YoY growth in have been two consecutive quarters of negative YoY growth
the Chinese market of 14.1% this marks the second quarter nationally (including Dublin) in UK tourist spending. Similarly, on
of positive growth YoY growth following seven consecutive a quarterly basis, the rate of expenditure by UK tourists has been
quarters of negative YoY growth. Meanwhile, the UK market is on the decline since Q3 2017.
the only market of the five included in the analysis that recorded
a negative YoY growth rate in Q2 2018. This represents the Overall, growth of 11% YoY in tourist spending was recorded
fifth quarter in a row where negative YoY growth has been nationally (including Dublin) in Q2 2018, slightly lower than
recorded. Notably, the rate of decline is also increasing, both in Dublin. The US and French markets are the key drivers of
YoY and QoQ. For example, in Q2 2018 spending by UK tourists this growth, growing at 15.5% and 18.4% respectively. Both
fell 4.7% YoY and 1.6% QoQ compared to Q2 2017 when the German and Chinese markets continue to perform well
spending dropped 0.6% both YoY and QoQ. This is in spite of with two consecutive quarters of double digit YoY growth. In
a recovery the number of UK tourists traveling to Ireland in the the Chinese market tourism spending grew 4.4% QoQ in Q2
year to May 2018, up approximately 7% (Fáilte Ireland). 2018 representing a slowdown from the 10.1% QoQ growth
recorded in Q1 2018.
DUBLIN AND IRELAND TOURIST SPEND BY ORIGIN - Q2 2018 (SA)
OVERALL
+11.0% +16.2%
YOY OVERALL YOY OVERALL
-1.3% -4.7%
YOY CHANGE YOY CHANGE
+15.5% +16.8%
YOY CHANGE YOY CHANGE
INCREASE IN TOURSIM INCREASE IN TOURSIM IN SPENDING IN IN SPENDING IN IN SPENDING IN IN SPENDING IN
SPEND IN IRELAND SPEND IN DUBLIN
IRELAND DUBLIN IRELAND DUBLIN
+15.3% +4.8%
YOY CHANGE YOY CHANGE
+18.4% +15.2%
YOY CHANGE YOY CHANGE
+12.6% +14.1%
YOY CHANGE YOY CHANGE
IN SPENDING IN IN SPENDING IN IN SPENDING IN IN SPENDING IN IN SPENDING IN IN SPENDING IN
IRELAND DUBLIN IRELAND DUBLIN IRELAND DUBLIN
IRELAND TOURISM SPEND SALES INDEX (SA) DUBLIN TOURISM SPEND SALES INDEX (SA)
Q1 2014 = 100 Q1 2014 = 100
200 200
190 190
180 180
171.0
170 158.2 170
160 160
150 150
140 140
130 130
120 120
110 110
100 100
All UK USA Germany France China All UK USA Germany France China
Q2 2015 Q2 2016 Q2 2015 Q2 2016
Q2 2017 Q2 2018 Q2 2017 Q2 2018
4DUBLIN’S INTERNATIONAL RANKINGS
MIXED PERFORMANCE
IN DUBLIN'S RANKINGS
Internationally published benchmarks Dublin meanwhile is ranked 6th for global ranking of EMBA programmes, a 15
are a useful means of measuring a city’s commercial real estate investment in Savills place improvement over the 2017 ranking.
performance relative to its peers, and recent 2018 ‘Dynamic Cities’ index. The index, UCD’s Michael Smurfit Graduate School of
indicators for Dublin confirm the city’s which ranks 130 European cities across Business is the only other Irish programme
strong showing across a range of dimensions categories of infrastructure, inspiration, listed, in 59th position.
(see table below). inclusion, interconnection, investment Despite this, the annual QS World
In Mercer’s 24th annual Cost of Living and innovation, cited Dublin’s continuing University Ranking for 2018 no longer has an
Survey Dublin has moved up 34 places to emergence as a financial hub as the key reason Irish university in the Top 100 ranking. Trinity
from 66th to 32nd position, overtaking Paris for the observed improvement from its 7th College – previously the only university in the
to make it the most expensive city in the position ranking in 2017. country in the Top 100 – has slipped to 104th
Eurozone to live in for expatriate employees. Dublin’s ranking in the IESE Cities in position from 88th, based on indicators such
Mercer Ireland Consultant, Noel O’Connor Motion Index 2018 remains unchanged in as staff-to-student ratio, academic reputation
commented: 30th position. The city ranks high in terms of and employer reputation.
“The survey identifies cost pressures the economy and technology but aspects such Ireland has fallen six places in the 2018
on expatriate rental accommodation as mobility and transportation act as a drag on IMD World Competitiveness Ranking,
in Dublin as the key driver of this the overall ranking. New York, London and leaving it now outside the Top 10. The
[increase] and this in turn reflects the Paris take the top three positions, respectively. ranking captures how competitive a country
growth of the economy with continuing Trinity College Dublin’s Executive MBA is based on indicators such as employment,
high levels of foreign direct investment.” (EMBA) is listed 44th in The Economist’s trade and business perception.
d u b l i n ' s l at e s t i n t e r n at i o n a l r a n k i n g s
SOURCE BENCHMARK CRITERIA YEAR RANKING CHANGE‡
Infrastructure, inclusion, interconnection,
Savills ‘Dynamic Cities’ Ranking
investment and innovation
2018 6 ▲
Personal development, educational experience
The Economist Executive MBA Ranking
and career development
2018 44* ▲
fDi Intelligence Reinvesting Ranking 2018 Attracting expansion and co-location projects 2018 4 -
Governance, urban planning, technology,
the environment, international outreach,
IESE Cities in Motion Index
social cohesion, human capital, mobility and
2018 30 -
transportation, and economy
Regulatory, market and business/labour
landscape, external and internal openness,
Global Talent Competitiveness Index
education and access to growth opportunities
2018 7 -
and, sustainability and lifestyle
IMD World Competitiveness Yearbook Rankings Economic performance, government efficiency,
(Ireland) business efficiency & infrastructure
2018 12 ▼
Mercer 2018 Cost of Living Survey Cost of consumer goods and services 2018 32 ▼
Mercer 2018 Quality of Living Survey Environmental/socio-economic 2018 34 -
QS World University Rankings University quality 2018 104* ▼
Growth and development, inclusion,
World Economic Forum Inclusive Development Index
intergenerational equity and sustainability
2018 8 ▲
The Economist Intelligence Unit Worldwide Cost of Price comparison across 160 products and
Living 2018 services
2018 19 ▼
fDi Intelligence Global Cities and Regions of the Future Socio-economic indicators 2018 2 ▲
Business environment, financial sector
Global Financial Centres Index (GFCI) development, infrastructure, human capital, 2018 31 ▼
reputational & general factors; online survey
* tcd. ‡change on previous publication of the relevant benchmark. an upward-pointing arrow denotes an improvement.
// 9KBC / ESRI CONSUMER SENTIMENT INDEX
consumer sentiment slips in q2 Dublin sentiment overall
Base 2003 = 100
180
National excl Dublin Max 167.2
National Dublin Max 159.8
consumer sentiment dublin excl. dublin 160
q2 2018 154.2 160.4
140
year on year change +3.7 +3.1
quarter on quarter change -3.4 -6.8 120
100
YoY, the overall Dublin Consumer Sentiment Index increased by
3.7 index points, rising by 3.1 index points outside of Dublin.
80
Although sentiment remains strongly positive, the recent
quarterly fall across regions signals a shake to confidence. Poorer 60
outlooks for the general economy and unemployment combined
with a lesser appetite for major household purchases were the 40
Q2 08
Q4 08
Q2 09
Q4 09
Q2 10
Q4 10
Q2 11
Q4 11
Q2 12
Q4 12
Q2 13
Q4 13
Q2 14
Q4 14
Q2 15
Q4 15
Q2 16
Q4 16
Q2 17
Q4 17
Q2 18
main drivers across both regions. However, while respondents
outside of Dublin reported deteriorations in financial
circumstances, those in Dublin signalled a modest improvement. Dublin National excl. Dublin
Dublin current conditions
slowdown in current
conditions in q2 140
Base 2003 = 100
National excl Dublin Max 133.9
National 130
current conditions dublin excl. dublin Dublin Max 125.2
120
q1 2018 114.8 128.1
year on year change +0.6 +0.6 110
quarter on quarter change -3.1 -5.8 100
90
The Index of Current Conditions in the Dublin region fell by 3.1
index points QoQ in Q2 2018 relative to outside Dublin falling by 80
5.8 index points. This led to a contraction in the spread between the 70
two regions, though those outside of Dublin generally reflect greater
60
levels of satisfaction. Similarly to the overall index, regions outside
of Dublin saw a greater decline due to increased dissatisfaction with 50
Q2 08
Q4 08
Q2 09
Q4 09
Q2 10
Q4 10
Q2 11
Q4 11
Q2 12
Q4 12
Q2 13
Q4 13
Q2 14
Q4 14
Q2 15
Q4 15
Q2 16
Q4 16
Q2 17
Q4 17
Q2 18
current financial situations. On an annual basis, conditions have
only slightly improved in both regions. Dublin National excl. Dublin
q2 consumer expectations Dublin expectationS
weaken Base 2003 = 100
230
Dublin Max 211.1
National
consumer expectations dublin excl. dublin 210
National excl Dublin Max 200.6
190
q1 2018 197.0 191.3
year on year change +7.1 +5.4 170
quarter on quarter change -3.7 -7.8 150
130
For Q2 2018, both regions saw lower YoY improvements in
110
consumer expectations, with expected gains for the general
90
economy fueling Dublin's confidence while expectations of jobs
growth grew outside of Dublin. Between quarters, attitudes 70
weakened both in terms of expected personal finance and 50
macroeconomic performance. Dublin experienced moderate 30
Q2 08
Q4 08
Q2 09
Q4 09
Q2 10
Q4 10
Q2 11
Q4 11
Q2 12
Q4 12
Q2 13
Q4 13
Q2 14
Q4 14
Q2 15
Q4 15
Q2 16
Q4 16
Q2 17
Q4 17
Q2 18
upward revisions to personal finances while reducing expectations
for the wider economy. Outside Dublin, both personal and wider
economic forecasts saw modest downward revisions. Dublin National excl. Dublin
About
The KBC/ESRI sentiment index is based on responses from consumers about general economic conditions
and their household finances. A more detailed commentary is available at www.kbc.ie/blog
10 //DUBLIN IHS MARKIT PMI
dublin output growth overall ihs markit pmi (sa)
accelerates in q2 65
50 = no change increasing rate of growth ▲
national 60
overall ihs markit pmi dublin excl. dublin
55
q2 2018 58.5 58.3
year on year change -0.9 +1.0 50
quarter on quarter change +0.6 -0.3
45
Output continued to rise sharply in the Dublin private sector 40
during the second quarter of 2018, extending the current
sequence of growth to 23 quarters. The Dublin PMI ticked up 35
to 58.5 in Q2 from 58.0 in the opening quarter of the year. 30
The rise in activity in Dublin was broadly in line with that increasing rate of contraction ▼
25
recorded across the Rest of Ireland. All three monitored sectors
Q2 01
Q2 02
Q2 03
Q2 04
Q2 05
Q2 06
Q2 07
Q2 08
Q2 09
Q2 10
Q2 11
Q2 12
Q2 13
Q2 14
Q2 15
Q2 16
Q2 17
Q2 18
saw output increase sharply, with growth led by construction.
The manufacturing sector saw the rate of expansion rebound
following weather-related disruption in Q1. Dublin National excl. Dublin
new orders continue to overall pmi new orders (sa)
rise sharply 65
50 = no change increasing rate of growth ▲
national 60
new orders dublin excl. dublin
55
q2 2018 58.8 58.1
year on year change 0.0 +0.4 50
quarter on quarter change -1.2 -0.2
45
New orders rose again during Q2, continuing the trend seen 40
since the final three months of 2012. The rate of growth
remained sharp despite easing marginally from the previous 35
month, with the latest increase well above the series average. The 30
Rest of Ireland also saw new business rise at a strong pace in the increasing rate of contraction ▼
25
second quarter, but at a slightly weaker rate than in Dublin.
Q2 01
Q2 02
Q2 03
Q2 04
Q2 05
Q2 06
Q2 07
Q2 08
Q2 09
Q2 10
Q2 11
Q2 12
Q2 13
Q2 14
Q2 15
Q2 16
Q2 17
Q2 18
Dublin National excl. Dublin
employment rises at marked, overall pmi employment growth (sa)
but slower pace 65
50 = no change increasing rate of growth ▲
national 60
employment growth dublin excl. dublin
q2 2018 56.9 56.0 55
year on year change +2.1 +0.7
50
quarter on quarter change -1.6 -1.2
45
Dublin companies continued to increase their staffing levels
40
during the second quarter of the year, extending the current
period of job creation to 23 quarters. The pace at which 35
employment rose eased from the previous quarter, but remained
30
marked. The Rest of Ireland also posted a weaker increase in increasing rate of contraction ▼
staffing levels in Q2, and one that was slower than that seen in 25
Q2 01
Q2 02
Q2 03
Q2 04
Q2 05
Q2 06
Q2 07
Q2 08
Q2 09
Q2 10
Q2 11
Q2 12
Q2 13
Q2 14
Q2 15
Q2 16
Q2 17
Q2 18
Dublin.
Dublin National excl. Dublin
about
The Dublin Purchasing Managers’ Index® (PMI) series is produced by IHS Markit Economics,
an independent research company that produces highly-regarded surveys of business
conditions in nations around the world www.markit.com
// 11SANDYFORD BUSINESS DISTRICT
SANDYFORD
BUSINESS DISTRICT
BY SHARON SCALLY
DIRECTOR/CHAIRPERSON SANDYFORD
BUSINESS IMPROVEMENT DISTRICT CLG
Driving innovation in east Dublin’s global business quarter and aiming to become
the Sandyford Innovation District by 2021
Sandyford Business District (SBD) comprises four Business
“ Onebenefits
Parks (Central Park, Sandyford Business Park, South County
Business Park and Stillorgan Business Park) and is bordered by the
Leopardstown Racecourse & Naomh Olaf GAA Grounds. With its
readily accessible location, highly educated workforce and proven
of the major
track record for key industry sectors, the SBD is a prime location for
SMEs and multinational companies alike.
of the
Located in the east of the Dublin region, Sandyford Business
District is a vibrant mix of established communities, young families Sandyford Business
and business, with a total workforce of approx. 25,000 in 1,000
companies. It is well serviced by a modern light rail system (LUAS)
to the City and by the M50 road network to the rest of the country.
Improvement District
This accessibility and strategic positioning has been a key factor
in attracting a large number of high profile businesses including;
(BID) to its members is
Microsoft, Google, Sage, Vodafone, Mastercard, Salesforce, Bank of
America Merrill Lynch, SSE Airtricity, and Ardagh Group.
Although currently well provided for, imminent development
that they can utilise the
plans include 600 new apartments and the new Nord Anglia
International School for 800 students opening in September 2018
company to engage
which further strengthens the fabric of the community for working
families and its attractiveness to employers. with the Council on
THE SANDYFORD BUSINESS IMPROVEMENT DISTRICT
COMPANY
their behalf and identify
Business Improvement Districts (BIDs) involve local businesses,
forming a company that is funded directly by them and charged areas of improvement
within the district.”
with identifying and implementing key projects which aim to make
material improvements for those working and living in an area.
In October 2016, Sandyford BID CLG (SBID) was established
(www.sandyford.ie).
12 //“ The Smart District
Initiative has helped
to focus our resources
specifically on the
challenges facing the
area and has assisted
in developing
innovative solutions to
SBID is made up of a highly motivated Board of Directors, drawn
from the business community, and representatives of Dún Laoghaire-
meet the needs of the
Rathdown County Council (DLRCoCo) with over 60 companies
participating on its six Task Forces to develop solutions around key people and business
in Sandyford.”
areas, namely: Business Attraction, Infrastructure, Marketing and
Events, Smart Innovation, Saving & Benefits & Wellbeing.
No company is successful without a good team behind it and
SBID is led by its new District Director Fiona Fitzpatrick and Philomena Poole,
supported by an Office Manager, Event Manager and Innovation Chief Executive, DLCCo.Co.
Champion to assist with growing and promoting Sandyford as a
smart destination to live, work and invest.
Collaboration and networking are key elements of a successful
Business Improvement District and members are invited to a
THE MISSION OF SANDYFORD
broad range of networking and signature events which include; the BUSINESS DISTRICT IS TO CREATE
Sandyford Business District Awards, Sandyford Spirit 5k run &
Wellness week, €10 million breakfast, Sandyford Innovation Forum,
AND PROMOTE THE AREA AS:
Sandyford Summer BBQ along with monthly networking meet- A world-class destination in which
ups. These events are critical to developing a sense of ownership for to work and reside.
participants in the district.
A vibrant community of businesses
SANDYFORD SMART DISTRICT and residents with a unique identity.
Sandyford was officially launched as a “SMART District” by
A place where living, working,
DLRCoCo in May 2018. To advance the level of collaboration,
innovation and specialist talent development, SMART Sandyford shopping and spending leisure time is
manages a series of morning meet-ups and lunchtime briefings, attractive, easy and positive.
inviting key speakers from multinationals, SMEs and start-ups.
The district is also very engaged on SMART Travel initiatives
in collaboration with DLRCoCo. Significant investment will
made to promote smarter travel in cycle routes, improved
pedestrian routes and crossings. Traffic management measures THE SANDYFORD INNOVATION DISTRICT:
will also be designed to manage traffic flows in the district. Seeking to build on the success of its experience with SBID and
(http://www.sandyfordsmartertravel.ie) the Smart District initiative, the team is planning on developing
Working with DLRCoCo, substantial success has been achieved a Sandyford Innovation District in the coming years. Innovation
with an investment of over €150,000 in landscaping and herbaceous districts constitute best practice in terms of placemaking and clusters,
boarders within the district including a pocket park on Bracken combining the best of entrepreneurs, educational institutions, start-
Road. Looking forward, a public park with amenities for the district ups, schools and mixed-use development and public infrastructure
will commence in the coming months. Further improvements to all connected by sustainable transit, like bike share and trams,
roads and infrastructure will commence in October and plans are powered by clean energy and wired for digital technology. This
well underway for a new signage scheme which will bring uniformity combination of collaboration, innovation and entrepreneurship
and identity to the district. makes Sandyford one to watch and a smart place to invest.
// 13SPECIAL REPORT
DUBLIN BAY BIOSPHERE TURNS
UNESCO DESIGNATION
INTO AN OPPORTUNITY FOR
SUSTAINABLE BUSINESS
BY LES MOORE
HEAD OF PARKS SERVICES DUBLIN CITY COUNCIL AND
CHAIR OF THE DUBLIN BAY BIOSPHERE PARTNERSHIP
International recognition for Dublin Bay Biosphere offers a way to promote Dublin’s natural
heritage together with the growth of local sustainable tourism.
On the 24th June 2015, the then Minister for Jobs, Enterprise and While biospheres are recognised for their ecological diversity, they
Innovation Richard Bruton TD, welcomed the announcement that are managed to promote a balanced relationship between people and
Dublin Bay had been awarded by UNESCO the designation of nature and this goal is fulfilled through conservation, learning and
Biosphere reserve, in recognition of its unique ecological status and development initiatives. Biosphere Discovery Tour Guides delivered
cultural heritage. Minister Bruton stated “UNESCO’s decision to tours to almost 11,800 passengers in 2017, including a Spring
award Biosphere status recognises the international importance of programme of school tours. This ecotourism initiative provides
the biodiversity and habitats in Dublin Bay." employment and enables visitors and locals alike to experience
The UNESCO recognition prises the successful partnership Dublin Bay and its fascinating wildlife and cultural heritage
established between Dublin City Council, Dún Laoghaire- firsthand. As a unique hallmark, Dublin Bay Biosphere Reserve
Rathdown County Council, Fingal County Council, Dublin Port encompasses not just the marine but also terrestrial areas, opening
Company and The Department of Culture, Heritage and the a further range of opportunities for the local green and sustainable
Gaeltacht. Failte Ireland are also now a partner as the UNESCO tourism market.
recognition of Dublin Bay dovetails with their strategy to reposition Around Dublin Bay there is in fact a necklace of villages
Dublin as a must visit destination that rivals other European capitals which invite visitors to enjoy the local heritage, packed with great
and indeed, due to its proximity to sea and countryside, can offer restaurants and shops. Each affords wonderfully evocative sea
more than most. views and opportunities for a long walk or cycle to lift the spirits.
Whether it’s rock-climbing in Dalkey, sea-kayaking in Howth, kite
“
surfing in Dollymount or learning to sail in Dun Laoghaire, there’s
I believe that this international something for all adventure seekers in Dublin’s coastal villages.
Dublin Bay Biosphere in association with Local Enterprise Offices
designation of Dublin Bay will will be seeking to develop a sustainable business charter for local
considerably enhance the business’s which support the ideals of the Biosphere project. This
represents an incredible opportunity for businesses to engage with
potential to develop the green new customers and to showcase sustainable, responsibly sourced and
ethical products and services which enhance this unique resource.
tourism market in a way which Dublin Bay is part of a global network of 651 Biosphere Reserves
in 120 countries. In April 2019, the European and North American
creates sustainable employment networks will meet in Dublin for their biennial conference to
without damaging natural resources strengthen the network, to share information on best practice and
to inspire and empower people to implement the principles of
or the cultural integrity of the bay.” UNESCO and its Biosphere programme.
Richard Bruton Further information about Dublin Bay and recreational
Minister for Education and Skills activities in Dublin’s coastal villages is available on
www.dublinbaybiosphere.ie and www.visitdublin.com
14 //ECONOMIC SCORECARD
dublin: economic scorecard aug 2018
Note: These "petrol gauge" charts present the performance of the particular indicator relative to a range of performances from most positive
(green) to least positive (red). Each gauge presents the latest value compared to the peak value and the trough value over the last decade
(except for public transport trips which cover the past 5 years and housing completions which cover the past 6 years). The Commercial Proper-
ty gauges are red at the high and low extremes, in recognition of the undesirability of rents or vacancy rates that are either too high or too low.
economy
ihs markit business pmi q2 2018 unemployment rate q1 2018 kbc/esri consumer sentiment q2 2018
46 51 8 10 100 120
40 57 7 12 70 140
34
58.5 63 5
5.7 13 53
154 160
3 month moving average (sa) % (sa) index (2003 = 100) (sa)
transport
airport arrivals mar 2018 seaport cargo q2 2018 public transport trips q1 2018
870 1,000 7.7 8.4 47.0 49.3
740 1,120 7.1 9.0 44.6 51.7
615
1,217
1,251 6.5
9.6 42.2
53.9
000's/month (sa) million tonnes/quarter (sa) million trips/quarter (sa)
residential property
average residential residential property housing completions
rents q1 2018 price index may 2018 q1 2018
1,200 1,310 84 99 800 1.100
1,090 1,420 69 113 400 1,400
961
1,527 55
104 128 100
1.214 1,760
€/month index 2005 = 100 units/month
commercial property
dublin city centre office dublin 2/4 office vacancy dublin suburbs office
rent q2 2018 rate q2 2018 vacancy rate q2 2018
460 540 15 20 15 18
380 620 10 25 11 22
296
700 700 5
5.5 30 8
8.6 25
€/sq.m. % %
sources: cso, except consumer sentiment kbc/esri; pmi markit; seaport cargo dublin port; public transport nta; residential rents prtb; commercial property cbre research
// 15THE DUBLIN BAY BIOSPHERE
WORKING TOGETHER TO PROMOTE A BALANCE
BETWEEN PEOPLE AND NATURE
DUBLINBAYBIOSPHERE.IEYou can also read