Global Macro Outlook Q1 | 2020 - the year ahead - Manulife Investment Management
←
→
Page content transcription
If your browser does not render page correctly, please read the page content below

Q1 | 2020
Global Macro
Outlook
the year ahead

                 1

                     506051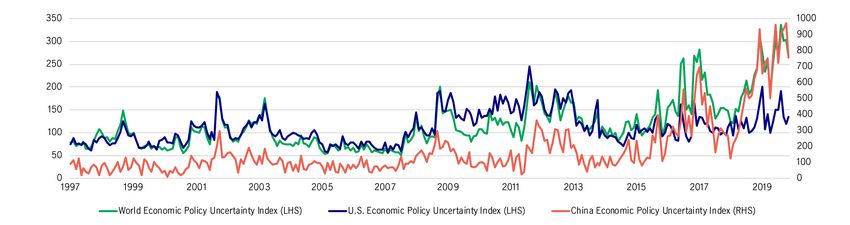
Key macro themes for 2020

We expect 2020 to be a          We expect monetary                    We expect the United                     In our view, Europe could                 Despite better                         The Bank of Canada will
year of two halves: In the      policy—and, increasingly,             States to experience a                   be approaching an                         economic data from                     have to continue to walk
first six months of the year,   fiscal policy—to play a key           soft patch before                        inventory restocking cycle                China in the last couple               a tightrope in 2020.
a stabilization is likely to    role in reviving global               inflecting higher around                 that should support some                  of months, we expect                   Growth is slowing—the
unfold, to be followed by an    growth. Key global central            midyear as key support                   modest reacceleration in                  structural headwinds to                central bank needs to
acceleration during the         banks are expected to stay            from the consumer is                     economic growth. While                    continue to weigh on                   strike a balance between
latter part of the year.        accommodative for an                  enhanced by an                           we continue to wait for a                 growth, which will, in                 inflation that’s in line
However, we don’t think         extended period of time.              improvement in                           rerating higher in equities               turn, weigh on Asia.                   with its target, and its
that the recovery will be       Given the dearth of inflation,        manufacturing activity.                  relative to the rest of the               However, there are                     instinct to avoid
synchronized, with Europe       this could continue until                                                      world, a 3% dividend yield                countries and                          stimulating an already
turning first, before the       price level rises and takes                                                    does provide some                         territories within the                 highly leveraged
U.S. stabilizes and             root at, or near, official                                                     attractive pickup.                        region that’ll continue                economy. If Canada does
eventually, China. Against a    targets. It’s likely to be a                                                                                             to appeal on a relative                see improved growth, it’ll
backdrop framed by the          multi-year process and could                                                                                             basis.                                 likely come through
ongoing trade dispute, we       prove beneficial to equities                                                                                                                                    business investment.
expect only a modest            on a structural basis. While
acceleration in China, a        currently small, the move
view that’s underscored by      toward fiscal stimulus is also
our belief that any             an area that could support
forthcoming stimulus            activity in the second half of
packages will be small and      the year.
domestically focused.
                                                       Source: Asset allocation macro strategy team, Manulife Investment Management, December 16, 2019. Individual portfolio management teams may have different views
                                                       and opinions that are subject to change without notice.
                                                                                                                                                                                                                         2
                                                                                                                                                                                                                             506051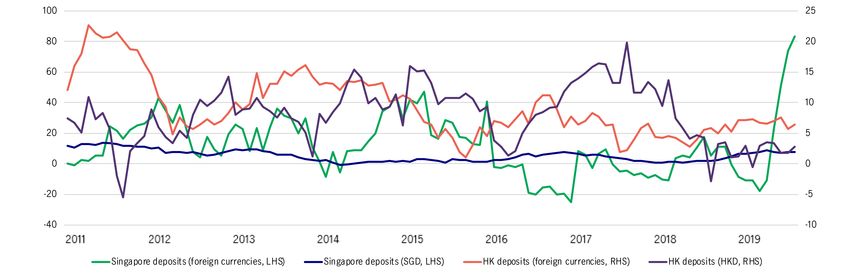
A mild global growth
recovery is ahead

                       3

                           506051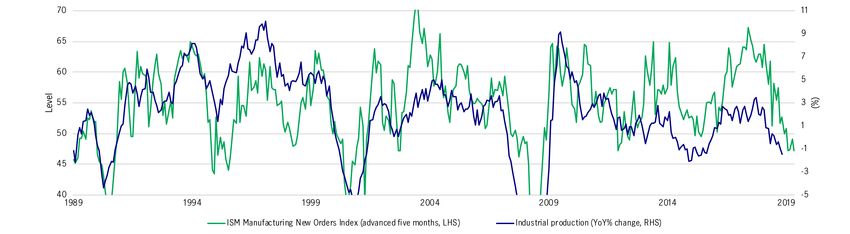
The global manufacturing recession is likely ending
The past 18 months have been marked by a pronounced deterioration in global manufacturing activity that has weighed on global growth, even
as the global services sector has been fairly resilient. In our view, three key factors have combined to create this manufacturing recession. First,
more protectionist foreign policy and the accompanying tariffs have weighed on global trade flows. Second, a front-loaded inventory shock
where companies sold off inventories without replenishing stocks. Third, the confidence shock resulting from uncertainty regarding global trade
policies, which has led to strategic decisions (and the accompanying fixed investment decisions) being deferred. As we look ahead into 2020, we
expect the global inventory de-stocking cycle to become a moderate restocking cycle, and for business confidence to mildly reaccelerate. This
should help lift the manufacturing sector back into expansionary territory on a sustained basis, particularly in Europe and the United States.

Global manufacturing PMI¹                                                                      U.S. CEO confidence vs. German IFO business confidence2

                                        1 Bloomberg, Manulife Investment Management, December 12, 2019. 2 Refinitiv, Manulife Investment Management. November 15, 2019. LHS refers to left-hand side; RHS
                                        refers to right-hand side.                                                                                                                                          4

                                                                                                                                                                                                                506051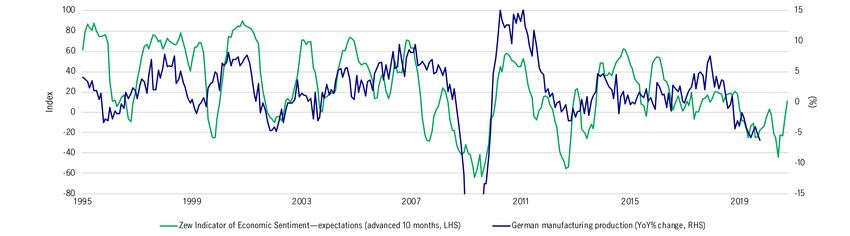
A weaker Chinese stimulus package implies the recovery will be muted
While we expect a global recovery in manufacturing (and on the back of that, broader growth in the latter half of 2020), we foresee only a mild
acceleration in growth that doesn’t reach so-called “escape velocity.” One key reason is because we expect the recovery in China to be behind the
others, and for Chinese stimulus measures to be relatively muted and more domestically focused than in the past. In view of that, we think it’s
unlikely that the global economy and the U.S. manufacturing sector will reaccelerate as sharply as they did in 2013 and 2016. While any lift the
global economy gets from a recovery/stabilization in the Chinese economy in the year ahead will remain sizable, it won’t be as significant as
before.

China credit impulse vs. Institute for Supply Management
manufacturing

                                       Source: Bloomberg, Manulife Investment Management, December 12, 2019. LHS refers to left-hand side; RHS refers to right-hand side.   5

                                                                                                                                                                                506051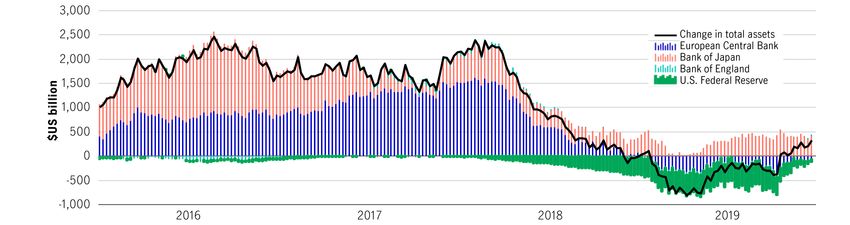
Economic policy uncertainty levels remain extremely elevated
The phase one trade deal between the United States and China indicates that any additional tariffs are unlikely and, perhaps more importantly,
a significant rollback of existing tariffs could be forthcoming. At a minimum, recent progress implies that trade tensions between the United
States and China aren’t likely to get worse. By extension, global companies are likely to benefit from any incremental stability in the two
countries’ trade relationship. However, in our view, geopolitical uncertainty remains extremely elevated. First, the U.S.-China trade dispute is far
from resolved, and it remains unclear when talks for phase two will begin. Second, the United States’ hawkish trade policy isn’t restricted to
China—tariffs have been, and could continue to be used, as a negotiating tool with its other trade partners. Third—which, in our view, is of
particular relevance to the global macro landscape—is the cost of shifting global supply chains and the time required to transition to a new
trade paradigm. The elevated levels of structural uncertainty will likely place a cap on how much business spending and trade activity will occur
in 2020, even if it does improve from current levels.

Global Economic Policy Uncertainty Index

                                         Source: Refinitiv, Manulife Investment Management, as of December 16, 2019. LHS refers to left-hand side; RHS refers to right-hand side.   6

                                                                                                                                                                                        506051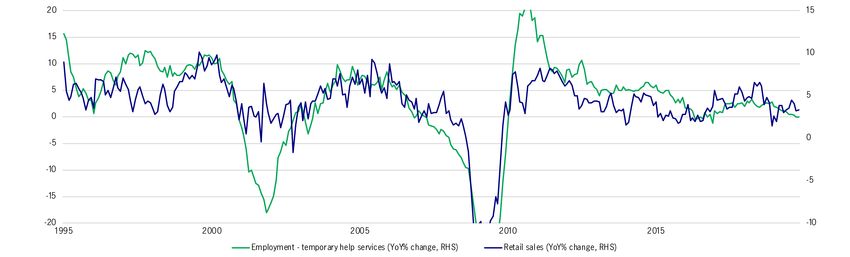
The global economy: recovery could take time
While we have a more optimistic outlook for global growth in 2020, we note that it won’t occur immediately or uniformly. We expect the
rebound to take place first in Europe, followed by the United States and, finally, in China. This implies global trade volumes and industrial
production might not display signs of improvement until the second half of 2020, and there remains scope for disappointment in global activity
in the first half of 2020, particularly as China, the primary engine of global trade, remains weak.

World trade volumes vs. global industrial production (%)

                                       Source: Refinitiv, Manulife Investment Management, as of September 13, 2019. LHS refers to left-hand side; RHS refers to right-hand side. YoY refers to year on year.   7

                                                                                                                                                                                                                   506051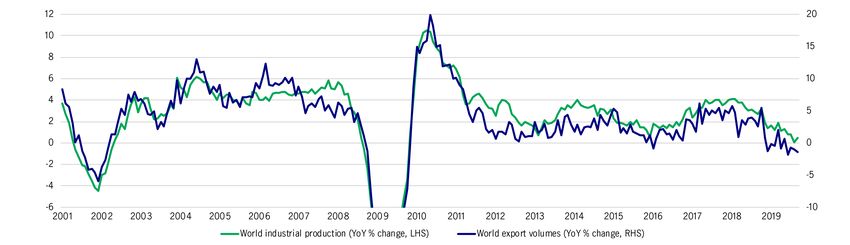
Extraordinary monetary
policy accommodation
is here to stay

                         8

                             506051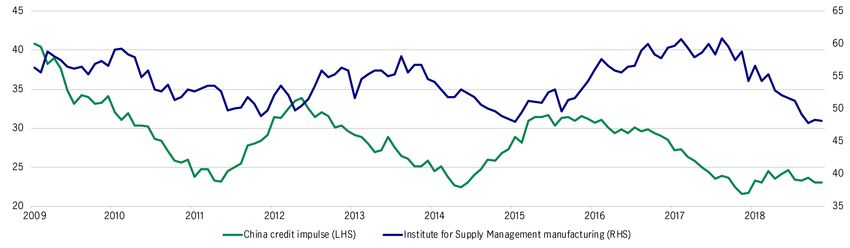
Central banks to stay low for an extended period of time
One of the key assumptions in our outlook is that most central banks in developed economies will maintain an extended period of extremely
easy monetary policy as they attempt to bring inflation back to their 2% target. In the United States, we expect that the U.S. Federal Reserve
(Fed) will cut rates once more in the first half of 2020 to provide some additional “insurance” to the economy. After that, we believe the Fed will
keep its policy rate unchanged for a few years as it seeks to create an environment of inflation sustainably closer to 2%, and other central
banks will follow suit. Elsewhere, the European Central Bank (ECB) and Bank of Japan (BoJ) are even further from raising interest rates; they
must first unwind unconventional monetary policy (quantitative easing) before considering increasing interest rates.

Central bank main policy rates (%)

                                       Source: Bloomberg, Manulife Investment Management, as of December 12, 2019.                                9

                                                                                                                                                      506051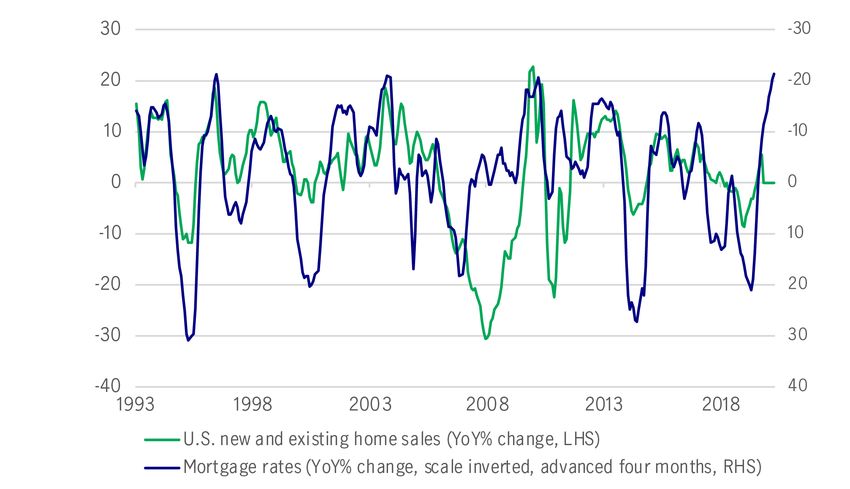
Central banks’ problem is not growth, but inflation
Our dovish view of the Fed and the ECB stems primarily from persistently weak inflation and, perhaps more importantly, inflation expectations.
Despite a growing consensus view that the global economy will avoid a recession in 2020, market and consumer-based measures of inflation
expectations are struggling to reaccelerate. Moreover, our forecast for the United States and Europe also has inflationary pressure running
serially below 2% over the next five years. Given most central banks’ focus on achieving a “symmetric" target of around 2% and the need to
create an overshoot, we believe central banks will have more than enough latitude to keep rates low, or lower, for several years.
Market-based measures of inflation (%) 1                                                     Our inflation forecasts (%)2

                                       1 Bloomberg, Manulife Investment Management. December 12, 2019. 2 Manulife Investment Management. December 12, 2019.   10

                                                                                                                                                                   506051
Global central banks are using their balance sheets to add liquidity and
keep rates low
The United States, Europe, and Japan are also indirectly supporting risk assets through their balance sheets—the Fed is continuing to reverse
its attempted tapering; the ECB has embarked on another round of quantitative easing; while Japan never stopped using unconventional
monetary policy. While the balance sheets of global central banks contracted for most of 2019, they’re now back in expansion mode and should
continue to do so throughout 2020. This has the triple effect of adding liquidity to the global financial system, keeping interest rates
(particularly at the front end) low, and perpetuating the view that central banks are backstopping growth.
Global central banks’ balance sheets
Source: Refinitiv, Manulife Investment Management. As of September 15, 2019. 11
506051From monetary policy to fiscal policy as key support
Central bank policy will continue to be a focus for global markets and
be the predominant driver of global yields. However, we’re seeing a
Countries we expect to pursue fiscal
wave of major economies with mild to moderate fiscal spending expansion in 2020
announcements for the coming year. These initiatives’ ability to boost
growth and inflation expectations (which would in turn steepen that
country’s yield curve) will ultimately depend on the size and type of China
spending. While we’re so far reluctant to call any of the Japan
announcements we’ve seen game changers, we nevertheless think
that the shift away from monetary policy and toward productivity- Germany
boosting fiscal policy will become an increasingly relevant theme in United Kingdom
the coming year.
France
India
Italy
Canada
Spain
Indonesia
Netherlands
Thailand
Philippines
Source: Manulife Investment Management. As of December 2019. 12
506051United States: looking
through the soft patch
13
506051Slow start, stronger finish
We expect 2020 to be a year of two halves. The first half of the year is likely to start off on a soft note due to two factors: the lagged effects of the
U.S. Federal Reserve’s (Fed’s) monetary policy tightening (completed in late 2018) and the impact that trade-related uncertainty has had on
business investment. However, we expect modest acceleration to take place in the second half of the year as the decline in mortgage rates, a
reacceleration in business investment, and easier monetary conditions work their way through the broader economy.
However, even though we expect the second half of the year to look better, the rebound is probably going to be muted, with growth likely to
come in slightly below 2%. There’re also considerable risks to our outlook, both to the upside and downside, that are dependent on trade
policy and geopolitics.
U.S. GDP (seasonally adjusted annual rate %)
4.0
Actual
3.5
Forecast
3.0
2.5
2.0
1.5
1.0
Q1 2018 Q2 2018 Q3 2018 Q4 2018 Q1 2019 Q2 2019 Q3 2019 Q4 2019 Q1 2020 Q2 2020 Q3 2020 Q4 2020 Q1 2021 Q2 2021 Q3 2021 Q4 2021
Source: Oxford Economics, Manulife Investment Management, as of December 12, 2019. 14
506051The consumer remains the main support to U.S. growth
2019 was a year in which the global economy bifurcated: Domestically focused activities such as consumer spending and services stayed strong
but the global manufacturing sector fell sharply into a recession. We expect 2020 to be a year of realignment in the United States in which the
manufacturing sector improves to meet continued strength in U.S. household spending.
In our view, two key macro factors will continue to support the U.S. consumer, which represents approximately 70% of the U.S. economy: low
interest rates and a tight labor market. We’re already seeing early evidence of the impact of lower interest rates in a segment that consumers
are highly sensitive to: residential real estate market. Meanwhile, the healthy jobs market—unemployment rate is at 40-year lows—went a long
way to supporting consumer confidence and economic activities.
U.S. home sales follow mortgage rates (%)¹ U.S. unemployment rate (%)²
1 Refinitiv, Manulife Investment Management, as of December 2019. 2 Refinitiv, Manulife Investment Management, as of December 2019. LHS refers to left-hand side; RHS
refers to right-hand side. YoY refers to year on year. 15
506051Can the manufacturing sector rebound?
While the U.S. consumer has been a bright spot for the global economy, industrial production in the United States reflected global economic
weakness. As with the rest of the world, trade-related uncertainty has weighed on expectations, and a front-loaded inventory correction also
contributed to slowing activity.
On balance, however, we believe that the degree of manufacturing contraction has been overdone—recent auto workers’ strikes might have
distorted the data. Various lead indicators, such as business surveys, now suggest that industrial production could stabilize in the coming
months, and will likely pick up in the second half of the year. This is important because the manufacturing sector—despite its shrinking size
relative to the broader U.S. economy—remains a vital component of S&P 500 earnings.
Business surveys suggest a bottom in production
Source: Refinitiv, Manulife Investment Management, as of December 2019. LHS refers to left-hand side; RHS refers to right-hand side. YoY refers to year on year. 16
506051Spots to watch: employment, consumer confidence
Our expectations for the year ahead hinge on the resilience of the U.S. consumer. One of the areas that we’re monitoring closely for signs of
trouble is the labor market. While the United States is at full employment, there are signs that the pace of hiring is starting to slow, which could
affect consumer confidence as job availability fades. Over the course of the next year, we’ll continue to keep a close eye on key employment
metrics for signs of strain. One such example is the relationship between temporary employment and retail sales, which while not alarming,
could translate into a modest headwind for consumption.
Slowing temporary help = potential consumption headwind
1 Refinitiv, Manulife Investment Management, as of December 12, 2019. LHS refers to left-hand side; RHS refers to right-hand side. YoY refers to year on year. 17
506051Europe: the first mover
on stabilization
18
506051Production—what goes down … must come up?
2019 was a difficult year for Europe: Apart from global trade tensions, several other factors weighed on manufacturing activity. For example,
Germany’s manufacturing sector has had to deal with supply chain disruptions in the pharmaceutical sector, regulatory issues in the automotive
space, and a potential inventory overhang in addition to managing any fallout from the U.S.-China trade war. The country’s close trading
relationship with the United Kingdom has also meant that it has experienced any Brexit-related uncertainty firsthand. That said, dark clouds
appear to be lifting as leading indicators suggest that a normalization may be in the cards for European manufacturing. Most importantly, we
believe European industrial activity will be the first to rebound, and the pace of that recovery is likely to be speedy. Recent improvements in U.S.-
China trade relations and additional clarity relating to Brexit have also added to our conviction.
Leading business surveys point to a bottom in manufacturing
Source: Refinitiv, Manulife Investment Management, as of November 2019. LHS refers to left-hand side; RHS refers to right-hand side. YoY refers to year on year. 19
506051Europe’s economy has been supported by employment …
Europe’s manufacturing space may have its fair share of woes, but the region’s economy has been well supported. The European employment
picture in particular has been very strong—the region’s decline in its unemployment rate has been dramatic. Understandably, with a tighter
labor market comes better wages, which have been comfortably above trend for the better part of the last two years.2 In our view, this for
Europe is likely to continue.
Europe: unemployment has been falling¹ Europe: wage growth have been accelerating (%)²
1 Refinitiv, Manulife Investment Management, as of November 2019. 2 Refinitiv, Manulife Investment Management, as of Q2 2019. LHS refers to left-hand side; RHS refers to
right-hand side. YoY refers to year on year. 20
506051… and European consumption continues to grow above trend
In addition to a healthy employment picture, low interest rates have also helped to create powerful tailwinds for the European consumer; retail
sales volumes have, for the most part, remained comfortably at, or above, the long-term average for the last several years. Barring another leg
down in the manufacturing sector, and a corresponding confidence shock that would lead to contagion into the services space, we expect this
positive trend to persist into 2020.
European retail sales growth has been above trend for three years (%)
Source: Refinitiv, Manulife Investment Management, as of December 2019. YoY refers to year on year. 21
506051Will the inflection be enough to support risk equities?
Given Europe’s global exposure, it’s unsurprising that European economic activity has lagged the United States. That relationship is reflected in
European corporate earnings, and in the difference between the performance of the S&P 500 Index and the MSCI’s Europe ex-U.K. Index over the
past several years. However, we believe that at some point, as Europe stabilizes, there could be a reversion to more normalized levels and a period
of outperformance in European equities. While timing this reversion has proven difficult, in the meantime we’d highlight that there’s a dividend
advantage in investing in Europe: At slightly over 3%, index-level dividends offer an attractive pickup relative to both the S&P 500 Index and
local yields.
European equity performance has tracked with earnings¹ European dividend yields are attractive (%)²
Source: Refinitiv, Manulife Investment Management, as of December 2019. 22
506051China: stabilization, not
recovery
23
506051Data shows nascent signs of stabilization, but headwinds to growth remain
We think the large upside surprise in November’s Purchasing Managers’ Indexes (for both manufacturing and services)1 are likely to be a one-off.
A surge in activity isn’t unusual around national holidays or large-scale events. In this case, October’s Golden Week holiday and preparations for
the 70th anniversary of the founding of the People’s Republic of China may have flattered the November reading.
In our view, Chinese growth could stabilize in the next one to three months, helped by a decision to bring forward nearly half of the 2020 local
government special bond issuance quota, which is likely to underpin investment in Q1.
That said, we believe it’ll be some time before the economy recovers from the vicious circle of factory deflation—slowing industrial profit growth
and rising rural nonperforming loans.
Chinese PMIs spike in November1 Deflationary doom loop (%)2
1 Bloomberg, Manulife Investment Management, as of December 6, 2019. 2 CBRC, National Bureau of Statistics, Manulife Investment Management, as of November 28, 2019. LHS
refers to left-hand side; RHS refers to right-hand side. YoY refers to year on year. 24
506051We’re watching the slowing property market closely
China’s spending on shantytown redevelopment projects has played an important role in supporting property prices. Residents are typically
compensated when their residences are demolished and the money they receive are often used to finance new home purchases. Government
spending on these projects totaled US$256 billion (CNY1.74 trillion) in 2018,1 but the target was slashed for 2019 (spending from January to
July only totaled US$85.2 billion (CNY600 billion).2 We’re starting to see the delayed impact of this development manifest itself through
decelerating property price growth in China’s Tier 2, 3, and 4 cities. In the absence of another rebound in the property sector similar to what we
saw in 2013/2016, we expect the eventual recovery in China to be shallow, with limited feedthrough to the global economy.
China property: housing sales and housing starts (%)3 Property prices in China’s cities (%)4
1 “China spends $256 billion on shantytown redevelopment in 2018,” Reuters, January 22, 2019. 2 “China spends more than $85.2 billion on shantyown redevelopment in January-
July,” Reuters, August 19, 2019. 3 National Bureau of Statistics, Manulife Investment Management, as of December 6, 2019. 4 Bloomberg, Manulife Investment Management, as of
November 28, 2019. LHS refers to left-hand side; RHS refers to right-hand side. YoY refers to year on year. 3mma refers to 3-month moving average. 25
506051A clogged monetary transmission mechanism
In our view, financial conditions are likely to remain tight because of Beijing’s commitment to put a lid on credit-fueled stimulus, which has a
material impact on private firm’s access to funding. As a result, monetary policies in the form of medium-term lending facility, loan prime rate
(the rate at which banks lend to their most trustworthy clients), and reserve required ratio cuts—while important—will remain modest and
aren’t likely to ease financial conditions.
Financing conditions worsen for private firms (CNY, trillion)1 China’s rising real interest rates (%)2
1 PBoC, Manulife Investment Management, as of November 27, 2019. 2 Bloomberg, Manulife Investment Management, as of November 28, 2019. LHS refers to left-hand side; RHS
refers to right-hand side. YoY refers to year on year. 3mma refers to 3-month moving average. 26
506051New sources of growth needed
As the law of diminishing returns kicks in, China needs to identify new sources of growth that can propel the economy forward. While industrial
investment used to power growth, the economy is at a point where additional investment in this area is unlikely to provide the lift it once did.
This isn’t surprising considering that China’s fixed-asset investment already far exceeds the developed world. From a longer-term perspective, a
case can be made that the country doesn’t need any more industrial investment; it has hit the point of inefficiency.
Investment, share of GDP (%)1 Low and diminishing return on assets (%)2
1 World Bank, Manulife Investment Management, as of November 28, 2019. 2 Rhodium, Manulife Investment Management, as of December 3, 2019. 27
506051Boosting productivity: navigating the crowding out effect
State-owned enterprises (SOEs) are roughly one and a half time the size of the private sector1 in total asset value, and subsidies to SOEs have
constrained the growth of privately owned enterprises—allowing the latter to flourish could unlock an important source of growth.
Total asset value by enterprise (CNY, trillion)1 China’s productivity stymied2
1 Macrobond, Manulife Investment Management, as of December 6, 2019. 2 Macrobond, Manulife Investment Management, as of November 28, 2019.
YoY refers to year on year. 28
506051Asia’s growth path in
2020
29
506051Factors that could influence the shape of Asia’s growth path
The economic downturn in Asia has yet to hit a bottom and we expect the continent to be the last global economic region to bottom out in 2020.
Although global risk sentiment has improved in recent weeks, stubbornly low economic growth and low levels of inflation leave markets
vulnerable to a reversal in sentiment. We expect a prolonged bottoming-out process and believe subsequent growth will be “L-shaped.” One of
the biggest drags on growth in the region is weak Chinese demand. China’s policy response to cyclical weakness in the economy has been very
limited in terms of scale and magnitude, which is in line with authorities’ stated preference to avoid fuelling financial instability.
Chinese demand has disappeared (%)1 Chinese credit impulse and Asian GDP growth (%) 2
1 Macrobond, Manulife Investment Management, as of December 6, 2019. 2 Bloomberg, Manulife Investment Management, as of November 5, 2019.
LHS refers to left-hand side; RHS refers to right-hand side. YoY refers to year on year. 3mma refers to 3-month moving average. 30
506051Boosting growth: regional policy options
Asian central banks in many countries are already at, or near, record lows. As such, there has been a shift toward fiscal policy doing more of the
heavy lifting, for example, corporate tax cuts in India and Thailand, labor law reforms in Indonesia, and China’s decision to bring forward special
purpose bonds for infrastructure spending. Crucially, while the room to ease fiscal policy varies widely across Asia, it’s important to note that
much of the region still has fiscal space to implement such measures. As budget deficits widen, deficit financing, liquidity, and the government
budget constraint will become important considerations.
Asia central bank policy rates at or near record lows (%)1 Most of Asia still has fiscal space (% of GDP)2
1 National Central Banks, Bloomberg, Manulife Investment Management, as of December 9, 2019. 2 IMF, Manulife Investment Management, as of September 10, 2019. 31
506051Asia’s potential bright spots in an "L-shaped" recovery
With trade uncertainty likely to remain elevated, economies that are less dependent on the external sector will be relatively more insulated.
Domestic demand can support growth as long as the macroeconomic policy mix employed can strike a balance between being able to
encourage economic expansion and staying mindful of financial stability risks. Interestingly, some of Asia’s more closed economies are poised
to power the continent’s next wave of growth—in our view, the Philippines, India, and Indonesia will become the region’s bright spots. In the next
two slides, we shall take a closer look at India and Indonesia.
Trade openness (% of GDP)
300
250
200
150
100
50
0
Hong Kong Vietnam Malaysia Taiwan Thailand South Korea Philippines Indonesia China Japan India
Exports plus imports
Source: Macrobond, Manulife Investment Management, as of December 9, 2019. 32
506051India vs. Indonesia:
strong contenders to
drive Asia’s growth
higher
33
506051India and Indonesia—attractive havens to seek shelter from trade storms
India and Indonesia have long stood out for offering attractive bond yields relative to their Asian peers. In a low growth, low yield environment,
they can seem even more enticing, particularly since both economies posted respectable growth in the third quarter of 2019— India grew 5.9%
(YoY) and Indonesia grew 5.1% (YoY).1 Within the context of a U.S.-China trade war, India and Indonesia also differ from their neighbors in one
key way: their economies are much less open. Growth in these two countries are traditionally driven by domestic demand; final consumption
expenditure accounts for more than half of their respective economies. In our view, this speaks to their growth potential, especially since both
countries have a large population, and importantly, favorable demographic structures.
Final consumption expenditure growth (%)1 Investment growth healthy despite recent pullback2
1 Macrobond, Manulife Investment Management, as of November 28, 2019. 2 Macrobond, Manulife Investment Management, as of November 28, 2019. YoY refers to year on year.
12mma refers to 12-month moving average. 34
506051Structural reform is key to unlocking potential growth
But as growth out-turns and pace of reform have disappointed time and again, investors are right to question if these economies will ever deliver
on their potential. In recent months, India announced a surprise corporate tax cut while Indonesia announced a five-year infrastructure plan
worth US$412 billion. How these fiscal plans will be funded remain unclear but both economies have witnessed disappointing foreign direct
investment inflows, which constrains their ability to deliver fiscal stimulus. Our estimates of the fiscal impulse1 to date has been only modest
(India: 0.6% of GDP and Indonesia: 0.2% of GDP). Nonetheless, we’re encouraged by the signs of reform. By embracing more timely reforms to
unlock potential growth (i.e., support infrastructure construction, land and labor markets, and foreign investment), India and Indonesia will be
able to pave the path to a bright future ahead.
Fiscal impulse as a % of GDP: Indonesia vs. India2
1 Fiscal impulse refers to additional impact on GDP growth from discretionary fiscal policy. 2 IMF, Manulife Investment Management, as of November 28, 2019. 35
506051Hong Kong vs. Singapore:
a tale of two economies
36
506051Hong Kong in recession, Singapore avoids one
The third quarter of 2019 held different fortunes for two rival international financial centers—Hong Kong and Singapore. Q3 GDP growth
showed Hong Kong slipped into a technical recession while Singapore narrowly avoided one. In this section, we take a look at several financial
and economic indicators that suggest the uncertainty in Hong Kong, which took place while the U.S.-China trade war unfolded, has led to a shift
in investor exposure to Singapore. Notably, the shift appears to only be in its early stages. In the absence of a resolution, the economic
divergence between Hong Kong and Singapore might become nonlinear. In that scenario, it could take longer for Hong Kong to regain
market share.
Hong Kong vs. Singapore: Q3 real GDP (%)
Source: Macrobond, Manulife Investment Management, as of December 6, 2019. 37
506051Hong Kong vs. Singapore: bank deposits
Deposits in Hong Kong’s banking system have steadily declined in recent months. Since the end of July, Hong Kong dollar (HKD) deposits fell by
HK$40 billion while deposits of foreign currencies increased almost fourfold to HK$165 billion. In contrast, Singapore saw an increase in
Singapore dollar (SGD) deposits of SG$5.6 billion while foreign currency deposits rose to SG$4.3 billion.1
Bank deposits: sharp growth in Singapore (YoY% change)1
1 Bloomberg, Manulife Investment Management, as of December 6, 2019. LHS refers to left-hand side; RHS refers to right-hand side. YoY refers to year on year. 38
506051Hong Kong vs. Singapore: commercial property prices and office vacancies
On the commercial real estate front, office vacancies in Singapore fell below Hong Kong for the first time since Q3 2016. Interestingly, office
vacancies in Hong Kong picked up from 4.4% in April to 6.1% in October.1 During that time, Singapore’s office vacancy rate fell from 3.9% to
3.3%. Consistent with this, the relative rental for prime commercial real estate in both cities (HK/SG) narrowed to the lowest level since 2015.
Office vacancy (%)1 Relative prime commercial rental (currency adjusted)2
1 Colliers, Manulife Investment Management, as of November 28, 2019. 2 Colliers, Manulife Investment Management, as of October 28, 2019. 39
506051Hong Kong vs. Singapore: visitor arrivals
Tourists stayed away from Hong Kong in recent months. Visitor arrivals to HK slumped to 3.1 million in September, representing a contraction
of 39.1% from a year ago, driven by a sharp decline in visitors from mainland China. Singapore didn’t experience a corresponding decline
during the same period. Visitor arrivals to Singapore in October rose 4.0% from the previous year, a one-year high. Visitors from mainland
China traveling to Singapore also jumped 4.0% (when compared with the previous year) in April to 8.7% in October. Hotel occupancy rates tell a
similar story.1
Hong Kong vs. Singapore: change in visitor arrivals (%)1 Hong Kong vs. Singapore: hotel occupancy rates (%)1
1 Hong Kong Tourism Board, Singapore Tourism Board, Manulife Investment Management, as of November 28, 2019. 40
506051Hong Kong vs. Singapore: domestic demand
Investment growth in Hong Kong has taken a huge hit in the past year—going from an 8.6% year-on-year growth in the last quarter of 2018 to
a contraction of 16.3% in Q3 2019. In contrast, Singapore enjoyed a sharp recovery on this front during the same period, rebounding from -
7.5% in Q4 2018 to 2.7% in the third quarter of 2019.1 We’re seeing a similar picture in the labor market in these two economies. Employment
growth in Hong Kong slipped into the negative territory in 2019, while the jobs market in Singapore appears to be holding up nicely, registering
mild improvements. This metric is important because it informs domestic demand, a critical part of economic growth.
Hong Kong vs. Singapore: investment growth1 Hong Kong vs. Singapore: employment growth2
1 Census and Statistics Department, Singapore Ministry of Trade and Industry, Manulife Investment Management, as of November 28, 2019. 2 Macrobond, Manulife Investment
Management, as of November 28, 2019. YoY refers to year on year. 41
506051Hong Kong vs. Singapore: stock market performance and volumes
The Straits Times Index (STI) has clearly outperformed the Hang Seng Index (HSI) since April. Alongside that outperformance, trading volumes in
Singapore have also outstripped trading activities in Hong Kong.
Hang Seng Index vs. Straits Times Index: stock market value Hang Seng Index vs. Straits Times Index: trading volumes
Source: Hong Kong Stock Exchange, Singapore Exchange, Manulife Investment Management, as of October 31, 2019. 42
506051Canada: resilience,
tested
43
506051A high bar to rate cuts: inflationary pressures are solid …
We expect the Bank of Canada (BoC) will cut interest rates twice in the second half of 2020 as growth slows—it’s a low conviction call. However,
there’re good reasons to believe that if any easing does indeed materialize, the BoC will be doing so reluctantly; after all, wage and price
pressures remain sizable. From an inflation perspective, Canada is one of the few major developed-market economies to have hit its target.
Meanwhile, on the wage front, hourly earnings have been running materially higher than even the most elevated assumptions in the United States.
United States vs. Canada: core inflation (%)1 United States vs. Canada: average hourly earnings (%)2
1 Refinitiv Datastream, Manulife Investment Management, December 16, 2019. 2 Refinitiv Datastream, Manulife Investment Management, November 15, 2019. YoY refers to
year on year. 44
506051… and there are big costs to cutting rates
Canadian growth is expected to slow markedly in 2020, but we believe that the bar to cutting rates is still quite high. Given extremely elevated
debt levels, we believe the BoC will want to make sure the broader economic benefits of cutting rates outweigh the costs of encouraging further
leverage. Moreover, it’s unclear whether lower interest rates would be an effective tool. While more accommodative policy would help to weaken
the Canadian dollar and keep financial conditions easy, it’s also plausible that any such moves could be less effective given the Canadian
consumer’s limited capacity (and, possibly, willingness) to take on additional debt.
Canadian debt service ratio (%)
Source: Refinitiv Datastream, Manulife Investment Management, as of August 15, 2019. 45
506051Can business investment pick up the slack?
With consumption likely slowing under the weight of high debt levels, and trade activity widely expected to remain systemically lower amid
heightened trade tensions, the Canadian economy will need business investment to pick up in 2020 in order to grow at a respectable pace. It’s
worth noting that structurally lower oil prices also don’t help. The good news is that we expect some moderate tailwinds in the year ahead; the
completion of USMCA, a stabilization/recovery in U.S. and European growth, improvements in U.S.-China trade relations, and some pent-up
demand should all contribute. But the risks to the broader economy are firmly on the downside, and the absence of business spending or hiring
could significantly drag on Canadian growth. From a policy perspective, the unfortunate reality is that there’s little the BoC can do, given that
business investment decisions—at this juncture—don’t appear to be rates related, but a function of external uncertainty.
Business investment in machinery and equipment—contribution to GDP (%)
Source: Refinitiv, Manulife Investment Management, as of September 13, 2019. 46
506051Important information
Investing involves risks, including the potential loss of principal. Financial markets are volatile and can fluctuate significantly in response to company, industry, political, regulatory, market, or economic developments. These risks are
magnified for investments made in emerging markets. Currency risk is the risk that fluctuations in exchange rates may adversely affect the value of a portfolio’s investments.
The information provided does not take into account the suitability, investment objectives, financial situation, or particular needs of any specific person. You should consider the suitability of any type of investment for your circumstances
and, if necessary, seek professional advice.
This material, intended for the exclusive use by the recipients who are allowable to receive this document under the applicable laws and regulations of the relevant jurisdictions, was produced by, and the opinions expressed are those of,
Manulife Investment Management as of the date of this publication, and are subject to change based on market and other conditions. The information and/or analysis contained in this material have been compiled or arrived at from
sources believed to be reliable, but Manulife Investment Management does not make any representation as to their accuracy, correctness, usefulness, or completeness and does not accept liability for any loss arising from the use of the
information and/or analysis contained. The information in this material may contain projections or other forward-looking statements regarding future events, targets, management discipline, or other expectations, and is only as current
as of the date indicated. The information in this document, including statements concerning financial market trends, are based on current market conditions, which will fluctuate and may be superseded by subsequent market events or
for other reasons. Manulife Investment Management disclaims any responsibility to update such information.
Neither Manulife Investment Management or its affiliates, nor any of their directors, officers or employees shall assume any liability or responsibility for any direct or indirect loss or damage or any other consequence of any person acting
or not acting in reliance on the information contained herein. All overviews and commentary are intended to be general in nature and for current interest. While helpful, these overviews are no substitute for professional tax, investment or
legal advice. Clients should seek professional advice for their particular situation. Neither Manulife, Manulife Investment Management, nor any of their affiliates or representatives is providing tax, investment or legal advice. Past
performance does not guarantee future results. This material was prepared solely for informational purposes, does not constitute a recommendation, professional advice, an offer or an invitation by or on behalf of Manulife Investment
Management to any person to buy or sell any security or adopt any investment strategy, and is no indication of trading intent in any fund or account managed by Manulife Investment Management. No investment strategy or risk
management technique can guarantee returns or eliminate risk in any market environment. Diversification or asset allocation does not guarantee a profit nor protect against loss in any market. Unless otherwise specified, all data is
sourced from Manulife Investment Management.
Manulife Investment Management
Manulife Investment Management is the global wealth and asset management segment of Manulife Financial Corporation. We draw on more than 150 years of financial stewardship to partner with clients across our institutional, retail,
and retirement businesses globally. Our specialist approach to money management includes the highly differentiated strategies of our fixed-income, specialized equity, multi-asset solutions, and private markets teams—along with
access to specialized, unaffiliated asset managers from around the world through our multimanager model.
These materials have not been reviewed by, are not registered with any securities or other regulatory authority, and may, where appropriate, be distributed by the following Manulife entities in their respective jurisdictions. Additional
information about Manulife Investment Management may be found at www.manulifeam.com.
Australia: Hancock Natural Resource Group Australasia Pty Limited., Manulife Investment Management (Hong Kong) Limited. Brazil: Hancock Asset Management Brasil Ltda. Canada: Manulife Investment Management Limited,
Manulife Investment Management Distributors Inc., Manulife Investment Management (North America) Limited, Manulife Investment Management Private Markets (Canada) Corp. China: Manulife Overseas Investment Fund
Management (Shanghai) Limited Company. European Economic Area and United Kingdom: Manulife Investment Management (Europe) Ltd. which is authorised and regulated by the Financial Conduct Authority, Manulife
Investment Management (Ireland) Ltd. which is authorised and regulated by the Central Bank of Ireland Hong Kong: Manulife Investment Management (Hong Kong) Limited. Indonesia: PT Manulife Aset Manajmen Indonesia. Japan:
Manulife Asset Management (Japan) Limited. Malaysia: Manulife Asset Management Services Berhad. Philippines: Manulife Asset Management and Trust Corporation. Singapore: Manulife Investment Management (Singapore) Pte.
Ltd. (Company Registration No. 200709952G) Switzerland: Manulife IM (Switzerland) LLC. Taiwan: Manulife Investment Management (Taiwan) Co. Ltd. Thailand: Manulife Asset Management (Thailand) Company Limited.
United States: John Hancock Investment Management LLC, Manulife Investment Management (US) LLC, Hancock Capital Investment Management, LLC and Hancock Natural Resource Group, Inc. Vietnam: Manulife Investment Fund
Management (Vietnam) Company Limited.
Manulife Investment Management, the Stylized M Design, and Manulife Investment Management & Stylized M Design are trademarks of The Manufacturers Life Insurance Company and are used by it, and by its affiliates under license.
47
MSTR.495330Definitions
5-year/5-year forward swap The 5-year/5-year forward swap is a measure of expected inflation (on average) over the five-year period that begins five
years the day the data is recorded.
Economic Trade Policy Uncertainty The Trade Policy Uncertainty Index is developed by a group of academics whose objective is to measure a broader set of economic
Index risks beyond the financial markets. It is not possible to invest directly in an index.
Conference Board Consumer The Conference Board Consumer Confidence Index is a monthly measure of consumer attitudes and buying intentions. It is
Confidence Index not possible to invest directly in an index.
U.S. NFIB Small Business Optimism NFIB stands for the National Federation of Independent Businesses, a nonprofit organization that advocates on behalf of
Index small businesses in the United States. The monthly NFIB Small Business Optimism Index is compiled from a survey of its
members and is widely used as a measure of business confidence. It is not possible to invest directly in an index. All
economic and/or market performance data is historical and is not a guarantee of future outcomes.
Purchasing Managers’ Indexes Purchasing Managers’ Indexes (PMI) are used as a leading indicator of the economic health of a country’s manufacturing
(PMI) sector (Manufacturing PMI) and services sector (Services PMI). Manufacturing PMI measures the health of the
manufacturing sector based on five major indicators: new orders, inventory levels, production, supplier deliveries, and the
employment environment. The Services PMI is the equivalent for the services sector, covering transport and communication,
financial intermediaries, business and personal services, computing and IT, and hotel and restaurants. It is not possible to
invest directly in an index.
ISM Manufacturing index and The Institute for Supply Management (ISM) manufacturing index monitors employment, production, inventories, new orders,
ISM New Orders Index and supplier deliveries. The ISM New Orders Index reflects the levels of new orders from customers. It is not possible to
invest directly in an index.
S&P 500 Index The S&P 500 Index tracks the performance of 500 of the largest publicly traded companies in the United States. It is not
possible to invest directly in an index.
MSCI Europe ex-U.K. Index The MSCI Europe ex-U.K. Index tracks the performance of publicly traded large- and mid-cap stocks across 14 developed
markets in Europe, excluding the United Kingdom. It is not possible to invest directly in an index.
48
MSTR.495330Definitions (cont’d)
MSCI Europe ex-U.K. Index The MSCI Europe ex-U.K. Index tracks the performance of publicly traded large- and mid-cap stocks across 14 developed
markets in Europe, excluding the United Kingdom. It is not possible to invest directly in an index.
Consumer Price Index (CPI) The Consumer Price Index (CPI) is a comprehensive measure used for estimation of price changes in a basket of goods and
services representative of consumption expenditure in an economy. It is not possible to invest directly in an index.
Core PCE Index The Core Personal Consumption Expenditure (PCE) Index measures the prices paid by consumers for goods and services,
excluding more volatile food and energy prices. It is not possible to invest in an index.
49
MSTR.49533050 MSTR.495330
You can also read