Relationship between growth traits and yield formation in Indica-type rice - SciELO
←
→
Page content transcription
If your browser does not render page correctly, please read the page content below
Agron. Mesoam. 230(1):79-100. Enero-abril, 2019
                                                                                            ISSN 2215-3608, doi:10.15517/ma.v30i1.29671
                                                                                              http://www.revistas.ucr.ac.cr/index.php/agromeso

    Relationship between growth traits and yield formation in Indica-type rice
                                     crop1

       Relación entre los rasgos de crecimiento y la formación de rendimiento en el
                                cultivo de arroz tipo Índica

    Lázaro A. Maqueira-López2, Rogelio Morejón-Rivera2, Osmany Roján-Herrera2, Walfredo Torres-de-la-Noval2

1
    Recibido: 6 de julio, 2017. Aceptado: 15 de enero, 2018. This work was part of the project “Yield formation in rice plants (Oryza sativa L.)
    and physiological variables determining it” financed by Ministerio de Educación Superior and Ministerio de Ciencia, Tecnología y Medio
    Ambiente, Cuba.
2
    Instituto Nacional de Ciencias Agrícolas, Cuba. lalberto@inca.edu.cu (author for correspondence), rogelio@inca.edu.cu, orojan@inca.edu.
    cu, wtorres@inca.edu.cu

                                                                 Abstract
            Introduction. Climatic variation is one of the causes for the decrease in yield and its variability in Indica-type
      rice (Oryza sativa L.). This evidences the necessity of the study of the interaction of meteorological variables with the
      behavior of rice cultivars, to establish the base of management of the harvest and increase of the yield. Objective. The
      objective of the present study was to relate the yield of rice with variables of plant growth. Materials and methods.
      Four rice cultivars were planted in the “dry” season of December 2004, February 2005 and January 2006, and in the
      rainy season of March 2006, April 2008 and 2009, in Los Palacios, Pinar del Río province, Cuba. The yield and its
      components, the dynamics of plant growth (LAI and dry matter), the variation of the dry matter of the internodes,
      peduncle, flag leaf, leaf and leaf sheath during the grain filling phase were evaluated the panicle growth in addition to
      the meteorological data. A multivariate analysis was used to relate the performance to the characteristics of the plants
      evaluated. Results. The yield was higher in the “dry” season and to obtain higher yields, the growth dynamics of the
      plant and the variation of the dry matter of the third internode during the grain filling were important. In both seasons,
      different source-sink relationships were established and these situations depended mainly on the temperature regime at
      which the plants were subjected. Conclusion. Breeders, in order to increase potencial yields, may fows their atttention
      in grow traits during vegetative stages.

            Keywords: internodes, dry matter, seed filling, starchy crops.

                                                                 Resumen
           Introducción. La variación climática es una de las causas para la disminución del rendimiento y su variabilidad
      en arroz de tipo Índica (Oryza sativa L.). Esto evidencia la necesidad del estudio de la interacción de variables
      meteorológicas con el comportamiento de cultivares de arroz, para establecer la base de manejo de la cosecha e
      incremento del rendimiento. Objetivo. El objetivo del presente estudio fue relacionar el rendimiento de arroz con
      variables del crecimiento de la planta. Materiales y métodos. Cuatro cultivares de arroz se sembraron en la estación
      “seca” de diciembre de 2004, febrero de 2005 y enero de 2006, y en la estación lluviosa de marzo de 2006, abril de
      2008 y 2009, en Los Palacios, provincia Pinar del Río, Cuba. Se evaluó el rendimiento y sus componentes, la dinámica

                    © 2019 Agronomía Mesoamericana es desarrollada en la Universidad de Costa Rica bajo una licencia Creative Commons
                    Atribución-NoComercial-SinDerivar 4.0 Internacional. Para más información escriba a pccmca@ucr.ac.cr, pccmca@gmail.com
Maqueira-López et al.: Growth and yield in rice plants

    de crecimiento de planta (LAI y materia seca), la variación de la materia seca de los entrenudos, pedúnculo, hoja
    bandera, lámina y vaina de las hojas durante la fase de llenado del grano, el crecimiento de la panícula además de los
    datos meteorológicos. Se utilizó un análisis multivariado para relacionar el rendimiento con las características de las
    plantas evaluadas. Resultados. El rendimiento fue mayor en la estación “seca” y para obtener mayores rendimientos
    fue importante la dinámica de crecimiento de la planta y la variación de la materia seca del tercer entrenudo durante
    el llenado del grano. En ambas épocas, se establecieron relaciones de la fuente-sumidero diferentes y estas situaciones
    dependieron principalmente del régimen de temperatura a que las fueron sometidas las plantas. Conclusión. Los
    cultivadores, con el fin de aumentar los rendimientos potenciales, pueden centrar la atención en los rasgos de
    crecimiento durante las etapas vegetativas.

         Palabras claves: internodios, materia seca, llenado de semilla, plantas feculentas.

                                                       Introduction

      Rice (Oryza sativa L.) is one of the cereals of major significance in the world and the main food resource, after
wheat, for more than half of the world population (Ruiz et al., 2005; Acevedo et al., 2006; Álvarez et al., 2008;
Canfalonieri et al., 2011), mainly in developing countries. World per capita consumption is placed around the 56.9
kg (FAO, 2013).
       Climatic variation is one of the fundamental causes for yield variability of several crops, in particular on rice
(Akinbile, 2013). The former statement leads to the need for the study of the interaction of meteorological variables
with rice cultivar behavior to establish the basis for crop management and yield increment.
      Current agriculture tends to increase the importance of genotype behavior in local environments to increase
productivity. In this sense, it is fundamental knowledge of processes and mechanisms that determine growth and
consequently, biological and agricultural yield, as well as how they are affected by the meteorological conditions.
An important element in rice yield formation is grain filling, where fertilized ovaries develop into caryopsis (Takai
et al., 2005). Its duration and filling rate are essential elements contributing to final yield. Authors that studied the
grain filling process in cereals, stated that the relation among sink-source organs is crucial for the event, where grain
filling (sink) could be limited by leaf photosynthetic activity (source), the grain carbohydrate deposition (sink) or
both and where climate is important in cultivar response (Yang and Zhang, 2010; Hernández and Soto, 2012; 2013).
      All these aspects provide information for using inputs more efficiently constitutes guidelines for breeders, with the
purpose to develop cultivars more adapted and with higher yield potentials given. In particular, the thermal and radiation
environment, establish a production ceiling difficult to overcome with the input increase (Tao and Zhang, 2013).
      Production increase can be achieved by expansion of current crop area, higher yield per-unit area, or both
(Bruisma, 2009). Furthermore, the yield increases per-unit area can be achieved through increases of yield potential
(Yp) or through reductions of yield gaps (Yg) (Fischer et al., 2014). Yield potential is defined as the yield of a cultivar
when grown in an environment to which is adapted, with nutrients and water non-limiting and with biotic stresses
effectively controlled (Evans and Fischer, 1999). Hence, Yp is determined by solar radiation, temperature, carbon
dioxide concentration, and crop physiological attributes governing light interception, conversion into biomass, and
partition into harvestable organs. Yield gaps could be analyzed through well-calibrated crop simulation models
coupled with high-quality weather, soil and crop management data (Merlos et al., 2015).
      Improving the genetic Yp of tropical, irrigated rice varieties is a priority objective of rice breeding programs
worldwide in the interest of achieving food security and maintaining political stability (Dingkuhn et al., 2015). But

80                                                                                     Agron. Mesoam. 30(1):79-100, enero-abril, 2019
                                                                                       ISSN 2215-3608 doi:10.15517/ma.v30i1.29671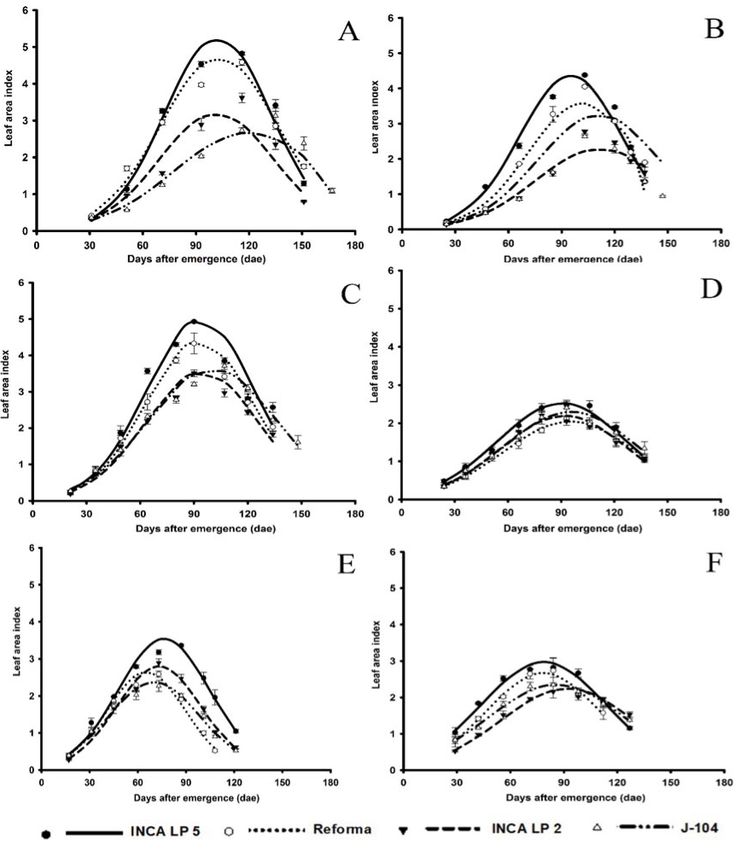
Maqueira-López et al.: Growth and yield in rice plants

Yp has stagnated at about 10 Mg/ha since the Green Revolution. For this purpose, growth studies and its relation
with meteorological variables are needed.
     Growth models enables the simulation and evaluation of probable productive scenes, but this approach is
useful for global situations and useless for local analyses when the causes of crop response are unknown. Current
simulation models are deficient in genetic, physiological and edaphic parameters that explain yield. This features
were informed (Iizumi et al., 2011; 2013; Tao and Zhang, 2013) and regretfully, there is a lack of integral studies
with a systemic approach for the establishment of rice yield formation, taking into account the cultivar, prevailing
climatic variations in a particular locality and their effect on biological and agricultural plant productivity, with
the purpose to answer the causes of plant response and develop actions in order to increase productivity, through a
more efficient local crop management.
     The aim of the present study was to relate rice yield with plant growth traits.

                                                       Materials and methods

     The study was conducted in areas of the Experimental Station ¨Los Palacios¨ of Instituto Nacional de Ciencias
Agrícolas (National Institute of Agricultural Sciences) at Pinar del Río, Cuba, located at 22°44´ North latitude and
83°45´West longitude, 60 masl. Cultivar characteristics are shown in Table 1: two short growth period (INCA LP-5
and Reforma) and two medium growth period (INCA LP-2 and J-104) rice cultivars (indica type), were sowed in
“dry” season (December 2004, February 2005 and January 2006) and “rainy” season (March 2006, April 2008 and
2009), in a Hydromorphic Gley Nodular Ferruginous Petroferric soil (Hernández et al., 1999), with a direct sowing
technology, using a 120 kg/ha seed rate. Crop management was conducted according to technical instruction of rice
cultivation (MINAG, 2008). A random design with four replications was used, with experimental plots of 25 m2.

Table 1.     Main biological characteristics of rice cultivars (Oryza sativa L.) used in the experiments developed in Los Palacios
             province of Pinar del Río, Cuba, during 2004 to 2009.
Cuadro 1.    Características biológicas principales de cultivares de arroz (Oryza sativa L.) usados en los experimentos desarrollados en
             Los Palacios provincia de Pinar del Río, Cuba, durante 2004 a 2009.

 Characteristics                                                                 Cultivars
                                         INCA LP-5*                 Reforma*                 INCA LP-2**            Jucarito 104*
 Parents                                 2077/CP1C8           Taichun Senyu204 /         IR 759-54-22/6066       IR 480-5-2/IR 30-
                                                              ChianungSenyu14                                          16-1
 Cycle duration (days)
  “Dry” season                                128                      122                        134                    147
  “Rainy” season                              110                      105                        114                    119
 Classification due to cycle                “short”                  “short”                  “medium”                “medium”
 Plant height (cm)                               90                   90-110                      88                      85
 Panicle size (cm)                               23                     26                        24                      23
 Grain number per-panicle                        90                    150                        90                     112
 One-thousand kernel weight                  29.5                      26.6                       29                      28
 Maximum attainable yield (t/ha)
  “Dry” season                                   8.2                    7.5                       7.8                    8.6
  “Rainy” season                                 5.7                    5.7                       6.7                    5.9

Data obtained from * MINAG (2005) and ** Pérez (1998) / Datos obtenidos de *MINAG (2005) y **Pérez (1998).

Agron. Mesoam. 30(1):79-100, enero-abril, 2019                                                                                       81
ISSN 2215-3608 doi:10.15517/ma.v30i1.29671
Maqueira-López et al.: Growth and yield in rice plants

     Economic yield and its components were determined at each experimental plot according to Amador and
Peña (1986), in two areas of 1 m2 per plot and values were expressed in t/ha at 14% of grain moisture; panicle
number per square meter (Pan/m2) was evaluated counting method on a surface of 0.50 m2 with four repetitions per
experimental plot; grain number per panicle (G/pan) was evaluated from twenty panicles randomly taken from each
experimental plot, grains were separated, counting filled and unfilled, and weight of 1000 grains from two samples
of filled grains, per experimental plot.
     Plants growth dynamics were evaluated from 25 days after emergence (DAE) until harvest, at periods of nearly
fifteen days, from an area of 0.25 m2 of each experimental plot, determining organ (stems, leaves, and panicles)
dry weight (grams) and aerial dry weight (sum of organs), foliar surface was determined through a foliar surface
integrator AM 300, and expressed per unit of ground area (LAI). Dry weights were obtained after oven drying at
70 ºC during 72 hours, until constant weight.
     Actual data were adjusted by means of regression analysis using the mathematical function (1), with weight
as dependent variable and DAE as the independent variable. Growth analysis indexes were obtained according
to Torres (1989) and García et al. (1998), such as growth rate (GR, equation 2) of dry weight and leaf area index
(LAI), leaf area duration (LAD, equation 3), and net assimilation rate (NAR, equation 4), where P or A are the dry
weights or LAI, respectively, and t is the DAE.

     Different growth parameters were estimated from the first and second derived of mathematical functions
attained, such as time for the total dry matter maximum (t TDM max), total dry matter maximum (TDM max),
time for the total dry matter growth rate maximum (t TDM GR max), total dry matter growth rate maximum (TDM
GR max), time for the leaf area index maximum (t LAI max), leaf area index maximum (LAI max), time for the
leaf area index growth rate maximum (t LAI GR max), leaf area index growth rate maximum (LAI GR max), net
assimilation rate at the time of the total dry matter maximum (NAR t TDM max), net assimilation rate at the time
of the leaf area index growth rate maximum (NAR t LAI GR max), net assimilation rate at the time of the leaf area
index maximum (NAR t LAI max), and leaf area duration (LAD).
     The contribution of main stem dry weight to grain filling was evaluated, from 25 selected plants at panicle
differentiation stage, on five representative plants per experimental plots for each treatment (genotype and planting date)
in three different moments (anthesis, ten and twenty days after anthesis). Each stem was divided into parts: flag leaf
(FL), foliar sheaths (FS), foliar blades (FB), the three upper internodes, numbered from apex to base, first, second and
third internode (Int 1, Int 2 and Int 3, respectively) and peduncle (Ped), spikelet (S) and dry matters were determined.
     Grain filling dynamics per treatment were established from grain dry weights obtained from ten panicles at
each experimental plot, according to CIAT (1985), from anthesis to harvest, every three days. Grains were separated
from rachis and their dry weight determined.

82                                                                                     Agron. Mesoam. 30(1):79-100, enero-abril, 2019
                                                                                       ISSN 2215-3608 doi:10.15517/ma.v30i1.29671
Maqueira-López et al.: Growth and yield in rice plants
Yield and its components were processed through variance analysis according to the experimental design
employed and the range was estimated by means of the confidence interval at 95% of probability using the standard
error of variance analysis. Data matrixes of yield and growth variables and attributes were processed by means of
a multivariate analysis with Biplot representations and auto vectors, to determine association degree among them
(Morejón et al., 2005).
Results
Sowing dates and seasons showed differences in meteorological variables and they were, in principle,
responsible for plant performance. Sowing dates in “dry” season began with lower temperatures and ended with
warmer, in contrast, in “rainy” season temperatures were more stable during growth, but during reproductive stage
somewhat higher. As well, solar global radiation varied in an almost regular manner according to sowing dates in
different years but differences were attained between “dry” and “rainy” season, in the former, radiation increased
towards the end of the growing period (from 16 to 25 Mj/m2/day), while in the latest, it decreased (from around 25
to 23 Mj/m2/day).
Yield and yield components
Yield and its main components, for both planting seasons (Table 2), showed variation among cultivars for
a specific sowing date or season, and it was difficult to establish a defined pattern for these variables, due to the
interaction between meteorological conditions and cultivars. Despite the former, in “dry” season, short cycle
cultivars showed a better behavior that medium cycle ones (Table 1). In general, yield and its components in “rainy”
season decreased (Table 1) and short cycle cultivars did not show the superiority observed as in “dry” season.
In “rainy” season, as a mean, cultivars had fewer panicles per square meter (72 Pan/m2 less) and a longer
number of unfilled grains per panicle (more than 6%); nevertheless, total grain number per panicle showed no
variation among seasons. Consistently, yields in “rainy” season decreased by more than 1.0 t/ha.
Plants grew slower and more in “dry” season compared to “rainy” season, in the foliar surface as well as in
dry matter accumulation. Differences in growth variables were more pronounced among sowing dates than among
cultivars, for a given season.
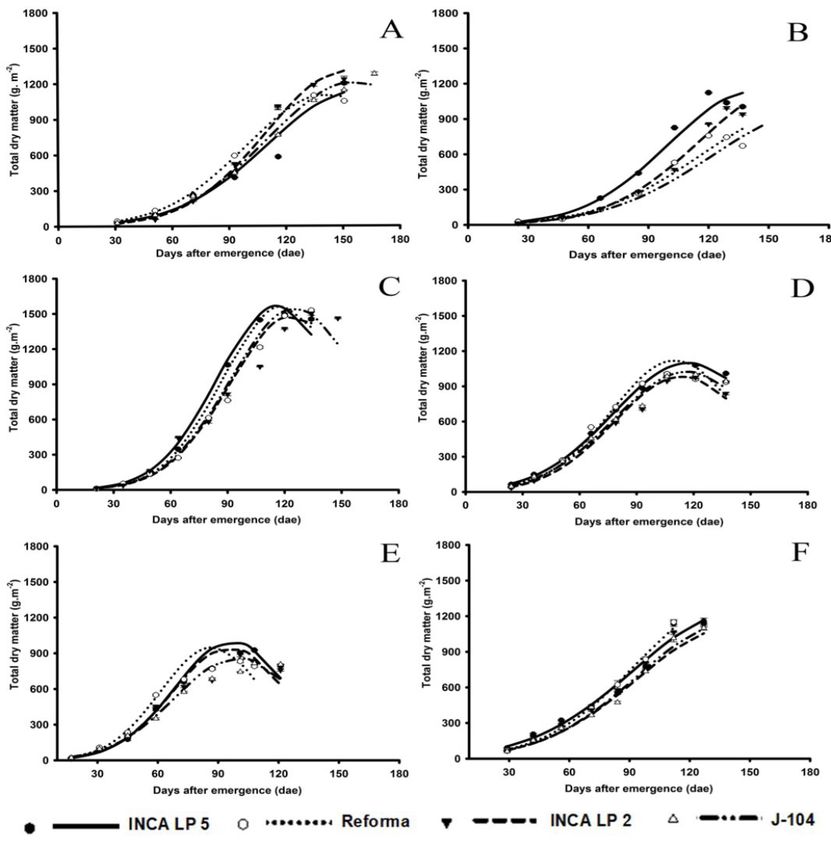
Leaf area index (LAI) increased after emergence, achieving a maximum value and declining towards the end
of the development period (Figure 1). Maximum values were in the order of 3.81 for “dry” season, and 2.55 for
“rainy” season at 103 and 83 DAE, respectively, showing restrictions in the source in the raining season plantings.
Aerial dry weights in both sowing seasons followed the course of individual organs (mainly stems and leaves)
with an increase until the final plant growth stages (Figure 2). Maximum values (TDM max) were attained at 145
DAE, for “dry” season, and 117 DAE, for “rainy” season, coinciding with the maturation stage, with magnitudes
from 1264 and 1061 g/pl, in “rainy” and “dry” seasons, respectively. “Rainy” season was characterized by a faster
and lesser development. In both seasons, maximum LAI occurred around the moment that plants attained their dry
matter maximum growth rate (GR).
Multivariate analysis between yield and different growth variables showed, in “dry” season (Figure 3A) a
positive relation between yield and leaf area index maximum (LAI max), leaf area duration (LAD), and time for
the leaf area index growth rate maximum (t LAI GR max), and an almost negative relation with time for the total
dry matter maximum (t TDM max), time for the total dry matter growth rate maximum (t TDM GR max), time
for the leaf area index maximum (t LAI max), time for the leaf area index growth rate maximum (t LAI GR max).
A different situation was presented for “rainy” season (Figure 3B), where yield was related positively with leaf
Agron. Mesoam. 30(1):79-100, enero-abril, 2019 83
ISSN 2215-3608 doi:10.15517/ma.v30i1.29671Maqueira-López et al.: Growth and yield in rice plants
Table 2. Economic yield (t/ha) at 14% moisture of the grain and its main components of the rice cultivars (Oryza sativa L.), in
different dates and seasons of planting in Los Palacios, province of Pinar del Río, Cuba (December 2004, February 2005,
January 2006, March 2006, April 2008 and April 2009).
Cuadro 2. Rendimiento económico (t/ha) al 14% de humedad del grano y sus componentes principales de los cultivares de arroz
(Oryza sativa L.), en diferentes fechas y temporadas de siembra en Los Palacios, provincia de Pinar del Río, Cuba
(diciembre 2004, febrero 2005, enero 2006, marzo 2006, abril 2008 y abril 2009).
Cultivars Full grain number per panicle Yield (t/ha)
December 2004
INCA LP-5 81±4.5 6,2±0.2
Reforma 104±4.5 6,2±0.2
INCA LP-2 88±4.5 5,5±0.2
J-104 97±4.5 5,3±0.2
SEx 2.31* 0.12*
February 2005
INCA LP-5 80±3.3 6.0±0.2
Reforma 85±3.3 5.5±0.2
INCA LP-2 87±3.3 4.8±0.2
J-104 78±3.3 5.3±0.2
SEx 1.17* 0.12*
January 2006
INCA LP-5 70±16.7 6.2±0.1
Reforma 107±16.7 6.1±0.1
INCA LP-2 81±16.7 5.6±0.1
J-104 74±16.7 5.7±0.1
SEx 8.53* 0.07*
March 2006
INCA LP-5 66±1.5 4.8±0.2
Reforma 70±1.5 4.2±0.2
INCA LP-2 70±1.5 3.8±0.2
J-104 65±1.5 4.6±0.2
SEx 0.75* 0.10*
April 2008
INCA LP-5 76±2.4 4.6±0.2
Reforma 81±2.4 4.2±0.2
INCA LP-2 71±2.4 3.9±0.2
J-104 72±2.4 4.5±0.2
SEx 1.24* 0.10*
April 2009
INCA LP-5 71±2.7 4.8±0.3
Reforma 84±2.7 4.4±0.3
INCA LP-2 71±2.7 3.4±0.3
J-104 76±2.7 4.2±0.3
SEx 1.40* 0.13*
Confidence interval at 95% of probability taking into account the experimental error of the analysis of variance. * p ≤0.05, according
to Duncan Multiple Range Test / Intervalo de confianza al 95% de probabilidad teniendo en cuenta el error experimental del análisis de
varianza. * p≤0,05, según dócima de Rangos Múltiples de Duncan.
84 Agron. Mesoam. 30(1):79-100, enero-abril, 2019
ISSN 2215-3608 doi:10.15517/ma.v30i1.29671Maqueira-López et al.: Growth and yield in rice plants
Figure 1. Growth dynamics of the leaf area index (LAI) of rice plants after emergence in Los Palacios, province of Pinar del Río,
Cuba (A December 2004, B February 2005, C January 2006, D March 2006, E April 2008 and F April 2009).
Figura 1. Dinámica de crecimiento del índice de área foliar (LAI) de las plantas de arroz después de la emergencia en Los Palacios,
provincia de Pinar del Río, Cuba (A diciembre 2004, B febrero 2005, C enero 2006, D marzo 2006, E abril 2008 y F abril
2009).
Agron. Mesoam. 30(1):79-100, enero-abril, 2019 85
ISSN 2215-3608 doi:10.15517/ma.v30i1.29671Maqueira-López et al.: Growth and yield in rice plants
Figure 2. Dynamics of growth of total dry matter of rice plants after emergence in Los Palacios, province of Pinar del Río, Cuba
(A December 2004, B February 2005, C January 2006, D March 2006, E April 2008, F April 2009).
Figura 2. Dinámica de crecimiento de la masa seca total de las plantas de arroz después de la emergencia en Los Palacios, provincia
de Pinar del Río, Cuba (A diciembre 2004, B febrero 2005, C enero 2006, D marzo 2006, E abril 2008, F abril 2009).
area duration (LAD) only and negatively with net assimilation rate at the time of the total dry matter growth rate
maximum (NAR t TDM GR max), net assimilation rate at the t TDM Gr max (NAR t LAI GR max).
86 Agron. Mesoam. 30(1):79-100, enero-abril, 2019
ISSN 2215-3608 doi:10.15517/ma.v30i1.29671Maqueira-López et al.: Growth and yield in rice plants
Figure 3. Multivariate analysis between yield and different growth variables of rice plants, in Los Palacios province of Pinar del Río
Cuba 2004 to 2009 (A) “rainy season” n = 16 and (B) “dry season” n = 20. Time for the maximum value of the total dry
matter (t TDM max), maximum total dry matter (TDM max), time for the maximum growth rate of the total dry matter (t
TDM GR max), maximum growth rate of the total dry matter (TDM GR max), time for the maximum leaf area index (t
LAI max), maximum leaf area index (LAI max), time for the maximum growth rate of the leaf area index (LAI GR max),
net assimilation rate in time of maximum total dry matter (NAR t LAI max), net assimilation rate in time of maximum
growth rate of the total dry matter (NAR t LAI GR max), net assimilation rate in the time of maximum leaf area index
(NAR t LAI max), and leaf area duration (LAD).
Figura 3. Análisis multivariado entre el rendimiento y diferentes variables del crecimiento de plantas de arroz, en Los Palacios
provincia de Pinar del Río Cuba 2004 a 2009 (A) “época lluviosa” n=16 y (B) “poco lluviosa” n=20. Tiempo para el valor
máximo de masa seca total (t TDM max), máxima masa seca total (TDM max), tiempo para la máxima tasa de crecimiento
de la masa seca total (t TDM GR max), máxima tasa de crecimiento de la masa seca total (TDM GR max), tiempo para
el máximo índice de área foliar (t LAI max), Máximo índice de área foliar (LAI max), tiempo para la máxima tasa de
crecimiento del índice de área foliar (LAI GR max), tasa de asimilación neta en el tiempo de máxima masa seca total
(NAR t LAI max), tasa de asimilación neta en el tiempo de máxima tasa de crecimiento de la masa seca total (NAR t LAI
GR max), tasa de asimilación neta en el tiempo de máximo índice de área foliar (NAR t LAI max), y duración del área
foliar (LAD).
Figures 4, 5, 6 y 7 show the results of dry matter variation in different plant organs after anthesis, demonstrating
that the process was different taking into account the type of organ, the cultivar and sowing dates and season.
A consist eats dry matter decrease of the third internode, from anthesis to twenty days after it, accounted for
more than 90% of treatments, despite cultivar, plantings date or season (Figure 4A). A similar behavior showed the
second internode in more than 50% of treatments (Figure 4B).
The first internode maintained similar weights in 60% of treatments during reproductive phase, and in the rest
of cases, the weight for this organ increased until ten days after anthesis and decreased towards the end of the phase
(Figure 5C). A similar situation was found in peduncle weight variation (Figure 5D).
Flag leaf weight was almost constant in 60% of treatments. As a whole, a consistent decrease in dry matter
after anthesis was found in the sheaths (75% in “dry” season and 83% in “rainy” season) and blades of the rest of
the leaves in the main stem (67% in “dry” season and all treatments in “rainy” season) (Figures 6E, 6F, 7G and 7H).
Multivariate analysis among yield and dry matter variation in different plant organs after anthesis, showed for
“dry” season (Figure 8A) a positive relationship between yield and panicle dry matter and dry matter variation, and
the dry matter decrease of the two lowest internodes (Int 2 and Int 3) and foliar sheaths (FS). A different situation
Agron. Mesoam. 30(1):79-100, enero-abril, 2019 87
ISSN 2215-3608 doi:10.15517/ma.v30i1.29671Maqueira-López et al.: Growth and yield in rice plants
Figure 4. Variation of the dry matter of rice plants in different organs of the plant after the anthesis in Los Palacios, province of
Pinar del Río, Cuba (A, third internode, B Second internode, C first internode, D peduncle, to December 2004 , b February
2005, c January 2006, d March 2006, e April 2008, f April 2009).
Figura 4. Variación de la masa seca de plantas de arroz en diferentes órganos de la planta después de la antesis en Los Palacios,
provincia de Pinar del Río, Cuba (A, tercer entrenudo, B Segundo entrenudo, C primer entrenudo, D pedúnculo; a
diciembre 2004, b febrero 2005, c enero 2006, d marzo 2006, e abril 2008, f abril 2009).
88 Agron. Mesoam. 30(1):79-100, enero-abril, 2019
ISSN 2215-3608 doi:10.15517/ma.v30i1.29671Maqueira-López et al.: Growth and yield in rice plants
Figure 5. Variation of the dry matter of rice plants in different organs of the plant after the anthesis in Los Palacios, province of
Pinar del Río, Cuba (C first internode, D peduncle, to December 2004, b February 2005, c January 2006, d March 2006,
e April 2008, f April 2009).
Figura 5. Variación de la masa seca de plantas de arroz en diferentes órganos de la planta después de la antesis en Los Palacios,
provincia de Pinar del Río, Cuba (C primer entrenudo, D pedúnculo; a diciembre 2004, b febrero 2005, c enero 2006, d
marzo 2006, e abril 2008, f abril 2009).
Agron. Mesoam. 30(1):79-100, enero-abril, 2019 89
ISSN 2215-3608 doi:10.15517/ma.v30i1.29671Maqueira-López et al.: Growth and yield in rice plants
Figure 6. Variation of the dry matter of rice plants in different organs of the plant after the anthesis, in Los Palacios, province of
Pinar del Río, Cuba (E: leaf sheaths, F: flag leaf, to December 2004. b February 2005, c January 2006, d March 2006, e
April 2008, f April 2009).
Figura 6. Variación de la masa seca de plantas de arroz en diferentes órganos de la planta después de la antesis, en Los Palacios,
provincia de Pinar del Río, Cuba (E: vainas de las hojas, F: hoja bandera; a diciembre 2004. b febrero 2005, c enero 2006,
d marzo 2006, e abril 2008, f abril 2009).
was found for “rainy” season (Figure 8B), where yield and panicle dry matter, were only positively related to dry
matter decrease in the third internode (Int 3).
Anthesis began at different times after emergence taking into account cultivars, from Reforma to LP5, LP 2
and J 104, and these differences were more pronounced in January 2006, April 2008 and April 2009. Panicle dry
matter accumulation went on for twenty to thirty days, without a regular behavior among cultivars, sowing dates
90 Agron. Mesoam. 30(1):79-100, enero-abril, 2019
ISSN 2215-3608 doi:10.15517/ma.v30i1.29671Maqueira-López et al.: Growth and yield in rice plants
Figure 7. Variation of the dry matter of rice plants in different organs of the plant after the anthesis, in Los Palacios, province of
Pinar del Río, Cuba (G: leaves, H: panicle, to December 2004. b February 2005, c January 2006, d March 2006, e April
2008, f April 2009).
Figura 7. Variación de la masa seca de plantas de arroz en diferentes órganos de la planta después de la antesis, en Los Palacios,
provincia de Pinar del Río, Cuba (G: hojas, H: panícula; a diciembre 2004. b febrero 2005, c enero 2006, d marzo 2006,
e abril 2008, f abril 2009).
or seasons; nevertheless, anthesis began, in all treatments, when LAI was diminishing after attaining its maximum
magnitude, earlier in April 2008 and 2009. There were no substantial differences in magnitude for panicle dry
weight among seasons, and the weight attained as a general mean was in the order of the 1.9 g per spikelet. In
Agron. Mesoam. 30(1):79-100, enero-abril, 2019 91
ISSN 2215-3608 doi:10.15517/ma.v30i1.29671Maqueira-López et al.: Growth and yield in rice plants
Figure 8. Multivariate analysis between yield and variation of dry matter in different organs of the plant after the anthesis, of rice
plants, in Los Palacios province of Pinar del Río Cuba 2004 to 2009 at “ less rainy season”, B “rainy season “, Third
internode (Int. 3), second internode (Int. 2), leaf sheaths (FS), flag leaf (FL), leaves (FB), percentage of variation of the
dry matter of the panicle (P) , dry matter of the panicle (S).
Figura 8. Análisis multivariado entre el rendimiento y la variación de masa seca en diferentes órganos de la planta después de la
antesis, de plantas de arroz, en Los Palacios provincia de Pinar del Río Cuba 2004 a 2009 a “época poco lluviosa”, B
“época lluviosa”, tercer entrenudo (Int. 3), segundo entrenudo (Int. 2), vainas de las hojas (FS), hoja bandera (FL), hojas
(FB), porcentaje de variación de la masa seca de la panícula (P), masa seca de la panícula (S).
planting dates of April 2008 and 2009, the growth of individual spikelet was no completed as the cultivar spikelet
maximum dry matter was attained after samplings were stopped.
Discussion
Yield in rice involves several processes such as plant establishment, foliar surface area, and its duration, the
total number of tillers and the number of fertile ones, grain number establishment and filling, moreover, stem
carbohydrate reserves may be mobilized to grain during the reproductive stage. Meteorological variables interact
with former processes to give a complex scheme for yield formation.
Differences in yield and yield components, such as P/m2 and filled and unfilled grains, among seasons, might
be attributable to the prevalence of temperatures during the growing period, due to the fact that plants in the “rainy”
season developed with higher temperatures.
Different studies stated the variability of Pan m-2 and in general, indicate it was the main cause limiting yield,
together with the number of full grains per panicle (MINAG, 2008). Briceño and Álvarez (2010) pointed out that
panicle related variables, such as primary and secondary branches, number of full grains, grain weight, varied according
to different factors such as planting season, plant nutrition and mainly, cultivars and their growth characteristics.
These results showed the need for adjusting planting densities according to cultivar growth characteristics and
planting season, in a particular locality in order to obtain an adequate number of fertile stems and ensure maximum
yields. Feature informed by Polón et al. (2012), due to the direct relation between the plant number per area and
92 Agron. Mesoam. 30(1):79-100, enero-abril, 2019
ISSN 2215-3608 doi:10.15517/ma.v30i1.29671Maqueira-López et al.: Growth and yield in rice plants
yield (Cuevas, 1999; Polón and Castro, 1999; Yamagata, 1999; Polón et al., 2003), and also indirectly due to the
fact that this variable, as well as the foliar surface per plant, determine the LAI.
Growth variables and parameters related in a different way with yield among crop seasons. In both seasons,
yield was related positively with leaf area duration (LAD) and this variable has two components, its magnitude
and the persistence during the growth period, the former being more important in “dry” season as yield was also
positively related to the maximum value attained for plant foliar surface and the moment leaf area index growth
rate maximum, and the sooner the maximum LAI is obtained and plant dry matter accumulation occurs, the higher
the yield. For “rainy” season a different situation was obtained due to an indirect relation to the foliar surface
magnitude where more important is its persistence and the lesser the net assimilation rate, at different moments of
growth. No other growth-related variables were related to yield, though Aderi (2016) obtained that CGR increased
up to 9-12 weeks after sowing and began to decline at twelve to fifteen weeks after sowing. They obtained a positive
correlation between rice biomass, CGR, and yield.
LAI dynamics showed a decrease at its final stage of growth, when spikelets began to grow, due mainly to leaf
senescence and possible to the translocation of reserves to the growing panicle. The higher LAI values for short
cycle cultivars in the “dry” season are in correspond with higher yield in those cultivars in that season. The former
demonstrates the LAI importance and its relation to yield (Maqueira et al., 2014), supported by the positive relation
between yield and foliar surface attributes for both planting seasons.
Differences in time for the leaf area index maximum (t LAI max) among seasons are related to the plant growth
response to temperature, as established by Moradpour et al. (2013) as the main factor determining growth rate,
being faster in the “rainy” season (higher temperatures) compared with the “dry” season (lower temperatures);
nevertheless, values of LAI maximum (LAI max) were higher in the “dry” season.
The former results empathize that, in “dry” season greater yields will be obtained when plants achieve high
values for maximum LAI, LAD and LAI GR maximum (Figure 3A) and these should be attained earlier during
plant development. While for “rainy” season (Figure 3B), the better positive relation with yield was obtained with
LAD and maximum LAI only. These results are logic due to the role that foliar surface related variables have in
carbon assimilation in the plant.
Differences among cultivars of different cycle were evident for LAI in “dry” season, showing short cycle
cultivars higher values for this variable compared with medium cycle ones. These differences among cultivars were
not shown in “rainy” season. In general, different authors found higher LAI values for short cycle cultivars compared
to medium cycle ones (Polón et al., 2003; 2012), in a 6 to 8 range, higher to the obtained in the present research.
There is a general agreement that LAI values higher than four are adequate for obtaining yields higher than
5 t/ha, in general, higher to the ones found in the present research. The strong relation between yield and LAI has
been observed by different authors informing an increase in yield with the increase in LAI (Yamagata, 1999; Reddy
et al., 2000; Moradpour et al., 2013), although others inform no benefits with the increase on LAI (Cuevas, 1999).
For a specific cultivar in a specific environment, increases in LAI should increase yield to an optimum then, the
mutual shading of leaves diminishes the plant photosynthetic activity and yield, due to the positive relation between
the maximum radiation use efficiency and LAI, nevertheless optimal RUE generally is attained with a LAI of 5 and
a decrease with higher values.
Attention should be payed, not only to LAI, but also to leaf disposition in relation to stem because an excess
of foliar area per unit of cultivated surface, due to an excessive tiller number or heavy nitrogen dressings, may be
the cause of a reduction in yield due to mutual shading (San-oh et al., 2004).
Some authors underlined that high yielding cereals are characterized for an optimal photosynthetic development
during vegetative growth and by a high rate of dry matter production during reproductive stage, which depends on
an optimal LAI, a prolonged foliar activity and a high rate of photosynthesis (Xiao et al., 2007; Soto et al., 2009). In
addition to the above-mentioned factors, for the maximum interaction of solar radiation, it is important to consider
Agron. Mesoam. 30(1):79-100, enero-abril, 2019 93
ISSN 2215-3608 doi:10.15517/ma.v30i1.29671Maqueira-López et al.: Growth and yield in rice plants
the duration of LAI and leaf area duration (LAD) during the plant growing season. Soto and Hernández (2012),
emphasize that high yield in sorghum was related to a LAI and LAD.
The explanation for the negative relation between NAR in different growth periods and yield in “rainy” season
it’s a little more complex. The NAR is an indicator of the plant efficiency to convert radiation energy into biomass,
through the foliar surface and the balance among synthesis and degradation processes. From Figure 3B it can be
deduced that lower values for NAR may be related to higher values in the foliar surface in the moment of LAI GR
max and TDM max accumulation and agrees with the positive relationship found between yield and LAD.
There was no regularity for dry matter per plant among cultivars, planting dates or seasons and none apparent
relation was found between dry matter per plant and LAI. Although in the present research, leaf senesces was
initiated earlier in sowing dates of “rainy” season compared with the dates in “dry” season and maximum dry weight
for spikelets were attained earlier, showing maximum values in the final stages of growth (reproduction stage).
Plant dry matter accumulation is the result of the balance of carbon metabolism between biosynthesis and
catabolized carbon, and taking into account that rice is a C3 plant where carbon losses due to respiration and
photorespiration are greater than in C4 plants, mainly when there is a rise in air temperatures (Gowik and Westhoff,
2011; Evans, 2013). The former could bring limitations in plant growth, mainly when leaf number and size, and
hence plant foliar surface, present limitations carrying a lesser radiation interception and photosynthetic activity
per plant, and radiation use efficiency (RUE).
During reproductive stage, the fate of reserves accumulated during vegetative growth could be respiration,
translocation to other plant parts, or both. Mohammed and Tarpley (2009) found the portion of stem reserves used
in the respiration process is negligible, indicating that plant respiration uses as a substrate, recently synthesized
photo assimilates through photosynthesis. They stated that respiration reaches a maximum value early in the grain
filling process, declining significantly towards the middle of the stage. The former gives rise to the idea that stem
dry weight losses, from anthesis to physiological maturity, is partitioned into growing grains.
During filling grain stage conditions that limited the plant source, such as a lesser foliar surface or conditions
that limit photosynthetic activity, do not fulfill sink demands and a carbon remobilization from the stem to grains is
established, as demonstrated by Esmaeilpour-Jahromi et al. (2012) and Bazargani et al. (2012) for wheat.
Results pointed out to the third internode of rice plant as an important reserve source, which is mobilized and
used for rice grain growth, coinciding with Ehdaie et al. (2006a; 2006b; 2008), who identified, for this purpose, the
basal internodes in wheat plants, then the plant guarantees the sink demands through the mobilization of reserves
previously allocated in different plant organs.
The contribution analysis of stems reserves to different sinks among the plant during the final phases of growth
is complex due to they occupy an intermediate position between the principal sink or source organs, and also taking
into account their different capacity of storage and reserve mobilization.
During grain filling stage the plants developed with warmer temperatures in both seasons, but in “dry” season
with a larger sink capacity, plants mobilized reserves from a greater number of organs than in “rainy” season
(Figures 6 and 7).
Little information is available for rice about genotypic responses to warm night temperature (30 ± 0.5 °C)
in situ (Mohammed and Tarpley, 2014) In temperature-controlled field chambers, with 36 varieties from all over
the world, stated that negative effect of high night temperature on grain yield was partially due to low biomass
and low harvest index, a mild increase in night temperature during the reproductive growth stage reduced yield
was attributed to decrease in grain weight, harvest index, grain filling and spikelets number per panicle. A 4 0C
difference between HNT (30 ± 0.5 °C) and LNT (25 ± 0.5 °C) in the field chamber system causes 10% grain yield
decrease on average of four consecutive seasons.
Several authors demonstrated the negative effects of higher temperatures in grain yield (Kim et al., 2011;
Zhang et al., 2013; Mohammed and Tarpley, 2014). Furthermore, Nyang`aut et al. (2014) using the CERES rice
94 Agron. Mesoam. 30(1):79-100, enero-abril, 2019
ISSN 2215-3608 doi:10.15517/ma.v30i1.29671Maqueira-López et al.: Growth and yield in rice plants
model (v 4.5) of the DSSAT modeling system revealed that increase in both maximum and minimum temperatures
(the latter has a deeper impact) affected the grain yield of two cultivars and increasing solar radiation an increasing
impact of yield was attained in two rice cultivars.
Elevated temperatures influence rice yield and quality mainly during reproductive stages (Jagadish et al., 2007;
2008; 2010). The high temperatures cause yield loss in rice by increasing respiration and energy consumption while
decreasing seed assimilation, grain weight and harvest index (Zakaria et al., 2002; Prasad et al., 2006; She et al.,
2010). Furthermore, warm weather during ripening reduces grain quality (Chun et al., 2009; Kobayashi et al., 2007;
Tabata et al., 2007; Zhu et al., 2013).
Grain filling depends on sink activity under high temperature. Then, attention should be pay to the five enzyme
systems playing a major role in grain rice endosperm development: sucrose synthase, invertase, starch synthase,
glucose diphosphate phosphorylase and starch branching enzyme (Nakamura et al., 1989; Kato, 1995; Yang et al.,
2001; Zhang et al., 2011), among the 33 involved in the process (Nakamura et al., 1989; Zhang et al., 2011).
Radiation regime, interacting with temperature, over the growing season or in different phenological stages, is
the other meteorological aspect to take into account. In general, agricultural yield increases with higher radiation
availability during the growing season, mainly during the final growth stages, overall at the reproductive phase.
Hirai (2008) and Pérez-de-Vida (2010) highlight this phenological stage in relation to radiation, due to the fact that
is the one when rice requirements for radiation are critical. In the present study, “dry” season was characterized
by lower radiation inputs at early stages of growth that “rainy” season, but both ended, at reproductive stage, with
similar values (Figure 1). Dingkuhn et al. (2015) differences in RUE are partly attributable to variation in terminal
senescence which is strongly environment dependent. Huang et al. (2016) results for hybrid rice suggested that
higher Radiation Use Efficiency (RUE) and grain yield can be achieved by improving leaf photosynthetic traits
including chlorophyll a content, Fv/Fm, φPSII and Rubisco content.
Working with autotetraploid and diploid rice including indica and japonica genotypes, Shahid et al. (2013),
in two sowing seasons found that greater amount of solar radiation (14.5 MJ/m2/day mean daily solar radiation),
photothermal quotient and suitable temperature (around 25.6 °C) contributed to higher yield, number of panicles
per plant, filled grains, flag leaf area and dry matter production. A major contribution to sink and biomass
accumulation, was found increased grain yield compared with a season with reduced amounts of solar radiation
(11.8 MJ/m2/day mean daily solar radiation), a daily maximum temperature equal or higher than 35 °C for more
than three consecutive days at flowering.
The results confirm differences in the pattern of panicle dry matter increase between seasons: in “dry” season,
panicle active growth started since anthesis in more than 50% of cases, while in “rainy” season it started ten days
after anthesis where, in general, dry matter of different plant parts diminished, mainly from the third internode
(Figures 4 and 5). This suggests that grain filling was affected by photosynthate availability and it was necessary
to mobilize reserves stored previously in different plant organs, more pronounced in “dry” season. Where the dry
matter decrease of more organs (Int.2, Int.3, foliar sheaths) (Figure 8A) contributed to yield and panicle dry matter.
Several studies have demonstrated that sink activity determines carbohydrate unloading in the phloem, what
could influence the process of reserve utilization from stems and sheaths. Different authors pointed out that sink
activity increases at 10 dda and panicle dry weight increases significantly (Nagata et al., 2001; Okawa et al., 2003;
Yan and Zang, 2006; 2010). Grain yield of rice is determined by sink size (spikelets per unit land area), spikelet
filling percentage and grain weight. Sink size is considered the primary determinant of rice yield.
Currently, limited information is available on the critical factors that explain the yield gap between high and
normal-yielding subtropical environments. Such information would be useful for understanding the constraints of
rice yield potential in the normal-yielding subtropical environment and for determining the plant characteristics
that contribute to high yields. Huang et al. (2013) studies suggest that further improvement in both sink and source
should be possible in the normal-yielding subtropical environment if new rice cultivars are to bred by selection for
Agron. Mesoam. 30(1):79-100, enero-abril, 2019 95
ISSN 2215-3608 doi:10.15517/ma.v30i1.29671Maqueira-López et al.: Growth and yield in rice plants
tillering (tiller number and size), and developing cultivars with high spikelet filling percentage and grain weight
may also be a feasible approach to achieve high rice yield.
Differences in plant growth were found by Agele et al. (2015), in two monthly consecutive sowing dates,
significant for most of the traits measured (root and shoot weight, leaf area, plant height, number of tillers, weights
of panicle and 100-seed and harvest index). Differences in shoot biomass and seed yield production among
sowing dates were explained by a combination of weather parameters, where seed yield was negatively and highly
associated with evaporative demand, thermal time and minimum temperatures.
Panicle number per m2 (Pan/m2), as well as total grains per panicle (G/pan) (Table 1), were lower (although in
an acceptable range) compared with their genetic characterization under optimal growth conditions (Pérez, 1998;
MINAG, 2005), as well as LAI. García et al. (2010), working with J 104 cultivar under semi-controlled conditions
showed the superiority of “dry” season in a relation to plant yield and the results of the present work generalize
the statement to other cultivars differing in growth cycle. Nevertheless, increased grain number per panicle, due
to its strength and activity, could increase demands from the sources, leaves, and reserves allocated previously in
the internodes; in this sense, ambient conditions and plant growth stage, mainly leaves surface at the beginning of
grain filling, play an important role to answer this increment.
It is important to mention that rice plants shown a trait-trait compensation mechanism among yield components
(Dingkuhn et al., 2015), regulated by cultivar characteristics and growing conditions (Morejón et al., 2005; 2012)
and the variability found in yield and its components in the present study could be related with the duration of
phenological phases and prevailing meteorological conditions during their development.
Conclusions
Rice yields were related to vegetative growth traits connected to the foliar surface and its duration and with plant
dry matter traits. The yield was also related to dry matter variation in different organs after anthesis, mainly in the third
internode for both planting seasons. Breeders, in order to increase potential yields, may focus their attention in growth
traits during vegetative stages, such as plant foliar surface and dry matter of the third internode, among others, and
on post-floral physiological processes, namely dynamics of light interception, carbon assimilation and maintenance
burden, trying to combine them in one cultivar for high yielding capacity, which is up to now a major challenge.
Cited literature
Acevedo, M.A., W.A. Castrillo, y U.C. Belmonte. 2006. Origen, evolución y diversidad del arroz. Agron. Trop. 56:151-170.
Aderi, O.S. 2016. Density and cultivar effects on the biomass and Crop Growth Rate of upland rice in Uyo southeastern Nigeria.
Am. J. Exp. Agric. 10:1-11. doi:10.9734/AJEA/2016/20597
Agele, S.O., A.T.B. Aderibigbe, and T.O. Oladitan. 2015. Yield traits and water productivity responses among rice varieties
(Oryza sativa L.) grown in a Fadama ecosystem in Akure, southwestern Nigeria. Am. J. Exp. Agric. 5:435-449.
doi:10.9734/AJEA/2015/6197
Akinbile, C.O. 2013. Assessment of the CERES-Rice model for rice production in Ibadan, Nigeria. Agric. Eng. Int. CIGR J.
15:19-26.
Álvarez, R., M. Pérez, y E. Reyes. 2008. Evaluación comparativa de híbridos y variedades de arroz en los llanos centroccidentales
de Venezuela. Agron. Trop. 58:101-110.
96 Agron. Mesoam. 30(1):79-100, enero-abril, 2019
ISSN 2215-3608 doi:10.15517/ma.v30i1.29671Maqueira-López et al.: Growth and yield in rice plants
Amador, M., y R. Peña. 1986. Tamaño óptimo de muestra para evaluar rendimiento y sus parámetros en el cultivo del arroz en
la Estación Experimental de Jucarito. Cienc. Téc. Agric. Arroz 5(2):41-62.
Bazargani, M.M., M.R. Hajirezaei, G.H. Salekdeh, A.A. Bushehri, M. Falahati-Anbaran, F. Moradi, M.R. Naghavi, and B.
Ehdaie. 2012. A view on the role of metabolites in enhanced stem reserves remobilization in wheat under drought during
grain filling. Autral J. Crop Sci. 6:1613-1623.
Briceño, I., y L.E. Álvarez. 2010. Evaluación de un sistema de preparación de suelo y siembra en el cultivo del arroz (Oryza
sativa L.). Cienc. Téc. Agric. Arroz 28(1):16-24.
Bruinsma, J. 2009. The resource outlook to 2050. In: FAO, editor, Expert Meeting on “How to Feed the World in 2050”. FAO,
Rome, ITA. p. 1-33.
Canfalonieri, R., S. Bregaglio, A.S. Rosenmund, M. Acutis, and I. Savin. 2011. A model for simulating the height of rice plants.
Eur. J. Agron. 34:20-25. doi:10.1016/j.eja.2010.09.003
Chun, A., J. Song, K.J. Kim, and H.J. Lee. 2009. Quality of head and chalky rice and deterioration on eating quality by chalky
rice. J. Crop Sci. Biotechnol. 12:239-244. doi:10.1007/s12892-009-0142-4
CIAT. 1985. Investigación y producción de arroz. Crecimiento y etapas de desarrollo de la planta de arroz. CIAT, Palmira, COL.
Cuevas, A. 1999. Manejo de la soca de arroz. Santa Fé de Bogotá-Colombia. Arroz 48:16-18.
Dingkuhn, M., M.R.C. Laza, U. Kumar, K.S. Mendez, B. Collard, K. Jagadish, R.K. Singh, T. Padolina, M. Malabayabas, E.
Torres, M.C. Rebolledo, B. Manneh, and A. Sow. 2015. Improving yield potential of tropical rice: Achieved levels and
perspectives through improved ideotypes. Field Crops Res. 182:43-59. doi:10.1016/j.fcr.2015.05.025
Ehdaie, B., G.A. Alloush, M.A. Madore, and J.G. Waines. 2006a. Genotypic variation for stem reserves and mobilization in
wheat. I. Postanthesis changes in internode dry matter. Crop Sci. 46:735-746. doi:10.2135/cropsci2005.04-0033
Ehdaie, B., G.A. Alloush, M.A. Madore, and J.G. Waines. 2006b. Genotypic variation for stem reserves and mobilization
in wheat. II. Postanthesis changes in internode water-soluble carbohydrates. Crop Sci. 46:2093-2103. doi:10.2135/
cropsci2006.01.0013
Ehdaie, B., G.A. Alloush, and J.G. Waines. 2008. Genotypic variation in linear rate of grain growth and contribution of stem
reserves to grain yield in wheat. Field Crops Res. 106:34-43. doi:10.1016/j.fcr.2007.10.012
Esmaeilpour-Jahromi, M., A. Ahmadi, J.E. Lunn, A. Abbasi, K. Poustini, and M. Joudi. 2012. Variation in grain weight among
Iranian wheat cultivars: the importance of stem carbohydrate reserves in determining final grain weight under source
limited conditions. AJCS 6:1508-1515.
Evans, L.T., and R.A. Fischer. 1999. Yield potential: its definition, measurement, and significance. Crop Sci. 39:1544-1551.
doi:10.2135/cropsci1999.3961544x
Evans, J.R., and S. von-Caemmerer. 2013. Temperature response of carbon isotope discrimination and mesophyll conductance
in tobacco. Plant Cell Environ. 36:745-756. doi:10.1111/j.1365-3040.2012.02591.x
FAO. 2013. United Nations statistical database. FAOSTAT, ITA.
Fischer, T., D. Byerlee, and G.O. Edmeades. 2014. Crop yields and global food security: Will yield increase continue to feed the
world? ACIAR Monograph. Australian Centre for International Agricultural Research, Canberra, AUST.
García, A., M. Dorado, I. Pérez, y E. Montilla. 2010. Efecto del déficit hídrico sobre la distribución de fotoasimilados en plantas
de arroz (Oryza sativa L.). Interciencia 35:47-54.
García, D., W. Torres, y M. Núñez. 1998. Análisis del crecimiento de callos de Coffea canephora var. Robusta en presencia del
análogo de brasinosteroide MH5. Cultivos Trop. 19:55-60.
Agron. Mesoam. 30(1):79-100, enero-abril, 2019 97
ISSN 2215-3608 doi:10.15517/ma.v30i1.29671Maqueira-López et al.: Growth and yield in rice plants
Gowik, U., and P. Westhoff, 2011. The path from C3 to C4 photosynthesis. Plant Physiol. 155:56-63. doi:10.1104/pp.110.165308
Hernández, A., J.M. Pérez, D. Bosch, y L. Rivero. 1999. Nueva versión de la clasificación genética de los suelos de Cuba.
AGRINFOR, La Habana, CUB.
Hernández, N., y C.F. Soto. 2012. Influencia de tres fechas de siembra sobre el crecimiento y la relación fuente-demanda del
cultivo del maíz (Zea mays L.) Cultivos Trop. 33:28-34.
Hernández, N., y C.F. Soto. 2013. Determinación de índices de eficiencia en los cultivos de maíz y sorgo establecidos en
diferentes fechas de siembra y su influencia sobre el rendimiento. Cultivos Trop. 34:24-29.
Hirai, Y., K. Tagami, K. Hamagami, S. Uchida, S. Inaba, and K. Mori. 2008. Evaluation of environment on rice production for
the rice terraces in Hoshino Village. J. Fac. Agr. Kyushu Univ. 53(1):95-100.
Huang, M., L. Jiang, B. Xia, Y. Zou, P. Jiang, and H. Ao. 2013 Yield gap analysis of super hybrid rice between two subtropical
environments. Aust. J. Crop. Sci. 7:600-608.
Huang, M., S. Shan, X. Zhou, J. Chen, F. Cao, L. Jiang, and Y. Zou. 2016. Leaf photosynthetic performance related to higher
radiation use efficiency and grain yield in hybrid rice. Field Crop Res. 193:87-93. doi:10.1016/j.fcr.2016.03.009
Iizumi, T., H. Sakuna, M. Yokozawa, J.J. Luo, A.J. Challinor, M.E. Brown, G. Sakurai, and T. Yamagata. 2013. Prediction of
seasonal climate-induced variations in global food production. Nat. Clim. Change 2:186-189.
Iizumi, A.T., M. Yokozawa, and M. Nishimori. 2011. Probabilistic evaluation of climate change impacts on paddy rice
productivity in Japan. Clim. Change 107:391-415. doi:10.1007/s10584-010-9990-7
Jagadish, S.V.K., P.Q. Craufurd, and T.R. Wheeler. 2008. Phenotyping parents of mapping populations of rice for heat tolerance
during anthesis. Crop Sci. 48:1140-1146. doi:10.2135/cropsci2007.10.0559
Jagadish, S.V.K., P.Q. Craufurd, and T.R. Wheeler. 2007. High temperature stress and spikelet fertility in rice (Oryza sativa L.)
J. Exp. Bot. 58:1627-1635. doi:10.1093/jxb/erm003
Jagadish, S.V.K., R. Muthurajan, R. Oane, T.R. Wheeler, S. Heur, J. Bennet, and P.Q. Craufurd. 2010. Physiological and
proteomic approaches to address heat tolerance during anthesis in rice (Oryza sativa L.). J. Exp. Bot. 61:143-156.
doi:10.1093/jxb/erp289
Kato, T., 1995. Change of sucrose synthase activity in developing endosperm of rice cultivars. Crop Sci. 35:827-831.
doi:10.2135/cropsci1995.0011183X003500030032x
Kim, J., J. Shon, C.K. Lee, W. Yang, Y. Yoon, W.H. Yang, Y.G. Kim, and B.W. Lee. 2011. Relationship between grain filling
duration and leaf senescence of temperate rice under high temperature. Field Crops Res. 122:207-213. doi:10.1016/j.
fcr.2011.03.014
Kobayashi, A., B. Genliang, Y. Shenghai, and K. Tomita. 2007. Detection of quantitative trait loci for white-back and basal-
white kernels under high temperature stress in japonica rice varieties. Breed. Sci. 57:107-116. doi:10.1270/jsbbs.57.107
Maqueira, L.A., D. González, W. Torres, y S. Masaaki. 2014. Evaluación del comportamiento de variables del crecimiento en
variedades de arroz de tipo Japónica bajo condiciones de secano favorecido. Cultivos Trop. 35:43-49.
Merlos, F.A., J.P. Monzon, J.L. Mercau, M. Taboada, F.H. Andrade, A.J. Hall, E. Jobbagy, K.G. Gassman, and P. Grassini. 2015.
Potential for crop production increase in Argentina through closure of existing yield gaps. Field Crops Res. 184:145-154.
doi:10.1016/j.fcr.2015.10.001
MINAG (Ministerio de Agricultura y Riego). 2005. Instructivo técnico cultivo de arroz. Instituto de Investigaciones del Arroz.
La Habana, CUB.
98 Agron. Mesoam. 30(1):79-100, enero-abril, 2019
ISSN 2215-3608 doi:10.15517/ma.v30i1.29671You can also read