Economic and Strategy Viewpoint - March 2021 - For Financial Intermediary, Institutional and Consultant Use Only. Not for redistribution under any ...
←
→
Page content transcription
If your browser does not render page correctly, please read the page content below
For Financial Intermediary, Institutional and Consultant Use Only.
                            Not for redistribution under any circumstances.

Economic
and Strategy
Viewpoint
March 2021

Q1 2021
Forecast update: will doves cry?
– We have upgraded our forecast for global growth over the next two years with the
main change being seen in 2022 when economies will have more fully normalized
and fiscal and monetary policy remains loose. For this year, upgrades to the US,
UK, Japan and some emerging economies are largely offset by a hefty downgrade
to the Eurozone to leave our global growth forecast little changed.
Keith Wade – Inflation remains a persistent worry for investors, but we continue to see the
Chief Economist and forthcoming pick up as temporary: driven by commodity price base effects with
Strategist
little prospect of the second round developments which would create a problem
for the US Federal Reserve (Fed) and other central banks. Inflation will rise more
persistently when the output gap closes in the second half of 2022.
– We believe that there is sufficient slack in the world economy to absorb a strong
initial rebound in global demand as economies re-open. Nonetheless a dovish
Fed will need a cool head in coming months as inflation rises and it
communicates its new policy framework to investors. An inflation-led market
sell-off is a risk scenario.
– Our other scenarios include a more reflationary outcome with less scarring and
stronger fiscal multipliers and a return of trade wars with stagflationary
consequences. Meanwhile, the ‘vaccine fails’ and ‘China hard landing’ make up
Azad Zangana our deflationary risks.
Senior European
Economist and Strategist
Chart: Contributions to global growth
Contributions to World GDP growth (y/y)
Forecast
8
5.5
6 5.1 5.0 5.4 5.0 5.3
4.6
4.1
3.7 3.6 3.3
3.3 3.3 3.3
4 2.9
2.6
2.9 3.0 2.9 2.6
2
David Rees 0
-0.4
Senior Emerging markets
economist -2
-4
-3.7
-6
2001
2002
2003
2004
2005
2006
2007
2008
2009
2010
2011
2012
2013
2014
2015
2016
2017
2018
2019
2020
2021
2022
US Europe Japan
Rest of advanced China Rest of emerging
World
Piya Sachdeva
Global Economist Source: Schroders Economics Group, February 20, 2021. There is no guarantee that any
forecasts will be realized. Please see additional forecast warnings at the back of the document.
Economic and Strategy Viewpoint March 2021 2Forecast update: will doves cry?
Extra fiscal The Democrat sweep and President Biden's announcement of a $1.9 trillion stimulus
bill (the American Rescue Plan, ARP) has led us to upgrade our forecast for US GDP
stimulus brings
growth with a knock-on effect to the rest of the world. We now expect US GDP to
upward revision
increase 4.7% this year and 4.9% next, an upgrade of just over 1 percentage point
to global GDP for both periods. We believe, the rest of the world benefits through stronger trade
forecast as vaccine and the impact is most noticeable in our 2022 global growth forecasts which are
roll-out continues raised from 4.1% to 4.6% as the world economy normalizes.
For 2021, stronger US fiscal policy helps, but at the global level the gains are largely
offset by a significant downgrade to our Eurozone growth forecast from 5% to 3.5%
as a result of an extended lockdown and a slow vaccine roll-out. Meanwhile, despite
also experiencing an extended lockdown, UK growth is upgraded slightly to 5.3%
assisted by a successful vaccine roll-out. Japan and the emerging markets are also
upgraded, but the net result is that our global growth forecast is only marginally
stronger for 2021 at 5.3%.
Alongside higher growth comes increased inflation, largely driven by higher oil and
commodity prices. We now expect global consumer price inflation to rise 2.6% this year
(previous forecast 2.2%) before easing back to 2.4% in 2022. Given current concerns,
the moderation next year is critical for policy and financial markets, and we discuss
further below. Overall, the forecast moves in a more reflationary direction with
stronger growth and higher inflation than in our last forecast in November.
To put the growth outlook in context, after a fall in global GDP of nearly 4% in 2020
we expect one of the strongest recoveries on record for the world economy, beating
the rebound from the global financial crisis (GFC) in 2009-10 (see chart front page).
There is an elastic band effect here with the key driver being a hand-over from the
industrial sector, which has supported growth so far, to the service sector as the
vaccine brings a degree of normalization and the re-opening of this significant part
of the economy.
One consequence is that the coming recovery is expected to be driven more by the
service-dependent advanced economies than after the GFC. It is also the case that
compared with ten years ago, the emerging economies do not have the benefit of an
enormous fiscal boost from China and, with less access to medical care and vaccines,
are more challenged by the pandemic than their wealthier neighbors.
A new inflationary era?
Concerns are increasing that we are now entering a new inflationary era and we do
expect headline consumer price indices to pick-up sharply in coming months as
powerful base effects feed through. For example, West Texas Intermediate (WTI) oil
prices will be some 200% higher versus March 2020 and food prices are also up year-
on-year as captured by the broader S&P GSCI index (chart 1).
Economic and Strategy Viewpoint March 2021 3Chart 1: Commodity prices to drive inflation spike
6 80
60
4
40
2 20
0 0
-20
-2
-40
-4 -60
2006 2008 2010 2012 2014 2016 2018 2020
US CPI y/y % GSCI Commodity y/y % (rhs) y/y % flat prices
6 300
4 200
2 100
0 0
-2 -100
-4 -200
2006 2008 2010 2012 2014 2016 2018 2020
US CPI y/y % WTI oil y/y % (rhs) y/y % flat prices
Source: Refinitiv, Schroders Economics Group, February 17, 2021. There is no guarantee that any forecasts
will be realized. Please see additional forecast warnings at the back of the document
Commodity
prices to cause The picture is similar to a decade ago when oil and food prices spiked and pushed US
temporary headline inflation over 5%. However, core inflation (Consumer Price Index, CPI
inflation spike excluding food and energy) did not increase and once commodity prices had
stabilized headline inflation fell back significantly (chart 2).
Chart 2: US inflation and oil prices
8
6
4
2
0
-2
1985 1990 1995 2000 2005 2010 2015 2020
CPI y/y % CPI Core y/y %
150
100
50
0
1985 1990 1995 2000 2005 2010 2015 2020
Crude Oil BFO M1 Europe FOB $/BBl
Source: Refinitiv, Schroders Economics Group, February 17, 2021. There is no guarantee that any forecasts
will be realized. Please see additional forecast warnings at the back of the document.
Economic and Strategy Viewpoint March 2021 4We are expecting a similar pattern this time with headline US CPI inflation rising to
3.5% in Q2 before falling back as the base effect washes through. Unless one-off price
shocks feed through into wages and a broader rise in costs, the impact on inflation
will be temporary. Our view is that the economy has spare capacity and can absorb
the increase in demand without causing a second round of price increases. Inflation
tends to decline after recessions and during recoveries as firms get back to work and
use the slack created by the downturn to raise output (chart 2). Productivity
strengthens and unit labor costs fall allowing companies to keep prices competitive.
As a consequence, we see US and world inflation falling back later on in 2021 and into
2022. The time for a more sustained pick-up in inflation will come in the second half of
next year when we estimate that the output gap will have closed in the US and
economic slack will have been largely used up. Although there are pressures on prices
in specific sectors at present it is too early in the cycle to see inflation taking off.
Near-term risks to inflation
We use our scenarios to explore higher inflation risks over the next two years below,
but in the near term we would highlight two additional risks to our dovish view.
One is on pricing once lockdowns are lifted. Bringing the service sector back will add
to capacity, but it may still be restricted. Consequently businesses may find their
productivity hampered by limits, for example on the number of people allowed in a
shop, café or restaurant at any one time. There will also be costs incurred in re-
opening. By contrast, other sectors such as travel and airlines have said they will cut
prices to bring customers back. Business investment held up relatively well during
the downturn, indicating that firms are keen to have capacity when demand returns.
The outcome in the near term is unknown and is made more complicated by the fact
that during the lockdowns it has been difficult to measure prices in the service sector
as many firms have been effectively closed.
The second risk is on the demand side. Inflation bears argue that the surge in
High savings and demand on re-opening will be so great that prices will increase faster and inflation
stimulus cheques will be persistently higher. Concerns center on the amount of pent-up demand in the
will boost demand, US economy where an anticipated run-down in personal sector savings and further
but by how much? fiscal stimulus from President Biden's ARP will boost demand faster than the
economy can re-open.
It is certainly the case that if US households ran down their savings completely on re-
opening there would be inflation as $1.6 trillion of cash hits the economy. In practice
this is likely to be spread out. Much of the increase in savings is concentrated in
higher income households with a lower marginal propensity to consume while
scarring effects mean people will be cautious about returning to normal behavior
particularly given new variants of COVID. We also see a post-COVID economy where
there is more working from home and less travelling, resulting in a restructuring of
much pre-COVID activity creating uncertainty and unemployment.
Economic and Strategy Viewpoint March 2021 5Gauging the fiscal boost
On the fiscal side, President Biden's ARP is passing through Congress at present and
we assume just over half of the $1.9 trillion gets through. However, as with any fiscal
package the degree to which it boosts growth will depend on how much is actually
spent rather than saved or used to buy imported goods from overseas. Such
‘leakages’ reduce the fiscal multiplier and dampen the boost from tax cuts or
spending increases. We have already seen these effects at work following the earlier
CARES package: the personal savings rate shot up and imports rose after stimulus
cheques arrived in bank accounts. The result was that alongside a rise in the savings
rate we saw a sharp deterioration in the trade and current account deficit as US
demand spilled overseas, dampening the domestic boost (chart 3).
Chart 3: US fiscal boost triggers rise in savings and trade deficit
20
18
16
Pandemic has 14
12
exacerbated 10
inequality and the 8
6
task of reaching 4
maximum 2
employment 0
-2
-4
-6
1975 1980 1985 1990 1995 2000 2005 2010 2015 2020
US Current Account % GDP Recession
Personal savings rate, % US Unemployment rate, %
Trade Balance ex oil, % GDP
Source: Refinitiv, Schroders Economics Group, February 15, 2021.
We would expect to see a similar pattern play out in coming months with the savings
rate rising again and the trade deficit widening significantly. Oxford Economics use a
multiplier of 0.35 cents/$ in 2021 for the ARP. The fiscal boost will be strong, but only
around one third of the headline figure will feed into domestic output.
Fed policy
The focus on inflation is understandable as it could undermine one of the key
supports for the market: loose monetary policy. The US Federal Reserve (Fed) has
maintained a dovish stance and has made great efforts to dispel the notion that it is
about to end, or taper, its asset purchase program (QE). The taper tantrum of 2013
still weighs on the US central bank. The coming rise in headline inflation will test its
resolve further, but we have to remember we are dealing with a new policy
framework where there is scope for inflation to run above 2% for a period.
Economic and Strategy Viewpoint March 2021 6Average inflation targeting is designed to avoid the persistent undershoot of core
inflation seen over the past decade. There is also the requirement to reach maximum
employment and although the Fed has not been specific about how this should be
defined, Chair Powell has indicated it goes beyond the narrow U3 measure of
unemployment. There is a strong desire to see the benefits of economic growth
spread more widely to low paid and minority workers, and Powell has pointed out
that the economy is still down by 10 million jobs compared to where it was before the
pandemic. Judging by the disproportionate impact of the pandemic on lower paid
workers where employment rates are down by a fifth, there is much to be done
before maximum employment is reached (chart 4).
Chart 4: US employment by income
10% 15 Nov 2020
5% High Wage
2.9%
employment
0%
Middle Wage
-5% 3.4%
employment
-10%
-15%
Low Wage
-20% 21%
employment
-25%
-30%
-35%
-40%
Jan Feb Mar Apr May Jun Jul Aug Sep Oct Nov Dec Jan Feb
High Wage (>$60K) Middle Wage ($27K-$60K) Low Wage (Regional views
Europe’s growth downgraded
Owing to the more restrictive and longer pandemic-related lockdowns, the forecast for
Europe has been downgraded for this year. Real GDP is still forecast to rise from the
record drop of -6.8% in 2020, but to only 3.6% for 2021, compared to the previous
forecast of 5% (table 1).
Table 1: Schroders GDP forecast for Europe
Europe 2020 2021 2022
downgraded as Eurozone -6.8 3.6 (5.0) 4.8 (4.1)
lockdowns return Germany -5.3 2.7 (4.8) 4.9 (4.5)
France -8.3 4.0 (5.7) 4.7 (3.5)
Italy -8.9 4.1 (5.3) 4.8 (3.9)
Spain -11.0 5.4 (6.5) 6.6 (6.4)
UK -9.9 5.3 (5.0) 5.1 (4.5)
Source: Eurostat, ONS, Refinitiv, Schroders Economics Group. February 17, 2021. There is no
guarantee that any forecasts will be realized. Please see additional forecast warnings at the back of
the document.
As the number of confirmed cases and deaths continued to rise towards the end of
last year, most member states tightened restrictions. For example, in mid-December,
Germany decided to close schools and non-essential retail, with the latest plan to only
open from the start of March.
The good news is that restrictions have so far had a far smaller impact than was
recorded at the start of the pandemic. Eurozone GDP only contracted by 0.6% in the
final quarter of 2020, while Germany managed to eke out 0.1% growth. This should
mean that even with tougher restrictions, only a moderate fall in growth should be
seen in the first quarter, followed by a solid rebound as economies open up.
There are, however, some significant risks. The roll-out of vaccines has been woeful
compared to other advanced economies. According to ourworldindata.org, those in
the European Union that have received a single vaccine dose make up just 5% of the
population as of 15 February. Significantly behind the US at 16% (14 February) or the
UK at 23%.
Another risk is the apparent reluctance to take up vaccines. Recent polling flagged
the French population as being one of the most skeptical, which suggests that even
with the approval and supply issues resolved, poor take-up may mean that herd
immunity is not achieved. This raises the risk of our ‘vaccine fails’ scenario, but
specifically for Europe, as member states are forced to re-introduce lockdowns in
Slow vaccinations winter 2021/2022.
in Europe and
The restrictions appear to be working as the numbers of cases and deaths are falling.
public reluctance
However, the delays in vaccinating the population could mean that Europe misses
have raised the out on the lucrative tourism season this summer, as it largely did last year. Indeed,
risk of further 2021 could potentially be even worse, as travel restrictions have been tightened.
lockdowns Southern member states, especially Spain, could see their recoveries lag behind
others, at least until 2022.
The Eurozone growth forecast for 2022 has been revised up from 4.1% to 4.8%, as by
then, not only should restrictions on activity have been fully removed, but the impact
of fiscal stimulus measures should be seen. Investment in green initiatives and digital
infrastructure is being given priority, but there is bound to be leakage to other parts
of the economy.
Economic and Strategy Viewpoint March 2021 8The forecast for inflation has been revised higher, largely due to the rise in wholesale
oil and gas prices, but also due to the downgrade of the euro versus sterling. Headline
HICP (Harmonized Index of Consumer Prices) inflation is expected to rise to above
2% by the end of 2021, but fall back over 2022 to average 1.2%. Core inflation,
excluding food, alcohol, tobacco and energy, should average 1.1% this year, before
climbing up to 1.5% in 2022. The rise in core inflation is related to tax cuts falling out
of the annual comparison and the lagged impact of administered prices, rather than
any material rise in pricing power. This helps keep monetary policy ultra loose, with
asset purchases as part of the European Central Bank’s quantitative easing program
continuing throughout the forecast, and interest rates kept on hold.
The UK’s vaccine success
The UK’s success so far in the speed of vaccinating its population will help lift
restrictions faster, and aid its economic recovery. Despite pandemic-related
restrictions continuing for longer than previously expected, real GDP growth has
been upgraded for 2021 – from 5% to 5.3%. The first quarter of the year is likely to
see a larger contraction than previously expected, but a rebound in activity should
UK growth more than offset this in the following quarters.
upgraded thanks
Growth for 2022 has also been revised up, from 4.5% to 5.1%. This is partly due to
to improved improved businesses confidence, which should help lift capital spending (capex) as
business spare capacity is utilized, but also driven by an upward revision to our estimate of
confidence household savings, which provides more room for a spending recovery.
and household
As we await the government’s next fiscal statement, we doubt there will be much in
spending
the way of austerity in the next couple of years, though pandemic-related spending
should naturally fall off.
As with other regions, inflation has been revised up for this year. However, due to the
upgrade to sterling, the impact from higher oil prices is partially offset. Consequently,
CPI has only been nudged up by 0.1 percentage point to 1.8% for 2021. Inflation in
2022 has been revised down from 2.1% to 1.5%, as energy inflation rolls off.
As for monetary policy, the low inflation environment should be helpful for growth,
though monetary conditions have tightened recently. Market expectations of
negative interest rates have been priced out as the Bank of England (BoE) largely
ruled out the move in the near term. This has caused bond yields to rise. In addition,
the recent appreciation in sterling is contributing to tighter conditions, which the BoE
is likely to want to offset. As a result, we maintain our forecast for interest rates to be
kept at 0.1% throughout the forecast horizon. However, we are likely to see an end
to the BoE’s quantitative easing program, with current purchases due to end this
year. It would be difficult to explain why it should be extended into 2022 if the
economy is booming as it is forecast to do.
Japan
As a key beneficiary of the strong demand in the US and China, our view continues to
As a beneficiary of
be that Japanese growth will outperform expectations this year and next.
demand from the
US, fiscal stimulus We upgrade our forecast for GDP growth to 3.2% in 2021 and make a few changes to
should boost the profile and drivers of growth. Firstly, renewed restrictions on social activity will
exports and cause growth to slow in the first quarter. Secondly, Japan has been given the green
light on the vaccine later than we had anticipated. So we delay our expectation of the
replace the
re-opening of the service sector and push out the improvement in consumption into
domestic demand
next year. Finally, fiscal stimulus from the US should boost export demand and help
we envisaged to replace the domestic demand we envisaged before. As a result, we upgrade 2022
before to 2.5% for the year as a whole.
Economic and Strategy Viewpoint March 2021 9We raise our forecast for inflation to 0.3% this year, predominantly due to higher
energy prices. Inflation should now turn positive in coming months and core inflation,
though likely to stay weak, should improve in the second half of the year as travel
subsidies are rolled back and growth picks up. Enhancing the sustainability of its yield
curve control policy, we now expect the Bank of Japan (BoJ) to allow more flexibility
in the 10-year Japanese Government Bond (JGB) yield target. This should allow a
faster tapering of purchases of JGBs along with exchange-traded funds (ETFs), which
the BoJ have also hinted at doing. Factoring in the wider asset purchase program,
the balance sheet should still rise.
The latest deterioration in Prime Minister Suga’s approval ratings now means there
is a high chance that he will not gain the support from his party needed to continue
after September. This could slow down the reform agenda and mark a change for
investors, who, for some years, have been used to Japan as source of political stability.
Emerging markets
Strong rebound We continue to expect emerging market (EM) GDP to expand by about 7% this year,
following an expected contraction of 1.6% in 2020. Our expectation for significant
as growth baton
fiscal stimulus to be delivered in the US at a time when vaccines will be rolled out
passes from Asian
around the world means that we have nudged up our forecast for GDP growth next
exporters to the year to 5%. That leaves us above the consensus forecast for growth of 6.5% and 4.7%
rest of EM this year and next.
There is likely to be some rotation in the drivers of EM growth during the year. In the
near term, export-orientated economies in Asia should continue to fare relatively well
on the back of strong demand for manufactured goods. This cyclical recovery is likely
to fade during the course of this year as inventories are replenished, passing on the
growth baton to other economies which will benefit more from the eventual roll-out
of vaccines.
A temporary increase in inflation driven by higher food and energy costs is likely to
put pressure on many EMs' bond markets, especially at the short end of the yield
curve in the months ahead. This looks set to force Brazil's central bank to start raising
interest rates from extremely low levels in the first half of the year. However, most
EM central banks should be able to ride out the storm, instead focusing on the long-
term deflationary drag caused by the spare capacity left from last year's recession.
The greatest risk of surprise rate hikes is in Central Eastern Europe and parts of Asia.
Economic and Strategy Viewpoint March 2021 10China
China to register After being one of the few economies in the world to grow in 2020, China looks set to
extremely strong remain at the top of the growth charts this year with an expansion of about 9%.
However, the annual rate of expansion will be flattered by strong base effects that
growth in Q1, but
look set to lift GDP growth towards 20% year-on-year (y/y) in the first quarter. The
leading indicators
bigger picture is that underlying, quarter-on-quarter rates of growth have already
are rolling over begun to normalize while leading indicators such as the credit impulse, real M1 and
manufacturing purchasing manufacturer's indices (PMIs) have begun to roll over
consistent with a peak in the cyclical recovery in mid-2021.
Chart 5: China's credit impulse appears to be rolling over
% 12m Change, % GDP
1.0 30
1.5
20
2.0
2.5 10
3.0 0
3.5
-10
4.0
4.5 -20
2006 2008 2010 2012 2014 2016 2018 2020
2-Year Government Bond Yield (Adv. 9m, Inverted, LHS)
China Credit Impulse (RHS)
Source: Bloomberg, Refinitiv Datastream, Schroder Economics Group. February 12, 2021. There is
no guarantee current trends will continue.
Activity is not about to collapse and resurgent growth in developed markets will
bolster demand for manufactured goods. But with the authorities withdrawing policy
stimulus we expect China's economy to resume its trend slowdown in the second half
of this year and into 2022, when we expect GDP growth of 5.7%.
India
We upgrade the
India has perplexed investors by escaping a second wave of the coronavirus and the
growth outlook economic recovery is progressing faster than forecasters, including ourselves had
in 2022 as India anticipated. Several activity indicators suggest India is now growing on a year-on-
relaxes fiscal year basis. Following an expected 7.3% y/y contraction in 2020, we expect India to
prudence grow strongly year at 11% y/y, led by a cyclical recovery in consumption and
investment. However, a structural upswing in investment is still unlikely as credit
growth remains subdued. Nonetheless, we upgrade our growth forecast for 2022 to
7%, reflecting the relaxation in fiscal prudence from the Indian government in the
latest budget. We expect inflation to fall from 6.6% to 4.7% this year as food prices
come down. But well above potential growth is likely to cause some underlying
inflationary pressure in 2022. As a result, we now see the Reserve Bank of India (RBI)
raising rates by 50bps in the second half of next year. Though in the coming months,
the RBI will likely help to absorb additional government bond issuance through open
market operations.
Economic and Strategy Viewpoint March 2021 11Brazil
The strong rebound in Brazil's economy during the second half of 2020 began to fizzle
Growth likely
out towards the end of last year. Indeed, a contraction in retail sales in December and
to undershoot
decline in the composite PMI to 48.9 in January suggests that the economy could
expectations as contract in the first quarter of 2021. This is something that we had already factored into
higher inflation our forecasts and is now becoming a more consensus view.
forces interest
rates higher The economy should return to growth once these distortions from the COVID crisis
have passed, and the large services sector will eventually benefit from the roll-out of
vaccines that is now underway. However, the need for fiscal consolidation and high
unemployment is likely to lead to a relatively subdued recovery. We forecast below-
consensus growth of 2.8% this year and 2.5% in 2022.
Another factor that looks set to weigh on the recovery is tighter monetary policy. As we
argued was likely to be the case, a sharp increase in food inflation in recent months
sparked a sell-off in the bond market. That ultimately forced the central bank to
abandon its dovish forward guidance and interest rate hikes look set to commence
soon. The good news for investors is that with food inflation now around its peak and
the subdued economic recovery set to cap upward pressure on core inflation, the 300-
400bp of tightening that appears to be priced into the market may not fully materialize.
As such, attractive entry points into the bond market may not be far away if the
government can keep a lid on fiscal policy.
Chart 6: The spike in Brazilian food inflation may be around its peak
70 25
60
50 20
40 15
30
20 10
10
0 5
-10 0
-20
-30 -5
2000 2002 2004 2006 2008 2010 2012 2014 2016 2018 2020 2022
FAO Food Price Index (BRL Adv 7m, Forecast Based on Futures Prices of
Various Foodstuffs, LHS)
IPCA Food Inflation (% y/y, RHS)
Source: Refinitiv Datastream, Schroder Economics Group. February 12, 2021. There is no guarantee that
any forecasts will be realized. Please see additional forecast warnings at the back of the document
Russia
Higher oil prices
With the spike in COVID cases towards the end of last year now seemingly under
brighten the
control, Russia's economy should continue to recover this year supported by the
outlook rebound in oil prices. Usually conservative fiscal policy could also be eased to quell
recent social unrest. We anticipate GDP growth of 3% this year and 2.3% in 2022.
Like in many parts of the emerging world, a bout of higher inflation that will squeeze
real incomes will be a headwind for growth in the near term. Our leading indicators
suggest that food inflation could climb towards 15% y/y in the months ahead from 7%
y/y in January, which would be enough to temporarily add around 2 percentage points
to the headline rate. Like in Brazil, this forced the central bank to drop its dovish
forward guidance during its February rate-setting meeting, albeit greater credibility
and a higher real interest rate may allow policymakers to look through higher inflation.
Economic and Strategy Viewpoint March 2021 12Scenario analysis
There are a number of risks around our baseline view. The outlook is still very
dependent on the path of the virus and success of the vaccine. We are assuming a
high degree of normalization later this year allowing the service sector to return and
drive the next leg of the recovery. Although we have built some scarring effects into
this outlook, it is possible that new variants of the virus emerge which can dodge the
vaccine and or logistical problems delay the roll out.
Our ‘Vaccine fails’ scenario captures these with the world economy experiencing a
pick-up in cases and renewed restrictions in Q4 this year. The subsequent downturn
would take the world economy back into recession and leave both activity and
inflation lower than in the baseline.
Staying with the deflationary theme we have added a new scenario ‘China hard landing’
China hard
where the authorities in China are too hasty in tightening policy as the economy
landing is a new
rebounds. Activity falls sharply as monetary and fiscal support is withdrawn imparting
scenario where the a sharp slowdown on the economy and the rest of the world with commodity producers
authorities tighten particularly vulnerable. The deflationary screw is given a further turn by the fall in the
too aggressively RMB which cuts the price of exports to the rest of the world.
We continue with the more reflationary ‘Sharp global recovery’ which is based on a
faster and wider vaccine delivery, less scarring and greater fiscal multipliers than in
the baseline. The ‘Trade wars return’ scenario where President Biden pulls together
an international alliance to call China to account and tariffs go up in Q4 next year also
retains its place. The slowdown in trade and increase in tariffs results in a
stagflationary outcome for the world economy.
Finally, we have modified our taper tantrum II scenario to ‘Inflation tantrum’ where the
rise in inflation in coming months is greater than in the baseline and proves more
persistent – a development which causes the Fed to signal an earlier tightening of policy
than markets are expecting. The subsequent rise in bond yields and flight to the USD
hits risk assets and the emerging markets, resulting in a sharper downturn in global
activity. Note that the Fed does not actually tighten policy in this scenario which is
designed to acknowledge the challenge of communication when so much is priced in.
Full details of the scenarios can be found in the table at the back of the document
(page 17). In terms of the impact on activity, our scenario grid shows the variation in
growth and inflation compared to our baseline (chart 10).
Chart 7: Scenarios growth and inflation vs. baseline forecast
Cumulative 2021–2022 Inflation vs. baseline forecast
2
Stagflationary Reflationary
Sharp global
1
Trade wars return recovery (V)
Inflation tantrum
0
Previous baseline Baseline
-1 China hard
Vaccines fail
landing
Deflationary Productivity boost
-2
-5 -4 -3 -2 -1 0 1 2 3 4 5
Cumulative 2021–22 Growth vs. baseline forecast
Source: Schroder Economics Group, February 18, 2021. There is no guarantee that any
forecasts will be realized. Please see additional forecast warnings at the back of the
document.
Economic and Strategy Viewpoint March 2021 13Although the team put the single highest probability on the ‘Sharp global recovery’
scenario, the balance of risks is tilted toward weaker growth with all our other
scenarios bringing weaker output. On inflation though, the risks are skewed toward
the upside so the net balance of risks is in a more stagflationary direction.
Chart 8: Scenario probabilities
8%
59% 6%
10%
8%
9%
Baseline Sharp global recovery (V)
China hard landing Vaccines fail
Trade wars return Inflation tantrum
Source: Schroder Economics Group, February 2021. There is no guarantee that any forecasts will be
realized. Please see additional forecast warnings at the back of the document.
Economic and Strategy Viewpoint March 2021 14Schroders Economics Group: Views at a glance
Macro summary – February 2021
Key points
Baseline
– Global: We continue to expect strong growth of 5.3% this year, helped by loose fiscal and monetary policy and a recovery in
activity following the distribution of vaccines. As economies reopen, the driver of growth should change from the industrial to
the service sector. Though we expect growth in the US and Europe to continue to improve in 2022, slower growth in China and
wider emerging markets means that global growth should moderate to 4.6% in 2022. The rise in commodity prices push up
inflation up to 2.6% 2021 from 1.8% last year, but this should moderate to 2.4% in 2022 as the commodity spike washes through
and core inflation remains contained. US-China tensions should ease, although remain high as China falls short of its phase-1
commitment on purchases from the US.
– US: We expect growth to continue to improve through the year reaching 4.7% this year and 4.9% next year. Following the
democratic sweep, we assume a $1 trillion fiscal stimulus deal, which adds 1pp to growth in 2021 and 2022. Inflation should
peak at 3.4% in Q2 due to energy prices, but core inflation should remain below 2% until the second half of 2022, when we
expect the output gap to close. The Fed should taper QE from q2 next year though keep interest rates at 0.25%.
– Eurozone: Lockdowns should mean another dip (of -1.1% q/q) for eurozone growth in Q1. Though ongoing will drag on 2021
growth, we expect a solid recovery of 3.6%. The EU recovery fund (worth 5.4% GDP) should be disbursed in H2 2021, leading to
increased investment activity in 2022. Growth is forecast to pick-up to 4.8% in 2022, well above trend growth of around 1.5%.
Headline inflation is due to average just 1.7% for 2020 falling to 1.2% in 2022. The ECB is likely to keep interest rates on hold,
and continue its QE program as previously announced.
– UK: With vaccinations advanced, activity should rise sharply at the UK eases restrictions. Fiscal policy is likely to remain very
loose over the forecast horizon, backed QE until the end of this year. This should help achieve strong growth over 2021 (5.3%)
and 2022 (5.1%).
– Japan: The recovery in exports and the industrial sector should continue to drive the Japanese recovery, though the driver of
export demand should shift from China to the US. A boost from fiscal stimulus should help growth reach 3.2% in 2021 and 2.5%
in 2022. The BoJ should stay in perennial easing mode but allow more flexibility in yield curve control and Suga is likely to
struggle in the LDP election.
– EM: We expect EM GDP growth to rebound to 7.0% in 2021, though moderate to 4.9% in 2022. With the exception of China,
which is likely to experience a short bout of deflation, most EMs are likely to experience a transitory period of higher inflation
led by food and energy. But once this passes and growth settles to more normal rates few central banks will be in a rush to
tighten policy, particularly if governments begin to repair fiscal positions.
Risks
– Although the team put the single highest probability on the ‘Sharp global recovery’ scenario the balance of risks is tilted toward
weaker growth with all our other scenarios bringing weaker output. The inflation risks are skewed toward the upside so the net
balance of risks is in a more stagflationary direction.
Chart: World GDP forecast
Contributions to World GDP growth (y/y)
Forecast
8
5.4 5.5 5.3
6 5.1 5.0 5.0
4.1 4.6
3.7 3.6
3.3 3.3 3.3 3.3
4 2.9 2.9 3.0 2.9 2.6
2.6
2
0
-0.4
-2
-4
-3.7
-6
01 02 03 04 05 06 07 08 09 10 11 12 13 14 15 16 17 18 19 20 21 22
US Europe Japan Rest of advanced China Rest of emerging World
Source: Schroders Economics Group, February 20, 2020. There is no guarantee that any forecasts will be realized. Please see additional
forecast warnings at the back of the document.
Economic and Strategy Viewpoint March 2021 15Schroders Baseline Forecast
Real GDP
y/y% Wt (%) 2020 2021 Prev. Consensus 2022 Prev. Consensus
World 100 -3.7 5.3 (5.2) 5.2 4.6 (4.1) 4.1
Advanced* 60.9 -5.0 4.2 (4.1) 4.2 4.4 (3.6) 3.7
US 26.9 -3.5 4.7 (3.8) 4.7 4.9 (3.5) 3.6
Eurozone 16.8 -6.8 3.6 (5.0) 4.4 4.8 (4.1) 4.1
Germany 4.8 -5.3 2.7 (4.8) 3.5 4.9 (4.5) 3.8
UK 3.6 -9.9 5.3 (5.0) 4.2 5.1 (4.5) 5.6
Japan 6.4 -4.9 3.2 (2.9) 2.3 2.5 (1.8) 2.3
Total Emerging** 39.1 -1.6 7.0 (7.0) 6.6 4.9 (4.7) 4.7
BRICs 26.2 -0.1 8.3 (8.2) 7.6 5.3 (4.9) 5.1
China 18.1 2.3 9.0 (9.0) 8.4 5.7 (5.5) 5.5
Inflation CPI
y/y% Wt (%) 2020 2021 Prev. Consensus 2022 Prev. Consensus
World 100 1.8 2.6 (2.2) 2.3 2.4 (2.4) 2.3
Advanced* 60.9 0.7 1.9 (1.2) 1.6 1.6 (1.5) 1.7
US 26.9 1.2 2.6 (1.6) 2.3 2.0 (1.9) 2.2
Eurozone 16.8 0.3 1.7 (0.8) 1.2 1.2 (1.4) 1.2
Germany 4.8 0.4 2.2 (1.4) 1.7 1.6 (1.7) 1.6
UK 3.6 0.9 1.8 (1.7) 1.5 1.5 (2.1) 2.0
Japan 6.4 0.0 0.3 (-0.2) -0.2 0.9 (0.4) 0.4
Total Emerging** 39.1 3.5 3.6 (3.8) 3.4 3.7 (3.8) 3.4
BRICs 26.2 3.2 2.9 (3.2) 2.5 3.2 (3.1) 2.8
China 18.1 2.5 2.0 (2.2) 1.4 2.8 (2.8) 2.1
Interest rates
% (Month of Dec) Current 2020 2021 Prev. Market 2022 Prev. Market
US 0.25 0.25 0.25 (0.25) 0.21 0.25 (0.25) 0.31
UK 0.10 0.10 0.10 (0.10) 0.02 0.10 (0.10) 0.19
Eurozone (Refi) 0.00 0.00 0.00 (0.00) 0.00 (0.00)
-0.56 -0.52
Eurozone (Depo) -0.50 -0.50 -0.50 (-0.50) -0.50 (-0.50)
Japan -0.10 -0.10 -0.10 (-0.10) -0.06 -0.10 (-0.10) -0.05
China 4.35 4.35 4.35 (4.35) - 4.35 (4.35) -
Other monetary policy
(Over year or by Dec) Current 2020 2021 Prev. Y/Y(%) 2022 Prev. Y/Y(%)
US QE ($Tn) 4.0 7.4 8.8 (8.4) 18.9% 9.7 (8.8) 10.2%
EZ QE (€Tn) 2.4 2.7 3.8 (4.2) 40.7% 4.2 (4.5) 10.5%
UK QE (£Bn) 422 725 875 (895) 20.7% 875 (895) 0.0%
JP QE (¥Tn) 557 703 798 (854) 13.6% 841 (903) 5.4%
China RRR (%) 13.50 12.50 12.50 12.50 - 12.50 12.50 -
Key variables
FX (Month of Dec) Current 2020 2021 Prev. Y/Y(%) 2022 Prev. Y/Y(%)
GBP/USD 1.37 1.32 1.44 (1.35) 9.1 1.45 (1.28) 0.7
EUR/USD 1.20 1.18 1.25 (1.21) 5.9 1.27 (1.08) 1.6
USD/JPY 105.2 105.0 107 (107) 1.9 107 (107) 0.0
EUR/GBP 0.88 0.89 0.87 (0.90) -2.9 0.91 (0.84) 4.9
USD/RMB 6.46 6.60 6.50 (6.50) -1.5 6.25 (7.50) -3.8
Commodities (over year)
Brent Crude 60.7 43.3 58.7 (44.8) 35.5 43.5 (36.4) -25.9
Source: Schroders, Thomson Datastream, Consensus Economics, February 2021. There is no guarantee that any forecasts will be realized. Please see
additional forecast warnings at the back of the document
Consensus inflation numbers for Emerging Markets is for end of period, and is not directly comparable.
Market data as at 08/02/2021
Previous forecast refers to December 2020
* Advanced markets: Australia, Canada, Denmark, Euro area, Israel, Japan, New Zealand, Singapore, Sweden, Switzerland,
United Kingdom, United States.
** Emerging markets: Argentina, Brazil, Chile, Colombia, Mexico, Peru, China, India, Indonesia, Malaysia, Philippines, South Korea,
Taiwan SAR, Thailand, South Africa, Russia, Czech Rep., Hungary, Poland, Romania, Turkey, Ukraine, Bulgaria, Croatia, Latvia, Lithuania.
Economic and Strategy Viewpoint March 2021 16Schroders Forecast Scenarios
Cumulative 2020/21 global vs. baseline
Scenario Summary Macro impact Probability* Growth Inflation
Baseline Global GDP growth in 2021 has been marginally upgraded to 5.3% from 5.2% and we remain above In developed markets, we expect the US and UK to achieve herd immunity first, with the eurozone and
consensus. This is predominantly driven by an upgrade to our expectations for US growth as we factor in Japan lagging behind. While this results in a boost to activity in the former, the latter are still supported
additional fiscal stimulus. Against this we make a significant downward revision to eurozone growth by fiscal stimulus and stronger global trade. In developed markets, the US is expected to surpass pre-
following longer than expected lockdowns. Our forecast for China is unchanged although other EM's are COVID-19 GDP levels at the end of Q2 this year though the output gap should not close until Q2 next year
upgraded. In terms of the shape of the forecast, we continue to expect strong growth, helped by loose when unemployment falls to 3.5%. Though energy prices should push headline inflation higher in 21Q2,
fiscal and monetary policy and a recovery in activity following the distribution of vaccines. Though we this will be temporary. Meanwhile, we expect underlying inflationary pressures to be fairly weak allowing
expect growth in the US and Europe to continue to improve in 2022, slower growth in China and wider monetary policy to remain easy. The Fed, ECB, BoE and BoJ are expected to keep interest rates on hold 59% - -
emerging markets means that global growth should moderate to 4.6% in 2022. US-China tensions should through the rest of 2021 and 2022 and continue quantitative easing as previously stated. We now expect
ease somewhat in the Biden era but should remain high as China falls short of its phase 1 commitment the Fed to taper QE in q2 next year. China is forecast to keep rates on hold at 4.35% and the RRR at
on purchases from the US. On the inflation side, firmer oil prices push global inflation up to 2.6% in 2021 12.5%. We expect Brazil to raise rates this year and India and Russia to join in hiking next year.
from 1.8% in 2020. Thereafter inflation should moderate as the commodity spike washes through and
core inflation remains contained.
1. Sharp global Global growth rebounds sharply as a vaccine is distributed faster than expected allowing activity to Reflationary: The US surpasses its pre-COVID 19 level next quarter and closes its output gap in the second
recovery (V) normalise. Fiscal and monetary policy prove more effective in boosting growth once economies open up. half of this year. Inflation is higher as commodity prices pick up (oil reaches $75/ barrel). In most
Business and household confidence returns rapidly with little evidence of scarring and government countries, monetary policy is tightened by the end of 2021 and fiscal policy support is reined in. 8% +2.2% +1.5%
policies are successful in preventing output being lost permanently. This is the closest scenario to a "V
shape" recovery.
2. China hard landing The strong rebound in economic activity, coupled with concerns about rising real estate and asset prices Deflationary: Weaker growth in China presents a demand shock for the rest of the world, primarily
leads to an aggressive tightening of policy as the Chinese authorities continue to focus on deleveraging. through demand for commodities. Inflation is also lower as a result of lower growth and lower commodity
The credit impulse falls sharply to a trough in mid-2021, with the usual lags to domestic demand prices. Fears of a hard landing in China also spark a bout of risk aversion that is negative for Emerging 6% -1.3% -0.8%
meaning that economic growth troughs at just 1.5% y/y in Q2 2022 Market economies and markets.
3. Vaccines fail Despite the vaccines, the population is unable to reach herd immunity and coronavirus continues to rise Deflationary: Growth is badly hit in this year and as lockdowns ease, the recovery in 2022 is more fragile
as a variant of the virus returns. Governments across the world are forced to lock-down again this coming due to the hit to confidence to both firms and businesses. Inflation is also dragged lower owing to further
winter, before re-opening in 2022 weakness in demand and falling commodity prices. Policy makers loosen fiscal and monetary policy
further, the latter through QE. As in 2020, the authorities in China are able to effectively control the fresh
10% -4.0% -0.8%
outbreak of COVID and deliver a large and effective economic support package, ensuring that the
economy gets back on track during the course of 2022. However, many other EMs such as Brazil and India
are left with little room for manoeuvre meaning that they suffer badly and are slow to recover.
4. Trade wars return Once President-elect Biden has settled in and rekindled the United States’ relationship with Europe and Stagflationary: Higher import and commodity prices as countries attempt to stockpile push inflation
other allies, he leads a multilateral stance against China's anti-competitive trade policy. China’s failure to higher. Weaker trade weighs on growth. Capital expenditure is also hit by the increase in uncertainty and
reach purchasing commitments of US goods agreed in the phase 1 deal add to tensions. Tariffs on the need for firms to review their supply chains. Central banks focus on the weakness of activity rather
Chinese goods are hiked in Q4 2021 by the US, Europe and Japan. China retaliates in kind and tariffs then than higher inflation and ease policy by more than in the baseline. In China, the renminbi is allowed to
remain at these levels through 2022. weaken in order to absorb some of the increase in tariffs, however more punitive levies and supply chain
8% -0.9% +0.6%
disruption cause economic growth to slow. Small, open EMs in Asia also suffer from weaker trade, but the
negative impact is less on the relatively closed EMs such as Brazil and India. Some EMs may in the long-
term benefit from re-orientation of supply chains. Oil producers such as Russia receive some short-term
benefit from higher crude prices as energy-importing countries stock up.
5. Inflation tantrum Better than expected growth leads to higher inflation, particularly in the US. Bond investors become Deflationary: Central banks do their best to step in by increasing QE but the higher risk premium persists.
uneasy as they speculate on a premature withdrawal of liquidity from the Fed. As a result, US Treasury The tightening in financial conditions for the government and corporates hurts growth as confidence
yields spike and this triggers an increase in risk aversion. Investors pull back from funding risky assets takes a hit and there is a pull back in corporate capital expenditure. An increase in bankruptcies pushes
leading to a credit event. unemployment higher. A “sudden stop” and reversal of capital flows to the emerging markets causes
exchange rates to depreciate sharply, forcing central banks to raise interest rates. Capital flight forces 9% -0.6% +0.2%
current account deficits to close in EMs such as Brazil and India, matched by declines in domestic
demand that weigh on overall GDP growth. Weaker growth would also cause inflation to be lower than in
our baseline scenario.
6. Other 0% - -
*Scenario probabilities are based on mutually exclusive scenarios. There is no guarantee that any forecasts will be realized. Please see additional forecast warnings at the back of the document.
Economic and Strategy Viewpoint March 2021 17Updated forecast charts – Consensus Economics
For the EM, EM Asia and Pacific ex Japan, growth and inflation forecasts are GDP weighted and calculated using
Consensus Economics forecasts of individual countries.
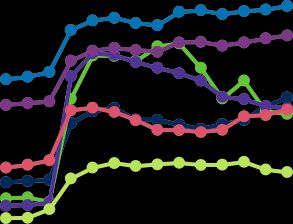
Chart A: GDP consensus forecasts
2021 2022
10% 10%
8% 8%
6% 6%
4% 4%
2% 2%
0% 0%
J M M J S N J M M J S N J F M A M J J A S OND
2020 2021 2021
US UK Eurozone Pac ex JP EM Asia JP EM
Chart B: Inflation consensus forecasts
2021 2022
4%
4%
3% 3%
2% 2%
1% 1%
0% 0%
-1% -1%
JFMAMJJASONDJFMAMJJASOND J F M A M J J A S O N D
2020 2021 2021
US UK Eurozone Pac ex JP EM Asia JP EM
Source: Consensus Economics (February 2021), Schroders. There
is no guarantee that any forecast will be realized.
Pacific ex. Japan: Australia, Hong Kong, New Zealand, Singapore.
Emerging Asia: China, India, Indonesia, Malaysia, Philippines, South Korea, Taiwan, Thailand.
Emerging markets: China, India, Indonesia, Malaysia, Philippines, South Korea, Taiwan, Thailand, Argentina, Brazil, Colombia, Chile,
Mexico, Peru, South Africa, Czech Republic, Hungary, Poland, Romania, Russia, Turkey, Ukraine, Bulgaria, Croatia, Estonia,
Latvia, Lithuania.
The views and opinions contained herein are those of Schroders’ Economics team, and may not necessarily represent views
expressed or reflected in other Schroders communications, strategies or funds. This document is intended to be for information
purposes only and it is not intended as promotional material in any respect. The material is not intended as an offer or solicitation
for the purchase or sale of any financial instrument. The material is not intended to provide, and should not be relied on for,
accounting, legal or tax advice, or investment recommendations. Information herein is believed to be reliable but Schroders does
not warrant its completeness or accuracy. Reliance should not be placed on the views and information in the document when
making individual investment and/or strategic decisions. Past performance is not a reliable indicator of future results, prices of
shares and the income from them may fall as well as rise and investors may not get back the amount originally invested. The
opinions included in this document include some forecasted views. We believe that we are basing our expectations and beliefs on
reasonable assumptions within the bounds of what we currently know. However, there is no guarantee that any forecasts or
opinions will be realized.
Economic and Strategy Viewpoint March 2021 18Schroder Investment Management North America Inc.
7 Bryant Park, New York, NY 10018-3706
schroders.com/us
schroders.com/ca
Important information: The views and opinions contained herein are those of Keith Wade, Chief Economist and Strategist, Azad
Zangana, Senior European Economist and Strategist, David Rees, Senior Emerging Market Economist and Piya Sachdeva, Japan
Economist and do not necessarily represent Schroder Investment Management North America Inc.’s house views. These views are
subject to change. This newsletter is intended to be for information purposes only and it is not intended as promotional material in any
respect. The material is not intended as an offer or solicitation for the purchase or sale of any financial instrument mentioned in this
commentary. The material is not intended to provide, and should not be relied on for accounting, legal or tax advice, or investment
recommendations. Information herein has been obtained from sources we believe to be reliable but Schroder Investment Management
North America Inc. (SIMNA Inc.) does not warrant its completeness or accuracy. No responsibility can be accepted for errors of facts obtained
from third parties. Reliance should not be placed on the views and information in the document when taking individual investment and / or
strategic decisions. The information and opinions contained in this document have been obtained from sources we consider to be reliable. No
responsibility can be accepted for errors of fact obtained from third parties. The opinions stated in this document include some forecasted
views. We believe that we are basing our expectations and beliefs on reasonable assumptions within the bounds of what we currently know.
However, there is no guarantee that any forecasts or opinions will be realized. SIMNA Inc. is registered as an investment adviser with the US
Securities and Exchange Commission and as a Portfolio Manager with the securities regulatory authorities in Alberta, British Columbia,
Manitoba, Nova Scotia, Ontario, Quebec and Saskatchewan. It provides asset management products and services to clients in the United
States and Canada. Schroder Fund Advisors LLC (“SFA”) markets certain investment vehicles for which SIMNA Inc. is an investment adviser.
SFA is a wholly-owned subsidiary of SIMNA Inc. and is registered as a limited purpose broker-dealer with the Financial Industry Regulatory
Authority and as an Exempt Market Dealer with the securities regulatory authorities in Alberta, British Columbia, Manitoba, New Brunswick,
Nova Scotia, Ontario, Quebec, Saskatchewan, Newfoundland and Labrador. This document does not purport to provide investment advice
and the information contained in this material is for informational purposes and not to engage in a trading activities. It does not purport to
describe the business or affairs of any issuer and is not being provided for delivery to or review by any prospective purchaser so as to assist
the prospective purchaser to make an investment decision in respect of securities being sold in a distribution. SIMNA Inc. and SFA are
indirect, wholly-owned subsidiaries of Schroders plc, a UK public company with shares listed on the London Stock Exchange. Further
information about Schroders can be found at www.schroders.com/us or www.schroders.com/ca.
Schroder Investment Management North America Inc.
For more information, visit www.schroders.com/us or www.schroders.com/caYou can also read