State of Mineral Finance 2019: At the Crossroads - Prospectors & Developers Association ...
←
→
Page content transcription
If your browser does not render page correctly, please read the page content below
State of Mineral Finance 2019:
At the Crossroads

            PROSPECTORS &
            DEVELOPERS
            ASSOCIATION
            OF CANADA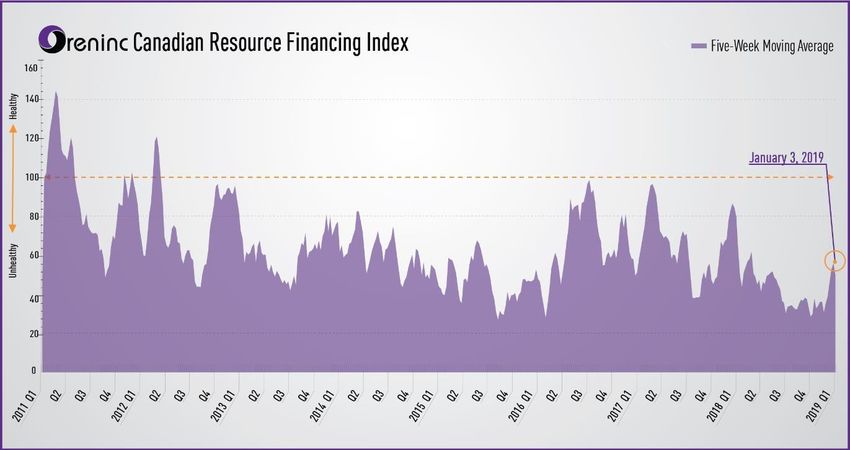
State of Mineral Finance 2019: At the Crossroads

State of Mineral Finance 2019: At the Crossroads
State of Mineral Finance 2019: At the Crossroads report provides a retrospective of recent
financing dynamics for the mineral exploration and mining industry through the end of 2018 with
analysis based on a broad set of financial metrics and industry-related data.

The aim of this report is to provide current information on mineral industry financing activity, which
can act as a basis of knowledge for PDAC members and mineral industry participants, as well as
to provide beneficial insight for future decision making.

About the organizations
Prospectors & Developers Association of Canada (PDAC): PDAC is the leading voice of the
mineral exploration and development community. With over 8,000 members around the world,
PDAC’s mission is to promote a globally-responsible, vibrant and sustainable mineral sector
that encourages leading practices in technical, operational, environmental, safety and social
performance. PDAC is known worldwide for its annual PDAC Convention—the premier international
event for the industry—that has attracted over 25,000 people from 135 countries in recent years and
will next be held March 1-4, 2020 in Toronto. Please visit www.pdac.ca

Oreninc: Oreninc.com is North America’s leading provider of relevant financing information in the
junior commodities space. Since 2011, the company has been keeping track of financings in the
junior mining as well as oil and gas space. Logging all relevant deal and company information into
its proprietary database, called the Oreninc Deal Log, Oreninc quickly became the go-to website
in the mining financing space for investors, analysts, fund managers and company executives
alike. Please visit www.oreninc.com

                                         PROSPECTORS &
                                         DEVELOPERS
                                         ASSOCIATION
                                         OF CANADA

                                                                                                                2
State of Mineral Finance 2019: At the Crossroads
Executive Summary
From a broad perspective, global mineral exploration activity expanded in 2018, maintaining the
positive trajectory established in 2017 after a multi-year contraction in activity from 2012-2016.
Mineral exploration spending in Canada jumped by approximately 31% in 2018 versus one year
prior, reflecting the second largest regional increase after the United States at 34%. The rebound in
North American activity well outpaced the rest of the world, which posted a year-over-year spending
increase of approximately 13%. Although exploration activity climbed in 2018, industry financing
weakened notably, stalling the investment rebound established over the previous two years.
In last year’s PDAC’s report — State of Mineral Finance 2018: Gaining Momentum — 2017’s
rebound in mineral exploration activity was attributed to increased investment that directly related to
wide-scale improvement in metal prices in 2016-2017. Expanding global growth expectations were a
central driver for base metal price appreciation and a weak U.S. dollar during 2016-2017 drove positive
precious metal price action over the two years. However, these dynamics shifted during 2018.
IMF global GDP growth expectations for 2018 and 2019 have since been revised downward by
roughly 5% and 10%, respectively. In similar fashion, all base metals trended lower over the course of
2018 with price drops ranging from 6% to 21%. The U.S. dollar index (DXY) climbed nearly 7%, and
its strong inverse relationship with precious metals was maintained in 2018 as the monthly average
gold price fell +5% from January to December, establishing the first negative annual price trend for
gold since 2015. Surging prices of the two leading battery metals (cobalt and lithium) also lost steam
in 2018, most likely due to supply and demand fundamentals supplanting recent market speculation.
Metal price weakness is likely the main driver behind declining 2018 investment. Mineral industry
equity financing in 2018 dropped by nearly 35% from a year earlier to establish a new decade low
for both total value raised and number of transactions completed. While funding specifically for
exploration remained above 2013 and 2015 lows, in 2018 it declined by more than 50% from a year
earlier to represent less than ¼ of peak investment levels established in 2012. Also concerning is the
40% year-over-year drop in bought-deal financing for junior explorers to $0.6 billion in 2018, which is
the lowest figure recorded in a decade and hints at a lack of sector confidence by large brokerages.
Growth in passive investments and alternate high-risk sectors (i.e. cannabis, blockchain) has also
contributed to a recent drop in mineral industry investment. Strategic reinvestment by major mining
companies has offset some of these impacts with sector reinvestment increasing by more than
fivefold from 2013-2017. However, margin expansion through higher metal prices or cost reductions
may be necessary to sustain reinvestment by major miners into junior explorers.
Canada’s mineral industry was better shielded but not immune from declining investment as both
equity and exploration-specific financing fell by approximately 25% year-over-year on domestic
exchanges. With a more moderate slowdown, Canada represented a larger proportion of 2018 global
exploration. However, domestic activity remains well below recent peaks. While ‘grassroots’ spending
edged up in nominal terms, the proportion of grassroots exploration spending continues to decline
both at home and abroad, reaching a decade low in 2018.
PDAC advocacy posted a major win in 2018 with renewal of the Mineral Exploration Tax Credit
(METC) for five years. PDAC is currently engaged with the Canada Revenue Agency (CRA) in an
effort to improve clarity of Canadian Exploration Expense (CEE) eligibilities for industry participants
and with the Canadian Securities Administrators (CSA) and the Ontario Securities Commission
(OSC) to streamline processes and reduce capital costs through a burden-reduction project. While
PDAC’s advocacy efforts are aimed towards increasing access to capital and mineral industry
investment, the trajectory of commodity prices in 2019 will likely have the largest influence on mineral
industry financing and exploration activity levels over the coming 12-18 months.
3State of Mineral Finance 2019: At the Crossroads
Table of Contents
Executive Summary ◆◆ ◆ ◆ ◆ ◆ ◆ ◆ ◆ ◆ ◆ ◆ ◆ ◆ ◆ ◆ ◆ ◆ ◆ ◆ ◆ ◆ ◆ ◆ ◆ ◆ ◆ ◆ ◆ ◆ ◆ ◆ ◆ ◆ ◆ ◆ ◆ ◆ ◆ ◆ ◆ ◆ ◆ ◆ ◆ ◆ ◆ ◆ ◆ ◆ ◆ ◆ ◆ ◆ ◆ ◆ ◆ ◆ ◆ ◆ ◆ ◆ ◆ ◆ ◆ ◆ ◆ ◆ ◆ ◆ ◆ ◆ ◆ ◆ ◆ ◆ ◆ ◆ ◆ ◆ ◆ ◆ ◆ ◆ ◆ ◆ ◆ ◆ ◆ ◆ ◆ ◆ ◆ ◆ ◆ ◆ ◆ ◆ ◆ ◆ ◆ ◆ ◆ ◆ ◆ ◆ ◆ ◆ ◆ ◆ ◆ 3
Table of Contents ◆ ◆◆◆◆◆◆◆◆◆◆◆◆◆◆◆◆◆◆◆◆◆◆◆◆◆◆◆◆◆◆◆◆◆◆◆◆◆◆◆◆◆◆◆◆◆◆◆◆◆◆◆◆◆◆◆◆◆◆◆◆◆◆◆◆◆◆◆◆◆◆◆◆◆◆◆◆◆◆◆◆◆◆◆◆◆◆◆◆◆◆◆◆◆◆◆◆◆◆◆◆◆◆◆◆◆◆◆◆◆◆◆◆◆◆◆ 4
Introduction ◆◆ ◆ ◆ ◆ ◆ ◆ ◆ ◆ ◆ ◆ ◆ ◆ ◆ ◆ ◆ ◆ ◆ ◆ ◆ ◆ ◆ ◆ ◆ ◆ ◆ ◆ ◆ ◆ ◆ ◆ ◆ ◆ ◆ ◆ ◆ ◆ ◆ ◆ ◆ ◆ ◆ ◆ ◆ ◆ ◆ ◆ ◆ ◆ ◆ ◆ ◆ ◆ ◆ ◆ ◆ ◆ ◆ ◆ ◆ ◆ ◆ ◆ ◆ ◆ ◆ ◆ ◆ ◆ ◆ ◆ ◆ ◆ ◆ ◆ ◆ ◆ ◆ ◆ ◆ ◆ ◆ ◆ ◆ ◆ ◆ ◆ ◆ ◆ ◆ ◆ ◆ ◆ ◆ ◆ ◆ ◆ ◆ ◆ ◆ ◆ ◆ ◆ ◆ ◆ ◆ ◆ ◆ ◆ ◆ ◆ ◆ ◆ ◆ ◆ ◆ ◆ ◆ ◆ ◆ ◆ ◆ ◆ ◆ ◆ ◆ ◆ 5
SECTION 1: The Macroeconomic Environment and Metal Prices ◆◆ ◆ ◆ ◆ ◆ ◆ ◆ ◆ ◆ ◆ ◆ ◆ ◆ ◆ ◆ ◆ 7
Global Economic Uncertainty is Rising ◆ ◆◆◆◆◆◆◆◆◆◆◆◆◆◆◆◆◆◆◆◆◆◆◆◆◆◆◆◆◆◆◆◆◆◆◆◆◆◆◆◆◆◆◆◆◆◆◆◆◆◆◆◆◆◆◆◆◆◆◆◆◆◆◆◆◆◆◆ 7
Metal Prices Lose Footing ◆◆ ◆ ◆ ◆ ◆ ◆ ◆ ◆ ◆ ◆ ◆ ◆ ◆ ◆ ◆ ◆ ◆ ◆ ◆ ◆ ◆ ◆ ◆ ◆ ◆ ◆ ◆ ◆ ◆ ◆ ◆ ◆ ◆ ◆ ◆ ◆ ◆ ◆ ◆ ◆ ◆ ◆ ◆ ◆ ◆ ◆ ◆ ◆ ◆ ◆ ◆ ◆ ◆ ◆ ◆ ◆ ◆ ◆ ◆ ◆ ◆ ◆ ◆ ◆ ◆ ◆ ◆ ◆ ◆ ◆ ◆ ◆ ◆ ◆ ◆ ◆ ◆ ◆ ◆ ◆ ◆ ◆ ◆ ◆ ◆ ◆ ◆ ◆ ◆ ◆ ◆ ◆ ◆ ◆ 9
SECTION 2: Financing Trends ◆◆ ◆ ◆ ◆ ◆ ◆ ◆ ◆ ◆ ◆ ◆ ◆ ◆ ◆ ◆ ◆ ◆ ◆ ◆ ◆ ◆ ◆ ◆ ◆ ◆ ◆ ◆ ◆ ◆ ◆ ◆ ◆ ◆ ◆ ◆ ◆ ◆ ◆ ◆ ◆ ◆ ◆ ◆ ◆ ◆ ◆ ◆ ◆ ◆ ◆ ◆ ◆ ◆ ◆ ◆ ◆ ◆ ◆ ◆ ◆ ◆ ◆ ◆ ◆ ◆ ◆ ◆ ◆ ◆ ◆ ◆ ◆ ◆ ◆ ◆ ◆ ◆ ◆ ◆ ◆ ◆ ◆ ◆ ◆ ◆ ◆ 14
Global Financing Recovery Stalls in 2018 ◆◆ ◆ ◆ ◆ ◆ ◆ ◆ ◆ ◆ ◆ ◆ ◆ ◆ ◆ ◆ ◆ ◆ ◆ ◆ ◆ ◆ ◆ ◆ ◆ ◆ ◆ ◆ ◆ ◆ ◆ ◆ ◆ ◆ ◆ ◆ ◆ ◆ ◆ ◆ ◆ ◆ ◆ ◆ ◆ ◆ ◆ ◆ ◆ ◆ ◆ ◆ ◆ ◆ ◆ ◆ ◆ ◆ ◆ ◆ ◆ 14
Financing Landscape in Canada Contracts ◆ ◆◆◆◆◆◆◆◆◆◆◆◆◆◆◆◆◆◆◆◆◆◆◆◆◆◆◆◆◆◆◆◆◆◆◆◆◆◆◆◆◆◆◆◆◆◆◆◆◆◆◆◆◆◆◆◆ 16
Canada’s Junior Funding Evaporating ◆◆ ◆ ◆ ◆ ◆ ◆ ◆ ◆ ◆ ◆ ◆ ◆ ◆ ◆ ◆ ◆ ◆ ◆ ◆ ◆ ◆ ◆ ◆ ◆ ◆ ◆ ◆ ◆ ◆ ◆ ◆ ◆ ◆ ◆ ◆ ◆ ◆ ◆ ◆ ◆ ◆ ◆ ◆ ◆ ◆ ◆ ◆ ◆ ◆ ◆ ◆ ◆ ◆ ◆ ◆ ◆ ◆ ◆ ◆ ◆ ◆ ◆ ◆ ◆ ◆ ◆ ◆ ◆ 19
SECTION 3: Exploration Trends ◆ ◆◆◆◆◆◆◆◆◆◆◆◆◆◆◆◆◆◆◆◆◆◆◆◆◆◆◆◆◆◆◆◆◆◆◆◆◆◆◆◆◆◆◆◆◆◆◆◆◆◆◆◆◆◆◆◆◆◆◆◆◆◆◆◆◆◆◆◆◆◆◆◆◆◆◆◆◆◆◆◆◆◆ 26
Financing for Mineral Exploration Drops ◆◆ ◆ ◆ ◆ ◆ ◆ ◆ ◆ ◆ ◆ ◆ ◆ ◆ ◆ ◆ ◆ ◆ ◆ ◆ ◆ ◆ ◆ ◆ ◆ ◆ ◆ ◆ ◆ ◆ ◆ ◆ ◆ ◆ ◆ ◆ ◆ ◆ ◆ ◆ ◆ ◆ ◆ ◆ ◆ ◆ ◆ ◆ ◆ ◆ ◆ ◆ ◆ ◆ ◆ ◆ ◆ ◆ ◆ ◆ ◆ ◆ ◆ ◆ 26
Global Exploration Spending at Odds With Financing ◆◆ ◆ ◆ ◆ ◆ ◆ ◆ ◆ ◆ ◆ ◆ ◆ ◆ ◆ ◆ ◆ ◆ ◆ ◆ ◆ ◆ ◆ ◆ ◆ ◆ ◆ ◆ ◆ ◆ ◆ ◆ ◆ ◆ ◆ ◆ 27
Canadian Exploration Continues to Climb ◆ ◆◆◆◆◆◆◆◆◆◆◆◆◆◆◆◆◆◆◆◆◆◆◆◆◆◆◆◆◆◆◆◆◆◆◆◆◆◆◆◆◆◆◆◆◆◆◆◆◆◆◆◆◆◆◆◆◆◆◆ 30
SECTION 4: Fiscal Incentives and Capital Markets Reforms ◆ ◆◆◆◆◆◆◆◆◆◆◆◆◆◆◆◆◆◆◆ 33
The Flow-through Share Regime ◆◆ ◆ ◆ ◆ ◆ ◆ ◆ ◆ ◆ ◆ ◆ ◆ ◆ ◆ ◆ ◆ ◆ ◆ ◆ ◆ ◆ ◆ ◆ ◆ ◆ ◆ ◆ ◆ ◆ ◆ ◆ ◆ ◆ ◆ ◆ ◆ ◆ ◆ ◆ ◆ ◆ ◆ ◆ ◆ ◆ ◆ ◆ ◆ ◆ ◆ ◆ ◆ ◆ ◆ ◆ ◆ ◆ ◆ ◆ ◆ ◆ ◆ ◆ ◆ ◆ ◆ ◆ ◆ ◆ ◆ ◆ ◆ ◆ ◆ ◆ ◆ ◆ ◆ 33
Regulatory Developments in Canadian Capital Markets ◆ ◆◆◆◆◆◆◆◆◆◆◆◆◆◆◆◆◆◆◆◆◆◆◆◆◆◆◆◆◆◆ 37
4State of Mineral Finance 2019: At the Crossroads
Introduction
As the leading voice of Canada’s mineral exploration and development industry, the Prospectors
& Developers Association of Canada (PDAC) undertakes numerous initiatives to support efforts
to raise capital for exploration and development. The State of Mineral Finance 2019: At the
Crossroads report focuses largely on financial aspects of mineral exploration up to the end of
2018. The report was produced by PDAC in collaboration with Oreninc.
This report is divided into four key sections:
1) The macroeconomic environment and metal prices
2) Financing trends
3) Exploration trends
4) The fiscal and regulatory landscape
Section 1 includes a macroeconomic overview and provides background on key factors that
impact the business environment under which the mineral sector operates, including fluctuations
in the demand for raw materials that significantly affect metal prices. Due to the strong correlation
of metal prices to the level of activity in the mineral sector, it also includes a brief overview of key
metal prices.
Section 2 addresses financing trends, beginning with an overview of global and Canadian
financing trends followed by a focused overview of financing trends among junior mining
companies in Canada, provided by Oreninc.
Section 3 first informs the readers regarding the state of financing for exploration activities, and
following that provides an overview of trends for exploration expenditures, disaggregated by
commodity, region, stage of exploration and company type.
Section 4 provides updated information about the fiscal and regulatory landscape in Canada, as
it pertains to the mineral sector. It describes the flow-through share (FTS) regime, a leading fiscal
policy that Canada has in place to support a vibrant exploration sector. This section also provides
an update on the use of new prospectus exemptions and the attempts made to improve the
efficiency of securities regulation for smaller issuers such as mineral exploration companies, while
maintaining investors’ confidence by improving the disclosure aspects of the regulatory system.
Sources of Information
This report analyses data on financing undertaken by mineral industry participants and on
exploration expenditures from a number of recognized industry sources.
The data collected in the report is primarily sourced from the following:
• S&P Global Market Intelligence (formerly SNL Metals & Mining)
• Oreninc
• TMX Group
• International Monetary Fund’s World Economic Outlook
• Ontario Securities Commission’s report on the exempt markets (2017/18)
• Natural Resources Canada (NRCan)
• MarketIntelWorks (S&P Capital IQ data)
PDAC conducts extensive analysis of the listed data sources in an effort to reconcile differences
5State of Mineral Finance 2019: At the Crossroads
and to ensure that overall mineral industry financing and expenditure dynamics are properly
captured. However, differences in definitions and data capture methodologies creates some
discrepancies between sourced data, which can result in slight differences in figures contained
within this report.
In relevant places, references identify the data source and clarifications are provided in footnotes.
Additional information is collected from various sources for which the reference is made in the
appropriate text, tables and charts.
Assumptions and Limitations
The report examines trends from a 2011-2012 peak in mineral industry activity to the end of
2018 and has been prepared for the purpose of informing readers about recent developments in
financing and exploration expenditures, as well as providing a backdrop for work undertaken by
the PDAC on behalf of its members.
This publication focuses on the Canadian landscape with all monetary figures stated and
analyzed in Canadian Dollars (CAD). Exceptions include global figures and commodity
prices, which are presented in United States Dollars (USD) to enable global comparisons.
Such figures are clearly marked by a “US$” sign.1
Stated figures in this report for exploration expenditures refer only to non-ferrous exploration.
The data used in the report is considered to be accurate as of February 13, 2019.
Assumptions and estimates used to produce the data are taken from the sources. For further
information about data in this report, please contact Ran Maoz (rmaoz@pdac.ca), Jeff Killeen
(jkilleen@pdac.ca) or for specific information on Oreninc’s data, contact Kai Hoffmann, the CEO
of Oreninc at hoffmann@oreninc.com.
1 A
ll figures were sourced from the data providers in the presented currencies. No currency conversion was done by the
authors of this report.
6State of Mineral Finance 2019: At the Crossroads
SECTION I: The Macroeconomic
Environment and Metal Prices
The significant decline in commodity prices and resulting negative impacts on the mineral industry
from a peak in 2011-2012 through to 2016 have been well documented. The broad rebound in
metal prices through 2016-2017 subsequently supported an upswing in mineral industry investment
and exploration activity over these two years. However, due to a number of economic factors that
emerged in 2018, metal prices reversed course in Q2 to finish the year in negative territory.
Global Economic Uncertainty is Rising
The outlook for near-term global economic activity appeared to reverse course early in 2018 as
trade tensions began heating up. Concerns of a potential economic slowdown seems to have
weighed on growth expectations, particularly in Europe and emerging markets, over the second
half of the year. Despite these tensions, U.S. economic data remained relatively strong in 2018,
helping to propel the U.S. dollar, interest rates and related U.S. bond yields higher.
China’s attempt to clamp down debt levels along with an ongoing economic shift from
manufacturing and infrastructure development to a more consumer-driven economy has led to
a decline in future Chinese Gross Domestic Product (GDP) growth expectations. This has put
further downward pressure on the demand for raw materials. These factors collectively acted
as significant headwinds for both base and precious metals through 2018. Supply and demand
fundamentals seemed to supplant market speculation as a primary driver behind battery metals
pricing, leading to a reversal of the multi-year upward price trajectory in Q2/18.
The U.S. and China are central in current global trade tensions, but tariffs and other trade
barriers escalated across a number of regions over the last 18 months. In March 2018, the U.S
government announced new steel and aluminium import tariffs, and in June added a 25% tariff
on US$50 billion worth of Chinese exports to the U.S. In retaliation to these measures, China,
Canada and Europe applied counter tariffs on U.S imports. There is also still a risk of tariffs
being applied to an additional US$250 billion worth of goods, depending on China’s reaction
to U.S actions. These escalating trade tensions sparked fear of a global economic slow-down,
and were a main cause for the International Monetary Fund (IMF) to reduce 2018-2019 growth
expectations.
Following the 2016-17 upswing in global economic activity, the IMF in January 2018 projected
global growth of GDP to reach 3.9% in 2018 and 2019. However, during the second half of 2018
it seemed clear that estimates had overshot, and indeed, IMF revised projections downward in
its January 2019 outlook, reducing global GDP estimates by 0.2% and 0.4% in 2018 and 2019,
respectively.
Chart 1.1A shows the differences between IMF’s 2018 global and key regional GDP projections
from Q1/18 and revised estimates posted in Q1/19. It is worth noting that changing conditions
in the Euro area and emerging markets had the greatest negative impact on future estimates,
whereas growth rates for China and the United States either matched or exceeded prior
expectations (6.6% in China, as projected; 2.9% in the U.S., up from 2.7% estimated in Jan. 2018).
7State of Mineral Finance 2019: At the Crossroads
Chart 1.1A: GDP Growth in 2018
IMF Projection & Estimation (Jan. 2018 vs. Jan. 2019)
7% 6.6% 6.6%
6%
GDP growth (% per annum)
4.9%
5% 4.6%
4% 3.9%
3.7%
3%
2.3% 2.3% 2.2% 2.3%
2% 1.8%
1.5%
1%
0%
World Advanced Emerging Markets China Euro Area Germany
Economies & Developing
Economies
IMF's Jan. 2018 projection IMF's Jan. 2019 estimation
Source: IMF
Growth expectations for 2019 have declined more steeply than 2018, as illustrated in Chart
1.1B, which highlights how reduced estimates for advanced economies and China has led to
a 0.4% reduction of global GDP expansion in 2019, from 3.9% to 3.5%. It is worth noting that
these two regions (China vs. advanced economies) present different characteristics with respect
to the demand for metals. By and large, end consumers of the global economy’s production
are located in advanced economies, and therefore the impact of slowdown in these regions is
relatively indirect, while China is the key consumer of most metals via manufacturing. Therefore,
China’s impact on the mineral industry goes beyond its share of world GDP, and a slowdown in its
economic growth has more direct impact on metal prices and on mineral industry dynamics.
Chart 1.1B: 2019 GDP Growth
IMF Projections (Jan. 2018 vs. Jan. 2019)
7%
6.4%
6.2%
6%
5.0%
GDP growth (% per annum)
5% 4.5%
3.9%
4%
3.5%
3%
2.2%
2.0% 2.0% 2.0%
2% 1.6%
1.3%
1%
0%
World Advanced Emerging Markets China Euro Area Germany
Economies & Developing
Economies
IMF's Jan. 2018 projection IMF's Jan. 2019 projection
Source: IMF
8State of Mineral Finance 2019: At the Crossroads
A strong link between the relative performance of the USD and metal prices continues to be
observed. This inverse relationship is displayed in Chart 1.2, which shows the change in monthly
average value of the USD index (DXY) against the change in average metal price2. DXY indicates
relative USD strength against a weighted average of key U.S. trade partner currencies.
Base and battery metals prices have moved higher along with USD at points over the last two
years, in part, due to expectations for increased U.S. government infrastructure spending and
surging Electric Vehicle (EV) sales hinting at future demand increases. However, strong USD
performance and overall performance of U.S equities has predominantly acted as a headwind for
metals in 2018.
Chart 1.2: USD Index vs. Average Metal Price (% Change)
125%
115%
120%
Relative change in metal prices (%)
Relative change in USD index
115%
95%
110%
105%
75%
100%
55% 95%
Jul-17
Jul-18
Jan-11
Jul-11
Jan-12
Jul-12
Jan-18
Jan-13
Jul-13
Jan-14
Jul-14
Jan-15
Jul-15
Jan-16
Jul-16
Jan-17
Average Metal USD Index Price
Source: www.macrotrends.net, S&P Global Market Intelligence and PDAC analysis
In December 2016, the Federal Reserve accelerated the course of interest rate hikes that
progressively moved the overnight interest rate to 2.5% by the end of 2018, up from 0.5% in
2016. Climbing rates pushed U.S. bond yields higher, driving increased capital flows into the
U.S. and appreciation of the USD. These dynamics put pressure on commodity prices due to
the relative price appreciation for commodities being purchased with non-USD currencies. The
increasing bond yield subsequently put pressure on precious metals (primarily gold) as a result
of the increasing opportunity purchase cost of gold. Increasing bond yields typically manifest
as an attempt to cool economic activity, which often leads to a drop in demand for industrial
consumables and creates a headwind for base metal prices.
Metal Prices Lose Footing
Long-term Price Trend
Commodity prices peaked in 2011-2012 after a “super cycle” that began in the early 2000s. A
softening growth outlook from Asia coupled with anemic western economic recovery from the
2008 global financial crisis drove a decline in metal prices from 2012 to 2015. China’s improved
growth outlook and expectations for increased infrastructure spending in the U.S., along with
USD deprecation, helped to boost commodity prices across the board in 2016-2017. By the end
2 ‘Average Metal’ is a weighted average price composed of: 60% - precious metals, 35% - base metals, and
5% - battery metals. This weighting reflects global exploration financing and expenditures levels.
9State of Mineral Finance 2019: At the Crossroads
of 2017 precious, base and battery metal prices increased 13%, 59% and 167%, respectively,
compared to December 2015. However, escalating trade tensions, delays in U.S. infrastructure
investment and USD strength in 2018 supressed base and precious metal prices, respectively,
leading to a year-over-year decline in all key metal prices by year end.
Chart 1.3 illustrates the change in the monthly average prices of precious and base metals
throughout 2011-2018. The change in precious metals represent the average change in the price
of gold, silver and platinum, and the change in base metals represents the average change of
copper, nickel, lead and zinc.
Chart 1.3: Metals Price Change (2011-2018)
130%
124%
120%
Relative change in metal prices (%)
110%
94%
100%
90%
77%
3 73%
80%
59%
70% 63%
63%
60%
52%
50%
Jan-11
Jul-11
Jan-12
Jul-12
Jan-13
Jul-13
Jan-14
Jul-14
Jan-15
Jul-15
Jan-16
Jul-16
Jan-17
Jul-17
Jan-18
Jul-18
Precious Metals Base Metals
Source: S&P Global Market Intelligence and PDAC analysis
Metals designated for batteries (battery metals) have seen a spike in demand in recent years,
mostly due to expanding electric vehicle production. The two principal battery metals analyzed—
cobalt and lithium3—significantly outperformed base and precious metals from 2013 to Q2/18. At
the peak (May 2018) the price of battery metals had increased over 300% compared to 2011. It
is possible that the market switched focus in 2018 to current battery metal supply and demand
characteristics rather than longer-term demand speculation as prices realized a sharp decline
in the second half of the year. That said, battery metal prices at year end were still 200% above
January 2011 levels. Chart 1.4 illustrates the relative performance of battery versus precious and
base metals.
3 N
ickel has dual designation as both a base and battery metal. Its current primary use is in stainless steel manufacturing,
and therefore is presented as a base metal in this report.
10State of Mineral Finance 2019: At the Crossroads
Chart 1.4: Metal Price Change by Metal Group (2011-2018)
350%
315%
Precious Metals Base Metals Battery Metals
300%
Relative change in metal prices (%)
206%
250%
200%
150%
94%
77% 73%
100%
63%
50%
Jan-15
Jan-17
Jan-18
Jan-16
Jul-16
Jan-11
Jan-12
Jan-13
Jan-14
Jul-17
Jul-18
Jul-11
Jul-12
Jul-13
Jul-14
Jul-15
Source: S&P Global Market Intelligence and PDAC analysis
Short-term Price Trends
The end of 2015 has by and large marked the bottom in the commodities space, after which some
improvement was registered in the price of most key metals. Next, the price trend for key base,
precious and battery metals will be reviewed for the period of 2016-2018.
Chart 1.5 outlines the relative change in the average monthly prices of key base metals for 2016
through to the end of 2018. It illustrates a significant improvement in the prices of key base metal
off a bottom in 2015. However, the base metal rally lost steam in early 2018, leading prices
downward for the balance of the year and giving up much of the gains realized over the previous
two years. The prices of copper, lead and zinc dropped by approximately 12%, 21% and 19%,
respectively, year-over-year. That said, base metal prices have retained some of the appreciation
from 2015 lows with prices ranging from 19% to 71% above 2015 levels.
Chart 1.5: Base Metals Price Change (2016-2018)
240%
Copper Lead Nickel Zinc 232%
220%
Relative Change in metal prices (%)
200%
177%
% 171%
180%
155%
%
160%
135%
1 %
135
140%
147%
127%
120%
119%
100%
80%
Oct-17
Apr-16
Oct-16
Apr-17
Apr-18
Oct-18
Jan-16
Jul-16
Jan-17
Jan-18
Jul-17
Jul-18
Source: S&P Global Market Intelligence and PDAC analysis
11State of Mineral Finance 2019: At the Crossroads
Precious metals’ prices increased significantly in the first half of 2016, with gold, silver and
platinum gaining 22%, 31% and 42%, respectively, compared to January 2016. However, prices
retreated over the remainder of 2016 and largely trended sideways through 2017. In 2018, all
precious metals were in red territory with year-over-year declines of 1%, 9% and 13% for gold,
silver and platinum, respectively. As Chart 1.6 shows, the post-2015 recovery in precious metal
prices has been much softer than base metals, as prices of gold and silver increased only 14%
and 5%, respectively, while the platinum price decreased by 7%.
Chart 1.6: Precious Metals Price Change (2016-2018)
150%
142%
Relative change in metal prices (%)
140%
131%
130%
114%
120%
122%
110%
105%
100%
93%
90%
Apr-16
Oct-16
Jul-17
Oct-17
Apr-17
Apr-18
Oct-18
Jan-16
Jul-16
Jan-17
Jan-18
Jul-18
Gold Silver Platinum
Source: S&P Global Market Intelligence and PDAC analysis
Gold is often treated as a currency proxy and gold price fluctuations typically have a significant
influence on silver and other precious metal prices. As such, the continuous course of interest
rate hikes by the Federal Reserve, from an initial base of 0.5% in December 2016 to 2.5% in
December 2018 acted as a significant headwind for precious metals over this period. These
headwinds gained force in 2018 as USD appreciation re-materialized, largely as a result of
accelerating rate hikes. While last year’s market sentiment reflected expectations for continued
rate increases in 2019, this seems to have shifted in early 2019 to a more subdued outlook.
For platinum, the sources of the decline are different, since as opposed to gold and silver,
platinum is impacted mostly by industrial factors. The main use of platinum is as a catalyst
in diesel engines. Increased manufacturing focus on electric vehicles in the coming years is
projected, which could have a negative impact on diesel vehicle demand and, in turn, result in
reduced overall demand for platinum.
12State of Mineral Finance 2019: At the Crossroads
Both increased demand and market speculation around cobalt and lithium translated to
staggering price increases of 392% and 251%, respectively, from January 2016 to March/April
2018. However, cobalt and lithium prices began to weaken in Q2/18, and ended up posting year-
over-year declines of 24% and 21%, respectively. That said, prices of both metals remain well
above January 2016 levels, as can be seen in Chart 1.7.
Chart 1.7: Battery Metals Price Change (2016-2018)
440%
392%
Relative change in metal prices (%)
390%
340%
290% 251%
251 %
2 %
238
238%
240%
168%
190%
140%
90%
Mar-16
May-16
Nov-16
Jul-16
Sep-16
Mar-17
May-17
Nov-17
Mar-18
May-18
Nov-18
Sep-17
Sep-18
Jan-16
Jan-17
Jul-17
Jan-18
Jul-18
Source: S&P Global Market Intelligence and PDAC analysis
The next section of this report will focus on financing aspects of the mineral industry, and will
illustrate how declining metal prices have translated to reduced investment demand and capital
availability for the mineral sector.
13State of Mineral Finance 2019: At the Crossroads
SECTION 2: Financing Trends
The following section will review mineral industry financing trends and related dynamics. Global
and domestic trends for financing in the mineral sector will be presented, followed by a focus on
financings undertaken by the junior mining sector in Canada.
Global Financing Recovery Stalls in 2018
Global financing activity for the mineral industry appeared to be gaining momentum in 2017 by
posting a 40% year-over-year increase from a 2016 low point, where funds raised represented
only 45% of 2012 levels. However, as outlined in Chart 2.1, 2018 global financing activity
retreated towards the 2016 low point. In particular, funds raised via equity in 2018 was the lowest
recorded figure over the last decade.
Chart 2.1: Financing for the Global Mineral Industry (US$B)
140
109%
94%
120
83%
100 88% 76%
75%
65.7 68%
99.4 69%
80 55%
US$ Billions
94.9 65.8
60 56.4 54.6
33.3 45.1
40
54.8
20 33.9 38.0
24.2 29.5 27.5 30.9
20.5
0
2011 2012 2013 2014 2015 2016 2017 2018
Equity Debt Change in Metal Prices
Source: S&P Global Market Intelligence and PDAC analysis
Chart 2.1 highlights the strong correlation between relative changes in metal prices (dashed line)
and overall financing activity. With this in mind, we can see the overall metal price decline in 2018
coincided with a year-over-year decline in equity and debt financing of approximately 34% and
17% respectively. Despite a positive trajectory for both precious and base metal prices in the first
two months of 2019, a sustained positive price trend may be necessary to generate increased
investor interest and financing activity within the mineral industry in the near term.
It is important to note that debt financing is not a typical fundraising option for non-revenue
generating entities such as mineral exploration companies. As such, the balance of this report
largely focuses on equity financing activity.
Chart 2.2 highlights the importance of Canadian exchanges for mineral industry financing.
Canada continues to lead in providing access to equity capital for the mineral industry, with 19%
(on average) of the equity capital raised by public companies from 2011-2018 completed on
Canada’s two key stock exchanges (the TSX and TSX Venture or in short TSX-V).
14State of Mineral Finance 2019: At the Crossroads
Chart 2.2: Equity Financing for the Global Mineral Industry (US$B)
60 30%
50 24.6% 25%
19.6% 22.4% 22.7%
Canada's share of total (%)
40 14.8% 20%
15.9%
17.0%
US$ Billions
30 15.4% 15%
54.8
20 38.0 10%
33.9 30.9
29.5 27.5
24.2
10 20.5 5%
0 0%
2011 2012 2013 2014 2015 2016 2017 2018
Value Raised Globally Canada's share of total
Source: S&P Global Market Intelligence and PDAC analysis
Canadian exchanges attracted a higher proportion of global equity funds in 2018 relative to 2017
at nearly 25%, but it was from a much smaller overall pot, which signals a more rapid year-over-
year contraction of mineral industry funding outside of Canadian exchanges.
The impact of Canadian exchanges is further demonstrated in Chart 2.3, which outlines the
number of transactions. On average, over40% of publicly reported equity transactions since 2011
have occurred on Canadian exchanges and the proportion has increased for three consecutive
years to reach a decade high of ~50% in 2018. However, the total number of transactions
declined by ~22% from 2017 to 2018, which coincides with a 33% decline in equity funding value.
Chart 2.3: Equity Financing for the Global Mineral Industry (# of Transactions)
4,500 60%
4,000 51%
49% 49%
50%
3,500 42% 39% 36% 38%
37%
3,000 40%
Canada's share of total (%)
1,995
Number of transactions
1,848
2,500 2,223
1,961
1,998 30%
1,967 1,956 1,397
2,000
1,500 20%
1,000 1,887 1,773
1,409 1,314 1,432 10%
1,282 1,128 1,197
500
- 0%
2011 2012 2013 2014 2015 2016 2017 2018
Canada Rest of the World Canada's share of total
Source: S&P Global Market Intelligence and PDAC analysis
15State of Mineral Finance 2019: At the Crossroads
Given the importance of Canadian exchanges outlined in Charts 2.2 and 2.3, the following section
focuses on Canadian equity financing dynamics for the mineral industry.
Financing Landscape in Canada Contracts
While Canada’s proportion of global equity financing increased in 2018, the total value raised on
Canadian exchanges declined in line with the global trend to reach ~$6.5 billion, a decrease of
~23% and ~31% relative to 2017 and 2016, respectively.
Chart 2.4 outlines equity financing levels on the TSX and TSX-V exchanges, as reported by TMX
Group. Notably, TSX-V equity financing levels were relatively flat from 2017 to 2018. With equity
funds raised on the TSX dropping ~35% year-over-year, the proportional value of equity raised on
TSX-V has spiked to 48% in 2018, which is the highest level reached since 2011. Also noteworthy
is the fact that 2018 equity financing fell short of both 2013 and 2015 levels, to reach the lowest
point in nearly a decade.
Chart 2.4: Equity Raises on Canadian Stock Exchanges ($B)
TSX vs. TSXV
14 60%
48%
12 47%
50%
38%
10
TSX-V share of total (%)
5.9 27% 40%
2.8
2.6
$ Billions
8 1.8 16%
27% 3.2 30%
6 1.3 21% 1.1
19%
3.1 20%
4 7.5
6.6 7.0 6.8
5.6 5.7 5.2
2 10%
3.4
0 0%
2011 2012 2013 2014 2015 2016 2017 2018
TSX TSX-V TSX-V share of total
Source: TMX Group and PDAC analysis
In Chart 2.5 the same data is presented but disaggregated based on financing type. This analysis
reveals how the proportion of funds sourced via private placements increased significantly from
2013 to 2018. The proportional increase was a result of both the near-continuous increase in
the amounts raised via private placement combined with an equally noticeable decline in public
offering investments, especially between 2016 and 2018. Alarmingly, total public capital raised in
2018 declined by more than 70% compared to 2016. The lack of Initial Public Offerings (IPOs) in
recent years is also quite noticeable.
16State of Mineral Finance 2019: At the Crossroads
Chart 2.5: Equity Raises on Canadian Stock Exchanges ($B)
Private Placements vs. Public Offering vs. IPOs
14 80%
76%
12 70%
60%
53% 60%
Private placements' share of total
10 43%
5.6
41% 50%
39%
$ Billions
8
35%
5.9 31% 40%
5.3
6 5.8 2.4
1.5
30%
4.7 3.9
4
6.6 20%
5.1 4.9
2 4.0 4.0 10%
3.1 2.8
2.2
0 0%
2011 2012 2013 2014 2015 2016 2017 2018
Private Placement Public Offering
Initial Public Offering Private Placement's share of total
Source: TMX Group and PDAC analysis
Similar to the funding trends displayed above, a material decline in the total market capitalization
and number of mineral industry issuers on the TSX and TSX-V occurred between 2011-12
and 2015-16. These market characteristics are outlined in Charts 2.6 and 2.7, and show that a
rebound in 2017 was followed by a subsequent decline in 2018.
Chart 2.6: TSX Listed Mineral Industry Issuers
500 400
348 310
360 350
400 373
Number of Issuers
267 300
232 224 218
Market Cap. ($B)
230 250
300
200
200 150
100
100
50
0 0
H1-2011
H2-2011
H1-2012
H2-2012
H1-2013
H2-2013
H1-2014
H2-2014
H1-2015
H2-2015
H1-2018
H2-2018
H1-2016
H2-2016
H1-2017
H2-2017
Market Capitalization Number of Issuers
Source: TMX Group
17State of Mineral Finance 2019: At the Crossroads
Chart 2.7: TSX-V Listed Mineral Industry Issuers
40 1,600
1309
35 1,232 1,247 1,400
1,154
Number of Issuers
30 1,003 988 987 971 1,200
Market Cap. ($B)
25 1,000
20 800
15 600
10 400
5 200
0 0
H1-2011
H2-2011
H1-2012
H2-2012
H1-2013
H2-2013
H1-2014
H2-2014
H1-2015
H2-2015
H2-2016
H1-2017
H2-2017
H1-2018
H2-2018
H1-2016
Market Capitalization Number of Issuers
Source: TMX Group
Table 2.1 calculates the relative change in the number of mineral industry issuers listed on the
TSX and TSX-V between the 2011-2012 peak and the second half of 2018. Table 2.2 provides the
same analysis with respect to issuer market capitalization on each exchange.
Table 2.1: Number of Mineral Industry Issuers in Canada
TSX-V TSX TSX & TSX-V
H1-2012: # of issuers 1300 373 1673
H2-2018: # of issuers 971 218 1135
Decrease in # of issuers (329) (155) (484)
% of decrease -25.3% -41.6% -28.9%
Source: TMX Group and PDAC Analysis
Table 2.2: Market Cap. of Mineral Industry Issuers in Canada
TSX-V TSX TSX & TSX-V
H1-2011: Market Capitalization ($B) 38 467 504
H2-2018: Market Capitalization ($B) 17 254 271
Decrease in Market Capitalization ($B) (20.3) (212.8) (233.1)
% of decrease -53.9% -45.6% -46.2%
Source: TMX Group and PDAC Analysis
18State of Mineral Finance 2019: At the Crossroads
What is noticeable from the tables and charts shown previously is that from 2011-2015 there
was a wide-scale decline of both the number of listed mineral industry companies and the overall
value of this market segment. While there was a notable rebound in the overall market value of
the mineral industry in 2016 and 2017, the trend reversed in 2018.
Also notable is the decline in the number of active companies operating in the sector since 2011
and the decline continued in 2018 with elimination of approximately 17 listed mineral companies
during the year. Consolidation within the mineral industry accounts for some of the reduction in
listed companies but the decline also reflects the difficulty exploration and mining companies
have experienced in sourcing public funds and new investors since the 2011 peak.
One recent trend in the Canadian mineral sector is a steady increase in reinvestment by major
mining companies into junior explorers. Chart 2.8 shows the aggregate and average transaction
value, as well as the number of transactions completed by major mining companies investing in
juniors. From 2013 to 2017, the average transaction value increased from $3.2 million to $11.8
million, vaulting the aggregate value upward to a record a fivefold increase in just four years, from
$217 million in 2013 to nearly $1.4 billion in 2017.
Chart 2.8: Majors' Investment in Juniors
14
1,400 $11.8
$1,393
12
Aggregate Value ($M) / # of Transactions
1,200
Average Transaction Value ($M)
10
1,000
8
800
6
600 $667
$546 $3.2
400 4
$424
$357 $397
200 2
106 $217 68 101 118
57 67 67
0 0
2011 2012 2013 2014 2015 2016 2017
Aggregate Value ($M) # of transactions Average Transaction Value ($M)
Source: MarketIntelWorks; S&P Capital IQ
While we are encouraged to see increasing reinvestment by major mining companies into the
junior exploration end of the market, it has not reached sufficient levels to offset the overall
outflow of public investment in junior mineral explorers.
Canada’s Junior Funding Evaporating
While large mineral sector companies are able to raise equity capital through public offerings, junior
mineral industry companies (juniors) typically raise money via private placements. Hence, understanding
private placement financing trends provides insight into the health of the junior market segment.
The following section outlines junior private placement financings as defined by Oreninc (i.e.
transactions of less than $100 million and companies with a market capitalization below $1.5 billion).
19State of Mineral Finance 2019: At the Crossroads
Chart 2.9 below shows a rebound in junior investor interest in 2016/2017, but the value of equity
raised by juniors completed on TSX and TSX-V decreased by 58% and 23% in 2018, respectively.
Notably, the $0.6 billion raised on the TSX in 2018 is the lowest recorded number since Oreninc
began tracking the junior sector in 2011.
Chart 2.9: Juniors' Financing by Exchange ($B)
6
5.0
5
4
3.3
$ Billions
3.1
3 2.7
2.3 2.4 2.4
2.1
2 1.7 1.7 1.4
1.3 1.2
1.2 1.1
1 0.6
0
2011 2012 2013 2014 2015 2016 2017 2018
TSX TSX-V
Source: Oreninc
Chart 2.10 outlines the number of transactions completed by juniors on each exchange.
Chart 2.10: Juniors' Financing by Exchange (# of Transactions)
1,600
1,371
1,400
1,261 1,237
1,178
1,200
1,036
Number of Transactions
1,018
1,000 885
853
800
600
400
184 180 161 200 151
200 146 140
83
0
2011 2012 2013 2014 2015 2016 2017 2018
TSX TSX-V
Source: Oreninc
While 2017 marked a recent high in the value of equity raised on the TSX-V, the number of
transactions declined year-over-year, which may indicate a narrower distribution of funds
across market participants. The ~25% decline in 2018 transactions completed on the TSX-V is
commensurate to the 23% decline in value, suggesting a similar distribution of funds to 2017.
20State of Mineral Finance 2019: At the Crossroads
Chart 2.11 compares the aggregate value of non-brokered and brokered best-efforts transactions
to bought-deal transactions in the junior mining sector.4 The 2017 picture was mixed as a small
increase in bought deals was offset by declines in both brokered and non-brokered best-efforts
transactions. A clear negative trend was established in 2018 as modest declines in brokered and
non-brokered best efforts transactions (~20% and ~6% respectively) were accompanied by a
staggering 60% decline in bought deals, from $1.5 billion in 2017 to $0.6 billion in 2018. Notably,
the amount of capital raised via bought deal in 2018 matches 2013-2014 lows.
Chart 2.11: Aggregate Value - Brokered vs. Non-brokered Transactions
3.5
3.2
Bought Deal Brokered Best Efforts Non-Brokered Best Efforts
3.0
2.5 2.4
2.3
2.1
2.0
$ Billions
1.7 1.8
1.6 1.6
1.5
1.4 1.4
1.5 1.3
1.2
1.1
1.0
1.0 0.8
0.7 0.6 0.6
0.6 0.5 0.5
0.5
0.5
0.1
0.0
2011 2012 2013 2014 2015 2016 2017 2018
Source: Oreninc
Chart 2.12 presents the relative distribution of each transaction type. In line with the significant
decline in total value of bought deals in 2018 was a reduction in the overall proportion of this
mechanism as a source of funds.
The construct of bought-deal financing inherently exposes underwriters to greater financial risk. With
this in mind, the significant decrease in both absolute value raised, and the relative share of bought deal
transactions in 2018, indicates that financial institutions are becoming increasingly unwilling to take on
the financial liabilities associated with bought-deal financing for junior mineral exploration companies.
Chart 2.12: Brokered vs. Non-brokered Transactions (% of Total Funds)
100%
30%
80% 37%
49% 49% 45%
51%
60% 59%
Share of total (%)
60%
29%
28% 16%
40% 18% 19%
22% 7%
18%
20% 41% 35% 39%
33% 33% 32%
27% 22%
0%
2011 2012 2013 2014 2015 2016 2017 2018
Non-Brokered Best Efforts Brokered Best Efforts Bought Deal
Source: Oreninc
4 A
“bought-deal” is a securities offering in which an underwriter commits to buy the entire offering from the client
company. On the other hand, in a “best-efforts” transaction the underwriter promises to make its best effort to sell as
much of a securities offering as possible, but is not obliged to purchase the entire amount being offered. Best-efforts
transactions can be either brokered or non-brokered.
21State of Mineral Finance 2019: At the Crossroads
Next, we examine funds raised by junior mining companies on Canadian exchanges with respect
to value and number of transactions, based on the following commodity grouping:
• Precious metals: gold, silver and platinum
• Base metals: copper, tin and zinc
• Battery metals: cobalt, graphite, lithium and vanadium
Chart 2.13 displays a decline in funds raised for projects of all metal types in 2018. While 2017 was a
breakthrough year for battery metals, as project financing tripled year-over-year (from $247 million to
$741 million), they joined the declining trend in 2018, with funds raised decreasing by nearly 40%.
Chart 2.13: Junior Financing by Commodity Group (Amount Raised in $B)
7
5.8
6
5
4.0
4 3.6 3.5
$ Billions
3
2.2 2.2
1.8 2.0
2 1.6
1.1 1.2 1.0
1 0.6 0.7 0.7
0.6 0.5 0.5
0.3 0.2 0.2
0.1 0.2 0.2
0
2011 2012 2013 2014 2015 2016 2017 2018
Precious Metals Base Metals Battery Metals
Source: Oreninc
The relative share of each metal group is outlined in Chart 2.14. Although total funds raised for
battery metals declined in step with other metal types, the proportion of total financing matches
the high point achieved in 2017. Interestingly, 2018 precious metals project funding reflects the
smallest share of total funds for this group across the observed period from 2011-2018.
Chart 2.14: Junior Financing by Commodity Group (% of Total Funds)
100%
22% 21% 20% 22% 19% 23%
26% 26%
80%
Share of total financing (%)
60%
67% 62%
73% 73% 74%
40% 70% 75% 69%
20%
14% 14%
3% 3% 5% 6% 7% 5%
0%
2011 2012 2013 2014 2015 2016 2017 2018
Battery Metals Precious Metals Base Metals
Source: Oreninc
22State of Mineral Finance 2019: At the Crossroads
Chart 2.15 shows the distribution of financings completed on Canadian exchanges in 2018 based
on the specific targeted commodity. It shows that nearly 60% of funds raised in 2018 targeted
three key commodities. Gold leads by far with 42.9% of the funds raised, followed by copper
(7.9%) and lithium (7.4%).
Chart 2.15: Financing of Juniors by Commodity Type (2018)
Gold Copper
25.4%
Lithium Precious Metals
42.9% Uranium Silver
1.2%
1.5% Diversified Diamonds
1.6%
Zinc Nickel
2.0%
2.2% 5.7% Other
7.4% 7.9%
2.4%
Chart 2.16 shows the distribution of total private placement funds raised between 2011 and 2018
disaggregated by market capitalization of the issuers. Nearly half of all junior funds raised were by
companies with a sub-$100 million market capitalization, while less than 15% of the funds were
raised by companies with market capitalization above $500 million. Possible explanations for
this dynamic is that larger companies tend to target public transactions or those in excess of the
$100 million threshold, and therefore do not appear in the Oreninc database. Another potential
reason is that larger companies with greater public market liquidity typically have a broader set of
financing options such as debt, strategic investments and royalty/stream sales to fund activities.
Chart 2.16: Junior Fundraising Distribution by Market Capitalization
2.8%
$1.0B < Market Cap < $1.5B
11.5%
$0.5B < Market Cap < $1.0B
47.9%
$0.1B < Market Cap < $0.5B
37.8%
Market Cap < $0.1B
Source: Oreninc
23State of Mineral Finance 2019: At the Crossroads
Chart 2.17 focuses on companies with market capitalization of less than $100 million. Funding
for this group declined by 38% year-over-year, from $2.4 billion to $1.5 billion. The decline is
more pronounced than the 30% drop in funding for all juniors in the sub-$1.5 billion market cap
bracket, which indicates that smaller companies suffered most in 2018. In particular, the $0-$25
million and $25-$50 million market cap brackets saw funding decreased by nearly 40% and 60%,
respectively, versus 2017.
Chart 2.17: Financing for Juniors Under $100M Market Capitalization
4.0
3.5 0.4
3.0 0.7
2.5
0.4 0.3
$ Billions
2.0 1.1 0.3
0.4 0.4
0.3
1.5 0.1
0.3 0.6 0.2
0.6 0.2 0.1 0.7
0.2 0.3
1.0 0.3 0.2
0.4 0.3
1.4 0.3
0.5 1.0 0.9 1.1
0.9 0.7
0.6 0.6
0.0
2011 2012 2013 2014 2015 2016 2017 2018
$75MState of Mineral Finance 2019: At the Crossroads
While the recent spike identified in Q1/2019 is encouraging, sustained market activity over the
year will likely be required to vault the index into a healthy range.
Chart 2.18: Oreninc Index
Source: Oreninc
Oreninc collects the location of company headquarters and projects, as well as the intended use of
proceeds
Oreninc from financings.
collects Thisof
the location allows tracking
company of flow of funds
headquarters raised on
and projects, asCanadian
well as theexchanges
intended to
use
different regions. Table 2.3 outlines the number of transactions and the global distribution
of proceeds from financings. This allows tracking of flow of funds raised on Canadian exchanges of funding.
While ~40% of
to different funds were
regions. Tabledirected to Canadian
2.3 outlines projects,
the number ~60% of funds
of transactions raised
and the in Canada
global went
distribution
abroad, with the U.S. and Africa as key destination. Most notable in 2018 is the year-over-year
of funding. While ~40% of funds were directed to Canadian projects, ~60% of funds raised in
increase in funds flowing to Africa (from 6.2% to 15%) and the decrease in funds flow to South
Canada went abroad, with the U.S. and Africa as key destination. Most notable in 2018 is the
America (from 20.7% to 11.6%).
year-over-year increase in funds flowing to Africa (from 5.7% to 12.4%) and the decrease in funds
flow to South America (from 23.0% to 14.8%).
Table 2.3: The Flow of Funds
Table 2.3: ThetoFlow
Canada and Abroad
of Funds to Canada and Abroad
2017 2018
Number of Funds Raised % of Total Number of Funds Raised % of Total
Region Transactions ($M) Value Transactions ($M) Value
Africa 67 267 5.7% 64 382 12.4%
Asia 20 40 0.9% 14 32 1.0%
Australia 7 66 1.4% 12 17 0.5%
Canada Table 2.3: The Flow of
812 2,021 Funds to Canada and Abroad
43.3% 584 1,282 41.6%
Mexico & Central 58 380 8.1% 53 288 9.3%
America 2017 2018
Europe Number 42of Funds Raised
215 % of4.6%
Total Number27of Funds Raised
60 % of1.9%
Total
Region
Oceania Transactions
11 ($M)34 Value
0.7% Transactions
5 ($M) 8 Value
0.2%
Africa 67 267 5.7% 64 381.92 12.4%
South America 134 1,076 23.0% 86 456 14.8%
Asia 20 40 0.9% 14 32 1%
United States 170 571 12.2% 133 561 18.2%
Australia 7 66 1.4% 12 16.93 0.5%
Total 1,321 4,671 100% 978 3,085 100%
Canada 812 2,021 43.3% 584 1,282 41.6%
Mexico & Central Source: Oreninc 53 287.95
58 380 8.1% 9.3%
America Source: Oreninc
Europe 42 215 4.6% 27 60 1.9%
Oceania 11 34 0.7% 5 7.53 0.2%
South America 134 1,076 23.0% 86 456 14.8%
United States 170 571 12.2% 133 561.04 18.2%
Total 1321 4,671 100% 978 3,085 100%
25 25State of Mineral Finance 2019: At the Crossroads
SECTION 3: Exploration Trends
In the previous section, financing for the mineral industry was examined with a focus on equity
capital raised by the junior mining sector. This section will further analyse equity funding, focusing
specifically on exploration financing and related expenditures.
Financing for Mineral Exploration Drops
Global mineral exploration funding troughed in 2015, after declining materially from peak years in
2011 and 2012. Funding subsequently improved in 2016 and 2017 to post 98% and 89% year-
over-year increases, respectively. However, as Chart 3.1 shows, global financing for exploration
more than halved in 2018.
It is worth noting that the 2017 global figure is materially impacted by 3 outlier transactions.
Excluding these, the recent year-over-year changes in global exploration funding would have
more-closely matched the dynamic observed on Canadian exchanges.
In line with the global trend, Chart 3.1 shows the multi-year recovery in exploration funding on
Canadian exchanges reversed in 2018, declining by nearly 25% year-over-year. One positive
indicator is that the rate of decline in Canadian exploration funding was well below the rest of
the world. The dashed line in Chart 3.1 illustrates the significant role of Canadian exchanges in
exploration funding as they, on average, account for roughly 1/3 of funds raised globally.
Chart 3.1: Global Equity Financing for Exploration (US$B)
18 44% 50%
46%
16 39% 45%
14 30% 40%
32%
Canada's share of total (%)
35%
12 27%
22% 30%
10 13.2
US$ Billions
25%
8 20%
8.1 20%
6 6.4 15%
4 10%
4.0 2.5 2.3
2 3.5 3.3 1.6 1.6 5%
2.1 2.4 1.8
1.0 1.1 0.7
0 0%
2011 2012 2013 2014 2015 2016 2017 2018
Canada Rest of the World Canada's share of total
Source: S&P Global Market Intelligence and PDAC analysis
Chart 3.2 displays the number of exploration equity financings completed both globally and in
Canada. From this, we see similar activity levels in 2016 and 2017 that provides context on
the significant increase in value over this period and the impact of a small number of outlier
transactions. The chart also reinforces Canada’s increasingly important role in equity financing for
exploration as over 50% of global transactions in the last three years were completed either on
the TSX or TSX-V.
26State of Mineral Finance 2019: At the Crossroads
Chart 3.2: Global Equity Financing for Exploration (# of Transactions)
2,500 60%
52% 52%
44% 50%
42% 50%
2,000
Canada's share of total (%)
40% 39% 41%
Number of Transactions
40%
1,500 969 1,010
1,161
1,139
1,065 779 30%
1,000 913 860
20%
500 1,065 1,017
897 828 832 10%
600 678 602
0 0%
2011 2012 2013 2014 2015 2016 2017 2018
Canada Rest of the World Canada's share of total
Source: S&P Global Market Intelligence and PDAC analysis
Global Exploration Spending at Odds With Financing
The following section examines exploration expenditures, both globally and in Canada, broken
down by region/province, stage of exploration, company type and commodity type.
Regional Characteristics
Chart 3.3 illustrates mineral exploration expenditures by region. Global exploration spending
decreased 20%-30% annually between 2013 and 2016, mirroring the decline in financing for
mineral exploration. In 2017 global exploration expenditures increased to US$8.05 billion, 15%
higher than the 2016 level, and in 2018 the upward trend continued with additional increase of
~20%, to US$9.6 billion.
It should be noted that exploration expenditures are a lagging indicator for the state of the
industry at any point in time and typically reflect investor appetite and funding activity from the
previous year. With this in mind, subdued financing activity in 2018 relative to 2017 may point to a
slowdown in exploration spending on the horizon in 2019.
27State of Mineral Finance 2019: At the Crossroads
Chart 3.3: Global Exploration Expenditures -by Region (US$B)
25%
20.5%
20
19.2%
18.1%
17.1% 20%
15.8%
Canada's share of total (%)
15 15.0%
13.9% 14.1% 13.7%
13.5% 15%
US$ Billions
10
10%
5
2.3 2.5 5%
2.0
1.5 1.9
1.1 1.3 1.1 1.1 1.3
2.8 3.1 3.2 0.9
1.4 2.2 1.9 1.5 1.4
1.2 1.0 1.1
0 0%
2008 2009 2010 2011 2012 2013 2014 2015 2016 2017 2018
Canada Australia USA Africa
Latin America Pacific/SE Asia Rest of the World Share of Canada
Source: S&P Global Market Intelligence and PDAC analysis
Canada and Australia remain the two leading countries in terms of exploration spending, attracting
15% and 13.8% of global exploration expenditures in 2018, respectively. These figures exclude
ferrous exploration spending, which, if included, would position Australia as the top destination
for global exploration. Furthermore, despite a slight year-over-year increase in Canada’s share of
exploration spending, it is in a long term declining trend and 2018 remains well below the 20.5%
level achieved in 2008.
Project Stage and Company Type
Analyzing global exploration spending by project stage highlights a worrisome decline in grassroots
exploration, as indicated in Chart 3.4. The share of grassroots exploration decreased from 38.2%
in 2008 to 26.1% in 2018. This decline is concerning as it can directly link to the rate of discovery of
new deposits—and a lack of new discoveries will negatively impact the number of future mines.
Chart 3.4: Global Exploration Expenditures by Project Stage (US$B)
25 50%
38%
33% 40%
Grassroots share of total (%)
20 34% 33%
34%
5.2 30% 29% 28% 27% 26%
US$ Billions
15 4.2 30%
3.0 4.2
9.0
10 2.8
7.2
20%
3.3
5.6 5.5 3.3
2.1 3.0
4.9 2.9
4.2 2.4
5 3.8
10%
3.2 3.2
6.3 2.6 2.9
5.3 5.8 4.8
2.7 3.8 3.2 2.5 2.5
2.0 2.2
0 0%
2008 2009 2010 2011 2012 2013 2014 2015 2016 2017 2018
Grassroots Late Stage & Feasibility Minesite Share of Grassroots
Source: S&P Global Market Intelligence and PDAC analysis
28State of Mineral Finance 2019: At the Crossroads
As shown in Chart 3.5 below, the share of exploration expenditures by junior companies as
defined by S&P Global (companies with revenueState of Mineral Finance 2019: At the Crossroads
Canadian Exploration Continues to Climb
As indicated earlier, exploration spending in Canada declined by over 60% from 2012 to 2016.
In 2017, Canadian expenditures increased by approximately 10%, to $1.43 billion. This trend
continued into 2018 with expenditures reaching $1.85 billion, a 30% increase year-over-year.
However, as noted above, the year-over-year spending increase in 2018 is a lagging indicator
that is likely more reflective of increased financing activities in 2017.
Project Stage and Company Type
Domestic exploration expenditures by project stage outlined in Chart 3.7 reconciles with the
trend globally, reflecting a sharp decline in grassroots activity in Canada—grassroots exploration
spending dropped from over 45% in 2008 to 24% in 2018. Notably, grassroots exploration
expenditures in Canada have been stagnant since 2015.
Chart 3.7: Exploration Expenditures in Canada by Stage ($B)
4.0 50%
45%
3.5 40%
36% 36% 35% 40%
Grassroots share of total (%)
3.0 0.5
0.4 0.5
28% 29% 28% 29%
2.5 30%
$ Billions
0.4 24%
2.0 1.3 1.4 1.8 0.4
0.5 20%
1.5 0.2 1.1 0.4
0.5 0.3
0.9 0.3
1.0 0.8 0.9
0.7 0.7 10%
1.4 0.6 0.6
1.2
0.5 0.8 1.0
0.6 0.7
0.5 0.4 0.4 0.4 0.4
0.0 0%
2008 2009 2010 2011 2012 2013 2014 2015 2016 2017 2018
Grassroots Late Stage & Feasibility Minesite Grassroots' share of total
Source: S&P Global Market Intelligence and PDAC analysis
Chart 3.8 shows exploration expenditures in Canada by company type and demonstrates how the
share of exploration expenditures by junior companies has declined from nearly 70% in 2008 to
less than 55% in 2018.
30You can also read