A climate index for the Newfoundland and Labrador shelf - ESSD
←
→
Page content transcription
If your browser does not render page correctly, please read the page content below
Earth Syst. Sci. Data, 13, 1807–1828, 2021
https://doi.org/10.5194/essd-13-1807-2021
© Author(s) 2021. This work is distributed under
the Creative Commons Attribution 4.0 License.

       A climate index for the Newfoundland and Labrador shelf
                                           Frédéric Cyr1,2 and Peter S. Galbraith3
                 1 Northwest Atlantic Fisheries Centre, Fisheries and Oceans Canada, St. John’s, NL, Canada
            2 Physics and Physical Oceanography, Memorial University of Newfoundland, St. John’s, NL, Canada
                    3 Maurice Lamontagne Institute, Fisheries and Oceans Canada, Mont-Joli, QC, Canada

                                Correspondence: Frédéric Cyr (frederic.cyr@dfo-mpo.gc.ca)

                                Received: 17 November 2020 – Discussion started: 2 December 2020
                            Revised: 16 March 2021 – Accepted: 22 March 2021 – Published: 3 May 2021

       Abstract. This study presents in detail a new climate index for the Newfoundland and Labrador (NL) shelf. The
       NL climate index (NLCI) aims to describe the environmental conditions on the NL shelf and in the Northwest
       Atlantic as a whole. It consists of the average of 10 normalized anomalies, or subindices, derived annually:
       winter North Atlantic Oscillation, air temperature, sea ice season severity, iceberg count, seasonal sea surface
       temperature, vertically averaged temperature and salinity at the Atlantic Zone Monitoring Program (AZMP)
       Station 27, summer cold intermediate layer (CIL) core temperature at AZMP Station 27, summer CIL area on
       three AZMP hydrographic sections, and bottom temperature on the NL shelf. This index runs from 1951 to 2020
       and will be updated annually. It provides continuity in the production of advice for fisheries management and
       ecosystem status on the NL shelf, for which a similar but recently abandoned index was used. The new climate
       index and its subindices are available at https://doi.org/10.20383/101.0301 (Cyr and Galbraith, 2020).

1   Introduction                                                  as an explanation for fluctuations in marine resources” (from
                                                                  the Introduction of the founding document), the AZMP had
                                                                  a mandate to develop and implement an efficient and ef-
Climate indices are often regarded as simple ways to relate       fective environmental monitoring program for the northwest
the mean environmental conditions to the state of an ecosys-      Atlantic zone and then to maintain it through the years.
tem. As changes in the ocean climate affect species distri-       The creation of the AZMP came as a direct consequence
bution and the resilience of the world’s ecosystems (IPCC,        of the collapse of the Atlantic zone groundfish fisheries in
2019), these climate indicators are currently in high de-         the early 1990s, a period characterized by anomalously cold
mand. Useful and accessible climate indices are also key-         and potentially unfavourable environmental conditions for
stone pieces of information for fisheries management, espe-       the stock, although the latter was highly debated (Lear and
cially now that many governments and inter-governmental           Parsons, 1993; de Young and Rose, 1993; Hutchings and My-
agencies show an increasing desire to implement an ecosys-        ers, 1994; Mullowney et al., 2019).
tem approach to their fisheries management (e.g. for the             Since 2000, annual reports produced by AZMP scientists
North Atlantic; Levin et al., 2008; Pepin et al., 2019; Koen-     on the oceanographic and meteorological conditions of the
Alonso et al., 2019; Muffley et al., 2021).                       Canadian Atlantic zone have been published through the
    In eastern Canada, climate indices are often used by Fish-    Canadian Science Advisory Secretariat (CSAS; https://www.
eries and Oceans Canada (DFO) in ecosystem studies and/or         dfo-mpo.gc.ca/csas-sccs, last access: 15 March 2021). The
to inform fisheries scientists and managers as part of vari-      idea of combining several normalized anomalies into a sin-
ous regional assessments of marine resources. At DFO, these       gle index representative of the climate of a large area was
indices and related advice are often provided by scientists af-   first developed by Petrie et al. (2006a) for the meteorolog-
filiated with the Atlantic Zone Monitoring Program (AZMP,         ical, sea ice and sea surface temperature (SST) parameters
Therriault et al., 1998). Created in 1998 following a gen-        in eastern Canada and by Petrie et al. (2006b) for the physi-
eral consensus that “changes in climate cannot be ignored

Published by Copernicus Publications.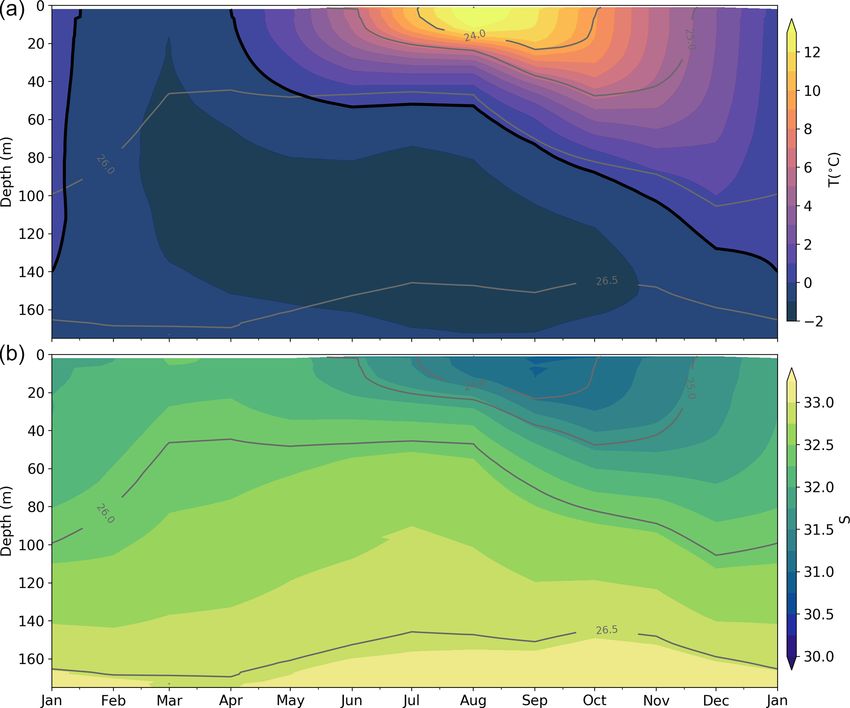
1808                                                                                                                F. Cyr and P. S. Galbraith: NL climate index

Table 1. Review of AZMP reports that made use of composite or climate indices. The Table is separated into three sections: (1) meteoro-
logical, sea ice and SST conditions off eastern Canada; (2) physical oceanographic conditions (review year 2005-2008) and meteorological
and sea ice conditions (after 2009) on the Scotian shelf and Gulf of Maine; and (3) physical oceanographic conditions (including sea ice and
atmosphere) on the Newfoundland and Labrador shelf. Note that the entries between Hebert et al. (2011) and Hebert et al. (2020) have not
been included because their ocean composite index did not change. The different columns are, respectively, the year in review, the number
of components in the composite index, the time series used and the name given to this index in the document.

                                             Year       No. comp.         Types of components∗                                                    Name
  Eastern Canada (ocean and atmosphere index)
  Petrie et al. (2006a)                      2005                 23      NAO, airT, ice, SST                                                     n/a
  Petrie et al. (2007a)                      2006                 23      NAO, airT, ice, SST                                                     Composite index
  Petrie et al. (2008a)                      2007                 23      NAO, airT, ice, SST                                                     Composite index
  Petrie et al. (2009a)                      2008                 23      NAO, airT, ice, SST                                                     Composite index
  Scotian shelf and Gulf of Maine (ocean only index)
  Petrie et al. (2006b)                   2005                     18     botT, stationT                                                          n/a
  Petrie et al. (2007b)                   2006                     18     botT, stationT                                                          Composite index
  Petrie et al. (2008b)                   2007                     18     botT, stationT                                                          Composite index
  Petrie et al. (2009b)                   2008                     18     botT, stationT                                                          Composite index
  Hebert et al. (2011)               2009–2010                     18     botT, stationT                                                          Composite index
  ...                                       ...                   ...     ...                                                                     ...
  Hebert et al. (2020)                    2018                     18     botT, stationT                                                          Composite index
  Newfoundland and Labrador shelf (ocean and atmosphere index)
  Colbourne et al. (2006)                    2005                  0      n/a                                                                     n/a
  Colbourne et al. (2007)                    2006                  0      n/a                                                                     n/a
  Colbourne et al. (2008)                    2007                 26      NAO, airT, ice, icebergs, SST, S27, botT, CIL, secT                     Composite index
  Colbourne et al. (2009)                    2008                 26      NAO, airT, ice, icebergs, SST, S27, botT, CIL, secT                     Composite climate index
  Colbourne et al. (2011)                    2010                 26      NAO, airT, ice, icebergs, SST, S27, botT, CIL, secT                     Composite climate index
  Colbourne et al. (2012)                    2011                 26      NAO, airT, ice, icebergs, SST, S27, botT, CIL, secT                     Composite climate index
  Colbourne et al. (2013)                    2012                 26      NAO, airT, ice, icebergs, SST, S27, botT, CIL, secT                     Composite climate index
  Colbourne et al. (2014)                    2013                 26      NAO, airT, ice, icebergs, SST, S27, botT, CIL, secT                     Composite climate index
  Colbourne et al. (2015)                    2014                 28      NAO, airT, ice, icebergs, SST, S27, botT, CIL, secT                     Composite climate index
  Colbourne et al. (2016)                    2015                 28      NAO, airT, ice, icebergs, SST, S27, botT, CIL, secT                     Composite climate index
  Colbourne et al. (2017)                    2016                 28      NAO, airT, ice, icebergs, SST, S27, botT, CIL, secT                     Composite climate index
  Cyr et al. (2019)                          2017                 28      NAO, airT, ice, icebergs, SST, S27, botT, CIL, secT                     Composite climate index
  Cyr et al. (2020)                          2018                 10      NAO, airT, ice, icebergs, SST, S27, botT, CIL                           NL climate index
n/a: not applicable. ∗ NAO: winter NAO; airT: air temperature at different sites; ice: sea ice parameters; SST: sea surface temperature in different sub-areas; botT: bottom
temperature in different sub-areas; stationT: temperature at monitoring stations (different depth ranges); S27: Station 27 temperature and salinity (different depth ranges); CIL:
cold intermediate layer parameters; secT: mean temperature along repeated hydrographic sections.

cal oceanography of the Scotian shelf and the Gulf of Maine.                                  conditions starting with the annual report of Colbourne et al.
These composite indices were derived by summing 23 and 18                                     (2006), although no composite climate index was presented
individual normalized anomalies, respectively (see Table 1                                    (see Table 1).
for a review of CSAS publications using such indices). While                                     Following the approach of Petrie et al. (2006a, b), a com-
the physical oceanographic index from the Scotian shelf and                                   posite climate index was developed for the NL shelf by Col-
the Gulf of Maine is still produced annually (see Hebert et al.,                              bourne et al. (2008). This composite climate index was de-
2020, for latest update), the eastern Canada meteorological,                                  rived by summing 26 individual normalized anomalies (e.g.
sea ice and SST index was last produced by Petrie et al.                                      winter North Atlantic Oscillation, air temperature at several
(2009a). Starting with the annual report for 2009 conditions,                                 sites, surface and bottom temperature at several sites, aver-
the meteorological, sea ice and physical oceanographic con-                                   age temperature, salinity and area of water colder than 0 ◦ C
ditions were integrated into a single report (Hebert et al.,                                  along oceanographic transects, etc.; see Table 1). These in-
2011, see also Table 1), and the eastern Canada atmospheric                                   dividual components did not, however, begin with the same
and ocean index was abandoned. Note that for the Newfound-                                    year. The number of components of this composite climate
land and Labrador (NL) shelf, sea ice and atmospheric condi-                                  index was increased to 28 in 2015 (Colbourne et al., 2015).
tions were reported together with the physical oceanographic                                  Although never explicitly named this way, this composite

Earth Syst. Sci. Data, 13, 1807–1828, 2021                                                                          https://doi.org/10.5194/essd-13-1807-2021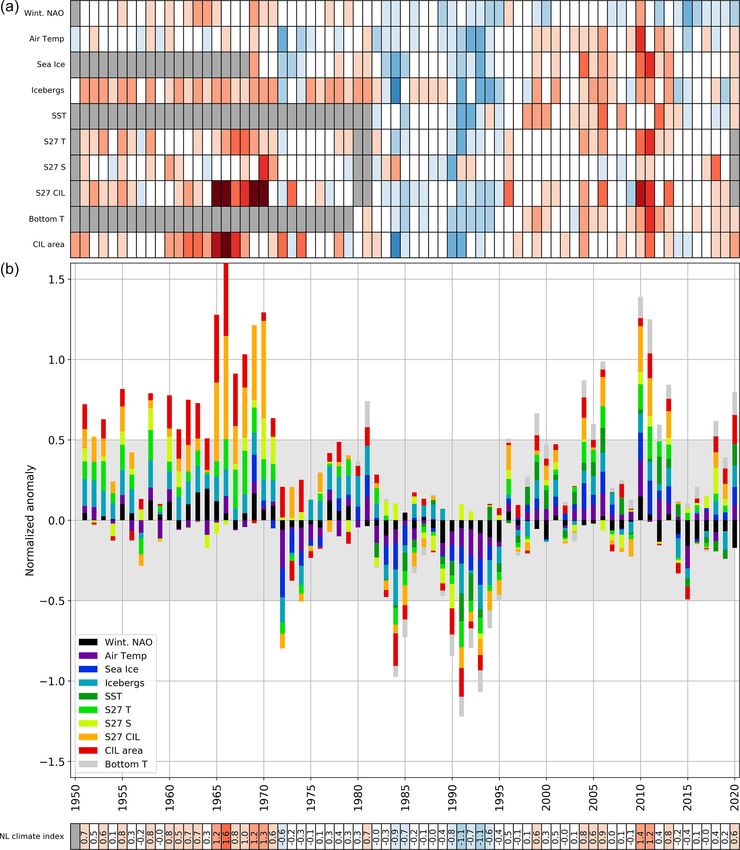
F. Cyr and P. S. Galbraith: NL climate index 1809
climate index (both the 26 and the 28 component defini-
tions) rapidly gained popularity among biologists, ecologist
and fisheries scientists in NL under the appellation Com-
posite Environmental Index, or CEI, the term used hereafter.
The CEI was used, for example, to assess the prospect of
several commercial marine resources (Koen-Alonso et al.,
2010; DFO, 2014), marine mammal stock fluctuations (DFO,
2020b; Hammill et al., 2021; Stenson et al., 2020) and the
ecosystem productivity as a whole (NAFO, 2017, 2018). The
CEI was last produced by Cyr et al. (2019).
A new climate index for the NL shelf is introduced here
to ensure the continuity of the studies mentioned above and
in a hope to feed new similar initiatives. This index was first
introduced by Cyr et al. (2020), but it is formalized, detailed
and made openly accessible for the first time here. At the
moment, this index runs from 1951 to 2020 but will be up-
dated annually (see Data availability). The main differences
with previous versions are the reduced number of compo-
nents (10) and the fact that the index is now calculated as the
average of the different components rather than their sum.
Details are provided in the next section.
2 NL climate index components
The NL climate index (NLCI) aims to represent the large-
scale climate conditions and state of the physical environ-
ment on the NL shelf and the Northwest Atlantic in general
(see Fig. 1 for map). The index is a composite of 10 com-
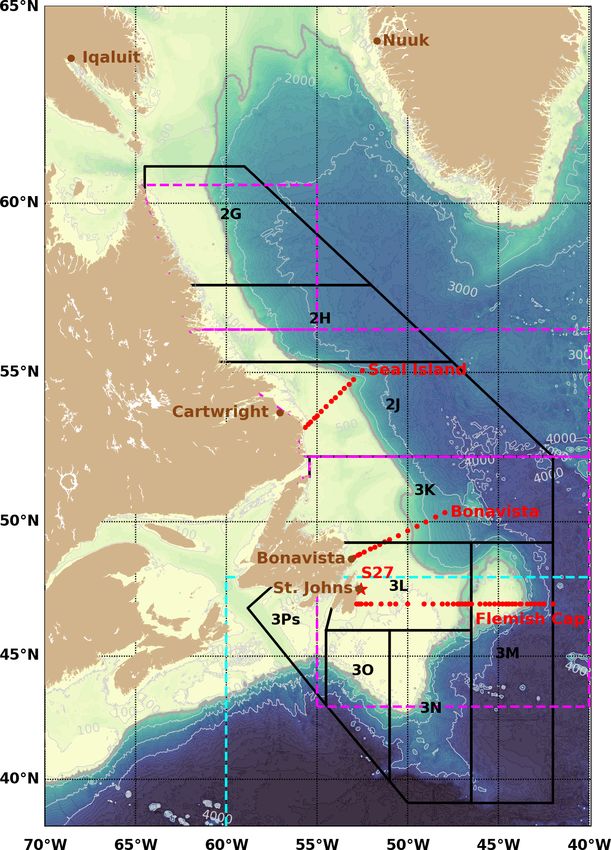
ponents (or subindices) estimated annually by DFO (e.g. Cyr Figure 1. Map and main bathymetric features of the Northwest
et al., 2020). These subindices are presented in the following Atlantic ocean. NAFO Divisions (sub-areas 2 and 3) on the New-
sub-sections. foundland and Labrador (NL) shelf are drawn. The AZMP hydro-
The NLCI and most subindices start in 1951. Prior to 1951, graphic sections Seal Island, Bonavista Bay and Flemish Cap are
there are too few observations for many of the subindices to shown with red dots. Long-term AZMP hydrographic Station 27 is
achieve a level of accuracy and precision that would provide highlighted with a red star. The five stations used for the air tem-
high confidence in their estimates. Except for the North At- perature time series are shown in brown. The three regions used for
lantic Oscillation (NAO), these subindices are presented in sea ice calculations are drawn with dashed magenta lines: northern
Labrador shelf, southern Labrador shelf and Newfoundland shelf,
terms of normalized anomalies (X̃):
respectively, from north to south. The region used by the IIP for
X − X clim iceberg sightings south of 48◦ N is drawn in dashed cyan. The shelf
X̃ = , (1) break is delimited by a thicker and darker contour corresponding to
SD(X)clim
the isobath 1000 m (used to clip the SST and bottom temperature).
where X represents any annual time series, and Xclim and
SD(X)clim are the average and standard deviation of X over
the climatological period. Following recommendations from
World Meteorological Organization standards, the climato- Iceland). While several operational definitions of the NAO
logical period used is 1991–2020 (World Meteorological Or- exist, the monthly NAO based on empirical orthogonal func-
ganization, 2017). Because this period was updated at the end tions (EOF) from the National Center for Environmental
of 2020, a complete series of relevant figures for this study Information of the National Oceanic and Atmospheric Ad-
are also provided in the Appendix referencing the previous ministration is used here. This definition better represents
climatological period of 1981–2010. the larger-scale influence of the SLP patterns above the
Northwest Atlantic and tends to be less noisy than the
station-based definition. This time series is available on-
2.1 North Atlantic Oscillation
line (https://www.ncdc.noaa.gov/teleconnections/nao/, last
The North Atlantic Oscillation (NAO) refers to the anomaly access: 4 March 2021). Because the monthly NAO index is
in the sea-level-pressure (SLP) difference between the sub- normalized over the 1950–2000 period, this subindex is not
tropical high (near the Azores) and the subpolar low (near re-normalized here.
https://doi.org/10.5194/essd-13-1807-2021 Earth Syst. Sci. Data, 13, 1807–1828, 2021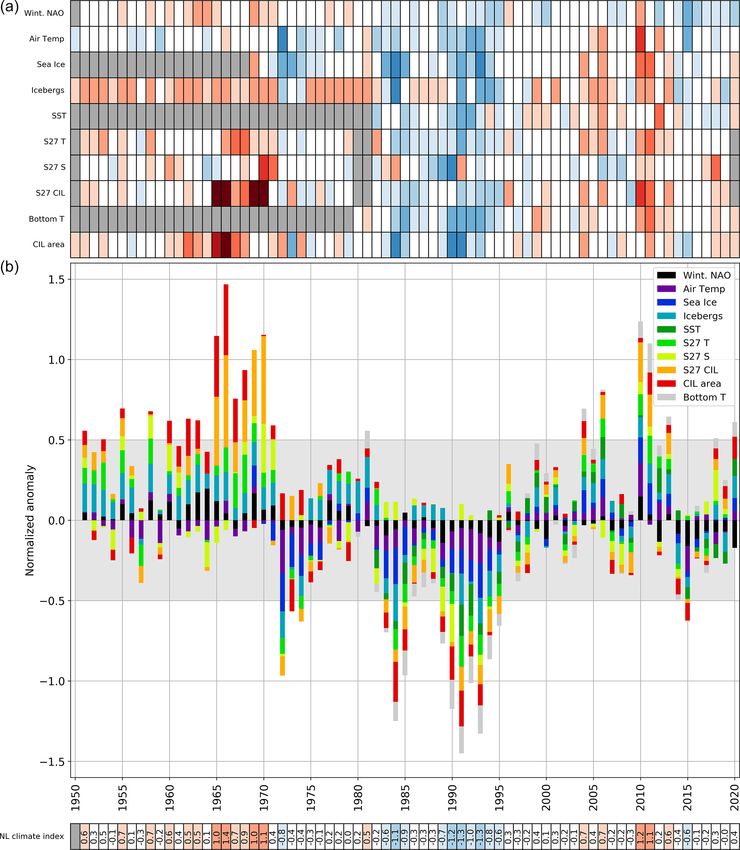
1810                                                                                   F. Cyr and P. S. Galbraith: NL climate index

                                                                          Annual normalized anomalies since 1951 for these five
                                                                       sites are presented in Fig. 3 under the form of a stacked
                                                                       bar plot. Despite the fact that these sites are spread around
                                                                       the North Atlantic, they often exhibit consistency in the sign
                                                                       of their anomalies, especially in the periods of very cold or
                                                                       warm years. While 1972 appears as the coldest year of this
                                                                       time series, the period of the early 1990s exhibits a sustained
                                                                       period of cold air temperature, with 1991, 1992 and 1993 be-
                                                                       ing respectively the sixth, second and third coldest years of
                                                                       the entire time series. This cold period was followed by the
                                                                       predominance of warmer-than-normal air temperatures at all
                                                                       sites from the mid-1990s to about 2013, with 2010 being the
                                                                       warmest year on record by a large extent. Except for 2015,
Figure 2. Winter North Atlantic Oscillation (NAO) index averaged       which was the coldest year since 1993, and 2018 (slightly
over December to March. Here positive anomalies, generally in-
                                                                       cold), recent years were close to normal.
dicative of colder conditions, are coloured in blue. The shaded area
corresponds to ±0.5 SD, indicating normal conditions. This time
series is one component of the NL climate index.                       2.3   Sea ice

                                                                       Sea ice season duration and maximum cover area are esti-
                                                                       mated from ice cover products obtained from the Canadian
   The winter NAO, defined as the average of monthly val-
                                                                       Ice Service (CIS). The methodology is described in Galbraith
ues from December to March, is considered here (Fig. 2). A
                                                                       et al. (2020) and briefly summarized here. The source CIS
positive phase of the NAO index is usually associated with
                                                                       products consist of weekly geographic information system
an intensification of the Icelandic Low and the Azores High
                                                                       (GIS) charts covering the east coast for the period 1969–2020
SLPs. Except for some years for which the SLP patterns are
                                                                       and Hudson Bay for the period 1980–2020. The Hudson Bay
spatially shifted (e.g. 1999, 2000 and 2018), positive winter
                                                                       charts include coverage of the northern Labrador shelf, and
NAO years usually favour strong northwesterly winds, cold
                                                                       the east coast charts cover the southern Labrador shelf, as
air and sea surface temperatures, and heavy ice conditions in
                                                                       well as the Newfoundland shelf (Fig. 1). For each of the three
the Northwest Atlantic (Colbourne et al., 1994; Drinkwater,
                                                                       regions, the seasonal maximum area of sea ice was deter-
1996; Petrie et al., 2007a). A predominance of a strongly pos-
                                                                       mined, as well as the ice season duration (Fig. 4). The former
itive winter NAO phase has persisted since 2012, including
                                                                       accounts for partial coverage (as opposed to sea ice extent),
the record high of +1.61 in 2015 (the record low of −1.47
                                                                       and the latter is obtained from a spatial average of the number
was in 2010). This recent positive phase of the NAO also
                                                                       of weeks with sea ice at every pixel, with zeros counted for
corresponded to an intensification of the convection in the
                                                                       areas where no ice was present but the 30 year climatology
Labrador Sea (Yashayaev and Loder, 2017).
                                                                       shows some. The normalized anomalies of these six time se-
                                                                       ries (duration and area over three regions) are averaged into
2.2    Air temperature                                                 a single index presented in a stacked bar plot (Fig. 4d). Each
                                                                       stacked colour in this plot represents its respective contri-
The air temperature subindex consists of the average of the            bution to the average. The numerical values of this sea ice
annual normalized anomalies at five coastal communities                subindex are reported in a colour-coded scorecard at the bot-
around the Northwest Atlantic: Nuuk (Greenland), Iqaluit               tom of this panel. Negative anomalies, indicative of warmer
(Baffin Island), Cartwright (Labrador), and Bonavista and              conditions, have been coloured red and positive anomalies
St. John’s in Newfoundland (see Fig. 1). These sites were              blue. This time series corresponds to the sea ice contribution
chosen because they are representative of both local (e.g. sea         to the NL climate index. The periods of maximum sea ice
ice formation and SST) and remote (e.g. icebergs originat-             cover and season duration are found in the early 1970s, mid-
ing from Greenland and freshwater fluxes from the Canadian             1980s and early 1990s. Since the early 1990s the severity of
Arctic) effects on the NL shelf. While the data for Nuuk are           the sea ice season has gradually decreased, reaching the low-
obtained from the Danish Meteorological Institute (Vinther             est values in 2011 and 2010. With the exception of a rebound
et al., 2006), the air temperature data from the Canadian sites        to near-normal values in 2014–2016, sea ice conditions have
are from the second generation of Adjusted and Homoge-                 been weak over recent years.
nized Canadian Climate Data (AHCCD) that accounts for
shifts in station location and changes in observation meth-            2.4   Iceberg count
ods (Vincent et al., 2012). When necessary, they are updated
using Environment Canada’s National Climate Data and In-               The number of icebergs drifting south of 48◦ N in the North-
formation Archive.                                                     west Atlantic (see dashed cyan box in Fig. 1) has been mon-

Earth Syst. Sci. Data, 13, 1807–1828, 2021                                             https://doi.org/10.5194/essd-13-1807-2021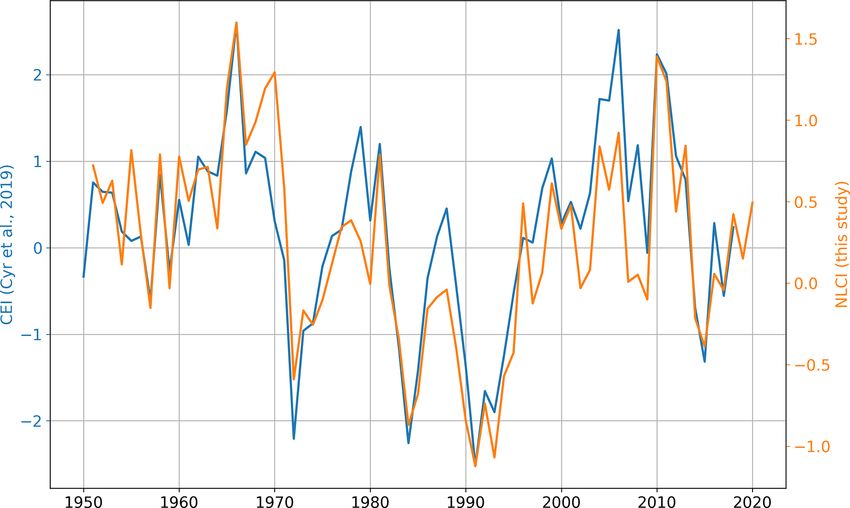
F. Cyr and P. S. Galbraith: NL climate index                                                                                             1811

Figure 3. Normalized annual air temperature anomalies for Nuuk, Iqaluit, Cartwright, Bonavista and St. John’s. This figure shows the
average of the five stations, in which the length of each bar corresponds to the relative contribution of the individual station to the average.
The shaded area corresponds to the 1991–2020 average ±0.5 SD. The numerical values of this time series are reported in a colour-coded
scorecard at the bottom of the figure. Positive anomalies (> 0.5 SD) are coloured red, while negative anomalies (< −0.5 SD) are coloured
blue. In both cases, the darker the colour, the stronger the anomaly. White corresponds to the climatological average ±0.5 SD. This time
series is one component of the NL climate index.

itored by the International Ice Patrol (IIP) of the US Coast              tute of Oceanography (1997–2020). Monthly anomalies are
Guard since 1900 (International Ice Patrol, 2020). These                  computed as the average of available daily anomalies at the
icebergs mostly originate from western Greenland (Marson                  pixel level within each geographical region, chosen to be
et al., 2018) and may carry with them important amounts of                the Northwest Atlantic Fisheries Organization (NAFO) Divi-
freshwater (Martin and Adcroft, 2010). The entire time series             sions of Fig. 1, except that here they are cropped at the shelf
is presented in Fig. 5. The 121-year average annual number                break. Details of the processing are in Galbraith et al. (2021)
is 495, and the 1991–2020 average is 771. An iceberg count                with the extended spatial coverage as in DFO (2020a).
above 1500 has been observed in some years, including in                     Figure 6 presents annual normalized anomalies averaged
2014, 2019, and between the early 1980s and mid-1990s. The                over the ice-free season, in which the contribution of each
all-time record of 2202 was reached in 1984. Only 2 years                 region is weighted according to its open-water area. The ice-
(1966 and 2006) in the 121-year time series reported no ice-              free season varies from as short as June to September in
bergs south of 48◦ N. Years with low iceberg numbers on                   NAFO Division 2G to as long as March to November in
the Grand Banks generally correspond to higher than nor-                  NAFO Division 3P (seasonal information in the legend of
mal air temperatures, lighter than normal sea ice conditions              Fig. 6). This time series corresponds to the SST contribution
and warmer than normal ocean temperatures on the NL shelf.                to the NLCI (normalized anomalies are colour coded at the
The normalized anomalies of this time series are provided in              bottom of the figure). This figure shows the colder than av-
the form of a scorecard below the main panel of Fig. 5. This              erage conditions that prevailed in the early 1990s, with 1991
time series, starting from 1951, corresponds to the icebergs              and 1992 being the coldest years of this time series. This pe-
contribution to the NLCI.                                                 riod was followed by a predominance of warmer than average
                                                                          conditions that lasted until about 2014. In recent years, the
                                                                          period 2015–2019 (except for 2016) was colder than normal
2.5   Sea surface temperature                                             (defined as SST
                                                                                       g < −0.5 SD or blue colours at the bottom of
Sea surface temperatures (SSTs) used here are a blend of                  Fig. 6). The year 2020 was, however, back to above-normal
data from Pathfinder version 5.3 (1982–2020), the Maurice                 SST for the first time since 2014.
Lamontagne Institute (1985–2013) and the Bedford Insti-

https://doi.org/10.5194/essd-13-1807-2021                                                  Earth Syst. Sci. Data, 13, 1807–1828, 2021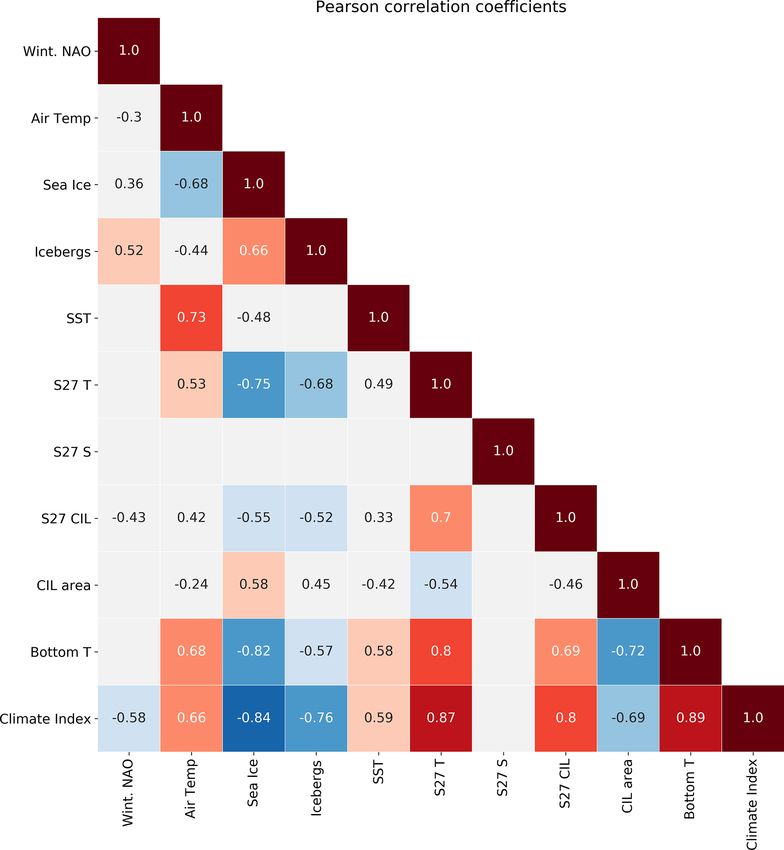
1812                                                                                      F. Cyr and P. S. Galbraith: NL climate index

Figure 4. Sea ice season duration (green) and seasonal maximum area covered by thick ice (red) for the northern and southern Labrador
shelves (a, b) and Newfoundland shelf (c). The northern Labrador time series starts in 1980, while the two others start in 1969. The six time
series are transformed into normalized anomalies and presented in a stacked bar fashion in panel (d). The scorecard at the bottom of this
last panel presents the numerical values of the mean normalized anomalies for each year. Here negative anomalies (indicative of warmer
conditions) are coloured red and positive anomalies (colder conditions) blue. This time series is one component of the NL climate index.

2.6    Station 27 data                                                   is the cold intermediate layer (CIL), a prominent feature of
                                                                         the NL ecosystem (Petrie et al., 1988). The CIL is defined
Station 27 (47◦ 32.80 N, 52◦ 35.20 W) is located in the Avalon           here as the water below 0 ◦ C and delineated with a thick
Channel just outside St. John’s harbour, NL (Fig. 1). It is one          black contour in Fig. 7a. This layer originates in the win-
of the longest hydrographic time series in Canada with fre-              ter as a cold surface layer which becomes isolated from the
quent (near-monthly basis) conductivity–temperature–depth                surface after the appearance of a seasonally heated surface
(CTD) observations since 1946. Station 27 was integrated                 layer during the spring (April–May). The CIL thus remains
into DFO’s AZMP in 1999. In addition to sampling during                  below the surface throughout most of the year, while its top
these traditional hydrographic surveys, this station has been            boundary slowly deepens from about 50 to 100 m as the heat
seasonally equipped with an automatic CTD profiling system               from the surface layer penetrates deeper into the water col-
installed on a surface buoy (type Viking) since 2017 (see Cyr            umn. While in deeper areas of the NL shelf a third warmer
et al., 2020, for further information).                                  layer is present beneath the CIL, at Station 27 the CIL gener-
   Station occupations were first combined into monthly av-              ally extends down to the bottom (∼ 176 m). The summer CIL
eraged temperature (T ) and salinity (S) profiles from which             core temperature is defined as the minimum temperature of
the climatological annual cycle was extracted (Fig. 7). This             the monthly averaged profile for June, July and August (see
figure shows the seasonal warming of the top layer (∼ 20 m),             below).
with temperature peaking in August before being mixed dur-                  The surface salinity at Station 27 is generally lowest (S <
ing the fall (Fig. 7a). Also visible in the temperature field            31) between early September and mid-October (Fig. 7b).

Earth Syst. Sci. Data, 13, 1807–1828, 2021                                                https://doi.org/10.5194/essd-13-1807-2021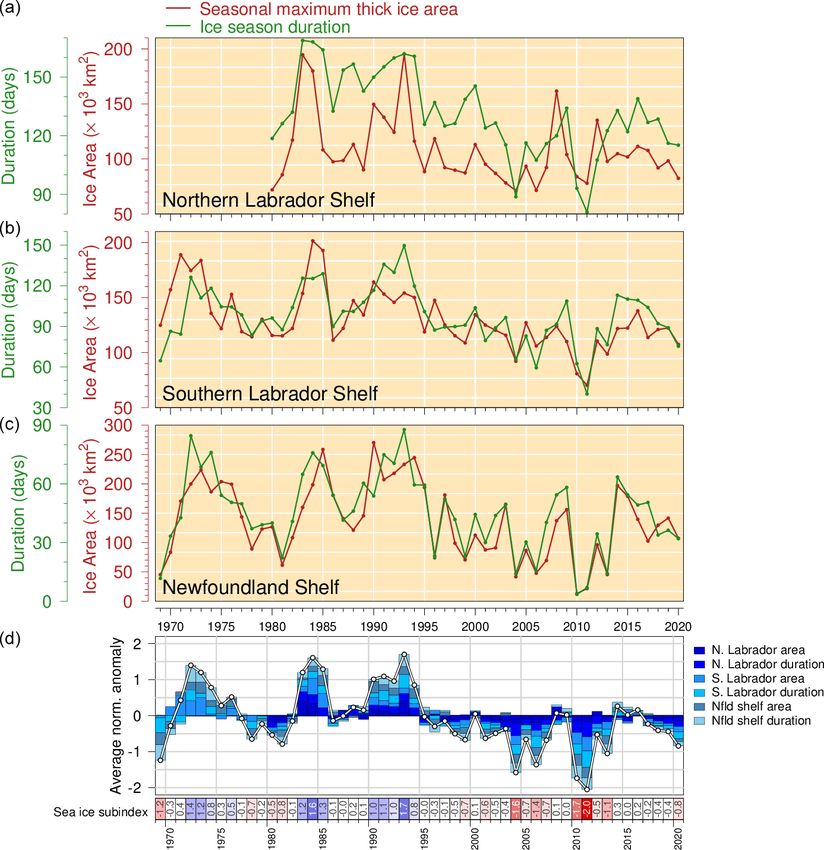
F. Cyr and P. S. Galbraith: NL climate index                                                                                         1813

Figure 5. Annual iceberg count crossing south of 48◦ N on the northern Grand Bank. The shaded area corresponds to the 1991–2020 average
±0.5 SD. The normalized anomaly of this time series is provided below the main panel under the form of a colour-coded scorecard. Here
negative anomalies are red (generally corresponding to warmer conditions) and positive anomalies blue. This time series is one component
of the NL climate index.

Figure 6. Sea surface temperature (SST) composite index in NAFO sub-areas 2 and 3 since 1982. This index is built by performing a
spatially weighted average of the seasonal SST normalized anomalies for each NAFO division (divisions and months used are provided on
the right-hand side of the figure). The numerical values of the normalized anomalies are provided in a colour-coded (red, warm; blue, cold)
scorecard at the bottom. This time series is one component of the NL climate index.

These low near-surface salinities, generally from early sum-            from 2020 have also been excluded because there were no
mer to late fall, are prominent features of the salinity cycle          station occupations during the first 6 months of the year
on the Newfoundland shelf and are largely due to the melting            due to the Covid-19 pandemic (first occupation occurred on
of coastal sea ice upstream and carried over by the Labrador            14 July, the latest start since 1946). In order to account for
coastal current. Below the surface, the salinity at any depth           possible changes in seasonal coverage, the annual anomalies
increases in the spring and peaks in the summer before de-              have been calculated as the average of monthly normalized
creasing in the fall as a consequence of vertical mixing.               anomalies.
   The data from Station 27, including the recent greater cov-             The vertically averaged (0–176 m) temperature exhibits
erage obtained from Viking buoy automatic casts, contribute             decadal-like cycles (Fig. 8a). The period between the mid-
to three subindices of the NL climate index: vertically av-             1980s and mid-1990s struck as the coldest decade of the
eraged T and S and the CIL core temperature (Fig. 8). The               last 70 years. It was followed by a gradual warming trend
focus here is on the period starting in 1951 for which the              that lasted 2 decades and peaked in 2011, the warmest year
seasonal coverage includes at least 8 months per year. Av-              of this time series. The period from the mid-1960s and the
erages from 1980 and 1981 are excluded because of insuffi-              early 1970s was also marked by sustained warmer than nor-
cient seasonal coverage (4 and 7 months, respectively). Data            mal temperatures. The end of this period coincided with

https://doi.org/10.5194/essd-13-1807-2021                                               Earth Syst. Sci. Data, 13, 1807–1828, 2021
1814                                                                                       F. Cyr and P. S. Galbraith: NL climate index

Figure 7. Climatological (1991–2020) annual cycle of tempera-
ture (a) and salinity (b) at Station 27. The grey contours are the
isopycnals (σ0 in kg m−3 ) derived from temperature and salinity
using the TEOS-10 package (McDougall and Barker, 2011). The
thick black line in (a) is the 0 ◦ C isotherm delimiting the top of the
CIL.

the freshest anomaly on record at Station 27 observed in
1970 (Fig. 8b), an event coinciding with the Great Salinity
Anomaly in the North Atlantic (Dickson et al., 1988). Simi-
larly, the recent warmer than normal period (2010–2013) was
followed by the second freshest anomaly on record observed
in 2018. This most recent fresh anomaly on the NL shelf co-
incides with a large-scale salinity anomaly in the subpolar
gyre (Holliday et al., 2020), but no clear causal relationship            Figure 8. Normalized anomalies of the vertically averaged temper-
has been established between the two. The saltiest anomaly                ature (a) and salinity (b) and CIL core temperature (c) at Station 27.
at Station 27 (1990) occurred during the cold period of the               Shaded areas in all panels correspond to the 1991–2020 average
late-1980s and early 1990s.                                               ±0.5 SD. These three time series are components of the NL climate
   The CIL subindex of Station 27 is also presented in Fig. 8c.           index.
This time series is the average normalized anomalies of
the summer (June–August) CIL core temperature (minimum
temperature of the monthly mean profile). The striking fea-               tablished using the area (in km2 ) of water below 0 ◦ C along
ture in this figure is the anomalously warm CIL anomaly                   Seal Island (SI), Bonavista Bay (BB) and Flemish Cap (FC)
present from the early 1960s to the mid-1970s. After the                  hydrographic sections (Fig. 1). These sections were selected
prevalence of a warm CIL in the early 2010s (with 2010                    because they have been systematically surveyed since the
and 2011 being the warmest years since the 1970s), there                  early 1950s before being formerly standardized by the In-
has been a recent period of a return to near-normal condi-                ternational Commission for the Northwest Atlantic Fisheries
tions (roughly 2014–2017) that receded in 2018 and 2019.                  in 1976 (ICNAF, 1978). Since 1999, these hydrographic sec-
The CIL subindex of Station 27 has not been calculated for                tions have been monitored by DFO as part of the AZMP.
2020.                                                                        Figure 9 shows the summer temperature along section SI
                                                                          during 2 extreme years, the warm 1965 and the cold 1990.
2.7    Cold intermediate layer on the NL shelf                            The 1991–2020 climatology is also presented. For each sam-
                                                                          pled summer, the CIL area (e.g. the area of the section delim-
As mentioned above, the CIL is a prominent feature of the                 ited by the thick black contour in Fig. 9) was calculated. For
NL shelf. It is found almost everywhere in the subsurface                 example, in 1990, the area of the CIL was 26.9 km2 , while it
during the summer. In order to highlight the influence of the             was only 1.5 km2 in 1965. This shows the amplitude of the
CIL on the shelf as a whole, a proxy for its volume is es-                interannual variability of the CIL and its potential influence

Earth Syst. Sci. Data, 13, 1807–1828, 2021                                                  https://doi.org/10.5194/essd-13-1807-2021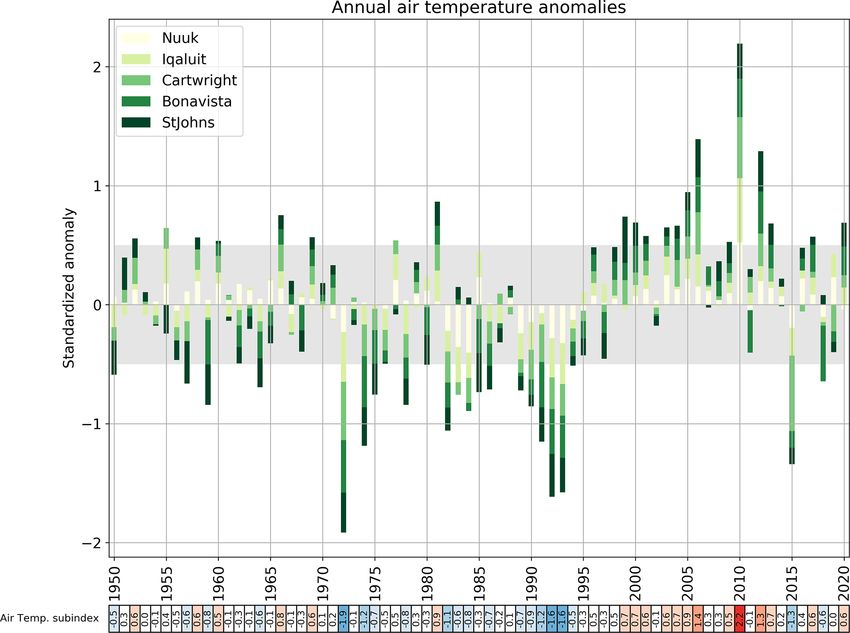
F. Cyr and P. S. Galbraith: NL climate index                                                                                      1815

                                                                         2.8    Bottom temperature

                                                                         Canada has been conducting random stratified trawl surveys
                                                                         in NAFO sub-areas 2 and 3 of the NL shelf since 1971
                                                                         (Doubleday, 1981). Since 1980, temperature (and salinity
                                                                         since 1990) measurements have been available for most of
                                                                         these fishing sets thanks to trawl-mounted CTD observations.
                                                                         The scientific trawl surveys target NAFO Subdivision 3Ps
                                                                         (south coast of Newfoundland) and Division 3LNO (Grand
                                                                         Banks) during the spring surveys and Divisions 2H (northern
                                                                         Labrador), 2J (southern Labrador), 3K (eastern Newfound-
                                                                         land) and 3LNO (Grand Banks) during the fall (see map
                                                                         Fig. 1). These surveys, combined with other available data
                                                                         from multiple sources (see below), are used to provide large-
                                                                         spatial-scale oceanographic information of the NL shelf, in-
                                                                         cluding information on the bottom habitat parameters of nu-
                                                                         merous commercial species (e.g. Cyr et al., 2020).
                                                                            The method used to derive the bottom temperature was
                                                                         introduced by Cyr et al. (2019) and is briefly summarized
                                                                         here. First, all available annual profiles of temperature (sci-
                                                                         entific trawl surveys, AZMP hydrographic campaigns, sur-
                                                                         veys from other DFO regions, international oceanographic
                                                                         campaigns, expendable bathythermographs, Argo program,
                                                                         etc.) are vertically averaged in 5m bins and vertically inter-
                                                                         polated to fill missing bins. Then, for each season (April–
                                                                         June for spring and September–December for fall), all data
                                                                         are averaged on a regular 0.1◦ × 0.1◦ (latitudinal × longitu-
                                                                         dinal) grid to obtain one seasonal profile per grid cell. Since
                                                                         this grid has missing data in many cells, each depth level is
                                                                         horizontally linearly interpolated. For each grid point deeper
                                                                         than 10 m, the bottom observation is considered as the data at
Figure 9. Summer temperature along hydrographic section Seal Is-         the closest depth to the GEBCO 2014 Grid bathymetry (ver-
land (SI) during 1965 (a), 1990 (b) and the 1991–2020 average (c).       sion 20141103) to a maximum 50 m difference. In order to
The vertical axis is limited to the top 500 m, and the horizontal axis   only focus on the shelf, observations deeper than 1000 m are
is the distance (in km) from the coast. The CIL (T < 0 ◦ C) is high-     clipped. This method is applied for all years between 1980
lighted with a thick black contour. Station locations are indicated      and 2020 from which the 1991–2020 climatology is also de-
with thin dashed lines.                                                  rived. In order to match the scientific surveys schedule, the
                                                                         normalized anomalies of bottom temperature are calculated
                                                                         separately for NAFO Divisions 3Ps and 3LNO in the spring
on the ecosystem. In 1990, most of the sea floor along section
                                                                         and 2H, 2J, 3K and 3LNO in the fall. The time series of the
SI was in direct contact with the CIL and water below −1 ◦ C.
                                                                         bottom temperature for both seasons is presented in a stacked
In 1965, when the CIL was small and fragmented, none of the
                                                                         bar plot in Fig. 11. This figure shows the cold phase from the
sea floor was in contact with the CIL, and the bottom condi-
                                                                         mid-1980s to the mid-1990s, followed by a warmer phase
tions were in consequence several degrees warmer than in
                                                                         that peaked in 2011. A scorecard at the bottom of this figure
1990.
                                                                         presents the mean normalized anomalies. The latter corre-
   The normalized anomalies of the CIL area for sections
                                                                         sponds to the bottom temperature contribution to the NLCI.
SI, BB and FC are presented in Fig. 10. This figure high-
lights again the warmer conditions (negative anomalies) of
the 1960s and the colder conditions of the mid-1980s and                 3     Discussion
early 1990s. The average of the normalized anomalies are
shown in a scorecard at the bottom of the main panel and                 Figure 12 presents the NLCI. In Figure 12a, the 10 subindices
correspond to the CIL area contribution to the NLCI.                     described in the previous section are colour coded accord-
                                                                         ing to their normalized anomaly: < 0.5 SD in blue, > 0.5 SD
                                                                         in red, and everything within ±0.5 SD in white. Note that
                                                                         for some indices where positive anomalies generally indi-
                                                                         cate colder conditions (e.g. sea ice), the natural sign of the

https://doi.org/10.5194/essd-13-1807-2021                                               Earth Syst. Sci. Data, 13, 1807–1828, 2021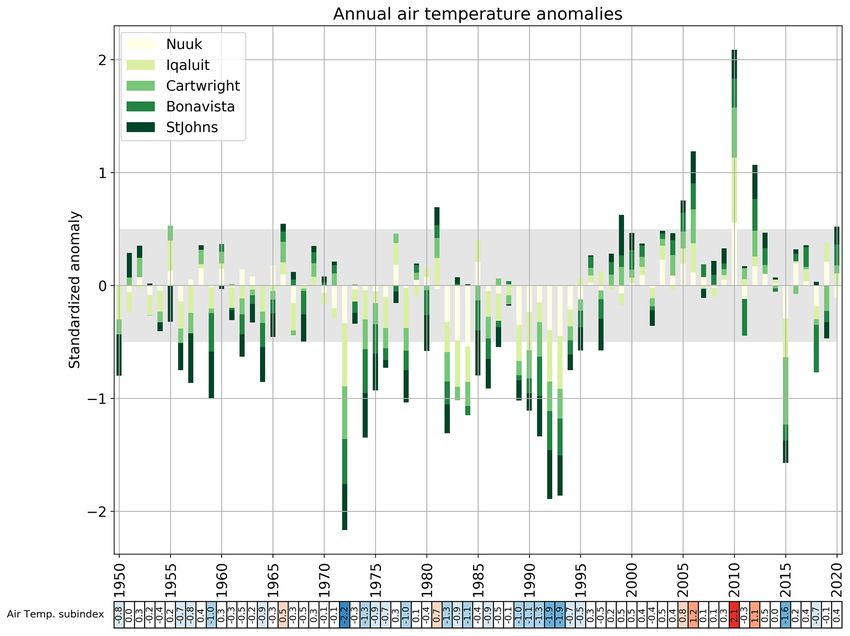
1816                                                                                     F. Cyr and P. S. Galbraith: NL climate index

Figure 10. Normalized anomalies of the mean CIL area for hydrographic sections Seal Island (SI), Bonavista Bay (BB) and Flemish Cap
(FC). This time series correspond to the average of the three sections, in which the contribution of each section is represented. The shaded
area corresponds to the 1991–2020 average ±0.5 SD. The numerical values of this time series are reported in a colour-coded scorecard at the
bottom of the figure. Here negative anomalies (generally corresponding to warmer conditions) are coloured red and positive anomalies blue.
This time series is one component of the NL climate index.

Figure 11. Normalized anomalies of bottom temperature in NAFO Divisions 3LNOPs (spring) and 2HJ3KLNO (fall). This time series
corresponds to the average of the two seasons, in which each contribution is represented. The shaded area corresponds to the 1991–2020
average ±0.5 SD. The numerical values of this time series are reported in a colour-coded scorecard at the bottom of the figure. This time
series is one component of the NL climate index.

Earth Syst. Sci. Data, 13, 1807–1828, 2021                                                https://doi.org/10.5194/essd-13-1807-2021
F. Cyr and P. S. Galbraith: NL climate index                                                                                             1817

Figure 12. Newfoundland and Labrador climate index described in this study. The scorecard in panel (a) represents the 10 subindices used
to construct the climate index, colour coded according to their value (blue negative, red positive, white neutral). These time series are the
following: winter NAO index (starts in 1951), the air temperature at five sites (starts in 1950), the sea ice season duration and maximum area
for the northern Labrador, southern Labrador and Newfoundland shelves (starts in 1969), the number of icebergs (starts in 1950), SSTs in
NAFO Division 2GHJ3KLNOP (starts in 1982), vertically averaged temperature and salinity at Station 27, CIL core temperature at Station 27
(starts in 1951), the summer CIL areas on the hydrographic sections Seal Island, Bonavista Bay and Flemish Cap (starts in 1950), and the
spring and fall bottom temperature in NAFO Divisions 3LNOPs and 2HJ3KLNO, respectively (starts in 1980). The sign of some indices
(NAO, ice, icebergs, salinity and CIL volume) has been reversed when positive anomalies are generally indicative of colder conditions. Grey
cells in the scorecards indicate the absence of data. Panel (b) represents the climate index in a stacked-bar fashion, in which the total length
of the bar is the average of the respective subindices and in which their relative contribution to the average is adjusted proportionally. The
scorecard at the bottom of the figure shows the colour-coded numerical values of the climate index.

components has been reversed such that a positive value                   Numerical values of the NLCI are also reported in single a
now corresponds to warm conditions (see figure caption).                  scorecard at the bottom of the figure.
The subindices in their natural signs are also provided in the               The NLCI highlights the different regimes prevailing on
dataset. Figure 12b shows a stacked bar plot where annual                 the NL shelf and the Northwest Atlantic since 1951. For ex-
NLCI values are represented by the total length of the bar                ample, the 1960s stands out as the warmest decade of the en-
(arithmetic average of all subindices available for a certain             tire 1951–2020 period, although it is heavily driven by CIL
year), while individual colours have been adjusted to repre-              anomalies. The following few decades were gradually cool-
sent the relative contribution of each subindex to the NLCI.              ing until the early 1990s, with 1991 being the coldest year
                                                                          on record since 1951. The warming trend that followed the

https://doi.org/10.5194/essd-13-1807-2021                                                  Earth Syst. Sci. Data, 13, 1807–1828, 2021
1818 F. Cyr and P. S. Galbraith: NL climate index Figure 13. Pearson correlation (r) matrix between the different subindices of the NL climate index and the NL climate index itself. Red and blue colours denote a positive and negative correlation, respectively. Only significant correlations (p values < 0.05) are shown. Correlations less than ±0.5 have been left white. The natural signs (not reversed) of the subindices have been used here in order to illustrate relationships in which positive (warm) anomalies in one variable (e.g. Station 27 temperature) are reflected by negative anomalies in another (e.g. sea ice). early 1990s peaked in 2010–2011 (depending on the record) sequence on the sea ice production and the production of the and was followed by recent cooling that culminated in 2015. CIL water. Because the CIL is in direct contact with the sea This recently observed cold period on the NL shelf (roughly floor on a large portion of the NL shelf, it has a direct in- 2014–2017) was the coldest period since the early 1990s fluence on its bottom temperature. It is thus not surprising (Cyr et al., 2020) and coincided with the intensification of that the bottom temperature of the NL shelf is also nega- convection in the Labrador Sea that created the largest vol- tively correlated with sea ice (r = −0.82). Finally, because ume of Labrador Sea Water since the early 1990s (Yashayaev the air temperature has a direct influence on both SST and sea and Loder, 2017). ice, the correlation is good (r = 0.73 and r = −0.68, respec- The correlations among the different subindices are pre- tively) with these variables even if the annual air temperature sented in Fig. 13. This shows the interactions between the average is used (i.e. includes both winter and summer). In- different components of the NLCI while giving insights into terestingly, the winter NAO is not well correlated with any of the functioning of the NL shelf climate. The vertically aver- the variables (r < 0.5) except slightly with the number of ice- aged temperature at Station 27 is well correlated with the bot- bergs (r = +0.52). While the winter NAO is expected to cap- tom temperature on the NL shelf (r = 0.80) and with the core ture some decadal dynamics (warm 1960s and early 2010s; temperature of the CIL (r = 0.70). The temperature at Sta- cold 1990s and late 2010s), the weak correlation between the tion 27 is also negatively correlated with sea ice (r = −0.75). NAO and the different NLCI components suggests that lag This is because the harshness of the winter has a direct con- or inertial effects are important on the NL shelf (e.g. it takes Earth Syst. Sci. Data, 13, 1807–1828, 2021 https://doi.org/10.5194/essd-13-1807-2021
F. Cyr and P. S. Galbraith: NL climate index                                                                                      1819

several consecutive cold winters to build an important vol-
ume of cold water). It also suggests that the NLCI captures
other types of variability specific to the NL shelf compared
to the winter NAO alone. The good correlation between Sta-
tion 27 temperature and other components of the climate
index adds weight to numerous studies suggesting that this
station is representative of the large-scale climate of the NL
shelf (e.g. Petrie et al., 1991, 1992; Colbourne et al., 1994;
Drinkwater, 1996; Han et al., 2015).
   Figure 13 also includes the correlation coefficients be-
tween the NLCI index and all its subindices. Although a vi-
sual examination of Fig. 8 shows matching warm/fresh and
cold/salty periods at Station 27, salinity is not significantly
correlated with any of the subindices of the NLCI. This sug-        Figure 14. Comparison between the Composite Environmental In-
gests that the relation between freshwater and water tem-           dex (CEI) used until recently (e.g. Cyr et al., 2019) and the new NL
                                                                    climate index introduced here. Note the difference vertical axis sys-
perature do not operate on a year to year basis but may be
                                                                    tems. The correlation between the CEI and the NLCI is r = 0.87.
lagged or relevant on longer (e.g. decadal) timescales. Salin-      Note that in order to be consistent with the last version of the CEI,
ity was, however, kept in the NLCI because it has recently          the NLCI based on the 1981–2010 climatology was used here. The
been shown to be a useful predictor for the NL ecosystem            CEI is also presented here as the average of the 28 components
(e.g. Murphy et al., 2021 on capelin spawning dynamics) and         rather than their sum.
because freshwater fluxes on the NL shelf are an important
contribution to the freshwater budget of the North Atlantic,
with consequences on the North Atlantic overturning circula-        and awk that are difficult to make available on a public repos-
tion (Florindo-López et al., 2020). Because the 10 subindices       itory. Please contact the authors for any related question.
are provided here, users of the NLCI can, however, recom-
pute their own climate index using any combination of the
                                                                    5    Data availability
subindices. Except for salinity at Station 27, the correlation
coefficient between the NLCI and its subindices varies be-          The data presented in this study are available here:
tween |r| = 0.58 and |r| = 0.89, the latter with the NL shelf       https://doi.org/10.20383/101.0301 (Cyr and Galbraith,
bottom temperature. The absence of very strong correlation          2020). Three comma-separated value (CSV) files are
(e.g. |r| > 0.90) between the different subindices, and be-         provided:
tween any subindex and the climate index itself, shows the
relative independence of the different components of the cli-           – NL_climate_index.csv contains annual values of the NL
mate index and gives confidence in the choices made for its               climate index.
design.
   Finally, there is a good correlation (r = 0.87) between this         – NL_climate_index_all_fields.csv contains annual values
new climate index and the averaged version of the CEI used                of the 10 subindices making up the NL climate indices
until recently (e.g. Cyr et al., 2019), ensuring continuity with          (with some signs reversed; see Fig. 12 caption). The av-
previous studies using this index (Fig. 14). A notable dif-               erage of these 10 subindices corresponds to the NL cli-
ference between the two indices, however, is that the vari-               mate index.
ance of the former (σ 2 = 1.2) is larger than that of the latter
(σ 2 = 0.4; note the different vertical axis systems in Fig. 14).       – NL_climate_index_all_fields_natural_signs.csv
It is likely that the greater independence of the components              contains annual values of the 10 subindices mak-
used here reduces the variance of the new climate index com-              ing up the NL climate indices in line with their natural
pared with the previous CEI that used 28 components, some                 sign.
being highly correlated (e.g. air temperature at four sites,
                                                                    For the foreseeable future, this index will be updated on an
SST in overlapping or close areas, bottom temperature and
                                                                    annual basis once the update from the previous year is com-
salinity in neighbouring regions, etc.).
                                                                    pleted (e.g. targeted release in the spring of the following
                                                                    year).

4   Code availability                                               6    Conclusions

The codes used to develop the subindices are interconnected         This article describes a new climate index for the New-
mixtures of Python, shell scripts (tcsh and bash), Make, Perl       foundland and Labrador shelf. This index is composed of 10

https://doi.org/10.5194/essd-13-1807-2021                                           Earth Syst. Sci. Data, 13, 1807–1828, 2021
1820 F. Cyr and P. S. Galbraith: NL climate index subindices representing different aspect of the NL ecosys- tem: winter NAO, air temperature, sea ice season severity, iceberg count, SST, Station 27 temperature, salinity and CIL core temperature, CIL area on three hydrographic sections, and bottom temperature on the NL shelf. Some subindices are season specific (e.g. winter NAO, icebergs and sea ice season severity), while others are representative of the entire annual cycle (e.g. air temperature and seasonal SST), which may mask strong seasonal contrasts during some years. Be- cause the NLCI and all 10 subindices are made available, users can derive their own custom index by averaging any combination of subindices. It is expected that this new in- dex will be useful for ecosystem studies, stock assessments, forecast models of marine resources and more. Earth Syst. Sci. Data, 13, 1807–1828, 2021 https://doi.org/10.5194/essd-13-1807-2021
F. Cyr and P. S. Galbraith: NL climate index                                                                                 1821

Appendix A: Figures using 1981–2010 climatology

The change in the climatological period from 1981–2010 to
1991–2020 is a shift towards a warmer reference period (ex-
clusion of the cold mid-1980s and inclusion of the warmer
mid-2010s). The consequences of this shift for the different
subindices is generally an exacerbation of the colder anoma-
lies and a reduction in the amplitude of the warmer anoma-
lies. This appendix provides alternate versions of the figures
provided in the paper that used a 1991–2020 climatology but
this time using the previous climatological period of 1981–
2010.

Figure A1. Same as Fig. 3 but using a climatology referenced to the 1981–2010 period.

https://doi.org/10.5194/essd-13-1807-2021                                               Earth Syst. Sci. Data, 13, 1807–1828, 2021
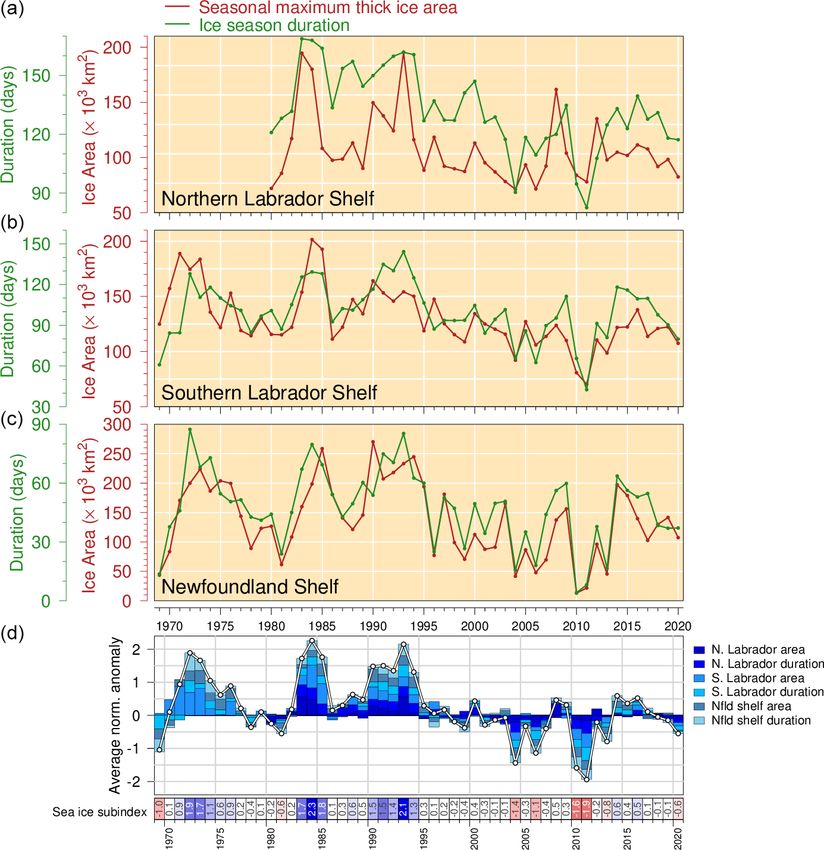
1822                                                                                    F. Cyr and P. S. Galbraith: NL climate index

Figure A2. Same as Fig. 4 but using a climatology referenced to the 1981–2010 period.

Figure A3. Same as Fig. 5 but using a climatology referenced to the 1981–2010 period.

Earth Syst. Sci. Data, 13, 1807–1828, 2021                                              https://doi.org/10.5194/essd-13-1807-2021
F. Cyr and P. S. Galbraith: NL climate index                                                                                 1823

Figure A4. Same as Fig. 6 but using a climatology referenced to the 1981–2010 period.

Figure A5. Same as Fig. 8 but using a climatology referenced to the 1981–2010 period.

https://doi.org/10.5194/essd-13-1807-2021                                               Earth Syst. Sci. Data, 13, 1807–1828, 2021
1824                                                                                     F. Cyr and P. S. Galbraith: NL climate index

Figure A6. Same as Fig. 10 but using a climatology referenced to the 1981–2010 period.

Figure A7. Same as Fig. 11 but using a climatology referenced to the 1981–2010 period.

Earth Syst. Sci. Data, 13, 1807–1828, 2021                                               https://doi.org/10.5194/essd-13-1807-2021
F. Cyr and P. S. Galbraith: NL climate index                                                                              1825

Figure A8. Same as Fig. 12 but using a climatology referenced to the 1981–2010 period.

https://doi.org/10.5194/essd-13-1807-2021                                            Earth Syst. Sci. Data, 13, 1807–1828, 2021
1826                                                                                     F. Cyr and P. S. Galbraith: NL climate index

Author contributions. FC designed the study, led the writing and           2010, Canadian Science Advisory Secretariat Research Docu-
calculated most of the subindices. PSG calculated the SST and the          ment, 2011/089, iv + 31 pp., Fisheries and Oceans Canada, Ot-
sea ice subindices and participated in the writing. Both authors dis-      tawa, Canada, 2011.
cussed in depth the science, technical details and the structure of     Colbourne, E., Craig, J., Fitzpatrick, C., Senciall, D., Stead, P.,
this article.                                                              and Bailey, W.: An assessment of the physical oceanographic
                                                                           environment on the Newfoundland and Labrador Shelf during
                                                                           2011, Canadian Science Advisory Secretariat Research Docu-
Competing interests. The authors declare that they have no con-            ment, 2012/044, iv + 33 pp., Fisheries and Oceans Canada, Ot-
flict of interest.                                                         tawa, Canada, 2012.
                                                                        Colbourne, E., Craig, J., Fitzpatrick, C., Senciall, D., Stead, P.,
                                                                           and Bailey, W.: An assessment of the physical oceanographic
Acknowledgements. This work is a contribution to the Atlantic              environment on the Newfoundland and Labrador Shelf during
Zone Monitoring Program (AZMP) of Fisheries and Oceans Canada              2012, Canadian Science Advisory Secretariat Research Docu-
(DFO). The authors thank the numerous scientists, technicians, cap-        ment, 2013/052, v + 35 pp., Fisheries and Oceans Canada, Ot-
tains and crew members who have participated in the sampling and           tawa, Canada, 2013.
analysis effort since 1951. The authors also thank Pierre Pepin,        Colbourne, E., Holden, J., Craig, J., Senciall, D., Bailey, W., Stead,
who provided comments on an early version of the manuscript, and           P., and Fitzpatrick, C.: Physical Oceanographic Conditions on
Bee Berx and two anonymous reviewers for their valuable com-               the Newfoundland and Labrador Shelf During 2013, Canadian
ments on the study.                                                        Science Advisory Secretariat Research Document, 2014/094, v
                                                                           + 38 pp., Fisheries and Oceans Canada, Ottawa, Canada, 2014.
                                                                        Colbourne, E., Holden, J., Craig, J., Senciall, D., Bailey, W., Stead,
                                                                           P., and Fitzpatrick, C.: Physical Oceanographic Conditions on
Review statement. This     paper    was     edited    by
                                                                           the Newfoundland and Labrador Shelf During 2014, Canadian
Giuseppe M. R. Manzella and reviewed by Barbara Berx and
                                                                           Science Advisory Secretariat Research Document, 2015/053, v
two anonymous referees.
                                                                           + 37 pp., Fisheries and Oceans Canada, Ottawa, Canada, 2015.
                                                                        Colbourne, E., Holden, J., Senciall, D., Bailey, W., Snook, S., and
                                                                           Higdon, J.: Physical Oceanographic Conditions on the New-
References                                                                 foundland and Labrador Shelf During 2015, Canadian Science
                                                                           Advisory Secretariat Research Document, 2016/079, v + 40 pp.,
Colbourne, E., Narayanan, S., and Prinsenberg, S.: Climatic                Fisheries and Oceans Canada, Ottawa, Canada, 2016.
  changes and environmental conditions in the Northwest Atlantic,       Colbourne, E., J. Holden, Snook, S., Han, G., Lewis, S., Senciall,
  1970–1993, ICES Journal of Marine Science Symposia, 198,                 D., Bailey, W., Higdon, J., and Chen, N.: Physical Oceanographic
  311–322, 1994.                                                           Conditions on the Newfoundland and Labrador Shelf during
Colbourne, E., Craig, J., Fitzpatrick, C., Senciall, D., Stead, P.,        2016, Canadian Science Advisory Secretariat Research Docu-
  and Bailey, W.: An assessment of the physical oceanographic              ment, 2017/079, v + 50 pp., Fisheries and Oceans Canada, Ot-
  environment on the Newfoundland and Labrador Shelf during                tawa, Canada, 2017.
  2005, Canadian Science Advisory Secretariat Research Docu-            Cyr, F. and Galbraith, P. S.: Newfoundland and Labrador
  ment, 2006/030, ii + 14 pp., Fisheries and Oceans Canada, Ot-            climate index, Federated Research Data Repository,
  tawa, Canada, 2006.                                                      https://doi.org/10.20383/101.0301, 2020.
Colbourne, E., Craig, J., Fitzpatrick, C., Senciall, D., Stead, P.,     Cyr, F., Colbourne, E., Holden, J., Snook, S., Han, G., Chen, N.,
  and Bailey, W.: An assessment of the physical oceanographic              Bailey, W., Higdon, J., Lewis, S., Pye, B., and Senciall, D.:
  environment on the Newfoundland and Labrador Shelf during                Physical Oceanographic Conditions on the Newfoundland and
  2006, Canadian Science Advisory Secretariat Research Docu-               Labrador Shelf during 2017, Canadian Science Advisory Secre-
  ment, 2007/030, iv + 14 pp., Fisheries and Oceans Canada, Ot-            tariat Research Document, 2019/051, iv + 58 pp., Fisheries and
  tawa, Canada, 2007.                                                      Oceans Canada, Ottawa, Canada, 2019.
Colbourne, E., Craig, J., Fitzpatrick, C., Senciall, D., Stead, P.,     Cyr, F., Colbourne, E., Galbraith, P. S., Gibb, O., Snook, S., Bishop,
  and Bailey, W.: An assessment of the physical oceanographic              C., Chen, N., Han, G., and Senciall, D.: Physical Oceanographic
  environment on the Newfoundland and Labrador Shelf during                Conditions on the Newfoundland and Labrador Shelf during
  2007, Canadian Science Advisory Secretariat Research Docu-               2018, Canadian Science Advisory Secretariat Research Docu-
  ment, 2008/020, iv + 16 pp., Fisheries and Oceans Canada, Ot-            ment, 2020/018., iv + 48 pp., Fisheries and Oceans Canada, Ot-
  tawa, Canada, 2008.                                                      tawa, Canada, 2020.
Colbourne, E., Craig, J., Bailey, W., Fitzpatrick, C., Senciall, D.,    de Young, B. and Rose, G. A.: On recruitment and distribution of
  and Stead, P.: An assessment of the physical oceanographic               Atlantic cod (Gadus morhua) off Newfoundland, Canadian Jour-
  environment on the Newfoundland and Labrador Shelf during                nal Fisheries Aquatic Sciences, 50, 2729–2741, 1993.
  2008, Canadian Science Advisory Secretariat Research Docu-            DFO: Short-term stock prospects for cod, crab and shrimp in the
  ment, 2009/032, iv + 19 pp., Fisheries and Oceans Canada, Ot-            Newfoundland and Labrador region (Divisions 2J3KL), Cana-
  tawa, Canada, 2009.                                                      dian Science Advisory Secretariat Science Response, 2014/049,
Colbourne, E., Craig, J., Fitzpatrick, C., Senciall, D., Stead, P.,        Fisheries and Oceans Canada, Ottawa, Canada, 2014.
  and Bailey, W.: An assessment of the physical oceanographic
  environment on the Newfoundland and Labrador Shelf during

Earth Syst. Sci. Data, 13, 1807–1828, 2021                                                https://doi.org/10.5194/essd-13-1807-2021
F. Cyr and P. S. Galbraith: NL climate index 1827 DFO: Oceanographic conditions in the Atlantic zone in 2019, Cana- of Newfoundland and Labrador, Can. J. Fish. Aquat. Sci., 51, dian Science Advisory Secretariat Science Advisory Report, 2126–2146, https://doi.org/10.1139/f94-214, 1994. 2020/028, Fisheries and Oceans Canada, Ottawa, Canada, 2020a. ICNAF: List of ICNAF Standard Oceanographic Sections DFO: 2019 Status of Northwest Atlantic Harp Seals, Pagophilus and Stations, ICNAF Selected Papers Number 3, 109–117, groenlandicus, Canadian Science Advisory Secretariat Science https://doi.org/10.1111/j.1949-8594.1914.tb16026.x, 1978. Advisory Report, 2020/020, Fisheries and Oceans Canada, Ot- International Ice Patrol: International Ice Patrol Annual Count of tawa, Canada, 2020b. Icebergs South of 48 Degrees North, 1900 to Present, Version 1, Dickson, R. R., Meincke, J., Malmberg, S. A., and Lee, A.: The NSIDC, https://doi.org/10.7265/z6e8-3027, 2020. “great salinity anomaly” in the northern North Atlantic 1968– IPCC: IPCC Special Report on the Ocean and Cryosphere in a 1982, Prog. Oceanogr., 1, 103–151, 1988. Changing Climate, edited by: Pörtner, H.-O., Roberts, D. C., Doubleday, W.: Manual on groundfish surveys in the Northwest At- Masson-Delmotte, V., Zhai, P., Tignor, M., Poloczanska, E., lantic, NAFO Science Council Studies, Northwest Atlantic Fish- Mintenbeck, K., Alegría, A., Nicolai, M., Okem, A., Petzold, J., eries Organization, Dartmouth, Canada, 2, 7–55, 1981. Rama, B., and Weyer, N. M., in press, 2019. Drinkwater, K. F.: Atmospheric and oceanic variability in Koen-Alonso, M., Pepin, P., and Mowbray, F.: Exploring the role the northwest Atlantic during the 1980s and early 1990s, of environmental and anthropogenic drivers in the trajectories Journal of Northwest Atlantic Fishery Science, 18, 77–97, of core fish species of the Newfoundland-Labrador marine com- https://doi.org/10.2960/J.v18.a6, 1996. munity, NAFO Scientific Council Meeting, SCR Doc. 1, 1–16, Florindo-López, C., Bacon, S., Aksenov, Y., Chafik, L., Colbourne, Northwest Atlantic Fisheries Organization, Dartmouth, Canada, E., and Penny Holliday, N.: Arctic ocean and hudson bay fresh- 2010. water exports: New estimates from seven decades of hydro- Koen-Alonso, M., Pepin, P., Fogarty, M. J., Kenny, A., and graphic surveys on the Labrador shelf, J. Climate, 33, 8849– Kenchington, E.: The Northwest Atlantic Fisheries Organi- 8868, https://doi.org/10.1175/JCLI-D-19-0083.1, 2020. zation Roadmap for the development and implementation of Galbraith, P. S., Chassé, J., Shaw, J.-L., Dumas, J., Caverhill, C., an Ecosystem Approach to Fisheries: structure, state of de- Lefaivre, D., and Lafleur, C.: Physical Oceanographic Conditions velopment, and challenges, Marine Policy, 100, 342–352, in the Gulf of St. Lawrence during 2019, Canadian Science Advi- https://doi.org/10.1016/j.marpol.2018.11.025, 2019. sory Secretariat Research Document, 2020/30, iv + 88 pp., Fish- Lear, W. H. and Parsons, L. S.: History and management of the eries and Oceans Canada, Ottawa, Canada, 2020. fishery for northern cod in NAFO Divisions 2J, 3K and 3L, in: Galbraith, P. S., Larouche, P., and Caverhill, C.: A sea- Perspectives on Canadian marine fisheries management, edited surface temperature homogenization blend for the by: Parsons, L. and Lear, W., Canadian Bulletin of Fisheries and Northwest Atlantic, Can. J. Remote Sens., in press, Aquatic Sciences no. 226, Fisheries and Oceans Canada, Ottawa, https://doi.org/10.1080/07038992.2021.1924645, 2021. Canada, 55–89, 1993. Hammill, M., Stenson, G. B., Mosnier, A., and Doniol-Valcroze, Levin, P. S., Fogarty, M. J., Matlock, G. C., and Ernst, M.: T.: Trends in harp seal, Pagophilus groenlandicus, abundance in Integrated ecosystem assessments. U.S. Department of Com- the Northwest Atlantic, 1952–2019, Canadian Science Advirory merce, NOAA Tech. Memo. NMFS-NWFSC-92, 20 pp., Na- Secretariat Research Document, 2020/006, iv + 28 pp., Fisheries tional Oceanic and Atmospheric Administration, National Tech- and Oceans Canada, Ottawa, Canada, 2021. nical Information Service Springfield, VA, USA, 2008. Han, G., Colbourne, E., Pepin, P., and Xie, Y.: Statis- Marson, J. M., Myers, P. G., Hu, X., and Le Sommer, J.: Using Ver- tical Projections of Ocean Climate Indices off New- tically Integrated Ocean Fields to Characterize Greenland Ice- foundland and Labrador, Atmosphere-Ocean, 57, 3–17, bergs’ Distribution and Lifetime, Geophys. Res. Lett., 45, 4208– https://doi.org/10.1080/07055900.2015.1047732, 2015. 4217, https://doi.org/10.1029/2018GL077676, 2018. Hebert, D., Pettipas, R., and Petrie, B.: Meteorological, sea ice and Martin, T. and Adcroft, A.: Parameterizing the fresh-water physical oceanographic conditions on the Scotian shelf and in flux from land ice to ocean with interactive icebergs in the Gulf of Maine during 2009 and 2010, Canadian Science Ad- a coupled climate model, Ocean Model., 34, 111–124, visory Secretariat Research Document, 2011/094, vi + 32 pp., https://doi.org/10.1016/j.ocemod.2010.05.001, 2010. Fisheries and Oceans Canada, Ottawa, Canada, 2011. McDougall, T. J. and Barker, P. M.: Getting started with TEOS-10 Hebert, D., Pettipas, R., and Brickman, D.: Physical Oceanographic 70 and the Gibbs Seawater (GSW) Oceanographic Toolbox, 28 Conditions on the Scotian Shelf and in the Gulf of Maine dur- pp., SCOR/IAPSO WG127, ISBN 978-0-646-55621-5, 2011. ing 2018, Canadian Science Advisory Secretariat Research Doc- Muffley, B., Gaichas, S., DePiper, G., Seagraves, R., and Lucey, S.: ument, pp. iv + 55 pp., Fisheries and Oceans Canada, Ottawa, There Is no I in EAFM Adapting Integrated Ecosystem Assess- Canada, 2020. ment for Mid-Atlantic Fisheries Management, Coastal Manage., Holliday, N. P., Bersch, M., Berx, B., Chafik, L., Cunningham, S., 49, 90–106, https://doi.org/10.1080/08920753.2021.1846156, Florindo-lópez, C., Hátún, H., Johns, W., Josey, S. A., Larsen, 2021. K. M. H., Mulet, S., Oltmanns, M., Reverdin, G., Rossby, Mullowney, D. R., Rose, G. A., Dawe, E. G., Rowe, S., T., Thierry, V., Valdimarsson, H., and Yashayaev, I.: Ocean Maillet, G. L., and Pedersen, E. J.: Temperature influ- circulation causes the largest freshening event for 120 years ences on growth of unfished juvenile Northern cod (Gadus in eastern subpolar North Atlantic, Nat. Commun., 11, 585, morhua) during stock collapse, Fish. Oceanogr., 28, 612–627, https://doi.org/10.1038/s41467-020-14474-y, 2020. https://doi.org/10.1111/fog.12447, 2019. Hutchings, J. A. and Myers, R. A.: What can be learned from the Murphy, H., Adamack, A., and Cyr, F.: Identifying the drivers of the collapse of a renewable Resource? Atlantic cod, Gadus morhua, abrupt and persistent delay in capelin spawning timing following https://doi.org/10.5194/essd-13-1807-2021 Earth Syst. Sci. Data, 13, 1807–1828, 2021
You can also read