Verification of the EURO-CORDEX RCM Historical Run Results over the Pannonian Basin for the Summer Season - MDPI

Page created by Tiffany Barrett
 
CONTINUE READING
Verification of the EURO-CORDEX RCM Historical Run Results over the Pannonian Basin for the Summer Season - MDPI
atmosphere

Article
Verification of the EURO-CORDEX RCM Historical Run
Results over the Pannonian Basin for the Summer Season
Irida Lazić *, Milica Tošić and Vladimir Djurdjević *

                                          Faculty of Physics Institute for Meteorology, University of Belgrade, Dobračina 16, 11000 Belgrade, Serbia;
                                          milica.tosic@ff.bg.ac.rs
                                          * Correspondence: irida.lazic@ff.bg.ac.rs (I.L.); vdj@ff.bg.ac.rs (V.D.)

                                          Abstract: In previous projects that focused on dynamical downscaling over Europe, e.g., PRUDENCE
                                          and ENSEMBLES, many regional climate models (RCMs) tended to overestimate summer air temper-
                                          ature and underestimate precipitation in this season in Southern and Southeastern Europe, leading
                                          to the so-called summer drying problem. This bias pattern occurred not only in the RCM results but
                                          also in the global climate model (GCM) results, so knowledge of the model uncertainties and their
                                          cascade is crucial for understanding and interpreting future climate. Our intention with this study
                                          was to examine whether a warm-and-dry bias is also present in the state-of-the-art EURO-CORDEX
                                          multi-model ensemble results in the summer season over the Pannonian Basin. Verification of EURO-
                                          CORDEX RCMs was carried out by using the E-OBS gridded dataset of daily mean, minimum, and
                                          maximum near-surface air temperature and total precipitation amount with a horizontal resolution
                                          of 0.1 degrees (approximately 12 km × 12 km) over the 1971–2000 time period. The model skill for
                                selected period was expressed in terms of four verification scores: bias, centered root mean square
         
                                          error (RMSE), spatial correlation coefficient, and standard deviation. The main findings led us to
Citation: Lazić, I.; Tošić, M.;         conclude that most of the RCMs that overestimate temperature also underestimate precipitation.
Djurdjević, V. Verification of the       For some models, the positive temperature and negative precipitation bias were more emphasized,
EURO-CORDEX RCM Historical Run            which led us to conclude that the problem was still present in most of the analyzed simulations.
Results over the Pannonian Basin for
the Summer Season. Atmosphere 2021,
                                          Keywords: EURO-CORDEX; summer drying problem; regional climate model evaluation; E-OBS;
12, 714. https://doi.org/10.3390/
                                          Pannonian Basin; temperature; precipitation
atmos12060714

Academic Editor: Alexandre M.
Ramos
                                          1. Introduction
Received: 30 April 2021                        To carry out more realistic regional climate simulations, climate models demand the
Accepted: 28 May 2021                     representation of processes from global and large scales to regional and local scales. Hence,
Published: 31 May 2021                    climate-change impacts on communities require tools, such as regional climate models
                                          (RCMs), to complement the results of global climate models (GCMs) [1]. Consequently, the
Publisher’s Note: MDPI stays neutral      output of RCMs is primarily used as initial information for assessments on possible climate
with regard to jurisdictional claims in   change in the future and its potential future risks to socioeconomic or environmental
published maps and institutional affil-   sectors. However, during the last three decades of regional climate modeling research and
iations.                                  development, RCMs have evolved into multipurpose modeling tools [2].
                                               Dynamic downscaling represents a method of using the RCM at a finer resolution
                                          to improve the results of coarse-scale GCMs. RCMs are driven by GCM lateral boundary
                                          conditions (LBCs), and they modulate the driver’s results at local scales due to the higher
Copyright: © 2021 by the authors.         spatial resolution and the more complex physics described in the models [3–5]. GCMs
Licensee MDPI, Basel, Switzerland.        capture complex topographical mountainous regions exceedingly smoothed due to coarse
This article is an open access article    spatial resolution [6]. Hence, RCMs add regional detail as a response to regional-scale
distributed under the terms and           forcing, such as topography, with more explicitly described physics in the model as a result
conditions of the Creative Commons        of increasing spatial resolution (e.g., References [4,7]).
Attribution (CC BY) license (https://
creativecommons.org/licenses/by/
4.0/).

Atmosphere 2021, 12, 714. https://doi.org/10.3390/atmos12060714                                            https://www.mdpi.com/journal/atmosphere
Verification of the EURO-CORDEX RCM Historical Run Results over the Pannonian Basin for the Summer Season - MDPI
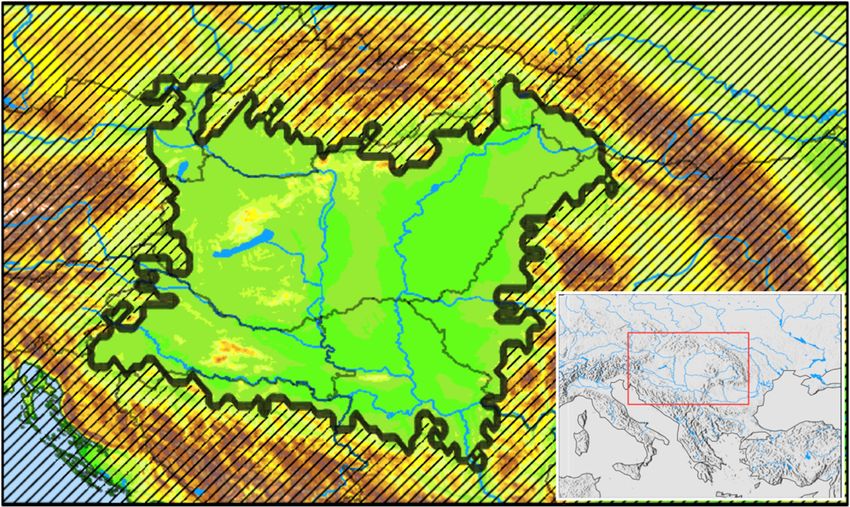
Atmosphere 2021, 12, 714                                                                                           2 of 23

                                 This issue of “added value” using RCMs has been demonstrated in many studies,
                           especially for simulation of precipitation over areas with complex topography, such as the
                           Alpine region, which are well known to affect precipitation [7,8] with the emphasized en-
                           hanced effect during summer convective rainfall [9,10]. Even in the absence of topography,
                           due to a better representation of underlying physics parameterizations, RCMs generate
                           more credible climate change signals with the observed climatological data [7,11–13]. Al-
                           though RCMs are anticipated to add the value of downscaling at scales that are not resolved
                           by the GCMs, they can also improve results on the large scales of the driving GCM [14].
                                 For decades, the climate research community has put efforts toward achieving a large
                           ensemble to cover all uncertainty sources in future climate projections at regional to local
                           scales [15]. Through international science coordination and partnerships, successive CMIP
                           (Coupled Model Intercomparison Project) initiatives were established by WCRP (The World
                           Climate Research Programme) to study and intercompare GCMs to provide large ensem-
                           bles [16,17]. On the other hand, European projects such as PRUDENCE, ENSEMBLES, and
                           EURO-CORDEX (the European branch of the international CORDEX initiative) put efforts
                           to achieve high-resolution climate descriptions based on RCMs. The RCM community
                           has grown rapidly during the CORDEX (Coordinated Regional Climate Downscaling
                           Experiment) project as the main reference framework for regional dynamical downscaling
                           research [2]. For instance, EURO-CORDEX is derived from the accomplishments of former
                           EU projects such as PRUDENCE and ENSEMBLES [18]. The EURO-CORDEX projection
                           ensemble has a high-resolution (0.11 degrees), which has not been attained in previous
                           projects, that offers a more robust assessment of climate change projections over Europe
                           and defines the degree of uncertainty indicating alternative developments [2,17–19]. The
                           benefits of using RCM ensembles are particularly evident if the focus is on localized ex-
                           treme weather events due to the demand for high-resolution probabilistic climate change
                           information [2,19], which is crucial for risk-based impact studies.
                                 Despite the fact that RCMs have constantly improved over decades, some prominent
                           scientific issues remain, so the scientific community needs to consider these issues. One of
                           the remaining issues known to the larger scientific community is the so-called “summer
                           drying” problem attributed to RCM climate simulations over certain parts of Europe.
                           According to [20] and former studies [21], dry and warm biases during the summer over
                           southeastern Europe are mainly attributed to RCMs, although they are less visible in GCM
                           results. The main reason for too dry and too warm climate simulation is mainly not related
                           to systematic errors in the large-scale general circulation. As shown in Reference [20],
                           the reduction in the summer drying problem could be a result of improving the physical
                           parameterization and land-surface parameter distribution constructed by Reference [22] in
                           RCMs, as well as improving the dynamics in RCMs [21,23].
                                 Seneviratne et al. [24] examined the influence of soil moisture coupling in RCMs.
                           Soil moisture plays an important role in the climate system as a source of water for the
                           atmosphere. Soil moisture is related to evapotranspiration from land, a major component of
                           the continental water cycle and significant energy flux. Consequently, soil moisture–climate
                           interactions and feedbacks are manifested through impacts on temperature and precipita-
                           tion [25]. According to the impact of soil moisture on evapotranspiration variability, three
                           soil moisture regimes are important to climate models: dry, transitional, and wet. Regimes
                           vary in space and are sensitive to the soil, climate, and vegetation characteristics [26]. The
                           transitional regime associated with the strongest impact of soil moisture on evapotran-
                           spiration and large mean evapotranspiration is important due to uncertainties in RCMs
                           related to soil moisture–atmosphere coupling [24,27]. From spring to summer, in central
                           Europe and parts of the Mediterranean, the soil moisture regime shifts from wet soils
                           to a transitional regime [26]. As a consequence, soil moisture–atmosphere coupling can
                           strongly affect temperature variability in regions such as the Mediterranean for the present
                           climate and Central and Eastern Europe for the future climate [24]. Anders et al. [28] took
                           a step toward decreasing dry and warm biases during summer in a small part of Southeast
                           Europe by changing soil characteristics, although these model biases still remain in this
Verification of the EURO-CORDEX RCM Historical Run Results over the Pannonian Basin for the Summer Season - MDPI
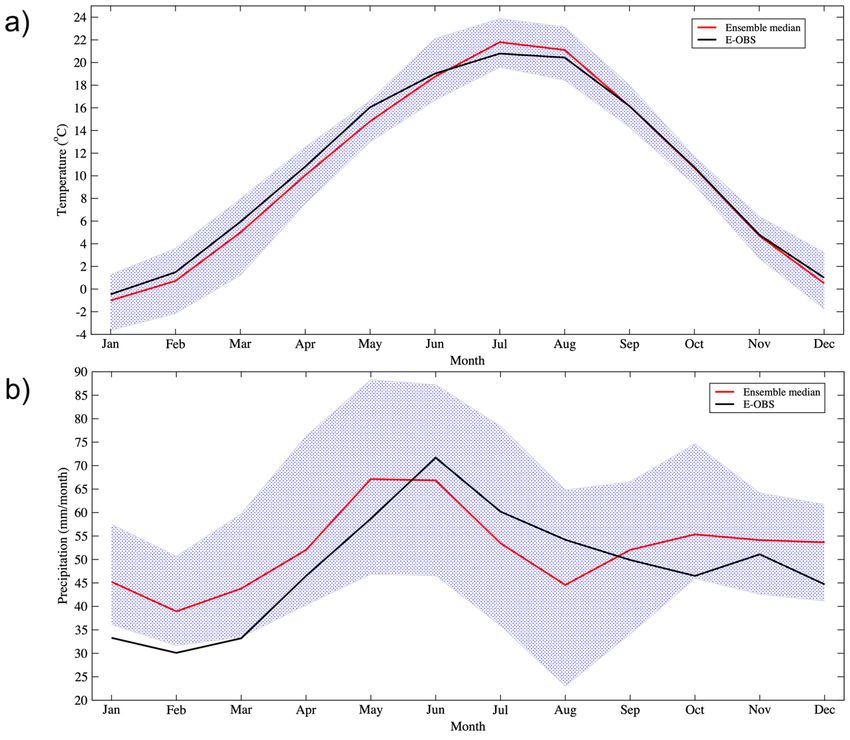
Atmosphere 2021, 12, 714                                                                                          3 of 23

                           region. Hence, as shown in previous studies, the “summer drying” problem still represents
                           a field of examination, and to better understand the sources and reasons for the summer
                           drying problem, further research is needed.
                                 RCMs driven by quasi-observed boundary conditions (ERAs) that have participated
                           in the MERCURE project (Modeling European Regional Climate: Understanding and
                           Reducing Errors) showed warm and dry bias during summer, which represents typical
                           RCM features in a large drainage basin known as the Danube catchment [23,29]. The
                           Pannonian Basin can be considered a subdomain of the Danube catchment. With an almost
                           enclosed structure, the Pannonian Basin represents an outstanding natural laboratory for
                           studying the physical processes of interest [30]. The Pannonian basin is very interesting
                           from the geographical point of view, but also it is one of the most intensive agriculture
                           production areas in Europe, so it is of great importance to understand future climate
                           impacts, and before that step, understanding the quality of available RCM results, is a
                           starting point. In recent decades, enriched regions with rich plant and food production have
                           been affected by more frequent extreme events, such as heatwaves, droughts, and extreme
                           precipitation [31–34]. According to climate projections, the Pannonian Basin appears to be
                           more vulnerable in the future and among the hotspot regions with the highest impacts on
                           socioeconomic sectors [30,33]. Hence, the overall aim of the present study is to investigate
                           the credibility of RCMs in EURO-CORDEX multi-model ensembles to simulate surface air
                           temperature and precipitation in the Pannonian Basin due to the well-known “summer
                           drying” problem [35–38]. Because RCMs are driven by GCMs, simulation biases are a
                           combination of both GCM and RCM biases originating from a variety of sources [38,39],
                           so uncertainty in RCMs is described as a ‘cascade of uncertainty’ [40]. To provide a
                           beneficial basis for policy-making, uncertainty in RCM simulations must be accounted
                           for as much as possible. The data and study area, observation gridded E-OBS dataset,
                           evaluated RCM simulations, applied methods, and evaluation metrics are discussed in
                           Section 2. Section 3 presents the analysis of EURO-CORDEX RCM performance to simulate
                           the mean, maximum, and minimum temperatures and precipitation over the Pannonian
                           Basin. Section 4 provides the main conclusions and a summary of this study.

                           2. Materials and Methods
                           2.1. Data and Study Area
                                 To verify EURO-CORDEX RCMs over the Pannonian Basin, daily model results were
                           extracted from the EURO-CORDEX database [18,19] and compared with data derived from
                           the E-OBS gridded dataset [41]. The following datasets with a horizontal resolution of
                           0.11 degrees (approximately 12 km × 12 km) were used for comparison: daily mean near-
                           surface air temperature, minimum near-surface air temperature, maximum near-surface
                           air temperature, and precipitation (hereafter referred to as tas, tasmin, tasmax, and pre,
                           respectively).
                                 The verification area shown in Figure 1 is the subdomain in the center of the region
                           bounded by longitudes, 14◦ E and 27◦ E, and latitudes, 43.5◦ N and 50◦ N, in which
                           topographic elevation is below 200 m. According to the fact that the Pannonian valley is
                           a large lowland area surrounded by mountains, we focused in this study on verification
                           statistics calculation exclusively over the valley part of the wider region, specifically the
                           part which is under certain terrain altitude. Our decision was driven by the fact that this
                           area was known for the temperature and precipitation biases presented in the previous
                           publications, which clearly coincided with the lowland terrain. In many other papers,
                           model verification is mainly focused and calculated over regular rectangular geographical
                           areas, which means that in our case and with our approach, the area-averaged errors can
                           be hidden by mixing results over lowland and surrounding mountains. With our approach,
                           we tried to extract as much as possible information about these biases focusing on a very
                           specific area (nor regular), both in terms of topography, but also in terms of the model
                           error position. This subdomain is introduced to remove the impact of scores acquired over
                           surrounding mountains on the average score value for the Pannonian Valley.
Verification of the EURO-CORDEX RCM Historical Run Results over the Pannonian Basin for the Summer Season - MDPI
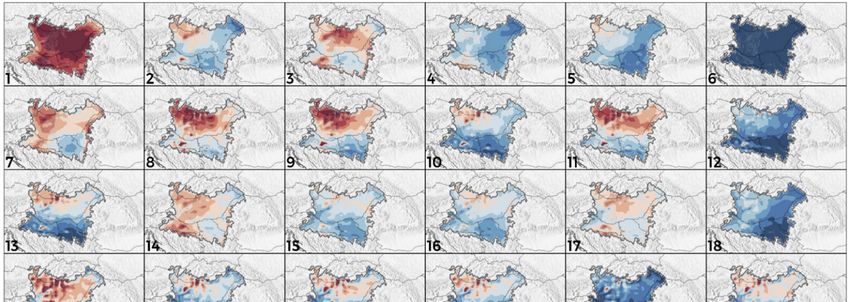
Atmosphere 2021, 12, x FOR PEER REVIEW                                                                                                      4 of 23

Atmosphere 2021, 12, 714                                                                                                                     4 of 23
                                  error position. This subdomain is introduced to remove the impact of scores acquired over
                                  surrounding mountains on the average score value for the Pannonian Valley.

                                  Figure1.1.The
                                 Figure     ThePannonian
                                                PannonianBasin,
                                                             Basin,central
                                                                    centralvalley
                                                                            valleyisisindicated
                                                                                       indicatedas
                                                                                                 asaanot-hatched
                                                                                                      not-hatchedarea
                                                                                                                  areathat
                                                                                                                       thatisisalso
                                                                                                                                alsobounded
                                                                                                                                     bounded
                                  by the thick black line. In the bottom  right corner,   the wider  Southeast Europe  region   is given
                                 by the thick black line. In the bottom right corner, the wider Southeast Europe region is given with    with
                                  the red rectangle indicating boundaries of the main figure.
                                 the red rectangle indicating boundaries of the main figure.

                                         ThePannonian
                                        The    PannonianBasin,
                                                            Basin,alsoalsoknown
                                                                           knownas  asthe
                                                                                        theCarpathian
                                                                                             CarpathianBasin Basinor orCentral
                                                                                                                        CentralDanubian
                                                                                                                                   DanubianBasin,
                                                                                                                                              Basin,
                                   is one  of the  world’s   largest   enclosed   basins    and   lies in the  southeastern
                                 is one of the world’s largest enclosed basins and lies in the southeastern part of central     part of central  Eu-
                                 Europe. The basin is surrounded by the Alps in the northwest, the Carpathian Mountainsin
                                   rope.  The   basin  is surrounded      by  the  Alps   in  the   northwest,    the  Carpathian    Mountains
                                 inthethe
                                        northeastern,
                                           northeastern, andandthe the
                                                                    Dinaric   AlpsAlps
                                                                         Dinaric    in the insouthwest
                                                                                               the southwestdirection   and represents
                                                                                                                   direction               a subdo-
                                                                                                                                and represents     a
                                   main   of the  Danube    catchment.     The  basin   is  centered    on  the territory
                                 subdomain of the Danube catchment. The basin is centered on the territory of Hungary,      of Hungary,    northern
                                   Serbia, northeast
                                 northern               Croatia, Croatia,
                                              Serbia, northeast     northeastern   Slovenia,Slovenia,
                                                                              northeastern       eastern Austria,      westernwestern
                                                                                                            eastern Austria,     Slovakia,  western
                                                                                                                                          Slovakia,
                                   Ukraine,Ukraine,
                                 western       and westernandRomania.
                                                                western During
                                                                            Romania. the Miocene
                                                                                          During the   andMiocene
                                                                                                            Pliocene epochs,     a shallow
                                                                                                                       and Pliocene          ancient
                                                                                                                                         epochs,   a
                                   Pannonian
                                 shallow         Sea existed
                                             ancient  Pannonian in this region,
                                                                      Sea existedsoin
                                                                                    thethis
                                                                                         Pannonian
                                                                                             region, so  Basin  is a valuableBasin
                                                                                                           the Pannonian        natural
                                                                                                                                     is alaboratory
                                                                                                                                          valuable
                                   for the study
                                 natural           of thefor
                                            laboratory     water
                                                               the and
                                                                    studyenergy
                                                                            of thecycles
                                                                                   water[30,36].     Additionally,
                                                                                             and energy                the orographic
                                                                                                             cycles [30,36].              character-
                                                                                                                                Additionally,   the
                                   istics of the  relatively  flat  and  homogeneous         central   part  of the  basin
                                 orographic characteristics of the relatively flat and homogeneous central part of the basinwith   an excellent   ob-
                                   servational
                                 with            network
                                        an excellent        allow us tonetwork
                                                        observational       study some
                                                                                     allowprocesses
                                                                                              us to studyin detail,  such as land–surface
                                                                                                             some processes                    inter-
                                                                                                                                 in detail, such  as
                                   actions, precipitation
                                 land–surface                 systems,
                                                   interactions,          surface energy,
                                                                     precipitation   systems,  andsurface
                                                                                                     water energy,
                                                                                                             budgets.and [36]. In accordance
                                                                                                                             water              with
                                                                                                                                    budgets. [36].
                                 Inthese  facts, thewith
                                      accordance      mainthese
                                                             goal facts,
                                                                    of thethe
                                                                            Pannonian
                                                                               main goal  Basin    Experiment,
                                                                                              of the   PannonianwhichBasinisExperiment,
                                                                                                                               a part of thewhich
                                                                                                                                              Global
                                 isEnergy
                                     a part and   Water
                                             of the  GlobalExchanges
                                                              Energy and (GEWEX)
                                                                               Waterproject
                                                                                       Exchangesof the(GEWEX)
                                                                                                         WCRP, isproject
                                                                                                                      to betterofunderstand
                                                                                                                                  the WCRP, Earth
                                                                                                                                               is to
                                 better
                                   system understand
                                            components   Earth
                                                            andsystem      components
                                                                  their interactions    in and   their interactions
                                                                                            the Pannonian       Basin. in the Pannonian Basin.

                                 2.1.1.
                                   2.1.1.Observation
                                          ObservationGridded
                                                         GriddedDataData
                                        The
                                         The E-OBS dataset arrangedby
                                             E-OBS  dataset   arranged      bythe
                                                                                theECA&D
                                                                                    ECA&Dinitiative    and
                                                                                              initiative  andderived
                                                                                                               derived through
                                                                                                                         through interpola-
                                                                                                                                    interpo-
                                 tion  of  European   Climate   Assessment       and  Data  (ECA&D)     station  data
                                   lation of European Climate Assessment and Data (ECA&D) station data [41–43] covers  [41–43]  covers   the
                                 period    back to 1950   over  Europe    and  provides   the  mean   across  a generated
                                   the period back to 1950 over Europe and provides the mean across a generated 100-mem-     100-member
                                 ensemble     of each
                                   ber ensemble         daily
                                                   of each    field,
                                                            daily     which
                                                                   field, whichrepresents   a “best-guess”
                                                                                   represents  a “best-guess” field  [41,42].
                                                                                                                 field [41,42].The
                                                                                                                                TheE-OBS
                                                                                                                                      E-OBS
                                 database    consists  of daily interpolations     of temperature   (maximum,      mean,
                                   database consists of daily interpolations of temperature (maximum, mean, and minimum    and  minimum
                                 daily
                                   dailyvalues),
                                          values),precipitation,
                                                   precipitation,   and
                                                                     andmean
                                                                          meansea-level
                                                                                  sea-levelpressure
                                                                                            pressureandandprovides
                                                                                                            providesgridded
                                                                                                                        griddedfields
                                                                                                                                  fieldsatataa
                                 horizontal   resolution   of 0.1 ◦ in regular latitude/longitude coordinates. The standard error
                                   horizontal resolution of 0.1° in regular latitude/longitude coordinates. The standard error
                                 isispresented
                                      presentedthrough
                                                 throughestimation
                                                            estimation  of of
                                                                           uncertainty
                                                                              uncertaintyof the best-guess
                                                                                            of the best-guessvalue  and and
                                                                                                                 value   calculated   as the
                                                                                                                              calculated    as
                                 difference between the 5th and 95th percentiles over the ensemble. The density of stations
                                   the difference between the 5th and 95th percentiles over the ensemble. The density of sta-
                                 used for the interpolations varies over time and domain, although errors in precipitation
                                   tions used for the interpolations varies over time and domain, although errors in precipi-
                                 are more severe than those in temperature [44]. The insufficient spatial density of stations
                                   tation are more severe than those in temperature [44]. The insufficient spatial density of
                                 in the E-OBS data is one of the main sources of uncertainty with an emphasized effect on
                                   stations in the E-OBS data is one of the main sources of uncertainty with an emphasized
                                 precipitation [44–46]. The Pannonian Basin is a region that has a smaller density of stations
                                 than parts of western and central Europe and the United Kingdom [41]; thus, a further
Verification of the EURO-CORDEX RCM Historical Run Results over the Pannonian Basin for the Summer Season - MDPI
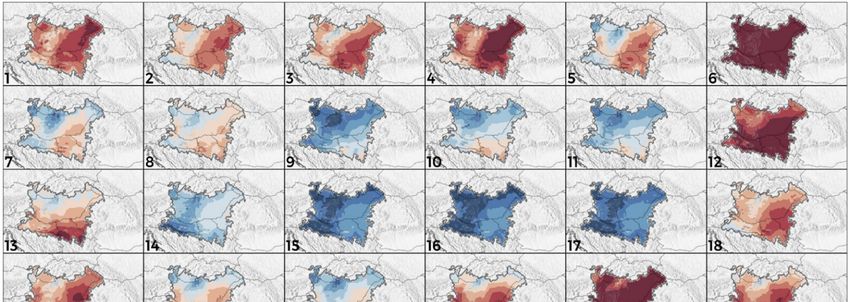
Atmosphere 2021, 12, 714                                                                                           5 of 23

                           increase in observation density is expected [36]. However, the E-OBS dataset remains a
                           crucial dataset for model validation [47,48] and climate monitoring across Europe. More-
                           over, uncertainties related to reference data should be considered when evaluating climate
                           model output, especially for the precipitation field because it is more sensitive to selection
                           reference data [49,50].
                                As the main representation of the observed climate, we used the state-of-the-art daily
                           gridded dataset E-OBS with a horizontal resolution of 0.11◦ . In this study, we extracted
                           and examined the daily mean near-surface air temperature, minimum near-surface air
                           temperature, maximum near-surface air temperature, and precipitation.

                           2.1.2. EURO-CORDEX RCM Simulations
                                 Nine RCMs driven by GCM from the EURO-CORDEX framework evaluated in this
                           work are introduced in detail in the references mentioned in Table 1. Lateral boundary
                           conditions (LBCs) were provided by GCMs from the Coupled Model Intercomparison
                           Project Phase 5 (CMIP5). We considered all the RCMs that fulfilled the following require-
                           ments: daily averaged temperature (mean, minimum, and maximum) and daily averaged
                           precipitation available at the highest resolution 0.11◦ for RCM simulations forced by GCM
                           historical run. To be more precise, we analyzed all available high-resolution runs from
                           the EURO-CORDEX database. We found this fact is important, for the reason that other
                           published results that include model verification are mainly focused on the subset of
                           available ensemble runs (not the largest possible one), often because the selected subset is
                           used for some further investigation, e.g., different impact studies in agriculture, forestry,
                           water resources, etc. In total, there were 30 available and evaluated RCM simulations
                           for the 1971–2000 time period, with different combinations of RCMs and GCMs or with
                           different realizations of the same GCM (marked in Table 1 in the third column with labels
                           r1, r2, r12 or r3). The same RCM is driven by different GCMs to assess the effect of LBCs
                           on downscaling realization. Different realizations of the same GCM, whereby the same
                           GCM was initiated from different times within a long control integration, were introduced
                           to estimate the impact of simulated natural variability on climate change responses [51].
                           Likewise, different versions of the same RCMs were used for validation (REMO2009 and
                           REMO2015, ALADIN 5.3 and ALADIN 6.3). For the periods of 1951–1980 and 1961–1990,
                           there were 23 available and evaluated simulations in the GCM–RCM simulation matrix;
                           therefore, validation for these periods is available in the Supplementary Materials.
                                 The EURO-CORDEX data used in this work can be found at the website https://www.
                           euro-cordex.net/060378/index.php.en (accessed on 30 May 2021), by choosing a specific
                           European node where data are distributed.

                           2.2. Methods
                           2.2.1. Extracting a Specific Region and Regridding
                                To prepare data for comparing GCM–RCM simulations with the E-OBS gridded
                           dataset, we used the software “Climate Data Operators” (CDO) [52]. We selected a wider
                           region bounded by longitudes, 14◦ E and 27◦ E, and latitudes, 43.5◦ N and 50◦ N. Then,
                           since the RCMs and E-OBS datasets do not share the same horizontal grid, all RCM
                           data were interpolated onto a common grid spacing of 0.11◦ related to the E-OBS grid.
                           Regridding was performed by the bilinear interpolation method. To obtain evaluation
                           metrics over the low elevation part of the Pannonian Basin, we made a mask in the selected
                           region (Figure 1) consisting of a binary matrix (0,1) in which a value of 1 represents a
                           grid point with topographic elevation below 200 m. To create a compact subdomain, few
                           exceptions from elevation constraints were made. Afterward, the calculated evaluation
                           metrics over a low elevation subregion were divided by using this binary matrix.
Verification of the EURO-CORDEX RCM Historical Run Results over the Pannonian Basin for the Summer Season - MDPI
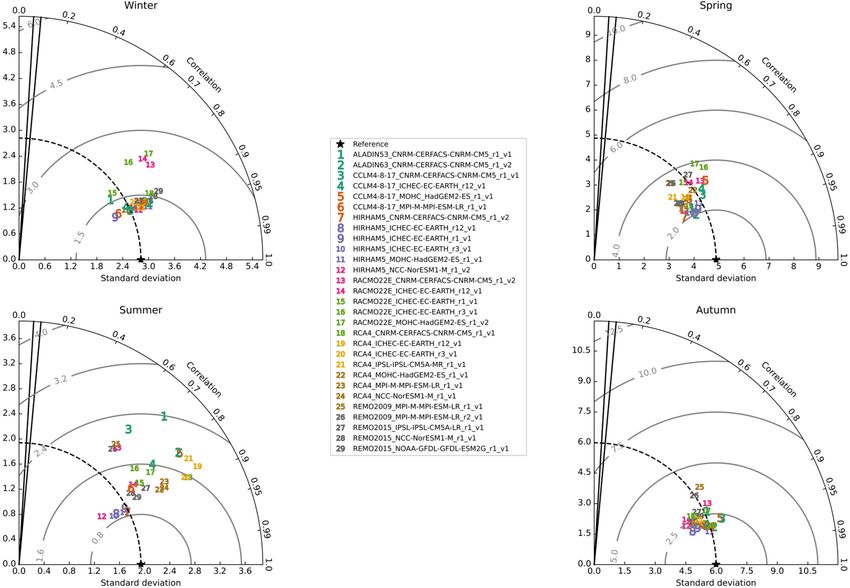
Atmosphere 2021, 12, 714                                                                                                    6 of 23

      Table 1. Overview of RCMs used in the present study. Numbers in the last column are used to distinguish different
      RCM–GCM combinations in this paper (references for each RCM are given in Reference [19]).

                     Institution                             RCM                 Driving Model (s)        Integration Number
           CNRM (Météo France)                           ALADIN 5.3               CNRM-CM5 r1                      1
           CNRM (Météo France)                           ALADIN 6.3               CNRM-CM5 r1                      2
 RMIB-UGent (Royal Meteorological Institute of
                                                          ALARO-0                 CNRM-CM5 r1                      3
       Belgium and Ghent University)
                                                                                  CNRM-CM5 r1                       4
        CLMcom (CLM Community with
                                                                                  EC-EARTH r12                      5
       contributions by BTU, DWD, ETHZ,                  CCLM 4.8.17
                                                                                 HadGEM2-ES r1                      6
                  UCD, WEGC)
                                                                                 MPI-ESM-LR r1                      7
                                                                                  CNRM-CM5 r1                       8
                                                                                  EC-EARTH r12                      9
      DMI (Danish Meteorological Institute,                                       EC-EARTH r1                      10
                                                          HIRHAM 5
            Copenhagen, Denmark)                                                  EC-EARTH r3                      11
                                                                                 HadGEM2-ES r1                     12
                                                                               NCC-NorESM1-M r1                    13
                                                                                  CNRM-CM5 r1                      14
    KNMI (Royal Netherlands Meteorological                                        EC-EARTH r12                     15
     Institute, Ministry of Infrastructure and           RACMO 2.2E               EC-EARTH r1                      16
                 the Environment)                                                 EC-EARTH r3                      17
                                                                                 HadGEM2-ES r1                     18
                                                                                  CNRM-CM5 r1                      19
                                                                                  EC-EARTH r12                     20
 SMHI (Rossby Centre, Swedish Meteorological                                      EC-EARTH r3                      21
         and Hydrological Institute,                        RCA 4                IPSL-CM5A-MR                      22
            Norrkoping Sweden)                                                   HadGEM2-ES r1                     23
                                                                                 MPI-ESM-LR r1                     24
                                                                               NCC-NorESM1-M r1                    25
    GERICS (Climate Service Center Germany,                                      MPI-ESM-LR r1                     26
                                                          REMO 2009
             Hamburg, Germany)                                                   MPI-ESM-LR r2                     27
                                                                                IPSL-CM5A-LR r1                    28
    GERICS (Climate Service Center Germany,
                                                          REMO 2015            NCC-NorESM1-M r1                    29
             Hamburg, Germany)
                                                                               NOAA-GFDL-GFDL
                                                                                                                   30
                                                                                    ESM2G r1

                                   2.2.2. Evaluation Metrics
                                        In this study, we focused on variables, such as temperature (mean, minimum, and
                                   maximum) and precipitation, to examine whether warm and dry biases existed during
                                   summer in the Pannonian Basin. Therefore, evaluation is conducted on the raw RCM
                                   output without bias adjustment for the 30-year reference period of 1971–2000. This study
                                   does not consider bias adjustment. The period of 1971–2000 is a high-quality meteorological
                                   dataset, so further investigation is based upon this reference period. For brevity, evaluations
                                   for the periods of 1951–1980 and 1961–1990 are given in the Supplementary Materials.
                                        The degree of statistical similarity between two climatic fields was determined by
                                   using the Taylor diagram to provide a concise statistical summary. The diagram, which
                                   was first proposed by Taylor [53], captures different statistics of the observed and model
                                   seasonal fields, such as spatial standard deviation, centered RMSE, and spatial correlation.
                                   The output of each RCM model in comparison with E-OBS (performing as reference) can
                                   be shown on the same diagram thanks to the geometric relationship between these metrics.
                                   The radial distances between the origin to each symbol related to RCM outputs and E-OBS
                                   are proportional to the standard deviation. The centered RMS (root mean square) error in
                                   the simulated field is proportional to the distances along concentric circles of each symbol
                                   from the reference point hereafter depicted with a star symbol on the diagram. The Pearson
                                   spatial correlation coefficient between the RCM output and the reference is shown by the
                                   azimuthal location of a symbol in the Taylor diagram. As a result, the symbols for the
                                   best-performing RCMs are placed nearest to this reference point.
Verification of the EURO-CORDEX RCM Historical Run Results over the Pannonian Basin for the Summer Season - MDPI
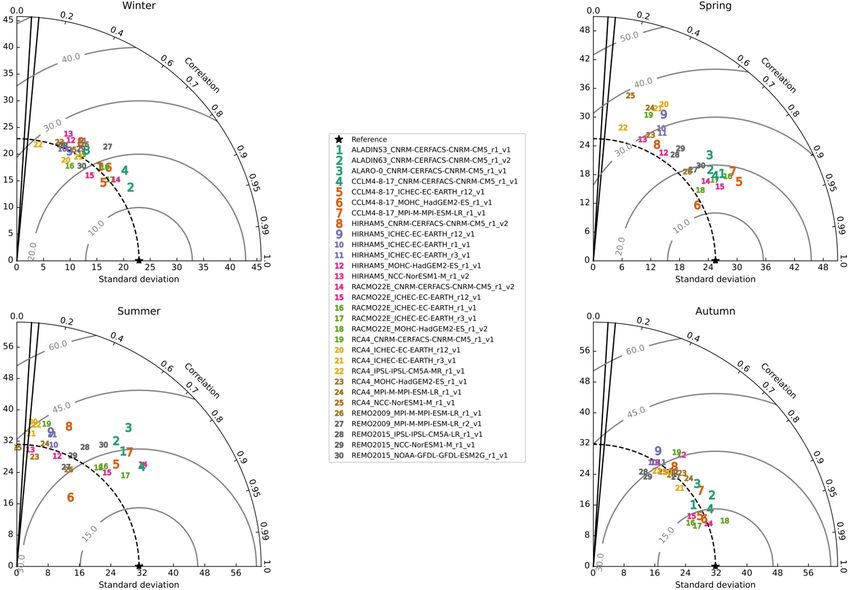
Atmosphere 2021, 12, 714                                                                                           7 of 23

                                There is a distinct difference between the RMS difference and the centered RMS
                           difference in the Taylor diagram, which is the bias-corrected RMSE. The centered RMS
                           difference is analogous to the standard deviation of a typical model error, and in the model
                           evaluation, the centered RMSE is a more common term in quantifying the correspondence
                           between two patterns [53].
                                In addition to the statistical summary obtained by the Taylor diagram, the spatial
                           distributions of temperatures and precipitation biases for each GCM–RCM analyzed combi-
                           nation, and the overall bias of the ensemble are averaged over the 1971–2000 period during
                           summer to investigate the summer drying problem that occurred in the Pannonian Basin
                           in detail. In some cases, for evaluation bias occurring in the precipitation field, biases are
                           expressed as % of observations. Additionally, bias was averaged over the 1971–2000 period
                           and the Pannonian Basin and presented in this work. Additionally, the ability of the models
                           to reproduce the mean temperature trend was estimated during the 1970–2005 period.

                           3. Results and Discussion
                                 The ability of models to simulate the current climate is crucial, as significant biases
                           restrict our understanding of potential climate impacts, including extreme weather. In
                           this work, we used EURO-CORDEX RCMs with a horizontal high grid resolution (0.11◦ ),
                           which is currently the best available horizontal resolution on the EURO-CORDEX frame-
                           work. Therefore, we did not compare (in the sense of resolution and its effect of “added
                           value”) different resolutions of RCM simulations. Previous studies have shown that in
                           the Carpathian region, high-resolution RCM simulations (0.11◦ ) were better than medium
                           resolution (0.44◦ ) in model evaluation compared with observation data, especially in the
                           sense of representing the precipitation field during summer when the majority of con-
                           vective processes occurs within the study area [37]. On the other hand, in Reference [37],
                           the spread of RCM simulations with higher grid resolution did not decrease, which was
                           likely a consequence of the pronounced internal surface variability on small scales due to
                           orographic forcing and heterogeneous surfaces or because of the intensified biases that orig-
                           inate from LBCs in GCMs [54]. To summarize, high-resolution RCM simulations were more
                           reliable in representing the frequency distribution of weather phenomena than minimizing
                           biases [4,7].
                                 The contribution of GCMs and RCMs to the biases is not examined in this work, but
                           these biases originate from various sources. Furthermore, Vautard et al. [38] discovered
                           that the GCM contribution to the overall bias is greater for mean and maximum daily
                           temperature than the RCM itself in flat areas, and it is reversed for daily minimum temper-
                           ature. This difference is explained by the fact that during the night, when the atmosphere is
                           stratified and when the daily minimum temperature is observed, model biases are strongly
                           dependent on stable boundary layer parameterizations and turbulence, low-level clouds,
                           and the characteristics of the land surface, which are the main sources of uncertainty in
                           the RCM [38]. This RCM’s contribution is larger in summer due to lighter winds, which
                           evoke less mixing in the atmosphere [38]. Vautard et al. [38] showed that in most cases, the
                           RCM contribution outweighs the GCM contribution for minimum temperatures, and it is
                           systematically greater than for mean temperatures. On the other hand, maximum tempera-
                           tures are expected to be determined by soil–atmosphere interactions [38]. Regarding the
                           precipitation field, GCM and RCM have an equal contribution to the overall bias since both
                           large-scale drivers, and local physical parameterizations play a role in defining biases [38].
                           Hence, according to these results, we evaluated the mean, maximum and minimum temper-
                           ature and precipitation fields with respect to the E-OBS gridded dataset for the 1971–2000
                           period. RCMs’ performances for periods of 1951–1980 and 1961–1990 were not shown here
                           for brevity due to similar performances, but they are shown in Supplementary Materials.
Verification of the EURO-CORDEX RCM Historical Run Results over the Pannonian Basin for the Summer Season - MDPI
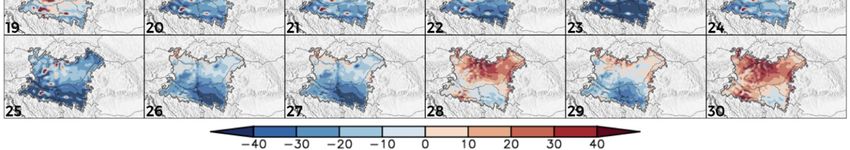
Atmosphere 2021, 12, 714                                                                                           8 of 23

                                 Before moving to the RCM data evaluation in terms of temperature and precipitation
                           statistics, it is necessary to show the ability of RCMs to simulate climate characteristics,
                           such as temperature and precipitation, during the year and over the region of interest. The
                           annual cycles of monthly averaged mean temperature and monthly precipitation across the
                           domain of the Pannonian Basin are depicted in Figure 2. The data in Figure 2 come from
                           the E-OBS database, as well as the EURO-CORDEX RCM11 ensemble (0.11◦ grid). Across
                           the Pannonian Basin, the temperature maximum is observed in July and August, while
                           the temperature minimum is observed in December and January. Summer (June and July)
                           brings the most precipitation to the Pannonian Basin, while winter (January and February)
                           brings the least precipitation. The annual temperature cycle is mostly reproduced by the
                           RCM ensemble median, with small departures from the E-OBS dataset with values up
                           to 1 ◦ C. The RCM ensemble median underestimates temperature in winter (December,
                           January, February) and spring (March, April, and May), while overestimation is observed
                           in summer (June, July, and August). In autumn (September, October, November), the
                           ensemble temperature median coincides with the E-OBS dataset with the smallest spread of
                           RCM simulations (area between the 5th percentile and 95th percentile). On the other hand,
                           the RCM ensemble median underestimates precipitation in summer, while overestimation
                           is present in all other seasons during the year. Notably, RCMs have the largest spread of
                           their simulations in late spring (May) and summer when most convective processes occur
                           in the Pannonian Basin, which indicates RCM uncertainty in representing precipitation
                           during this part of the year.
                                 First, we investigated the ensemble overall temperature bias and precipitation bias.
                           The 5th, median and 95th percentiles of temperature and precipitation biases among the
                           30 GCM–RCM simulations (cited in Table 1) for all four seasons are shown in Figure 3.
                           These percentile maps indicate that not all models are biased in the same way, as we can
                           see that the 5th percentile maps contain the most negative biases and the 95th percentile
                           maps contain the most positive biases for temperature and precipitation biases. However,
                           the exception is the winter season, where even the lower tail (5th percentile map) of the
                           bias distribution is positive. This finding indicates that most RCMs tend to overestimate
                           precipitation in winter (at least 95% of the RCMs have a positive bias).
                                 According to the median of bias distribution, the most prominent feature in Figure 3
                           is mostly widespread warm and dry bias during summer. The temperature median ranges
                           from −1.2 to +1.6 ◦ C, and the precipitation median ranges from −38% to +33%. The positive
                           temperature and negative precipitation biases were even more pronounced for certain
                           models, meaning the issue still exists in most examined simulations in the Pannonian
                           Basin during the summer season. The upper tail of the temperature bias distribution
                           (95th percentile map) is positive everywhere across the Pannonian Basin with biases up to
                           4 ◦ C. The lower tail of the temperature bias distribution (5th percentile map) is negative
                           everywhere with values below −2 ◦ C in some parts, which indicates that some models
                           tend to underestimate temperature. For the maximum and minimum temperatures, the
                           same reveals that overall ensemble biases appeared in summer (not shown for shortness).
                           On the other hand, the upper tail of the precipitation bias distribution (95th percentile map)
                           is mainly positive across the Pannonian Basin with biases up to +70%. The lower tail of the
                           precipitation bias distribution (5th percentile map) is negative everywhere, with values
                           below −50% in some parts of the Pannonian Basin. Consequently, in this study, the main
                           goal is to further examine in detail the existing summer drying issue in the Pannonian Basin
                           and to inspect each individual RCM from the EURO-CORDEX multi-model ensemble.
Verification of the EURO-CORDEX RCM Historical Run Results over the Pannonian Basin for the Summer Season - MDPI
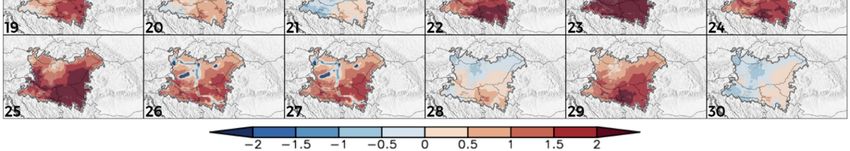
Atmosphere 2021, 12, 714                                                                                                          9 of 23
Atmosphere 2021, 12, x FOR PEER REVIEW                                                                                           9 of 23

     Figure 2. Monthly
               Monthly mean
                         mean (a)
                               (a) temperature
                                   temperature and (b) precipitation
                                                       precipitation averaged over the Pannonian Basin for 1971–2000. The black
     line depicts the E-OBS dataset, the red line depicts the median of the RCM
                                                                             RCM ensemble
                                                                                    ensemble distribution, and the violet shaded
     region denotes  the area between  the 5th percentile and 95th percentile of the RCM distribution.
     region denotes the area between the 5th percentile and 95th percentile of the RCM   distribution.

                                      First,
                                      Figureswe4investigated    the ensemble
                                                   and 5 represent    the spatialoverall  temperature
                                                                                    distribution    of thebias  and(1971–2000)
                                                                                                             mean    precipitation  bias.
                                                                                                                                  GCM–
                                The
                                RCM5th,biasmedian
                                             for eachandindividual
                                                          95th percentiles
                                                                      modelofoftemperature
                                                                                  the summerand      precipitation
                                                                                                  (June–July          biases
                                                                                                                August,   or among   the
                                                                                                                             JJA) mean
                                temperature
                                30  GCM–RCM    field  and precipitation
                                                   simulations   (cited infield,
                                                                           Tablerespectively,    with
                                                                                    1) for all four     respectare
                                                                                                     seasons     to shown
                                                                                                                    the E-OBS   gridded
                                                                                                                            in Figure  3.
                                dataset.
                                These     Principally,
                                        percentile      there
                                                     maps     is spatial
                                                           indicate  thatcorrespondence
                                                                          not all models between
                                                                                             are biased temperature
                                                                                                           in the sameand  precipitation
                                                                                                                        way,  as we can
                                biases,
                                see  thatwhich
                                          the 5this percentile
                                                    mostly pronounced
                                                               maps containduring
                                                                                the the
                                                                                     mostsummer
                                                                                            negativeas biases
                                                                                                        warm and dry     biases
                                                                                                                    the 95th    in RCM
                                                                                                                              percentile
                                simulations
                                maps   containand,
                                                the in  a smaller
                                                     most  positivenumber    of cases,
                                                                     biases for         is reversed
                                                                                 temperature     and with    cold andbiases.
                                                                                                       precipitation   wet biases.  This
                                                                                                                              However,
                                spatial
                                the      correspondence
                                     exception              is not
                                                 is the winter     visiblewhere
                                                                 season,   in theeven
                                                                                   ALADIN      5.3 simulation.
                                                                                         the lower    tail (5th percentile map) of the
                                bias distribution is positive. This finding indicates that most RCMs tend to overestimate
                                precipitation in winter (at least 95% of the RCMs have a positive bias).
                                      According to the median of bias distribution, the most prominent feature in Figure 3 is
                                mostly widespread warm and dry bias during summer. The temperature median ranges
                                from −1.2 to +1.6 °C, and the precipitation median ranges from −38% to +33%. The positive
                                temperature and negative precipitation biases were even more pronounced for certain mod-
                                els, meaning the issue still exists in most examined simulations in the Pannonian Basin dur-
                                ing the summer season. The upper tail of the temperature bias distribution (95th percentile
                                map) is positive everywhere across the Pannonian Basin with biases up to 4 °C. The lower
Verification of the EURO-CORDEX RCM Historical Run Results over the Pannonian Basin for the Summer Season - MDPI
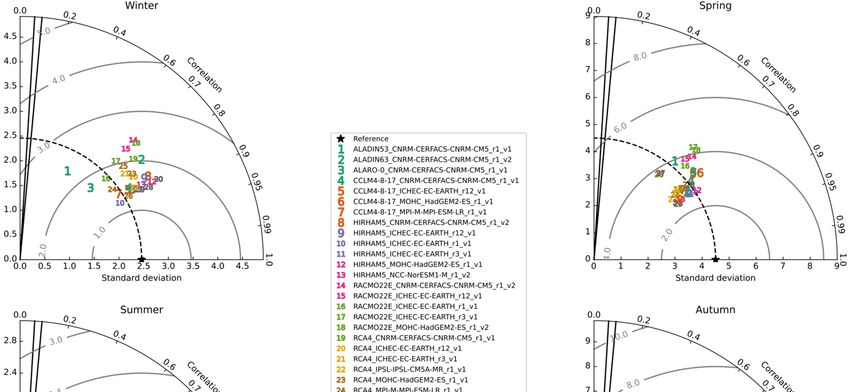
Atmosphere 2021, 12, 714                                                                                                             10 of 23
  Atmosphere 2021, 12, x FOR PEER REVIEW                                                                                          11 of 23

                                   Figure 3. Distribution of (a) mean temperature biases (1971–2000) and (b) mean precipitation biases
                                  Figure 3. Distribution of (a) mean temperature biases (1971–2000) and (b) mean precipitation biases
                                   (1971–2000) for the winter season (DJF), spring season (MAM), summer season (JJA), and autumn
                                  (1971–2000)  forFirst
                                   season (SON).   the winter  season
                                                        row, left:       (DJF), spring
                                                                   5th percentile  of theseason
                                                                                          mean (MAM),   summer season
                                                                                                RCM temperature            (JJA),the
                                                                                                                   bias among     and30autumn
                                                                                                                                        RCM
                                  season  (SON).
                                   simulations.   First row,
                                                Middle:      left: of
                                                         median    5ththe
                                                                        percentile
                                                                          mean RCM of the  mean RCM
                                                                                       temperature    temperature
                                                                                                   bias distribution.bias among
                                                                                                                      Right:  95th the 30 RCM
                                                                                                                                   percentile
                                  simulations.  Middle:
                                   of the mean RCM       median ofbias
                                                      temperature     the distribution.
                                                                          mean RCM temperature bias distribution. Right: 95th percentile
                                  of the mean RCM temperature bias distribution.
Atmosphere 2021, 12, 714                                                                                                     11 of 23
Atmosphere 2021, 12, x FOR PEER REVIEW                                                                                      12 of 23

     Figure
     Figure
Atmosphere   4.
             4. Mean
           2021, Mean   (1971–2000)
                        (1971–2000)
                 12, x FOR          summer
                                    summer GCM–RCM
                           PEER REVIEW     GCM–RCM bias
                                                   bias of
                                                        of the
                                                           the mean
                                                               mean temperature
                                                                    temperature field
                                                                                field compared
                                                                                      compared with
                                                                                               with the E-OBS gridded
                                                                                                    the E-OBS gridded
                                                                                                                   13 of 23
     dataset. Units are °C. The integration numbers follow the list from Table 1.
     dataset. Units are ◦ C. The integration numbers follow the list from Table 1.

                                     As mentioned, it is difficult to isolate the GCM and RCM contributions from the over-
                               all bias for precipitation due to the main drivers of precipitation, such as large-scale driv-
                               ers and physical parameterizations, but some main and striking conclusions could be
                               made. Figure 5 shows that the previously specified downscaling of the HadGEM2-ES and
                               NCC-NorESM1-M GCMs with different RCMs that overestimate temperature underesti-
                               mates precipitation. In contrast, RCMs driven with GCM EC-EARTH tend to overestimate
                               precipitation. RCM ALADIN 5.3 has an issue with representing precipitation due to its
                               overestimation, although ALADIN 5.3 also overestimates the mean temperature. How-
                               ever, spatial correspondence between temperature and precipitation bias is observed in
                               RCM ALADIN 6.3, which is driven with the same GCM as ALADIN 5.3. Additionally,
                               RCM CCLM 4.8.17 tends to underestimate precipitation.
                                     These results obtained from Figures 4 and 5 correspond with the results from Refer-
                               ence [38] for the Eastern Europe region where GCM and RCM contributing biases are ex-
                               amined, except that in the Pannonian Basin, temperature bias was even more emphasized
                               for certain GCM–RCM combinations.
                                     Note that the E-OBS reference dataset errors are larger in the summer season for the
                               precipitation field since summer precipitation is mainly convective rather than frontal.
                               [38,44]. Hence, verification of the precipitation field with respect to E-OBS has more un-
                               certainty than temperature validations. In addition, as observed in Reference [38], RCMs
                               tend to overestimate precipitation in summer more than in winter due to the E-OBS defi-
                               ciency in the present observed precipitation field. Hence, we assume that summer precip-
                               itation underestimation over the Pannonian Basin is even more pronounced because E-
     Figure 5. Mean
     Figure 5.      (1971–2000)OBS
               Mean (1971–2000)      underestimates
                                summer
                                summer GCM–RCM
                                          GCM–RCM bias
                                                      summer
                                                      bias of
                                                           of the
                                                                  precipitation.
                                                                  mean precipitation
                                                              the mean  precipitation field compared with
                                                                                      field compared with the
                                                                                                          the E-OBS
                                                                                                              E-OBS gridded
                                                                                                                    gridded
     dataset.
     dataset. Biases
              Biases are
                     are expressed as %
                         expressed as % of
                                        of observations.
                                           observations. The
                                                         The integration numbers follow
                                                             integration numbers follow the
                                                                                        the list
                                                                                            list from
                                                                                                 from Table
                                                                                                      Table 1.
                                                                                                            1.

                                      The
                                      The different
                                          same RCM   parameterizations    usedGCMs
                                                       is driven by different   in thetoanalyzed
                                                                                         examineRCM     simulations
                                                                                                  the prevailing      or of
                                                                                                                  signal transport-
                                                                                                                            positive
                                 able error from
                                 or negative      GCMs
                                              errors (withused  for downscaling
                                                            respect to representing aremean
                                                                                        directly responsibleoffor
                                                                                             temperature)      thethe broad range
                                                                                                                    corresponding
                                 of examined
                                 driving       GCM–RCM
                                          models   since GCM seasonal  biases, as determines
                                                                 predominantly     we can see in   Figures
                                                                                                 mean      6 and 7. Temperature
                                                                                                       temperature    bias [38]. In
                                 and  precipitation  biases  do not  remain   constant   during  seasons  for a particular
                                 Figures 4 and 5, strong cold biases are found at a qualitative level, in summer, for        GCM–the
                                 RCM combination, so Figures 6 and 7 indicate a strong time dependence. However, the
                                 annual cycle is seen in Figure 6, where most RCMs overestimate summer temperature.
                                 According to our findings, in Figures 6 and 7, where spatially averaged overall bias is
                                 presented, 17 RCMs overestimate temperature, 8 RCMs underestimate temperature, and
                                 5 RCMs estimate temperature around the E-OBS gridded dataset during the summer sea-
Atmosphere 2021, 12, 714                                                                                                                     12 of 23

                                  majority of RCMs downscalings in the EC-EARTH realizations (simulations denoted with
                                  numbers 9, 10, 11, 15, 16, 17, and 21), while HadGEM2-ES downscalings with different
                                  RCMs (simulations denoted with numbers 6, 12, 18, and 23) have the most pronounced
                                  warm and dry biases, which are straightforward in the sense that the overall biases pre-
                                  sented in Figures 6 and 7 are not a result of error cancelation. In Figure 4, most RCMs
                                  driven with GCMs, such as CNRM-CM5 (simulations denoted with numbers 1, 2, 3, 4, and
                                  19) and NCC-NorESM1-M (simulations denoted with numbers 13, 25, and 29), showed
Atmosphere 2021, 12, x FOR PEER REVIEW                                                                              14 of 23
Atmosphere 2021, 12, x FOR PEER REVIEW
                                  positive temperature bias; however, this warm bias was less pronounced than the14    of 23
                                                                                                                     warm
                                  bias present in HadGEM2-ES downscaling with different RCMs.

       Figure 6. Mean (1971–2000) GCM–RCM seasonal bias of the mean temperature field averaged over the Pannonian Basin
      Figure
       Figure
       and    6. Mean
              6.
           compared
                      (1971–2000)
                 Meanwith
                       (1971–2000) GCM–RCM
                                    GCM–RCM
                            the E-OBS
                                                  seasonal
                                                  seasonal
                                       gridded dataset.
                                                            bias
                                                            bias
                                                          The
                                                                 of the
                                                               redofline
                                                                         mean
                                                                          mean temperature
                                                                      thedenotestemperature   field averaged
                                                                                  overall biasfield averaged
                                                                                                during
                                                                                                               over
                                                                                                               over the
                                                                                                        the summer.  the Pannonian
                                                                                                                         Pannonian
                                                                                                                      Units
                                                                                                                                      Basin
                                                                                                                            are in °C.Basin
                                                                                                                                        The
      and  compared  with  the  E-OBS gridded   dataset.  The red  line  denotes overall  bias during  the  summer.   Units are in ◦ C. The
       and  compared  with  the E-OBS  gridded   dataset.
       integration numbers follow the list from Table 1.  The  red  line denotes  overall bias  during  the  summer.  Units are  in °C. The
       integration numbers
      integration  numbers follow
                             followthe
                                    thelist
                                        listfrom
                                             fromTable
                                                  Table1.1.

      Figure 7. Mean
      Figure 7. Mean (1971–2000)
                        (1971–2000) GCM–RCM
                                     GCM–RCM seasonal
                                                 seasonal bias
                                                             bias ofof the
                                                                       the precipitation
                                                                            precipitation field
                                                                                           field averaged
                                                                                                 averaged over
                                                                                                          over the
                                                                                                                the Pannonian
                                                                                                                    Pannonian Basin
                                                                                                                                Basin and
                                                                                                                                       and
      Figure 7. Mean
      compared
      compared  with    (1971–2000)
                 with the
                       the E-OBS     GCM–RCM
                           E-OBS gridded
                                   gridded       seasonal
                                           dataset.
                                           dataset. The redbias
                                                    The red   lineof
                                                              line      the precipitation
                                                                    denotes
                                                                     denotes  overall  biasfield
                                                                              overall bias       averaged
                                                                                            during
                                                                                            during        over
                                                                                                    summer.
                                                                                                    summer.     the are
                                                                                                            Biases
                                                                                                            Biases  Pannonian   Basin
                                                                                                                     are expressed
                                                                                                                         expressed as
                                                                                                                                   as %
                                                                                                                                      %and
                                                                                                                                        of
                                                                                                                                         of
      compared   with
      observations. The
      observations.    the E-OBS
                    The integrationgridded dataset.
                          integration numbers
                                      numbers followThe
                                               follow thered  line
                                                       the list
                                                            list fromdenotes
                                                                  from Table  overall
                                                                         Table1.1.     bias during  summer. Biases   are expressed as %  of
      observations. The integration numbers follow the list from Table 1.
                                           In support
                                           Three          of the
                                                   statistics,     abovementioned
                                                                such   as centered RMSE fact,along
                                                                                               RCM withHIRHAM       5 tendsdeviations
                                                                                                             the standard      to underestimate
                                                                                                                                            and the
                                    summer
                                    spatialThree   statistics,ofsuch
                                               temperature
                                              correlations       RCMasforced
                                                                when      centered  RMSE
                                                                                by GCM
                                                                        simulations           along
                                                                                            EC-EARTH
                                                                                       of four        with(denoted
                                                                                                             the standard
                                                                                                 meteorological               deviations
                                                                                                                      with numbers
                                                                                                                    variables            9, and
                                                                                                                                            10, and
                                                                                                                                (tas, tasmax,      the
                                                                                                                                                  tas-
                                    spatial
                                    11),
                                    min,      correlations
                                          except
                                            and pre),  wereof    RCMdenoted
                                                   for simulations
                                                               assessed simulationstheofE-OBS
                                                                           againstwith     four meteorological
                                                                                         numbers      8, 12,over
                                                                                                  dataset         13variables
                                                                                                             and the  when      (tas,Basin
                                                                                                                              driven
                                                                                                                      Pannonian       tasmax,
                                                                                                                                       withfor GCMtas-
                                                                                                                                                   the
                                    min,
                                    CNRM-CM5and pre),  were
                                                      (warm    assessed
                                                                bias).  RCMagainst the
                                                                                RACMO   E-OBS
                                                                                            2.2E  dataset   over
                                                                                                  (simulations    the  Pannonian
                                                                                                                   denoted
                                    1971–2000 period in Figures 8–11. Statistics are calculated over all 2205 grid cells of thewith  Basin
                                                                                                                                     numbers for   the
                                                                                                                                                   14,
                                    1971–2000
                                    15,  16,  17) period
                                                  maintains in  Figures
                                                                 a strong 8–11.  Statistics
                                                                            negative         are
                                                                                       temperaturecalculated
                                                                                                         bias   over
                                                                                                              during  all
                                                                                                                        the
                                    observed field and from the thirty GCM–RCM simulations, except for tasmax and tasmin,  2205  grid
                                                                                                                             summer,    cells
                                                                                                                                         exceptof  the
                                                                                                                                                    in
                                    observed
                                    the  case   field
                                               when    and
                                                       RACMO from   the
                                                                    2.2E thirty
                                                                          is    GCM–RCM
                                                                             driven  by  GCM    simulations,
                                                                                                  HadGEM2-ES   except    for tasmax
                                                                                                                    (simulation
                                    where twenty-nine simulations were available and evaluated. The Taylor diagrams enable            and
                                                                                                                                   denoted  tasmin,
                                                                                                                                                with
                                    where
                                    us       twenty-nine
                                        to graphically       simulations
                                                           indicate          were available
                                                                      the individual   RCM thatand evaluated.
                                                                                                     is the most The    Taylor
                                                                                                                   realistic     diagrams
                                                                                                                              compared        enable
                                                                                                                                           with    the
                                    us  to  graphically    indicate   the individual   RCM     that  is the most   realistic
                                    E-OBS dataset. In Figures 8–11, where Taylor diagrams are presented, there is a table thatcompared     with    the
                                    E-OBS     dataset.  In  Figures   8–11,  where  Taylor    diagrams     are presented,
                                    displays a list of evaluated GCM–RCM simulations. In the table, simulations are divided   there is a  table  that
                                    displays
                                    into  four aparts
                                                  list of
                                                       byevaluated      GCM–RCM
                                                            an underscore.            simulations.
                                                                               The first                In the table,
                                                                                          section represents           simulations
                                                                                                                 the name              are divided
                                                                                                                              of the RCM     driven
                                    into four parts by an underscore. The first section represents the name of the RCM driven
Atmosphere 2021, 12, 714                                                                                            13 of 23

                           number 18) since GCM HadGEM2-ES contributes as a warm bias. RCMs ALADIN 5.3
                           (denoted with number 1) and ALADIN 6.3 (denoted with number 2) were driven by the
                           same GCM with features to overestimate the mean temperature, but ALADIN 5.3 (older
                           version) had a greater positive temperature bias than ALADIN 6.3. Additionally, RCA 4
                           had a positive mean summer bias of temperature (denoted with numbers 19, 20, 22, 23, 24,
                           and 25), excluding simulation when forced by GCM EC-EARTH (denoted with number 21),
                           which showed cold temperature bias. RCM REMO 2009 (denoted with numbers 26 and 27)
                           maintained a positive summer temperature bias. On the other hand, RCM REMO 2015 had
                           the smallest temperature bias (simulations denoted with numbers 28 and 30), except in the
                           case when it was driven by GCM NCC-NorESM1-M (marked with number 29) because of
                           its positive warm bias contribution. Comparing the results among different RCMs forced
                           by the same GCM when Figures 4 and 6 are concerned, we concluded that RCM CCLM
                           4.8.17 forced by GCM HadGEM2-ES (denoted with number 6) had the greatest warm bias.
                                As mentioned, it is difficult to isolate the GCM and RCM contributions from the
                           overall bias for precipitation due to the main drivers of precipitation, such as large-scale
                           drivers and physical parameterizations, but some main and striking conclusions could
                           be made. Figure 5 shows that the previously specified downscaling of the HadGEM2-
                           ES and NCC-NorESM1-M GCMs with different RCMs that overestimate temperature
                           underestimates precipitation. In contrast, RCMs driven with GCM EC-EARTH tend to
                           overestimate precipitation. RCM ALADIN 5.3 has an issue with representing precipitation
                           due to its overestimation, although ALADIN 5.3 also overestimates the mean temperature.
                           However, spatial correspondence between temperature and precipitation bias is observed
                           in RCM ALADIN 6.3, which is driven with the same GCM as ALADIN 5.3. Additionally,
                           RCM CCLM 4.8.17 tends to underestimate precipitation.
                                These results obtained from Figures 4 and 5 correspond with the results from Ref-
                           erence [38] for the Eastern Europe region where GCM and RCM contributing biases are
                           examined, except that in the Pannonian Basin, temperature bias was even more emphasized
                           for certain GCM–RCM combinations.
                                Note that the E-OBS reference dataset errors are larger in the summer season for the
                           precipitation field since summer precipitation is mainly convective rather than frontal [38,44].
                           Hence, verification of the precipitation field with respect to E-OBS has more uncertainty than
                           temperature validations. In addition, as observed in Reference [38], RCMs tend to overestimate
                           precipitation in summer more than in winter due to the E-OBS deficiency in the present
                           observed precipitation field. Hence, we assume that summer precipitation underestimation
                           over the Pannonian Basin is even more pronounced because E-OBS underestimates summer
                           precipitation.
                                The different parameterizations used in the analyzed RCM simulations or trans-
                           portable error from GCMs used for downscaling are directly responsible for the broad
                           range of examined GCM–RCM seasonal biases, as we can see in Figures 6 and 7. Tem-
                           perature and precipitation biases do not remain constant during seasons for a particular
                           GCM–RCM combination, so Figures 6 and 7 indicate a strong time dependence. However,
                           the annual cycle is seen in Figure 6, where most RCMs overestimate summer temperature.
                           According to our findings, in Figures 6 and 7, where spatially averaged overall bias is
                           presented, 17 RCMs overestimate temperature, 8 RCMs underestimate temperature, and
                           5 RCMs estimate temperature around the E-OBS gridded dataset during the summer
                           season. Most RCMs that overestimate temperature, on the other hand, underestimate
                           precipitation during the summer season. The summer temperature bias ranged from −1.9
                           to +4.4 ◦ C, while the summer precipitation bias ranged from +42% to −70%.
                                Note that in some cases, the near-zero overall mean temperature biases (5 RCMs)
                           presented in Figures 6 and 7 are a result of error cancelations, as seen in Figures 4 and 5.
                           For instance, CCLM4–8-17 driven by MPI-ESM-LR (listed as number 7), HIRHAM 5 driven
                           by CNRM-CM5 (listed as number 8), RCA4 driven by EC-EARTH (listed as number 20),
                           REMO 2015 driven by IPSL-CM5A-LR (listed as number 28) and NOAA-GFDL-GFDL-
Atmosphere 2021, 12, 714                                                                                                                          14 of 23

                                    ESM2G (listed as number 30) approximately did not show overall summer temperature
                                    bias in Figure 6, but we can see the bias in Figure 4.
                                         To examine the “summer drying” issue over the Pannonian Basin in more detail,
                                    additional assessments are carried out over a selected subregion in the Carpathian region
                                    (Pannonian Basin). In this study, the main goal was to statistically examine the ability of
                                    RCMs to represent temperature and precipitation fields in the summer season. The other
                                    three seasons are displayed for comparison only.
                                         Three statistics, such as centered RMSE along with the standard deviations and the
                                    spatial correlations of RCM simulations of four meteorological variables (tas, tasmax,
                                    tasmin, and pre), were assessed against the E-OBS dataset over the Pannonian Basin for
                                    the 1971–2000 period in Figures 8–11. Statistics are calculated over all 2205 grid cells of
                                    the observed field and from the thirty GCM–RCM simulations, except for tasmax and
                                    tasmin, where twenty-nine simulations were available and evaluated. The Taylor diagrams
                                    enable us to graphically indicate the individual RCM that is the most realistic compared
                                    with the E-OBS dataset. In Figures 8–11, where Taylor diagrams are presented, there is a
                                    table that displays a list of evaluated GCM–RCM simulations. In the table, simulations are
                                    divided into four parts by an underscore. The first section represents the name of the RCM
                                    driven by the GCM determined in the second section, the third section shows the 16
   Atmosphere 2021, 12, x FOR PEER REVIEW                                                                             identified
                                                                                                                         of 23
                                    realization of the same GCM driver, and the fourth section shows the RCM version.

         Figure
      Figure     8. Taylor
              8. Taylor    diagrams
                        diagrams    ofof seasonal(1971–2000)
                                       seasonal     (1971–2000)mean  mean near-surface
                                                                           near-surface air
                                                                                          air temperature
                                                                                               temperatureshowing
                                                                                                             showingstandard
                                                                                                                        standarddeviation  (°C),
                                                                                                                                   deviation   (◦ C),
         centered RMSE◦ (°C), and spatial correlation for each EURO-CORDEX GCM–RCM simulation versus E-OBS observations
      centered RMSE ( C), and spatial correlation for each EURO-CORDEX GCM–RCM simulation versus E-OBS observations
         across the Pannonian Basin. The four panels refer to the four seasons defined as winter (DJF), spring (MAM), summer
      across theand
         (JJA),  Pannonian
                     autumn Basin.
                              (SON).The
                                      Thefour   panelsfield
                                           observed      referistolabeled
                                                                    the four seasons
                                                                           with  a stardefined
                                                                                        symbol.asThe
                                                                                                   winter  (DJF),
                                                                                                       dotted  linespring
                                                                                                                    depicts(MAM),   summer
                                                                                                                            the contour       (JJA),
                                                                                                                                          of the
      andreference
           autumnstandard
                    (SON). The    observed
                              deviation (the field is labeled
                                             observed    field). with   a starcontours
                                                                  The RMSE     symbol. are
                                                                                         Thegrayed
                                                                                               dottedout.
                                                                                                      line depicts
                                                                                                          The       the99th
                                                                                                              95th and   contour  of the reference
                                                                                                                             significance levels
      standard   deviationby(the
         are represented      the observed
                                  correlationfield).
                                               rays onThe
                                                        theRMSE
                                                             left andcontours    are grayed out. The 95th and 99th significance levels are
                                                                       right, respectively.
      represented by the correlation rays on the left and right, respectively.
                                             According to the Taylor diagram in Figure 9, RCMs such as RACMO 2.2E and CCLM
                                        4.8.17 showed the best performance in representing the precipitation field with spatial
                                        correlation coefficients higher than 0.6, although in Figure 5, these RCMs had a nonzero
                                        bias. These RCMs have a mostly wider precipitation distribution toward lower values,
                                        which is addressed as a large negative bias and the lowest standard deviation of model
                                        error (centered RMSE). The RCMs with the lowest score were RCA 4 with spatial correla-
Atmosphere 2021, 12, 714                                                                                                                15 of 23
Atmosphere 2021, 12, x FOR PEER REVIEW                                                                                                 17 of 23

      Figure9.
     Figure  9. Taylor
                Taylordiagrams
                        diagramsof ofseasonal
                                     seasonal(1971–2000)
                                                (1971–2000)precipitation
                                                              precipitationshowing
                                                                              showingstandard
                                                                                      standarddeviation
                                                                                                 deviation(mm/season),
                                                                                                           (mm/season), centered
                                                                                                                          centeredRMSE
                                                                                                                                    RMSE
      (mm/season), and spatial correlation for each EURO-CORDEX GCM–RCM simulation versus E-OBS observations across
     (mm/season), and spatial correlation for each EURO-CORDEX GCM–RCM simulation versus E-OBS observations across
      the Pannonian Basin. The four panels refer to the four seasons defined as winter (DJF), spring (MAM), summer (JJA), and
     the Pannonian Basin. The four panels refer to the four seasons defined as winter (DJF), spring (MAM), summer (JJA),
      autumn (SON). The observed field is labeled with a star symbol. The dotted line depicts the contour of the reference
     and  autumn
      standard     (SON). The
                 deviation  (the observed
                                 observed field   is The
                                            field).  labeled  withcontours
                                                           RMSE     a star symbol.  The dotted
                                                                             are grayed        line95th
                                                                                         out. The   depicts
                                                                                                        and the contour
                                                                                                             99th        of the reference
                                                                                                                  significance  levels are
     standard   deviation
      represented          (the observed
                   by the correlation  raysfield).
                                             on theTheleft RMSE   contours
                                                           and right,        are grayed out. The 95th and 99th significance levels are
                                                                      respectively.
     represented by the correlation rays on the left and right, respectively.
                                         According to Figure 10, similar RCM performances are observed in representing tas-
                                   max as those representing tas during the summer. The main difference is that RCMs
                                   showed the highest spatial variability during summer in comparison with the other three
                                   seasons in representing the maximum temperature field. This result is because HIRHAM
                                   5 underestimates the standard deviation compared with the observed field, while other
                                   RCMs overestimate the standard deviations. During summer, the spread of correlations
                                   is between 0.62 and 0.90, reflecting the highest correlations among the other three varia-
                                   bles (tas, tasmin, and pre). The correlation coefficients in summer are generally high (most
                                   RCMs have correlation coefficients between 0.76 and 0.89). The best-performing RCMs
                                   during summer are REMO 2015 and HIRHAM 5, with spatial correlation coefficients
                                   higher than 0.85 and with slightly more enhanced performances to represent tasmax than
                                   representing tas. Generally, RCMs have better statistical scores in representing tasmax
                                   than tas in summer. On the other hand, REMO 2009 has poorer scores, as was the case
                                   with tas. In line with Figure 10, the lesser performances in summer are from RCMs ALA-
                                   DIN 5.3 and CCLM 4.8.17 driven by CNRM-CM5. RCM ALADIN 6.3 realized a better
                                   performance with respect to the Taylor statistics than RCM ALADIN 5.3.
You can also read