Analysis of surface deformation and driving forces in Lanzhou
←
→
Page content transcription
If your browser does not render page correctly, please read the page content below
Open Geosciences 2020; 12: 1127–1145
Research Article
Wenhui Wang, Yi He*, Lifeng Zhang, Youdong Chen, Lisha Qiu, and Hongyu Pu
Analysis of surface deformation and driving
forces in Lanzhou
https://doi.org/10.1515/geo-2020-0128 area and land cover types was the most important factor
received April 22, 2020; accepted September 23, 2020 behind surface deformation in Lanzhou. This paper pro-
Abstract: Surface deformation has become an important vides the reference data and scientific foundation for dis-
factor affecting urban development. Lanzhou is an impor- aster prevention in Lanzhou.
tant location in the Belt and Road Initiative, an interna- Keywords: deformation, geo-detector, InSAR, Lanzhou,
tional development policy implemented by the Chinese land cover types, Sentinel-1A
government. Because of rapid urbanization in Lanzhou,
surface deformation occurs easily. However, the spatial-
temporal characteristics of surface deformation and the
interaction of driving forces behind surface deformation 1 Introduction
in Lanzhou are unclear. This paper uses small baseline
subset InSAR (SBAS-InSAR) technology to obtain the spa- Surface deformation is a geological phenomenon caused
tial-temporal characteristics of surface deformation in by various factors. Urban surface deformation can damage
Lanzhou based on 32 Sentinel-1A data from March 2015 road surfaces, roadbeds, and even buildings and urban
to January 2017. We further employ a geographical detector infrastructures, causing casualties and economic losses
(geo-detector) to analyze the driving forces (single-factor [1,2]. Especially surface deformation has a great impact
effects and multifactor interactions) of surface deforma- on the road surface, such as accidents, slower movement
tion. The results show that the central urban area of speeds, capacity loss, and severe discomfort states [3,4]. In
Lanzhou was stable, while there was surface deformation recent years, urban surface deformation has become one of
around Nanhuan road, Dongfanghong Square, Jiuzhou, the dangerous geological occurrences, affecting sustainable
Country Garden, Dachaiping, Yujiaping, Lanzhou North development in many countries around the world. The scale
Freight Yard, and Liuquan Town. The maximum deforma- of urban development in Lanzhou has expanded rapidly,
tion rate was −26.50 mm year−1, and the maximum rate of nearly doubling from 1961 to 2015. Surface deformation in
increase was 9.80 mm year−1. The influence factors of sur- the main urban area of Lanzhou has become more serious in
face deformation in Lanzhou was a complex superposition recent years [5], as shown in Figure 1, and it is necessary to
relationship among various influencing factors, not a result use special methods to monitor surface deformation in
of the single factor. The interaction between the built-up this city.
At present, the traditional methods to monitor surface
deformation include leveling and the global positioning
system (GPS) [6,7], but these methods generally have
* Corresponding author: Yi He, Faculty of Geomatics, Lanzhou shortcomings such as low-time frequency, long time,
Jiaotong University, Lanzhou, Gansu, China; National-Local Joint high input, and slow data update. With the development
Engineering Research Center of Technologies and Applications for of earth observation technologies, interferometric syn-
National Geographic State Monitoring, Lanzhou, Gansu, China;
thetic aperture radar (InSAR) has become an excellent
Gansu Provincial Engineering Laboratory for National Geographic
State Monitoring, Lanzhou, Gansu, China, e-mail: wangwenhui. method for observing surface deformation. Compared with
dahuilang@gmail.com, heyi8738@163.com traditional methods, InSAR technology has the characteris-
Wenhui Wang, Lifeng Zhang, Youdong Chen, Lisha Qiu, Hongyu Pu: tics of wide coverage, including short-range weather impact
Faculty of Geomatics, Lanzhou Jiaotong University, Lanzhou, Gansu, and all-weather observation, which can solve the above-
China; National-Local Joint Engineering Research Center of
mentioned shortcomings. InSAR has been widely used in
Technologies and Applications for National Geographic State
Monitoring, Lanzhou, Gansu, China; Gansu Provincial Engineering
surface deformation monitoring [8,9], road network defor-
Laboratory for National Geographic State Monitoring, Lanzhou, mation monitoring [10–13], building monitoring [14,15],
Gansu, China subway deformation monitoring [16], railway subsidence
Open Access. © 2020 Wenhui Wang et al., published by De Gruyter. This work is licensed under the Creative Commons Attribution 4.0
International License.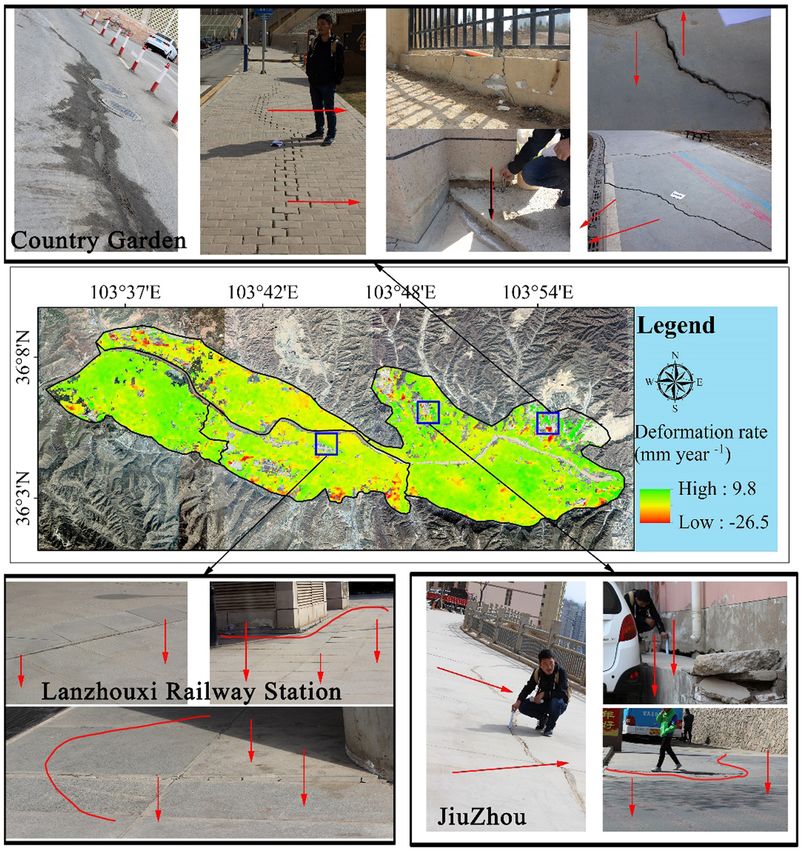
1128 Wenhui Wang et al.
Figure 1: Accidents caused by deformation in Lanzhou.
[17], snow thickness inversion [18], landslide monitoring in the regions where landslides and mudslides frequently
[19,20], and other fields. Berardino [21] and Lanari [22] pro- occurred. Xue [42] used persistent scatter interferometric
posed the small baseline subset (SBAS) InSAR that solved the synthetic aperture radar (PS-InSAR) technology to study
discontinuous time problem has a high density of informa- the causes and mechanisms of slope formation in Lanzhou
tion for time and space which captures the deformation rate from 2003 to 2010 and to access the stability of loess slopes
throughout the whole observation period [23]. SBAS-InSAR is by using the analytical hierarchy process (AHP). However,
thus suitable for deformation monitoring in the city area. these researches mainly focused on qualitative analysis,
A geographical detector (geo-detector) is a tool for and the spatial-temporal characteristics of surface deforma-
detecting and exploiting spatial differentiation [24]. It tion and the interaction of driving forces behind surface
can detect both numerical and qualitative data, as well deformation in Lanzhou are unclear. Besides that, the latest
as to detect different driving force interactions. Therefore, surface deformation monitoring results are not reported.
geo-detector can be applied to study the relative influence This paper uses the combination of SBAS-InSAR and
of different driving forces. As such, it is widely used in the geo-detector to make up for the deficiencies of existing
fields of land use [25], public health [26], environment research. The goal of this paper is to obtain the spatial-
[27], and geology [28]. Groundwater [2,29], geological temporal characteristics of surface deformation and to
structure [30], land cover types [8,31–33] precipitation explore the driving factors that caused surface deformation
[34], temperature [35–37], density of road network [10], in the main urban area of Lanzhou, Gansu Province, China.
and built-up area [38–40] are the main causes of surface This paper uses SBAS-InSAR technology to monitor time-
deformation. No previous studies have reported the use of series deformation, deformation rate, and cumulative defor-
geo-detector to quantify the relationship between surface mation. The geo-detector is used to analyze the relationship
deformation and natural and human factors. Therefore, between the deformation and temperature, precipitation,
this paper proposes the use of geo-detector to study the the density of road network, land cover types, and built-
relative influence of different driving forces (precipitation, up area, by exploring single driving factor and multidriving
temperature, built-up area, density of road network, and factor interactions. In doing so, it will provide reference data
land cover types) behind the spatial distribution of sur- and a scientific basis for disaster prevention and ecologi-
face deformation and quantitatively explore the influence cally sustainable development in Lanzhou city.
of different combinations of driving forces on surface
deformation.
The research on surface deformation has achieved some
important results in Lanzhou. For example, Wang [41] used 2 Study area and datasets
ENVISAT ASAR data to analyze surface deformation in the
Lanzhou from 2003 to 2010, the results showed that the most Lanzhou is located in the plain along the Yellow River basin,
significant areas of surface deformation in Lanzhou were covering the geographic area between 36°1′32″–36°9′41″N
Analysis of surface deformation and driving forces 1129
and 103°30′3″–104°4′23″E. It is a region with serious soil launched in 2014 and began acquiring images with a re-
erosion, and the city has a high population density and visit period of 12 days and a short time span. In this paper,
dense road network. The main urban area of Lanzhou mainly 32 Sentinel-1A images covering the research area from
includes Chengguan district, Qilihe district, Xigu district, 2015 to 2017 were selected for the experiment. The images
and Anning district. The study area includes land-creation were captured through VV polarization and IW imaging
areas, railways, subways, highways, railway stations, and mode. This paper used the 30 m SRTM DEM [44,45] pro-
industrial parks. vided by the United States Geological Survey (USGS) to
The terrain of the study area is high in the southwest, remove terrain phases, and it used the elevation data
low in the northeast, and the mountains in the north and provided by the local Surveying and Mapping Department
south are on either side of the river. The main city is to verify the experimental results. Elevation data were
located in a valley between the two mountains. The obtained by aerial surveys with an accuracy of 1:500. Me-
weather in Lanzhou is a temperate continental climate. teorological data [46] (temperature [47] and precipitation
The annual average temperature is 10.30°C, and the [48]) were provided by the Center for Climatic Research,
four seasons are distinct. The average annual precipi- Department of Geography, University of Delaware, Newark.
tation is 327.00 mm with more concentrated rainfall Data of land cover types data were derived from Tsinghua
from June to September [43]. The study area is shown University’s global 10 m resolution land cover types map
in Figure 2. [49]. Built-up area changes were extracted from Landsat 8
This paper uses Sentinel-1A data to monitor surface OIL images. Road data were provided by the Department of
deformation. The Sentinel-1A satellite is an Earth observa- Resources of Lanzhou. Meteorological data, land cover
tion satellite in the European Space Agency’s Copernicus types data, built-up area, and road data were then com-
Plan, which carries a C-band synthetic aperture radar that bined with the deformation results to analyze deformation
provides continuous images. Sentinel-1A was successfully mode-features, including evolutionary process and other
Figure 2: The Lanzhou area.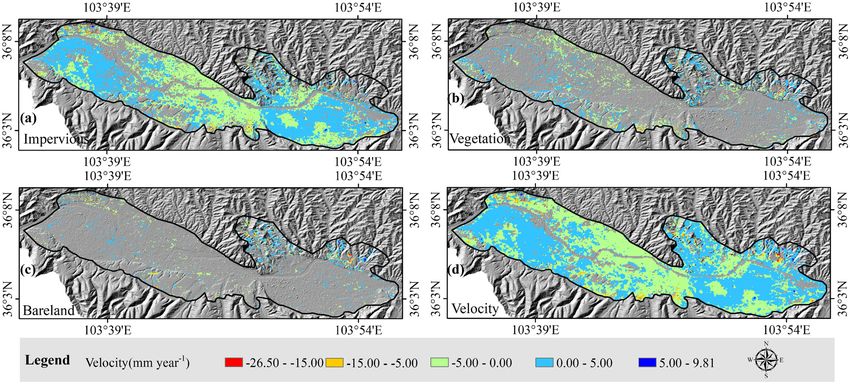
1130 Wenhui Wang et al.
Table 1: Data and resources is generated according to the interference combination
principle, which satisfies the following relationship:
Data name Data resource
M M (M − 1)
≤N≤ (1)
Sentinel-1A https://search.asf.alaska.edu/ 2 2
SRTM DEM https://earthexplorer.usgs.gov/
Temperature http://climate.geog.udel.edu/ The ith-scene (i = 1, 2,…,N) interferogram generated
∼climate/html_pages/download.html from the main image called A and the minor image
Precipitation http://climate.geog.udel.edu/ named B, and the interference phase generated at point
∼climate/html_pages/download.html (x, r) can be expressed as follows:
Landsat 8 OLI https://earthexplorer.usgs.gov/
Land cover types http://data.ess.tsinghua.edu.cn/ i
Δφi(x , r ) = φA(x , r ) − φB(x , r ) ≈ Δφdef (x , r )
Roads Department of Resources of Lanzhou (2)
Aerial survey Department of Resources of Lanzhou + Δφεi(x , r ) + Δφαi(x , r ) + Δφnoi
i
(x , r ),
elevation
where tA and tB (tA > tB ) are the acquisition time of SAR
i
image corresponding to the ith interferogram; Δφdef (x , r )
is the deformation on the slope range corresponding to tB
causes of deformation in Lanzhou. The datasets used in the
tA ⋅ Δφεi(x , r ) is the terrain phase error; Δφαi(x , r ) is the
paper are listed in Table 1. i
atmospheric phase error; and Δφnoi (x , r ) is the noise
phase error.
Assuming that the deformation rate between dif-
ferent interferometric graphs is vi, i − 1 , the cumulative
3 Methods shape variables of tB to tA can be expressed as follows:
tA, i
This paper uses SBAS-InSAR technology to monitor time- i 4π
Δφdef (x , r ) = ∑ (tk − tk − 1) vk , k − 1 (3)
series deformation, deformation rate, and cumulative λ k = tB, i + 1
deformation. The geo-detector is used to analyze the rela-
Three-dimensional phase unwinding of the interfero-
tionship among the surface deformation and the density of
grams of N-scene SAR images can be used to calculate the
road networks, built-up area, land cover types, precipita-
deformation rates of different SAR image acquisition
tion, and temperature by exploring single driving factor
times.
and multidriving factor interactions. The flow chart is
This paper used 32 Sentinel-1A SLC images covering
shown in Figure 3.
the study area from March 2015 to January 2017. The experi-
mental platform of this article is ENVI5.3. There are six
steps of SBAS-InSAR in ENVI. The first step is the con-
3.1 Basic theories of SBAS-InSAR nection graph generation. This step defines the combina-
tion of pairs (interferograms) that will be processed by
SBAS-InSAR was proposed by Berardino et al. [21] and the SBAS. Given N acquisitions, the maximum theoretical
Lanari et al. [22]. SBAS-InSAR is a time-series analysis available connections are (N*(N − 1))/2. The super master
method that combines data to obtain short space baseline will be automatically chosen among the input acquisi-
differential interferogram datasets. These differential inter- tions. Image 2016/02/13 was automatically selected as the
ferograms can overcome spatial decorrelation phenomena. super master image, with a maximum time baseline of 200
Using singular value decomposition (SVD) to solve the days, the range looks of 4, azimuth looks of 1. The super
deformation rate, isolated SAR data sets separated by master is the reference image of the whole process, and all
large spatial baselines can be connected to improve the the processed slant range pairs will be co-registered on this
time sampling rate of the observed data. The high-density reference geometry. The second step is interferometry,
temporal and spatial information of SBAS-InSAR can effec- which is to generate a stack of unwrapped interferograms.
tively eliminate the atmospheric effect phase, making the All of the interferograms are finally co-registered on the
measurement results more accurate [23]. super master geometry and ready for the refinement and
The basic principle is as follows: re-flattening tool and the SBAS inversion kernels. To
M-scene SAR images of the same region are obtained increase the SNR of the interferograms and provide
in the time period from t1 to tM, one of which is selected as a more reliable coherence estimation, the multilooking
the common main image, and then n-scene interferogram is 4:1. The unwrapping method for the SBAS is the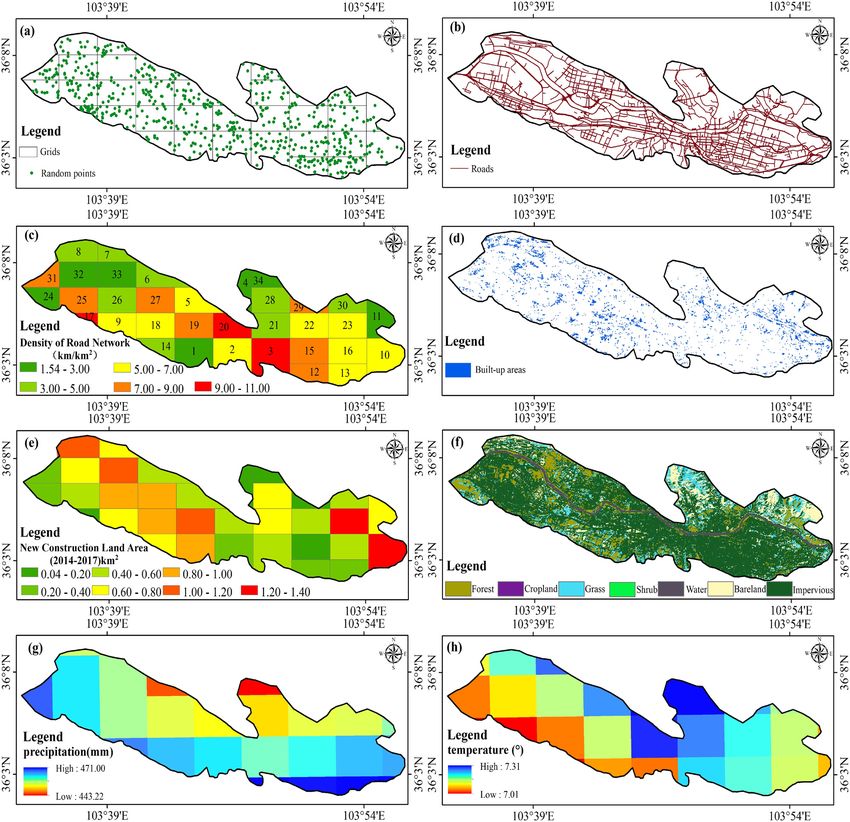
Analysis of surface deformation and driving forces 1131
Figure 3: The flowchart of this study.
Delaunay MCF, this method works well for the connec- We convert LOS (dLOS) into vertical displacement (dv)
tion of groups of high coherence pixels to other isolated for every time-series using the Sentinel-1A incidence
high coherence groups. The third step is refinement angle (θ = 39.58°): dv = dLOS/cos θ.
and re-flattening. This step is executed to estimate and
remove the remaining phase constant and phase ramps
from the unwrapped phase stack. The fourth step is
an inversion to the first step. This step implements the 3.2 Basic theories of geo-detector
SBAS inversion kernel that retrieves the first estimate of
the displacement rate and the residual topography. The geographic detector model (geo-detector) is a statis-
Moreover, a second unwrapping is done within this stage tical method proposed by Wang [24,52], which can detect
on the input interferograms to refine and improve the input spatial variability and reveal driving forces. The core idea
stack because of the next step. We chose the most robust of this method is: if a factor has an important influence on
inversion model: linear model. Coherence thresholds is an the appearance of a phenomenon in space, then the
important criterion for evaluating the quality of interfer- factor should have a similar spatial distribution as the
ence [23,50,51]. The coherence threshold in this step is phenomenon. This method can not only detect the influ-
0.75. This step will get the estimated deformation rate. ence of a single factor but also judge the strength, direction,
The fifth step is inversion second step. After the retrieval and linearity of the interaction across multiple factors. The
of the displacement time-series first estimation, a custom geo-detector includes four detectors: differentiation and
atmospheric filtering is performed on these preliminary factor detection, interaction detection, risk area detection,
results to recover the final and cleaned displacement time and ecological detection.
series. The purpose of the atmospheric filter is to smooth Differentiation and factor detection can detect to
the displacement temporal signature respecting some phy- what extent a factor X explains the spatial differentiation
sical properties of the atmosphere. This filter is imple- of attribute Y through the following expression:
mented with a low-pass spatial filter, combined with a
high-temporal pass filter. The sixth step is geocoding, geo- ∑hL= 1 Nh σh2
q=1− , (4)
coding converts results to the geographic coordinate system. Nσ 2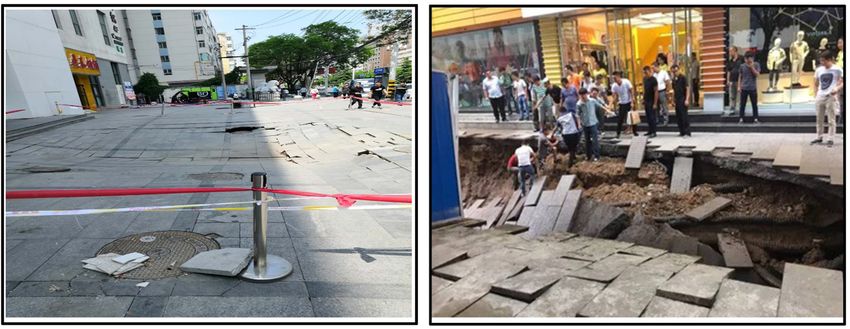
1132 Wenhui Wang et al.
where h = 1, L is the strata of variable Y or factor X (that is Ecological detection is used to compare whether
classification or partitioning); Nh and N are the number of there is a significant difference in the influence factor
units in layer h and the whole region, respectively. The X1 and X2 on the spatial distribution of attribute Y, which
variables σh2 and σ 2 are variances of the Y values of the h is measured by the statistic F.
layer and the entire area, respectively. The range of q is NX1(NX2 − 1) SSWX1
[0, 1]. The larger the value, the more obvious the spatial F= (7)
NX2(NX1 − 1) SSWX2
differentiation of Y is. If the stratification is generated by
L1 L2
the independent variable X, the larger q value indicates
the stronger explanatory power of the independent vari-
SSWX1 = ∑ Nh σh2 SSWX2 = ∑ Nh σh2,
h=1 h=1
able X on the attribute Y, and vice versa. The q value
means that X explains 100 × q% of Y. where NX1 and NX2 represent the sample sizes of factors X1
Interaction detection (that is, to identify the interac- and X2, respectively, and SSWX1 and SSWX2 represent the
tion between different risk factors Xs) combines evalua- sum of intra-layer variances of the layers formed by X1
tion factors X1 and X2. It is increased or reduced when the and X2, respectively. L1 and L2 represent the number of
explanatory power of the dependent variable Y. The eva- layers of variables in X1 and X2, respectively. Null hypoth-
luation method first calculates the q value of Y, caused by esis H0: SSWX1 = SSWX2 . If H0. is rejected at the α signifi-
two kinds of factors X1 and X2, respectively: q(X1) and cance level, indicating a significant difference in the
q(X2). It then calculates their interaction q-value: q(X1 ∩ effect of factors X1 and X2 on the spatial distribution of
X2) and compares q(X1), q(X2), and q(X1 ∩ X2). the attribute Y. Geo-detector was used to interpret the
The relationship between the two factors can be di- interpretation of single-factor and multifactor effects.
vided into the following categories (Table 2): The uses of geographical detectors are as follows:
Risk zone detection uses the t-statistic to determine (1) Data collection and arrangement: these data include
whether there is a significant difference in the mean value dependent variable Y and independent variable data X.
of attributes between the two subregions. The independent variable is type quantity, the inde-
pendent variable is discretized by the Jenks Natural
Y¯h = 1 − Y¯h = 2 Breaks (Jenks).
t y¯h=1− y¯h=2 = , (5)
Var(Y¯h=1) Var(Y¯h = 2) 1 / 2 (2) The sample (Y, X) was read into the geographic de-
+
nh = 1 nh = 2
tector software, and then the software was run. The
where Ȳh indicates the properties within the subdomain h results mainly consisted of four parts: differentiation
(averaged), nh is the number of samples in subregion h, and factor detection, interaction detection, risk area
and Var is the variance. The t statistic approximately detection, and ecological detection. Differentiation
obeys deformation’s t distribution, and the calculation and factor detection, interaction detection, and eco-
method of the degree of freedom is as follows: logical detection were analyzed in this paper.
Var(Y¯h = 1) Var(Y¯h = 2)
nh = 1
+ nh = 2
df = (6)
1 Var(Y¯ ) 2
h=1 + 1 Var(Y¯h=2)
2
nh = 1 − 1 nh = 1 nh = 2 − 1 nh = 2
3.3 Data processing
Null hypothesis H0: Ȳh = 1 = Ȳh = 2 , If H0 is rejected at
confidence level α. Two child attributes show that there Aerial survey elevation was used to verify the accuracy of
are significant differences between regions. SBAS-InSAR. To simplify data processing, this paper used
the same shapefile to cut elevation data from the aerial
survey and SBAS-InSAR, to calculate the average of aerial
Tablee 2: The relationship between the two factors survey elevation and SBAS-InSAR elevation data, and to
compute the root-mean-square error (RMSE). The Depart-
Verdict Interaction ment of Resources of Lanzhou offered eight aerial survey
q(X1 ∩ X2) < Min(q(X1), q(X2)) Nonlinear attenuation elevation sites, as shown in Figure 2.
Min(q(X1), q(X2)) < q(X1 ∩ X2) < One-factor nonlinear In this paper, to simplify the work of analysis, the
Max(q(X1)), q(X2)) reduction study area is divided into 34 grids by finishnet in ArcGIS
q(X1 ∩ X2) > Max(q(X1), q(X2)) Double factor enhancement 10.6, as seen in Figure 4a. The density of the road network
Q(X1 ∩ X2) = q(X1) + q(X2) Independence
and the built-up area was calculated for each net and
q(X1 ∩ X2) > q(X1) + q(X2) Nonlinear enhancement
analyzed in the next section; 30 random points in each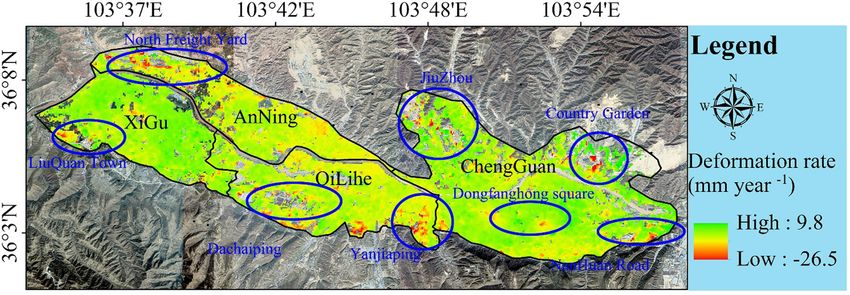
Analysis of surface deformation and driving forces 1133 grid were generated according to the divided study area. reclassify road network density, built-up area, land cover Using the generated random points to extract the attributes types, precipitation, and temperature. Road network den- of deformation rate, temperature, precipitation, road net- sity and built-up area were reclassified into 20 categories work density, land cover types, and built-up area, but some due to their large differences in values. The land cover random points can’t extract attributes for no attribute, there types of data were processed in seven categories. The are 788 random points remaining after removing invalid precipitation and temperature were reclassified into six points (Figure 4a). The extracted attributes were used to and eight categories, respectively. The X data referred to detect the spatial differentiation of surface deformation in density of road network, built-up area, land cover types, the main urban area of Lanzhou. The Independent vari- precipitation, and temperature. The Y data referred to the able is a numerical quantity, they need to be discretized. deformation rate. X and Y data were imported into the We used the Jenks Natural Breaks (Jenks) method to geo-detector for calculation. Figure 4: Results of data processing: (a) grids and random points, (b) road network, (c) density of road network, (d) built-up area, (e) built- up area in grids, (f) land cover types, (g) precipitation, (h) temperature.
1134 Wenhui Wang et al.
Road maps were obtained from the Department of area were obtained by the interpolation of grid data
Resources of Lanzhou, mainly including urban highways, through inverse distance weighting (IDW). Then, the
highways, state roads, pedestrian paths, nine grade roads, average monthly precipitation and temperature of the
provincial roads, railways, county roads, and township study area were compared with surface deformation to
roads, to a total of 510.978 km. The roads were merged calculate a correlation.
into a new layer (Figure 4b). The density of the road net-
work was calculated by road length. The density of the
road network was calculated by the grid and the road
length, the road length in each grid was calculated, and 4 Results and analysis
then the road length was divided by the grid area, finally,
the road network density was obtained (Figure 4c).
4.1 Precision evaluation
Data for the built-up area (Figure 4d) were extracted
from Landsat 8 OLI. First, experiments to monitor change
in the built-up area Lanzhou from 2015 to 2017 were com- Since level data could not be obtained, the paper used
pleted using Landsat 8 OLI images during the same period. local surveying and mapping department elevation and
After pre-processing the images, they were classified through field data to verify the SBAS-InSAR results. The mapping
the Random Forest method, and the ground objects were accuracy of local surveying and mapping department ele-
divided into a built-up area, roads, green spaces, water vation is 1:1,00,000. There were two ways to evaluate the
bodies, and others. Second, the classification results were accuracy of the result: horizontal accuracy and elevation
input in the change monitoring process, monitoring results accuracy, which were evaluated separately. In practical
of the changes in the main urban area of Lanzhou from 2015 applications, only the elevation accuracy needs to be
to 2017 were obtained, where the converted into the built-up evaluated. The RMSE calculation is simple and easy to
area were extracted as the built-up area in this paper. To understand, and it can describe the dispersion degree of
facilitate the calculation, the area of the construction area terrain parameters and true values from the whole [53].
in the grid was calculated as the area of the construction Therefore, the RMSE measures of the two groups of eleva-
area of each grid (Figure 4e). tion were compared and analyzed in this paper. As Figure 5
This paper used the 2017 global 10 m resolution land demonstrates, the results showed that the difference
cover types map (Figure 4f) released by Tsinghua Univer- between the two groups of data was very small (between
sity and the deformation rate map to analyze the relation- −2 and 2), and the RMSE was 1.17, indicating that the
ship between land cover types and surface deformation in results of this study have high reliability.
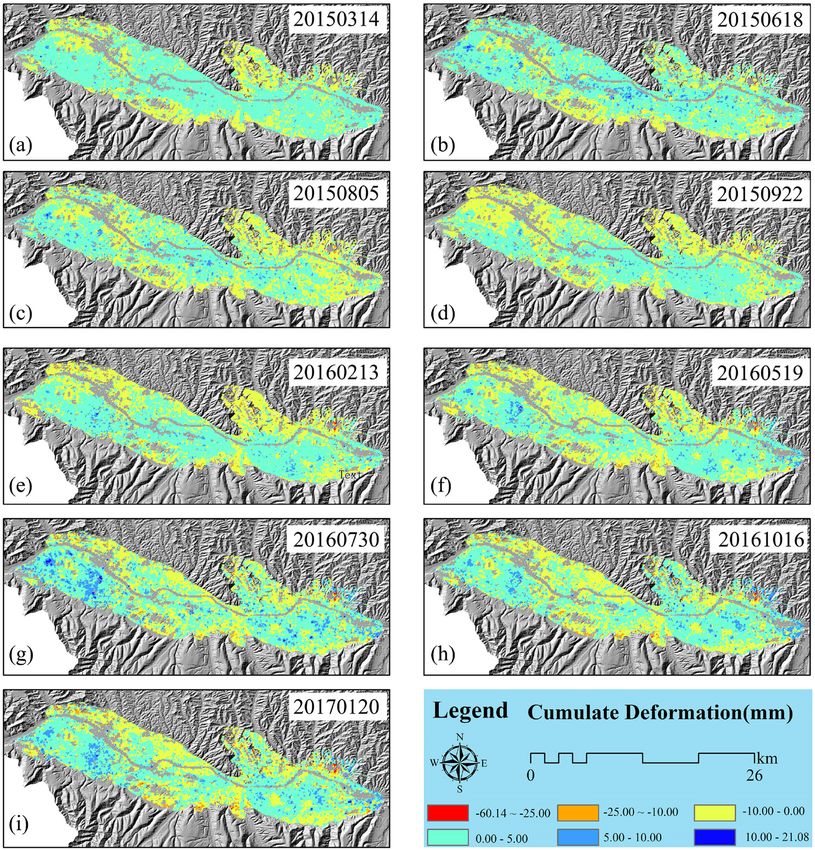
the main urban area of Lanzhou. We used the study area The research team went to the field to investigate
vector to cut the cover types map into seven types: crop- the deformation of Lanzhou (Figure 6). According to the
land, forest, grass, shrub, water, impervious, and bare results, Country Garden and Jiuzhou are more severely
land. Cropland and shrub accounted for a relatively small deformed, and the Lanzhou west station, which is a high-
scale, so cropland, forest, grass, and shrub were merged speed railway station in Lanzhou, was not as serious. The
into vegetation for the convenience of research. Bodies of researchers found the deformation of these locations to be
water in SBAS-InSAR lose coherence in the deformation consistent with the InSAR results, and the deformation of
rate graph, so no research was conducted on them in this Country Garden and Jiuzhou was identifiable to the human
paper. Therefore, the relevant land cover types in this eyes. The types of deformation mainly were cracks, subsi-
study were as follows: vegetation, impervious, and bare dence, and collapses. In particular, the road cracks are very
land. The deformation rate of the three land types was common, with a width of about 5–10 cm and a length of
obtained by using the three types of land to cut the de- several meters. Wall crack width is several centimeters,
formation rate map separately. land subsidence tens of centimeters (Figure 6).
Precipitation (Figure 4g) and temperature (Figure 4h)
were applied to verify the impact of meteorological fac-
tors on the surface deformation of the main urban area of
Lanzhou. Precipitation and temperature grid data were 4.2 Deformation results
obtained from the Center for Climatic Research, Depart-
ment of Geography, University of Delaware, Newark. The Based on SBAS-InSAR technology, the time-series defor-
spatial resolution of the grid data is 0.25 degrees. The mation map and deformation rate map of the study area
precipitation and temperature raster maps of the study from March 2015 to January 2017 were obtained.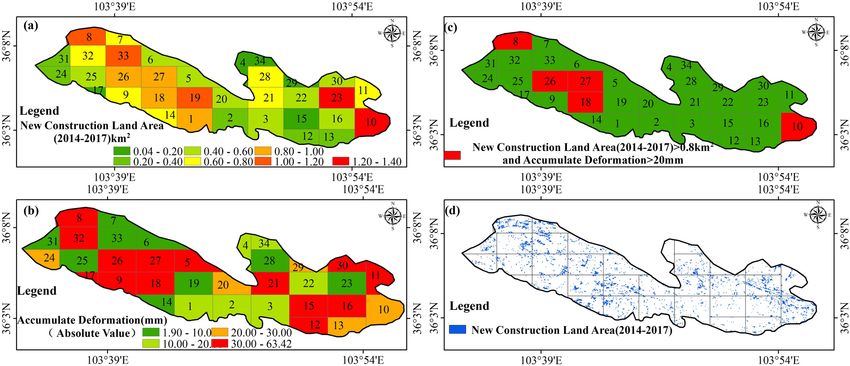
Analysis of surface deformation and driving forces 1135 Figure 5: The elevation evaluation. Figure 6: Field evaluation.
1136 Wenhui Wang et al.
Figures 5 and 6 show, respectively, the deformation (96.90%). Only a small number of points were between
rate and the time-series deformation of the main urban −5.00 to −26.50 mm year−1 and 5.00–10.00 mm year−1,
area of Lanzhou from March 2015 to January 2017. The indicating the main urban area of Lanzhou was stable
maximum deformation rate was −26.50 mm year−1, and from March 2015 to January 2017, but there were also
the maximum rate of increase was 9.80 mm year−1. The some regions with large deformation, which deserve
accumulative deformation was −60.14 mm. From the per- further study.
spective of its spatial distribution (Figure 7), the main
urban area of Lanzhou was stable, but a few regions
were unstable. The deformation of the Chengguan district
was mostly concentrated in the area around the Nanhuan
5 Discussion
road, Dongfanghong square, Jiuzhou, and Country Garden.
The deformation of Qilihe district was mainly in the 5.1 The analysis of differentiation and factor
Dachaiping and Yujiaping areas. The deformation of detection
the Anning district was mainly in the Lanzhou North
Freight Yard, and the deformation of the Xigu district
was mainly in the Liuquan Town. Table 4 describes the driving coefficient of each driving
Figure 8 shows the rate of deformation over time. It force and its explanatory force. The driving coefficient q is
can be concluded that the first deformation began on the highest in the built-up area and the lowest in land
2015/03/14 in Lanzhou Country Garden, Jiuzhou, North cover types. The p-value represents a significant test.
Freight Yard, Yanjiaping, and Dachaiping. As time pro- The smaller the P, the higher the accuracy of the data.
gressed, deformation in these areas gradually grew, and Therefore, the built-up area and the density of the road
the range of deformation gradually expanded. By 2016/ network are the main driving forces for surface deforma-
07/30, the uplifting trend of Xigu district had intensified, tion in Lanzhou from 2015 to 2017. The deformation rate
and some areas with large deformation in the central city for the built-up area is interpreted as 40.10%, while the
(Dongfanghong Square) had begun to stand out. By 2016/ interpretation for the density of road network interpreta-
10/16, the uplifting trend of Xigu district had slowed tion is 39.65%. The deformation rate for temperature and
down. The time-series deformation peaked by 2017/01/ precipitation is interpreted as 12.90% and 15.30%, respec-
20. The partial deformation of the central city was further tively, but the influence of these factors on the deforma-
aggravated. tion rate of Lanzhou cannot be ignored. The actual influ-
In this paper, the raster deformation rate maps with a ence of temperature and precipitation higher than the
coherence of 0.70 in SBAS-InSAR results were converted experimental value, since the resolution of the meteoro-
into vector points, covering a total of 415,893 vector logical data, is insufficient leading to differences in the
points in the study area (see Table 3), and the vector spatial distribution of the meteorological data. This paper
points with a deformation rate of −5 to 5 mm year−1 ac- further analyzed the spatial distribution and cause of each
counted for the vast majority of the deformation rate driving force.
Figure 7: Deformation rate of the study area.Analysis of surface deformation and driving forces 1137 Figure 8: Time-series deformation. Table 3: Statistics of the deformation rate Deformation rate (mm year−1) Number of points Percentage of total points (%) Accumulated percentage of total points (%) −26.5.0 to −20.00 105 0.02 0.02 −20.00 to −5.00 126,26 3.03 3.06 −5.00 to 5.00 4,03,039 96.90 99.96 5.00–10.00 123 0.02 100 Table 4: Factor detector results Driving factor Density of road network Built-up area Land cover types Temperature Precipitation q statistic 0.39 0.40 0.07 0.12 0.15 p value 0.00 0.00 0.03 0.00 0.00
1138 Wenhui Wang et al.
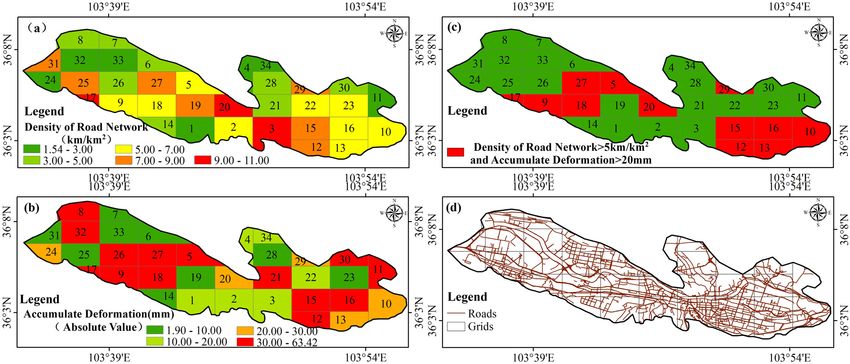
5.1.1 Density of road network and surface deformation indicators of urban sprawl. After reviewing the statistical
yearbooks in Lanzhou from 2015 to 2017 [58,59], we found
It is essential to analyze the relationship between surface that economic output increased from 20.093 to 252.354
deformation and density road network for road surface billion yuan from 2015 to 2017, urban population density
deformations that have a significant effect on the speed increased from 3,514 people km2 to 3,576 people km2; the
profile of vehicles and traffic flow conditions [3,4]. This urbanization process was fast. To analyze the urbanization
paper studied the density road network to explain the effect on surface deformation in Lanzhou, this paper ana-
reason for surface deformation. The density of the road lyzes the spatial relationship between the built-up area
network is between 1.54 and 11 km km2 (Figure 9a). The and the surface deformation. The relationship reflects
density of the road network has 19 areas between 5 and the relationship between urbanization and surface defor-
11 km. They are concentrated in the Chengguan district mation.
and Qilihe district. There were 19 time-series deformation As shown in Figure 10d, the built-up area of Lanzhou
of grids greater than 20 mm (absolute value). The density is 19.38 km2. Using Fishnet, the study divides these areas
of the road network is greater than 5, and the time series into 34 grids: the area of the built-up area of each grid is
form variables are greater than 20 mm at area intersec- shown in Figure 10a, the cumulative deformation is shown
tions (Figure 9c), amount to a total of 12 areas (5, 9, 10, 12, in Figure 10b, with time-series deformations larger than
13, 15, 16, 17, 18, 20, 27, 29). The density of the road 20 mm and the built-up area larger than 0.8 km2 selected.
network is likely to the major cause of Nanhuan Road, As shown in Figure 10c, the surface deformation of the 8,
Dongfanghong Square, and Dachaiping’s deformation, as 10, 18, 26, and 27 regions may be related to changes in the
shown in Figure 9a. Soil deformation and stratum move- built-up area [60]. Figure 10c/8 and Figure 10c/10 show
ment are caused by the loading and unloading on the the Lanzhou north freight yard and Nanhuan road, respec-
ground, which may affect the surface structure, the rela- tively, which also have a large built-up area and serious
tively concentrated ground load is an important factor of deformation. The built-up area is also an indispensable
road deformation [10,54,55]. cause of surface deformation in the region. The construc-
tion of a large number of projects, including the develop-
ment of underground spaces and the excavation of building
5.1.2 Built-up area and surface deformation foundation pits, resulted in the extraction of underground
liquid supports, the excavation of solid supports, and the
Urbanization is the focus of many Chinese scholars [56,57]. destruction of the stress balance of the rock and soil,
Population density and built-up areas are often important leading to surface deformation [10].
Figure 9: Density of road network and time-series deformation: (a) density of road network; (b) time series deformation; (c) the area where
the density of road network >5 km/km2 and time series d > 20 mm; (d) the road network in Lanzhou.Analysis of surface deformation and driving forces 1139
Figure 10: Built-up area and time-series deformation: (a) built-up area from change detection; (b) time series deformation in Lanzhou;
(c) the area where the built-up area (2015–2017) >0.80 km2 and time-series deformation >20 mm; (d) the area of the built-up area in Lanzhou.
5.1.3 Land cover types and surface deformation reason for this distribution is continuous land-creation
projects.
Figure 11 shows that impervious land (Figure 11a) accounts The area of impervious land (Figure 11a) accounts for
for the largest section of the study area, followed by vege- the largest sectionof Lanzhou, and the deformation rate is
tation (Figure 11b), the urban area is relatively evenly dis- between −5 and 5 mm year−1 (Figure 11a). Surface deforma-
tributed, and other areas are symmetrically distributed. In tion varies in the North Freight Yard, Dachaiping, Yujiaping,
general, vegetation coverage in Lanzhou is low. Finally, Jiuzhou, and Country Garden Large, between −5 and −15 mm
the bare land is distributed mainly in Jiuzhou and Country year−1, and the deformation rate of Jiuzhou and Country
Garden (Figure 11c). After observing the optical image, the Garden varies between −15 and −26.50 mm year−1. The
Figure 11: The land cover types with deformation rate: (a) deformation rate in impervious; (b) deformation rate in vegetation; (c) surface
deformation in bar land; (d) the deformation rate in Lanzhou.1140 Wenhui Wang et al.
vegetation area is small and the distribution is relatively decrease in the Lanzhou area: freezing soil causes the
uniform, with a deformation rate mainly concentrated volume to expand. As the temperature rises, the frozen
between −5 and 5 mm year−1. Surface deformation in soil gradually melts and the volume shrinks, leading to
vegetation is relatively small and relatively stable surface deformation [8,38].
(Figure 11b). Bare land is mainly distributed in North Furthermore, to quantitatively study the relationship
Freight Yard, Jiuzhou, and Country Garden (Figure 11c), and between the time-series deformation and meteorological
the surface deformation of these areas is also serious. The factors, the correlation between precipitation and tem-
land cover types are more obvious in bare land. The deep perature and time-series deformation is analyzed, through
reason is the continue of land-creation. According to rele- a linear equation and correlation coefficient (R), as shown
vant scholars, human settlements [61] and industrial areas in Figure 13. Time-series deformation has a clear negative
are inextricably linked to surface deformation. Because correlation with precipitation and temperature. The corre-
groundwater exploitation in human activities is also lation coefficient (R) of the precipitation and time-series
serious, leading to a decline in groundwater level. deformation is −0.61 (Figure 13a), and the correlation coef-
Groundwater decline and surface deformation are clo- ficient (R) between temperature and time-series deforma-
sely related [29,62]. tion is −0.583 (Figure 13b). The correlation between pre-
cipitation and time-series deformation is stronger than
temperature, indicating that precipitation has a greater
5.1.4 Meteorological factors and surface deformation impact on surface deformation.
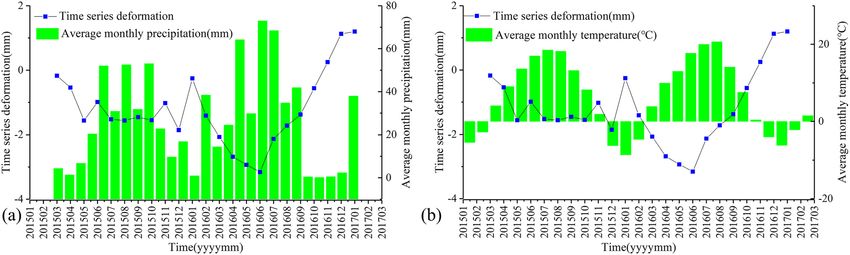
Precipitation and deformation values are also related
(Figure 12a). In the winter between 2015 and 2016, there
was less precipitation in the study area and more deforma- 5.2 The analysis of ecological detection
tion, whereas in the summer (July, August, and September),
precipitation was great and deformation as small, especially Figure 14 depicts the result of ecological detection, which
in 2016, when precipitation was more pronounced. Heavy means the difference in the combined effects of the
precipitation supplements groundwater, thus reducing sur- driving forces on surface deformation: the effects of tem-
face deformation [35]. perature, precipitation, density of road network, land
The temperature rises from February to August and cover types, and built-up area show varying levels of
falls from September to January (Figure 12b). The highest influence on surface deformation are significantly dif-
temperature is about 20°C in the summer and the lowest ferent. There is no major difference in the influence of
temperature is about −10°C in the winter. As the tempera- the built-up area and density of road network on surface
ture rises, the surface sinks, and with the decrease of deformation, while there is a significant difference in the
temperature, the surface shows an upward trend. This influence of built-up area and temperature, precipitation,
phenomenon is mainly due to the seasonal temperature and land cover types on surface deformation, and there is
Figure 12: Time-series deformation and average monthly precipitation and temperature. (a) Average time-series deformation and the
monthly mean precipitation. (b) Average time-series deformation and the monthly mean temperature.Analysis of surface deformation and driving forces 1141 Figure 13: The correlation between precipitation, temperature, and deformation. (a) Correlations between average time series deformation and monthly mean precipitation. (b) Correlations between average time series deformation and monthly mean temperature. also a significant difference in the influence of road and significant difference in the influence of precipitation and temperature, precipitation, and land cover types. In addi- land cover types. From the above, it can be concluded that tion, there is no significant difference in the influence of the impact of the built-up area and density of the road temperature, precipitation, and land cover types, and no network on surface deformation is consistent. Temperature Figure 14: The difference in the combined effects of the driving forces. N: there is no significant difference in the influence of two driving forces; Y: there is a significant difference in the influence of two driving forces.
1142 Wenhui Wang et al.
Table 5: The interaction detector
Interactive factor X1 ∩ X2) P(X1) P(X2) P(X1 ∩ X2) Interaction result Effect mode
Built-up area ∩ density of road network 0.40 0.40 0.42 P(A ∩ B) > max[P(A), P(B)] Bilinear enhancement
Built-up area ∩ temperature 0.40 0.13 0.50 P(A ∩ B) > max[P(A), P(B)] Bilinear enhancement
Built-up area ∩ precipitation 0.40 0.15 0.44 P(A ∩ B) > max[P(A), P(B)] Bilinear enhancement
Built-up area ∩ land cover types 0.40 0.07 0.55 P(A ∩ B) > P(A) + P(B) Nonlinear enhancement
Density of road network ∩ temperature 0.40 0.13 0.52 P(A ∩ B) > max[P(A), P(B)] Bilinear enhancement
Density of road network ∩ precipitation 0.40 0.15 0.46 P(A ∩ B) > max[P(A), P(B)] Bilinear enhancement
Density of road network ∩ land cover types 0.40 0.07 0.54 P(A ∩ B) > P(A) + P(B) Nonlinear enhancement
Temperature ∩ precipitation 0.13 0.15 0.18 P(A ∩ B) > max[P(A), P(B) ] Bilinear enhancement
Temperature ∩ land cover types 0.13 0.07 0.25 P (A ∩ B) > P(A) + P(B) Nonlinear enhancement
Precipitation ∩ land cover types 0.15 0.07 0.29 P(A ∩ B) > P(A) + P(B) Nonlinear enhancement
and precipitation are both meteorological factors, and their 6 Conclusions
effects on surface deformation are consistent. It can be
found that the influences of land cover types and tempera- This paper obtained the spatial-temporal characteristics of
ture and precipitation on surface deformation are also con- surface deformation by using SBAS-InSAR technology in
sistent (Figure 14). the main urban area of Lanzhou, Gansu Province, China,
based on Sentinel-1A descending data from March 2015 to
January 2017. Moreover, the geo-detector is used to quan-
titatively analyze the driving factors among the surface
5.3 The analysis of interaction detection deformation and temperature, precipitation, the density
of road networks, land cover types, and built-up area, by
Table 5 describes the results of interaction detection. In- exploring single driving factor and multidriving factor
teraction detection identified the interaction between dif- interactions. The results showed that the overall surface
ferent risk factors Xs. From Table 5, it can be concluded deformation in Lanzhou was stable, and the deformation
that the spatial distribution and differentiation of surface rate was −26.50 to 9.80 mm year−1. However, surface
deformation in the main urban area of Lanzhou is not deformations in Nanhuan road, Dongfanghong square,
only affected by a single driving factor but a result of Jiuzhou, Country Garden, Dachaiping, Yujiaping area,
the interaction of multiple driving factors, whose com- Lanzhou North Freight Yard, and Liuquan town were
bined effect is more significant than any single driving serious and deserving of special attention. The geo-detector
factor. The interactive explanatory power between the demonstrated the explanatory power of the driving factors,
built-up area and land cover types is 0.55, which demon- and with a sequence of single factors as follows: built-up
strates, the greatest impact on surface deformation, fol- area (0.40), the density of road network (0.39), precipita-
lowed by the density of road network ∩ land cover types tion (0.15, temperature (0.12), land cover types (0.07),
and the density of road network ∩ temperature, which are which indicated that the main factors in single factors
0.54 and 0.52, respectively. Compared with the expla- causing the surface deformation are built-up area and the
natory power of the single driving factor, all driving fac- density of road network. We found that each driving factor
tors have an enhanced effect on the spatial distribution does not act on surface deformation alone, but rather
and differentiation characteristics of surface deformation through a more complicated superposition relationship.
after mutual interaction, and the effect is not indepen- Interactive explanatory power was stronger than a single
dent. The interaction between the driving factors is a explanatory factor. Built-up area ∩ land cover types and the
complex superposition relationship, rather than a simple density of road networks ∩ land cover types were the main
operational relationship. It is worth noting that the inter- causes of surface deformation.
action patterns between land cover types and density of In this paper, it is the first time to analyze the influ-
road network, temperature, precipitation, and built-up encing factors of surface deformation with the geo-
area are a nonlinear enhancement, because their expla- detector method and quantify the quantitative relationship
natory power is quite different from that of other driving between surface deformation and influencing factors. The
factors [63]. geo-detector provides a good analytical tool to monitor theAnalysis of surface deformation and driving forces 1143
multifactor interactions causing surface deformation. The [5] He Y, Wang W, Yan H, Zhang L, Chen Y, Yang S. Characteristics
combination of InSAR and geo-detector can also be used of surface deformation in Lanzhou with Sentinel-1A TOPS.
for the analysis of driving forces in other disasters. The Geosciences. 2020;10:99.
[6] Peltier A, Scott B, Hurst T. Ground deformation patterns at
study provides reference data and a scientific basis for dis-
White Island volcano (New Zealand) between 1967 and 2008
aster prevention and ecologically sustainable in Lanzhou. deduced from levelling data. J Volcanology & Geotherm Res.
The disadvantage of this paper is that groundwater level 2009;181(3–4):207–18.
extraction, age of building construction (and urbanization [7] Palano M, Guarrera E, Mattia. M. GPS deformation patterns at
in general), thickness, and geotechnical characteristics of Mount St. Helens (Washington,DC, USA) from 2004 to 2010.
Terra Nova. 2012;24(5):148–55.
the compressible layers and faults were not considered for
[8] Wang F, Ding Q, Zhang L, Wang MC, Wang Q. Analysis of land
the absence of data. The disadvantage will be perfected in surface deformation in Chagan Lake Region using TCPInSAR.
our future work. Sustainability. 2019;11:5090.
[9] Zhu W, Li W, Zhang Q, Yang Y, Zhang Y, Qu W, et al. A decade of
Conflict of Interest: The authors declare no conflict of ground deformation in Kunming (China) revealed by multi-
temporal synthetic aperture radar interferometry (InSAR)
interest.
technique. Sensors. 2019;19(20):4425.
[10] Qin X, Yang M, Liao M, Wang H, Yang T. Exploring temporal-
Author Contributions: W. W. conceived the idea, spatial characteristics of Shanghai Road network settlement
designed and performed the experiments, produced the with multi-temporal PSInSAR Tecnique. Geomat Inf Sci Wuhan
results, and drafted the manuscript. Y. H. contributed to Univ [ChEngl Abstr]. 2017;42(2):170–7.
translate and modify the paper. L. Z. audited the figures. [11] Jeon SS, Park YK, Eum KY. Stability assessment of roadbed
affected by ground subsidence adjacent to urban railways. Nat
Y. C. downloaded the data. L. Q. finished geo-detector.
Hazards Earth Syst Sci. 2018;18(8):2261–71.
H. P. finished methods. [12] Serrano-Juan A, Pujades E, Vázquez-Suñè E, Crosetto M,
Cuevas-González. Leveling vs. InSAR in urban underground
Funding: This work is funded by the National Key R&D construction monitoring: pros and cons. Case of la sagrera railway
Program of China (2017YFB0504201), The Youth fund station (Barcelona, Spain). Eng Geol. 2016;218(2017):1–11.
of LZJTU, No. 2017002; LZJTU EP, No. 201806, Tianyou [13] Polcari M, Moro M, Romaniello V, Stramondo S. Anthropogenic
subsidence along railway and road infrastructures in Northern
Youth talent lift program of Lanzhou Jiaotong University,
Italy highlighted by Cosmo-SkyMed satellite data. J Appl
the National Scientific Foundation of China (Grants No. Remote Sens. 2019;13(2):1.
41371435, 41761088, 41761014, 41761082, 41801395, and [14] Ferretti A, Ferrucci F, Prati C, Rocca F. SAR analysis of building
41861059) and the National Key Research and Development collapse by means of the permanent scatterers technique. Int
Program of China (2016YFC0803106), “InSAR monitoring of Geosci Remote Sens Symposium. 2000;3219–21.
[15] Sousa JJ, Bastos L. Multi-temporal SAR interferometry reveals
land subsidence in the main urban area of Lanzhou city” by
acceleration of bridge sinking before collapse. Nat Hazards
the department of education of Gansu Province(2019A-043); Earth Syst Sci. 2013;13(3):659–67.
China postdoctoral science foundation (2019M660092XB). [16] Liu Q, Yue G, Ding X, Yang K, Feng G, Xiong Z. Temporal and
spatial characteristics analysis of deformation along foshan
subway using time series InSAR. Geomat Inf Sci Wuhan
University[in Chin Engl Abstr]. 2019;44:1099–106.
[17] Hu F, Freek J, Chang L, Wu J, Ramon F. Monitoring deformation
along railway systems combining multi-temporal InSAR and
References LiDAR data. Remote Sens. 2019;11:19.
[18] Liu Y, Li L, Yang J, Chen X, Zhang R. Snow depth inversion
[1] Du Z, Ge L, Ng AH, Zhu Q, Yang X, Li L. Correlating the sub- based on D-InSAR method[in Chinese with English abstract].
sidence pattern and land use in Bandung, Indonesia with both J Remote Sens. 2018;22(05):802–9.
Sentinel-1/2 and ALOS-2 satellite images. Int J Appl Earth [19] Kang Y, Zhao C, Zhang Q, Liu X. Research on the InSAR tech-
Observation Geoinf. 2018;67:54–68. nique of landslide detection: a case study of Wudongde
[2] Babaee S, Mousavi Z, Masoumi Z, Malekshah AH, Roostaei M, Hydropower station section. Jin shajiang[in Chin Engl Abstr]
Aflaki M. Land subsidence from interferometric SAR and J Geodesy Geodynamics. 2018;38(10):1053–7.
groundwater patterns in the Qazvin plain, Iran. Int J Remote [20] Lu Y, Li W, Xu Q, Dong X, Dai C, Wang C. Early detection of
Sens. 2020;41(12):4778–96. landslides in the upstream and downstream areas of the Baige
[3] Aydin MM, Topal A. Effects of pavement surface deformations Landslide, the Jinsha River based on optical remote sensing
on traffic flow. Transport. 2019;34(2):204–14. and InSAR Tec. Geomat Inf Sci Wuhan University[in Chin Engl
[4] Aydin MM, Topal A. Effect of road surface deformations on Abstr]. 2019;44(9):1342–54.
lateral lane utilization and longitudinal driving behaviours. [21] Berardino P, Fornaro G, Lanari R, Sansosti E. A new algorithm
Transport. 2016;31(2):192–201. for surface deformation monitoring based on small baseline1144 Wenhui Wang et al.
differential SAR interferograms. IEEE Transactions on [38] Wang S, Xu B, Shan W, Shi J, Li Z, Feng G. Monitoring the
Geoscience & Remote Sensing. 2002;40(11):2375–83. degradation of island permafrost using time-series InSAR
[22] Lanari, Mora O, Manunta M, Mallorquí JJ, Berardino P, technique: a case study of Heihe, China. Sensors.
Sansosti E. A small-baseline approach for investigating 2019;19(6):1364.
deformations on full-resolution differential SAR interferograms. [39] Wang Y, Guo Y, Hu S, Li Y, Wang J, Liu X, et al. Ground defor-
IEEE Trans Geosci Remote Sens. 2004;42(7):1377–86. mation analysis using InSAR and backpropagation prediction
[23] Liao W. Time series InSAR technology and application. Beijing: with influencing factors in Erhai Region, China. Sustainability.
Science Press; 2014. 2019;11:2853.
[24] Wang J, Xu C. Geo-detector: principle and prospective. Acta [40] Scoular J, Ghail R, Mason PJ, Lawrence J, Bellhouse M, Holley R,
Geographica Sinica[in Chin Engl Abstr]. 2017;72(1):116–34. et al. Retrospective InSAR analysis of East London during the
[25] Ju H, Zhang Z, Zuo L, Wang J, Zhang S, WangX, et al. Driving construction of the Lee Tunnel. Remote Sens. 2020;12:5.
forces and their interactions of built-up land expansion based [41] Wang T. Surface Deformation Monitoring Research Based on
on the geographical detector – a case study of Beijing, China. Time Series InSAR Technology-Acase Study of Lanzhou.
Int J Geographical Inf Sci. 2016;30(11):2188–207. Lanzhou: M.S, Lanzhou University; 2015.
[26] Liao Y, Zhang Y, He L, Wang J, Liu X, Zhang N, et al. Temporal [42] Xue Y, Meng X, Li K, Chen G. Loess slope instability assess-
and spatial analysis of neural tube defects and detection of ment based on PS-InSAR detected and spatial analysis in
geographical factors in Shanxi Province, China. PLoS One. Lanzhou Region, China. Adv Mater Res. 2014;2342–52.
2016;11(4):2188–207. [43] Zhang L. Spatial-temporal Process Analyses on Urban
[27] Chen C, Zhang Q, Lv X, Huang X. Analysis on spatial-temporal Expansion of Lanzhou under Different Terrain. Lanzhou: M.S.
characteristics and driving mechanisms of cropland occupa- Lanzhou University; 2017.
tion and supplement in Jiangsu Province[in Chinese with [44] Rana V, Suryanarayana T. Visual and statistical comparison of
English abstract]. Economic Geogr. 2016;36(4):155–63. ASTER, SRTM, and Cartosat digital elevation models for
[28] Hu K, Wei L, Liu S, Li X. Spatial pattern of debris-flow catch- watershed. J Geovisualization Spat Anal. 2019;3(23):12.
ments and the rainfall amount of triggering debris flows in the [45] Reute H, Jarvis A. An evaluation of void filling interpolation
Hengduan Mountains region. Acta Geographica Sinica[in Chin methods for SRTM data. Int J Geographic Inf Sci.
Engl Abstr]. 2019;11:2303–13. 2007;21:983–1008.
[29] Tang J, Liu G, Song Y, Chen W, Yu B. Significant subsidence [46] Durre I, Menne M, Gleason B, Houston T, Vose R.
detection and analysis by PALSAR and ASAR PSI[in Chinese Comprehensive automated quality assurance of daily surface
with English abstract]. J Remote Sens. 2015;19(6):1019–29. observations. J Appl Meteorol Climatol. 2010;49:1615–33.
[30] Wang H, Feng G, Xu B, Yu Y, Li L, Du Y, et al. Deriving spatio- [47] Willmott C, Matsuura K. Terrestrial Air Temperature:
temporal development of ground subsidence due to subway 1900–2017 Gridded Monthly Time Series (1900–2017); 2017.
construction and operation in delta regions with PS-InSAR [48] Willmott C, Matsuura K. Terrestrial Precipitation: 1900–2017
data: a case study in Guangzhou, China. Remote Sens. Gridded Monthly Time Series (1900–2017); 2017.
2017;9(10):1004–12. [49] Gong P, Liu H, Zhang M, Li C, Wang J, Huang H, et al. Stable
[31] Ahmad W, Choi M, Kim S, Kim D. Detection of land subsidence classification with limited sample: transferring a 30 m reso-
and its relationship with land cover types using ESA Sentinel lution sample set collected in 2015 to mapping 10 m
satellite data: a case study of Quetta Valley, Pakistan. Int J resolution global land cover in 2017. Sci Bull. 2019;64:
Remote Sens. 2019;40(24):9572–603. 370–80.
[32] Zhou C, Gong H, Chen B, Gao M, Cao Q, Cao J, et al. Land [50] Simons M, Rosen PA. Interferometric synthetic aperture radar
subsidence response to different land use types and water geodesy. Treatise Geophysics. 2007;3(6):391–446.
resource utilization in Beijing-Tianjin-Hebei. China Remote [51] Gabriel AK, Goldstein RM, Zebker HA. Mapping small elevation
Sens. 2020;12(3):457. changes over large areas: differential radar interferometry.
[33] Minderhoud PS, Coumou L, Erban LE, Middelkoop H, J Geophys Res. 1989;94(b7):9183–91.
Stouthamer E, Addink EA. The relation between land use and [52] Wang JF, Li XH, Christakos G, Liao YL, Zhang T, Gu X.
subsidence in the Vietnamese Mekong delta. Sci Total Environ. Geographical detectors-based health risk assessment and
2018;634(SEP.1):715–26. its application in the neural tube defects study of the
[34] Wang F, Ding Q, Zhang L, Wang M, Wang Q. Analysis of land Heshun region, China. Int J Geographical Inf Sci. 2010;
surface deformation in Chagan Lake Region using TCPInSAR. 24(1):107–27.
Sustainability. 2019;11(18):5090. [53] Li J. Elevation Information Extraction and Accuracy Anaysis
[35] Zhou L, Guo J, Hu J, Li J, Xu Y, Pan Y, et al. Wuhan surface Based on InSAR. Haebin: Haebin Institute of Technology;
subsidence analysis in 2015–2016 based on Sentinel-1A data 2012.
by SBAS-InSAR. Remote Sens. 2017;9(10):982. [54] Hu Z, Wang Y, Chen Y, Xiao H. Deformation and failure me-
[36] Chen YX, Jiang LM, Liang LL, Zhou ZW. Monitoring permaforst chanism of rapid stabilization for dredger fill in road engi-
deformation in the upstream Heihe River, Qilian Mountain by neering. Arab J Geoences. 2020;13(6):1–11.
using multi-temporal Sentinel InSAR dataset[in Chinese with [55] Leng J, Gabr MA. Deformation-resistance model for geogrid-
English abstract]. Chin J Geophys. 2019;62:2441–54. reinforced unpaved road. Transportation Res Rec.
[37] Li SS, Li ZW, Hu J, Sun Q, Yu XY. Investigation of the Seasonal 1975;2006:146–54.
oscillation of the permaforst over Qinghai-Tibet Plateau with [56] Wang X, Wan G. China’s urban employment and urbanization
SBAS-InSAR algorithm[in Chinese with English abstract]. Chin rate: a re-estimation[in Chinese with English abstract]. China
J Geophys. 2013;56:1476–86. & World Economy. 2014;1:30–44.You can also read