Quantification Approaches for Fatigue Crack Resistance of Thermoplastic Tape Layered Composites with Multiple Delaminations - DORA 4RI
←
→
Page content transcription
If your browser does not render page correctly, please read the page content below
Article

Quantification Approaches for Fatigue Crack Resistance of
Thermoplastic Tape Layered Composites with
Multiple Delaminations
Anastasiia Khudiakova 1, Andreas J. Brunner 2, Markus Wolfahrt 1 and Gerald Pinter 3,*

                                         1 Polymer Competence Center Leoben GmbH, Roseggerstraße 12, 8700 Leoben, Austria;
                                           anastasiia.khudiakova@pccl.at (A.K.); markus.wolfahrt@pccl.at (M.W.)
                                         2 Retired from Empa, Swiss Federal Laboratories for Materials Science and Technology, Laboratory for

                                           Mechanical Systems Engineering, Überlandstrasse 129, 8600 Dübendorf, Switzerland;
                                           andreas.brunner@empa.ch
                                         3 Institute of Materials Science and Testing of Polymers, Montanuniversität Leoben, Otto Glöckel-Straße 2/II,

                                           8700 Leoben, Austria
                                         * Correspondence: gerald.pinter@unileoben.ac.at

                                         Abstract: Automated tape placement with in-situ consolidation (ATPisc) is a layer-wise manufac-
                                         turing process in which the achievement of proper interlayer bonding constitutes one of the most
                                         challenging aspects. In the present study, unidirectional carbon fiber reinforced thermoplastic lam-
                                         inates were produced following different manufacturing protocols using ATPisc. The interlayer
                                         bonding of the laminates produced was characterized by mode I fatigue fracture tests with double
                                         cantilever beam (DCB) specimens. Independent of the manufacturing approach, the laminates ex-
Citation: Khudiakova, A.; Brunner,       hibited multiple cracking during DCB testing, which could not be evaluated simply following
A.J.; Wolfahrt, M.; Pinter, G.
                                         standard methods. Thus, various data analysis methodologies from literature were applied for the
Quantification Approaches for
                                         quantitative assessment of the fracture behavior of the laminate. The examination of the evolution
Fatigue Crack Resistance of
                                         of the damage parameter       and the effective flexural modulus throughout testing enabled a better
Thermoplastic Tape Layered
                                         understanding of the damage accumulation. The Hartman-Schijve based approach was revealed to
Composites with Multiple
Delaminations. Materials 2021, 14,
                                         be a convenient method to present fatigue crack growth curves of laminates with multiple delami-
1476. https://doi.org/10.3390/
                                         nations. Moreover, a preliminary attempt was made to employ a ‘zero-fiber bridging’ methodology
ma14061476                               to eliminate the effect of additional damage processes on the fatigue crack growth that resulted in
                                         large-scale, partially massive fiber bridging.
Academic Editor: Andrea Spagnoli
                                         Keywords: automated tape placement; interlayer bonding; mode I fracture; double cantilever beam;
Received: 27 January 2021                multiple delaminations; crack branching; damage index
Accepted: 2 March 2021
Published: 17 March 2021

Publisher’s Note: MDPI stays neu-
                                         1. Introduction
tral with regard to jurisdictional
claims in published maps and insti-
                                               Carbon fiber reinforced polymer (CFRP) laminate composites have been increasingly
tutional affiliations.                   adopted in global industries, such as aerospace and automotive, due to their light weight
                                         leading to fuel savings and lower CO2 emissions. They are also known for their high
                                         strength-to-weight and stiffness-to-weight ratios, giving them an edge over traditional
                                         metal parts [1,2]. Composites with thermoplastic matrices are the most attractive for in-
Copyright: © 2021 by the authors.        dustry sectors because of their outstanding fracture toughness, high temperature re-
Licensee MDPI, Basel, Switzerland.       sistance, and recyclability [3,4]. Moreover, thermoplastics exhibit the unique ability to so-
This article is an open access article   lidify upon cooling from the melting temperature without undergoing chemical crosslink-
distributed under the terms and con-     ing [5]. Therefore, thermoplastic composites usually do not require post-processing, such
ditions of the Creative Commons At-      as heat or pressure, which leads to lower production costs and significant energy savings.
tribution (CC BY) license (http://cre-   One of the advanced methods to produce CFR thermoplastic laminates is automated tape
ativecommons.org/licenses/by/4.0/).
                                         placement with in-situ consolidation (ATPisc).

Materials 2021, 14, 1476. https://doi.org/10.3390/ma14061476                                                         www.mdpi.com/journal/materials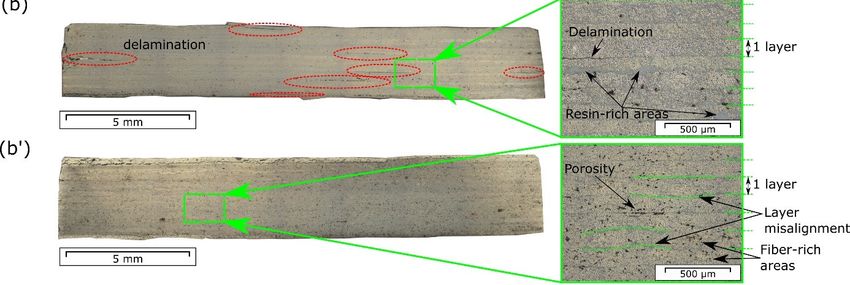
Materials 2021, 14, 1476                                                                                          2 of 24

                                 ATPisc is an additive manufacturing method, where a continuous carbon fiber rein-
                           forced thermoplastic tape is heated with, e.g., a diode laser up to the melting temperature
                           of the matrix and placed on a mold using a compaction roller. The intimate contact created
                           between the tape and the roller ideally leads to inter-diffusion of the polymer chains
                           across the bond interface followed by material solidification with subsequent cooling [6].
                           The non-isothermal layer-wise manufacturing of ATPisc makes the interlayer bonding a
                           critical aspect of the laminates. Therefore, many research works have been devoted to the
                           investigation of the influence of manufacturing parameters on the delamination resistance
                           of ATPisc laminates [7–11]. For this purpose, they have applied the mode I double canti-
                           lever beam (DCB) test. However, only quasi-static loading has been addressed so far,
                           while the crack resistance of ATPisc laminates under cyclic loading has not yet been stud-
                           ied. Since service loads are typically cyclic rather than quasi-static, the respective fatigue
                           fracture characterization requires intensive research.
                                 The present work attempts to close this gap by characterizing the fatigue delamina-
                           tion resistance of unidirectional (UD) carbon fiber reinforced polyphenylene sulfide
                           (CF/PPS) laminates produced by ATPisc. The laminates were manufactured following
                           two different manufacturing protocols with an additional application of two manufactur-
                           ing parameter sets of the tape placement speed and process temperature. Unexpectedly,
                           besides the main mid-plane crack propagation, multiple interlayer delaminations were
                           visually observed for several specimens during fatigue mode I DCB testing. It is known
                           that additional damage processes affect the main mid-plane crack propagation, leading to
                           data that could not be reasonably quantified according to the standard data analysis [12–
                           14]. Pascoe et al. [15] have shown that multiple delaminations of different lengths yield
                           different local strain energy release rate (SERR). In addition, it was shown that the position
                           of these delaminations in a specimen effect both the local and global SERR. The problem
                           of multiple delamination in laminates has also been addressed by [16–18] numerically.
                           Hence, an important goal of this study was to find ways to quantitatively characterize the
                           laminate quality from the experimental point of view. For this purpose, the evolution of
                           the crack length correction factor ∆ and the effective flexural modulus was examined
                           throughout the tests. In addition, the damage parameter         [19] was calculated to charac-
                           terize the degree of damage at the beginning and the end of testing. The fatigue delami-
                           nation resistance was characterized using both, the classic Paris relation and the modified
                           Hartman-Schijve equation [20]. In addition, three-point bending tests were performed on
                           specimens prior to and after DCB testing to determine a possible change in the flexural
                           modulus. Moreover, a ‘zero-fiber bridging’ methodology for the determination of ‘con-
                           servative’ mode I delamination resistance data [21] was applied as a preliminary attempt
                           to exclude the effect of multiple cracking and fiber bridging on the fatigue crack propaga-
                           tion.
                                 The paper has the following outline. First, the methods used to produce laminates
                           are described. Then the tests performed, namely fatigue mode I DCB and three-point
                           bending, as well as the data reduction methods applied are presented. Among those were
                           the Paris-relation, the modified Hartman-Schijve equation, the ‘zero-fiber bridging’ meth-
                           odology, and calculations of damage parameters. The results obtained are presented in
                           the Results and Discussion section. They include visual and microscopic analyses of the
                           laminates before and after testing, fatigue crack growth curves, and the evolution of dam-
                           age parameters throughout testing. Finally, the Summary, Conclusion, and Outlook sec-
                           tion summarizes the work done.

                           2. Materials and Methods
                           2.1. Materials and Laminate Manufacturing
                                The laminates were produced out of a continuous carbon fiber reinforced polyphe-
                           nylene sulfide (CF-PPS) tape with a width of 26.4 mm and a thickness of 0.14 mm. The
                           tape was placed on a flat tool using ATPisc, forming unidirectional laminates of 24 layers.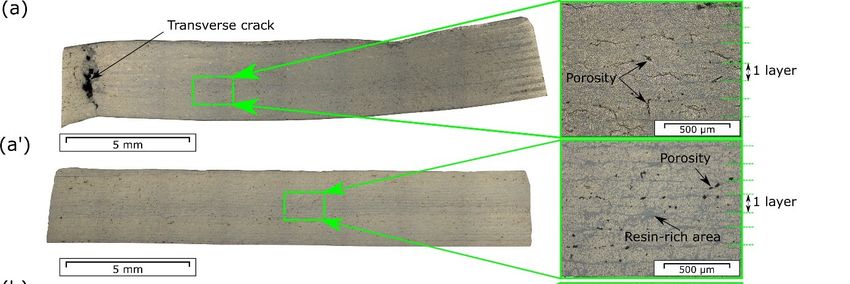
Materials 2021, 14, 1476                                                                                                    3 of 24

                                       The laminates were produced following two different manufacturing approaches,
                                 clamping and flipping (Figure 1). According to the first approach, the first four layers
                                 placed on the flat tool were clamped with a picture frame made out of aluminum profiles
                                 (Figure 1a). The remaining 20 layers were placed on each other within the frame. Accord-
                                 ing to the second approach, the laminates were flipped after placement of every four lay-
                                 ers until 24 layers were placed in total (Figure 1b). A polyimide insert film (from Ube
                                 Industries, Yamaguchi, Japan) with a thickness of 12.5 µm was placed in the mid-plane of
                                 every laminate to create a pre-crack for DCB testing. Thus, the clamping approach pro-
                                 vided a manufacturing process without interruptions, except one for placing the insert
                                 film. Whereas, six process interruptions were made during the flipping-manufacturing.
                                 In addition, two different manufacturing sets of tape placement speed and process tem-
                                 perature were applied − 5 m/min and 330 °C, and 10 m/min and 350 °C. The manufactur-
                                 ing protocols used are summarized in Table 1. With respect to the nomenclature of the
                                 tests, the letters ‘c’ and ‘f’ refer to the manufacturing methods, clamping and flipping. The
                                 first number after the letter refers to the tape placement speed, and the second number to
                                 the process temperature. For example, a panel produced at 10 m/min and at 350 °C fol-
                                 lowing the clamping approach is called c-10-350.

      Figure 1. Schematic drawing of (a) the clamping and (b) the flipping method. The insert film is marked in red, the frame
      is marked in green. The fiber direction is into the page.

                                 Table 1. Manufacturing parameters of unidirectional carbon fiber reinforced polyphenylene sul-
                                 fide (UD CF/PPS) panels produced by ATPisc.

                                                      Manufacturing                  Placement   Process Temper-
                                    Specimen ID                     Number of Plies
                                                         Method                     Speed, m/min     ature, °C
                                       c-5-330          clamping         24              5              330
                                      c-10-350          clamping         24              10             350
                                       f-5-330           flipping        24              5              330
                                      f-10-350           flipping        24              10             350

                                 2.2. Fatigue Mode I DCB Testing
                                      Rectangular DCB specimens with dimensions of 200 mm × 20 mm × 3.2 mm were cut
                                 out of the laminates using a waterjet cutting machine. Steel load-blocks were glued to all
                                 specimens using a two-component adhesive (Scotch-weld DP 490, 3M, Maplewood, MN,
                                 USA). Before gluing, the load-blocks and corresponding specimen surfaces were grinded
                                 with a sandpaper (grit size of 100) and then cleaned with isopropanol. The specimens with
                                 the load-blocks glued to them were placed in an oven for 2 h at 65 °C to cure the adhesive.
                                 In order to facilitate the visual detection of delamination onset, the side surface of the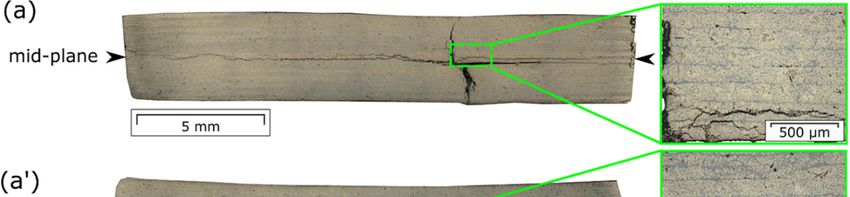
Materials 2021, 14, 1476                                                                                                      4 of 24

                                 specimens was covered with a thin layer of a white correction fluid. Fatigue tests were
                                 performed on an electro-dynamic test machine (type Instron E3000, from Instron, Nor-
                                 wood, MA, USA) equipped with a 250 N load cell. The test setup is shown in Figure 2.
                                 Three specimens per laminates were tested “as received” under standard laboratory con-
                                 ditions (23 °C air temperature, 50% relative humidity).

                           Figure 2. Test setup of the fatigue mode I double cantilever beam (DCB) testing.

                                         The tests were carried out according to a round robin test protocol developed by the
                                 European Structural Integrity Society (ESIS) [22–24]. Prior to fatigue loading, the speci-
                                 mens were loaded at 1 mm/min until the pre-crack propagated 1–5 mm beyond the tip of
                                 the insert film. The displacement value at which pre-cracking was stopped was taken as
                                 the         value for fatigue loading. The cyclic tests were performed at a frequency of 5 Hz
                                 and an        -ratio (     /      ) of 0.1 under displacement control until either a number of 106
                                 cycles or a crack growth rate of about 10−6 mm/cycle was reached. The mid-plane delami-
                                 nation was read during short stops at the mean displacement (                   ) using a travelling
                                 microscope. Maximum and minimum values of load and displacement (                        ,      and
                                       ,      ) were recorded by the test machine. The values were recorded every 10 cycles
                                 up to 1000, every 100 cycles up to 10,000, every 500 cycles up to 50,000, and every 1000
                                 cycles until the end of the test. Such cycle intervals were used to obtain more data points
                                 at the beginning of testing, when the most crack growth occurs under displacement con-
                                 trol.
                                         Additionally, a series of fatigue tests was performed on one DCB specimen of c-10-
                                 350 type as a preliminary attempt to check the applicability of the ‘zero-fiber bridging’
                                 methodology proposed for eliminating the effects of large-scale fiber bridging in fatigue
                                 mode I tests [13,21] to laminates with multiple cracking. According to this methodology,
                                 the specimen was first pre-cracked under quasi-static loading at a rate of 1 mm/min, yield-
                                 ing           for the following fatigue fracture loading with a       -ratio of 0.1. Upon reaching
                                 a crack growth rate of about 10−6 mm/cycle, fatigue fracture loading was terminated. After
                                 that, the specimen was quasi-statically loaded again to propagate the crack further, giving
                                 a new value of              for the next fatigue loading. In total, this procedure was repeated
                                 four times.

                                 2.3. Three-Point Bending
                                       Three-point bending testing was performed on pristine specimens and specimens af-
                                 ter fatigue mode I DCB testing to examine a possible change in flexural modulus      prior
                                 to and after testing. The tests were performed on a universal testing machine (type Zwick
                                 Z010 from Zwick GmbH & Co. KG, Ulm, Germany) equipped with a load cell of 10 kN.
                                 The tests were carried out in accordance with ASTM D 790 [25] and under standard labor-
                                 atory conditions on specimens without any conditioning. The span to thickness ratio of
                                 50:1 was chosen as large as possible for the specimen length of 200 mm. The loading and
                                 support noses had radii of 5 mm. The formulae for the loading rates and flexural modulus
                                 can be found in the test standard [25]. The pristine specimens refer to original DCB spec-
                                 imens of the same dimensions that were not tested yet. The specimens first tested under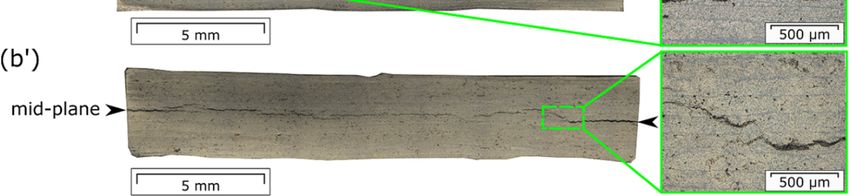
Materials 2021, 14, 1476                                                                                                5 of 24

                           fatigue loading were then cryo-fractured along the mid-plane, resulting in two individual
                           beams of the same thickness. These individual beams were used for three-point bending
                           tests.

                           2.4. Optical Analysis
                                Optical analysis of polished specimen cross-sections was performed before and after
                           fatigue loading in order to investigate damage. The micrographs were acquired using the
                           optical 3D measurement system (type Alicona InfiniteFocus from Alicona Imaging
                           GmbH, Raaba, Austria). The cutting schematic of the samples is illustrated in Figure 3.

                           Figure 3. Schematic illustrations of the samples extracted out of the DCB specimens for the micro-
                           scopic examinations: (a) Pristine specimens; (b) specimens after fatigue mode I DCB testing. The
                           view is on the top specimen surfaces. The green dashed lines refer to the final crack tip after fa-
                           tigue testing. The black dot-dashed lines refer to the samples cut out of the DCB specimens, with
                           the cross-section surfaces examined using the optical microscope marked in red. The figure is not
                           scaled.

                           2.5. Data Analysis Techniques
                           2.5.1. The Paris Relation and the Modified Hartman-Schijve Equation
                                The fatigue crack growth curves are presented using the classic Paris relation (Equa-
                           tion (1)) and the modified Hartman-Schijve equation [26] (Equation (2)). The latter was
                           applied to try to collapse the curves into the single ‘master’ curve [27].

                                                                          =   ∗           ,                                 (1)

                           where is the crack length,       is the number of cycles,     and are material parame-
                           ters,       is the strain energy release rate calculated with        and       .   corre-
                           sponds to the intersection of the linear region of the Paris-plot with Y-axis, and is its
                           slope. The crack growth rate     was calculated using the nine-point incremental polyno-
                           mial technique as described in ASTM E 647 [28].

                                                                      ⎡                           ⎤
                                                                      ⎢           −               ⎥
                                                                                              ,
                                                                 =    ⎢                           ⎥ ,                       (2)
                                                                      ⎢                           ⎥
                                                                      ⎢       1−                  ⎥
                                                                      ⎣               √           ⎦
                           where , are the constants of the power law, corresponds to the intersection of the
                           linear fit of the data with Y-axis, and describes its slope. The terms ,   and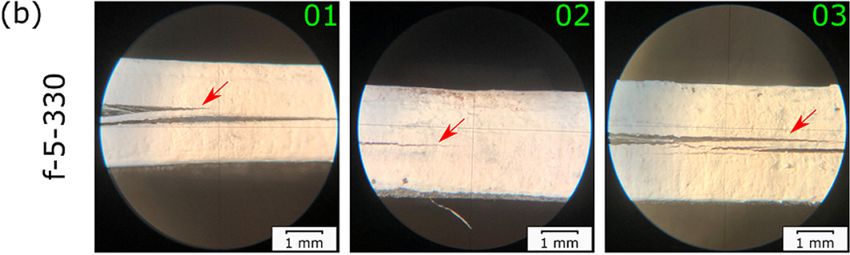
Materials 2021, 14, 1476                                                                                                6 of 24

                           are chosen so that the plot of Equation (2) becomes virtually linear [27].      has units of
                           per       and can be first estimated to be about of the critical quasi-static SERR, which can
                           be further refined in order to achieve the best linear fit [26].
                                It should be noted that some studies have used (∆         =          −        ) instead of
                                    in Equation (1) and in the numerator of Equation (2) [20,26,29–32]. However, in
                           the present work, several specimens have exhibited extremely low               around 0.35 N,
                           which could not be properly measured by the load cell of 250 N used. In order to be con-
                           sistent with data reduction for all laminates, only maximum values were used for all cal-
                           culations in order to avoid a usage of questionable minimum load values. Therefore,
                                     was used in both Equations (1) and (2). Such a form of equations has also been
                           used in [33–35].

                           2.5.2. Calculations of G
                                       was calculated according to either corrected beam theory (CBT) (Equation (3))
                           or effective crack length method (ECLM) (Equation (4)).
                                                                     3
                                                                 =
                                                                     2 ( + |∆|)

                                                                         3              3
                                                              =1−                   −                                      (3)
                                                                         10             2
                                                                                 9                          9
                                                          = 1−               −     1−                   −
                                                                                 8                          35

                                                                     3
                                                                 =                                                         (4)
                                                                         2
                                                                                                /
                                                                             =                      ,                      (5)

                           where ∆ is the crack length correction factor, is the specimen width,             is the large-
                           displacement correction,            is the load block correction,   is the distance between
                           the center of loading pin to the mid-plane of the half-beam of the DCB specimen,          is the
                           distance between the center of the loading pin to the edge of load block, ℎ is the thickness
                           of one beam, and       is the flexural modulus. For analysis of every fractured specimen, a
                           value of was taken to be equivalent to that obtained from a three-point bending test
                           performed on these specimen beams after fatigue testing.
                                The crack length correction factor ∆ was determined from ( /                ) / plotted
                           versus crack length as the absolute value of the intersection of the linear fit with the
                           negative X-axis (Equation (6)). ∆ was set to zero in case of a positive intercept [36]. Three
                           different definitions of were used, namely (i)           visually observed with a travelling
                           microscope during testing, (ii)          back-calculated from the machine compliance using
                           Equation (7), and (iii)        calculated using ECLM (Equation (5)). The compliance cali-
                           bration enables calculation of the crack length taking into account changing of the speci-
                           men compliance       automatically measured by the test machine [37]. While ECLM ena-
                           bles calculations of        using     and an independently measured flexural modulus ,
                           and accounts for the fracture process zone and associated crack tip effects [38].
                                                            ( /       )/ =     +
                                                                                                                           (6)
                                                                             ∆= −       ,

                           where    is the compliance,           is the load block correction, and               and   are pa-
                           rameters of the linear fit.
                                                                              =    ∗        ,                              (7)
Materials 2021, 14, 1476                                                                                                 7 of 24

                           where    is a constant and      is the exponent of the power law.
                               In addition, the effective flexural modulus       was calculated at each data point for
                           every specimen using Equation (8).
                                                                                8        ( + |∆|)
                                                                            =                                               (8)
                                                                                          ℎ

                           2.5.3. Damage Parameter φ
                                The degree of damage in the specimens was characterized using the damage param-
                           eter , which corresponds to the reduction factor of transverse and shear stiffness in
                           Equation (9) [19,39]. It has a value in a range between 0 and 1, where ‘0′ implies the total
                           loss of transverse and shear stiffness and ‘1′ the absence of damage. For = 1, ∆ takes
                           on a value of ∆        (Equation (11)).    was calculated using Equation (10) deduced from
                           Equation (9) for    = 0.3 [19,39].
                                                                    2
                                                    2
                                                                ∆           1        1                      1
                                                            =           =                 −2    + 0.24                      (9)
                                                                ℎ           10       12                     2

                                                            ∆                   1
                                                                            =             −2   + 0.24                      (10)
                                                                ℎ               10

                                                .
                                          =(                        1 + 1 + 7(            + 0.06)   ) for       = 0.3,     (11)
                                                        .

                           where      is the transverse modulus,         is the shear modulus, and   is the Poisson’s
                           ratio. The calculations of   were performed using the flexural modulus _         obtained
                           from three-point bending tests.      and        were determined using the Reuss model for
                           each laminate type (see the calculations in the Supplementary Information for details) [40].

                           3. Results and Discussion
                           3.1. Laminates After Manufacturing
                                 Figure 4 demonstrates clamping- and flipping-laminates manufactured. The lami-
                           nates produced by the clamping method exhibited a parabolic curvature after removing
                           the frame. This could be explained by thermal residual stresses, the accumulation of which
                           was caused by temperature gradients throughout the laminate thickness due to layer-wise
                           manufacturing [41,42]. The farther from the uppermost layer, which is subjected to the
                           laser heat, the temperature of the layers is lower [43,44]. This implies that the bottom lay-
                           ers, which have already solidified, constrain the shrinkage of the upper layers during their
                           cooling down. It should be noted that residual stresses have reached such a high level in
                           c-5-330, that transverse cracking of the laminate occurred (Figure 4d). This was not ob-
                           served for the c-10-350 laminate. The flipping method yielded flatter laminates compared
                           to the clamping method (Figure 4e, f). This could be attributed to a reduced heat build-up
                           within the laminate due to periodic process interruptions made to flip the laminate, so
                           residual stresses did not accumulate or accumulated to a much lesser extent. It is also
                           possible that the residual stresses accumulating during manufacturing within every four
                           layers could be balanced by residual stresses by the following laminate flipping and heat
                           and pressure application. The printing speed and the process temperature did not show
                           an observable impact on the laminate curvature of flipping-laminates.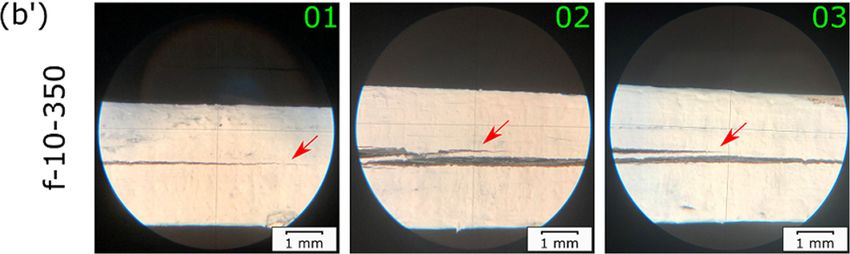
Materials 2021, 14, 1476 8 of 24
(a) (e)
(b) (f)
(c)
(d)
Figure 4. The laminates produced by the clamping method: (a) Fixed on the table, (b) top, and (c) side views after removing
the frame, and (d) a closer view on the crack due to residual stresses in c-5-330 and the flipping method: (e) Top and (f)
side views.
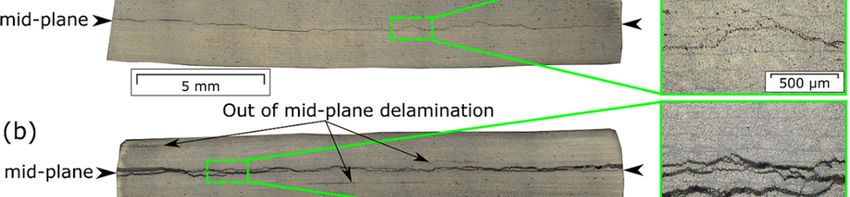
The micrographs of the laminate cross sections made prior to testing are shown in
Figure 5. Regions with high porosity concentration forming delaminations within indi-
vidual layers (Figure 5a) and also between the layers (Figure 5c) were found. Both resin-
rich and resin-poor regions were observed in the specimens (Figure 5c, d). Areas with
non-uniform fiber distribution and misalignment of the layers were also detected (Figure
5d). The optical analysis also revealed the presence of multiple interlayer delamination in
f-5-330, marked in red in Figure 5c. On the one hand, these delaminations could indicate
a poor level of interlayer bonding formed during laminate manufacturing. On the other
hand, they could also possibly be an artefact from cutting and preparing of the laminate
cross-sections, but, nevertheless, still reflecting weak interlayer bonding.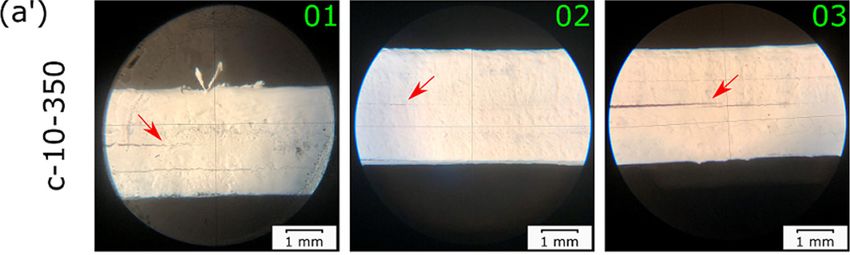
Materials 2021, 14, 1476                                                                                                         9 of 24

     (a)

     (b)

     (c)

     (d)

      Figure 5. Micrographs of the laminate cross sections made prior to testing for: (a) c-5-330-01; (b) c-10-350-02; (c) f-5-330-
      04; (d) f-10-350-05. The red ellipses point out the interlayer delaminations.

                                  3.2. Damage Processes during Fatigue Testing
                                       The delamination behavior visually observed in the specimens during fatigue frac-
                                  ture testing is shown in Figure 6. Two out of three specimens of each laminate type exhib-
                                  ited additional interlayer delamination growth parallel to the mid-plane. Among the spec-
                                  imens displaying a visually observable single mid-plane crack growth were c-5-330-02, c-
                                  10-350-02, f-5-330-02, and f-10-350-01. The microscopic analysis, performed on selected
                                  specimens, revealed the deviation of the crack from the mid-plane to the adjacent layers
                                  (Figure 7). Such a behavior could be caused by porosity entrapped inside the layers [45].
                                  The voids lead to the formation of the intralayer cracks, guiding the crack growth into the
                                  other layer and back to the main-plane. Moreover, thermal residual stresses accumulated
                                  during laminate manufacturing can be also responsible for the crack deviation [46]. A
                                  transverse cracking was found in c-5-330-01, which was a source for additional interlayer
                                  cracks (Figure 7a). The multiple interlayer delamination was observed in f-5-330-01, which
                                  was already present in not-tested specimens (Figure 7c, Figure 5c).
Materials 2021, 14, 1476                                                                                                         10 of 24

               (a)

               (b)

               (c)

              (d)

      Figure 6. Illustrative images of delamination growth in: (a) c-5-330; (b) c-10-350; (c) f-5-330; (d) f-10-350 tested under fa-
      tigue. Three specimens for every laminate are presented and sequentially numbered with 01, 02, and 03. The pictures were
      taken when the crack length reached about 40 mm. The red arrows point at the mid-plane delamination.
Materials 2021, 14, 1476 11 of 24
(a)
(b)
(c)
(d)
Figure 7. Micrographs of the polished cross sections of selected specimens after fatigue testing: (a) c-5-330-01; (b) c-10-350-
03; (c) f-5-330-01; (d) f-10-350-02. The black arrows point at the mid-plane delamination.
3.3. Three-Point Bending Tests
The results of three-point bending tests performed on pristine DCB specimens and
specimens after fatigue loading are presented in Table 2. The pristine specimens exhibited
fairly low deviations in the results obtained for every laminate type, indicating the con-
sistency of the specimens with each other. Although the specimens showed a varying ex-
tent of multiple cracking during fatigue tests, there was no significant difference in their
_ . The flexural moduli of the specimens after fatigue testing were also very close to
the values of the pristine specimens. All flexural moduli of pristine specimens exhibited a
standard deviation within 5% of the respective average. This can be interpreted as reason-
able, but not excellent, quality (high-quality CFRP can get down to about 2% scatter/stand-
ard deviation in modulus [47]. After fatigue testing, the highest scatter is found for the
350-type specimens (both f and c) rather than the c-5-330 type, whereas f-5-330 tends to be
higher (around 9%), but not as much as the 350-type specimens. The absence of a pro-
nounced change in the modulus values determined before and after fatigue testing could
indicate that most of the damage affecting the flexural modulus was already induced in
the laminates during their manufacturing (Figure 5). On the other hand, these findings
could also indicate that the three-point bending modulus is not sufficiently sensitive to
delaminations in the beam. Compression in the thickness direction and shear of the layers
with respect to each other may “close” some of the delaminations, making _ less sen-
sitive to existing damage.Materials 2021, 14, 1476 12 of 24
Table 2. The flexural moduli obtained from three-point bending tests performed on pristine DCB
specimens and on specimens after fatigue mode I DCB testing. The values presented were calcu-
lated as the arithmetic mean of four pristine specimens for c-5-330; of five pristine specimens for c-
10-350, f-5-330, and f-10-350; and of two specimens tested under fatigue for every laminate type.
_ , GPa
Laminate Pristine Specimens After Fatigue Mode I DCB Testing
c-5-330 111 ± 6 (6%) 109 ± 4 (3%)
c-10-350 96 ± 4 (4%) 109 ± 20 (18%)
f-5-330 104 ± 3 (3%) 90 ± 8 (9%)
f-10-350 112 ± 8 (7%) 100 ± 18 (18%)
3.4. Crack Length Correction Factor ∆ and Effective Flexural Modulus
Figure 8 shows the comparison of the cube root of the corrected compliance plotted
versus (i) visually measured during testing, (ii) calculated from the machine
compliance using Equation (7), and (iii) calculated using Equation (5). In order to
check the linearity of the data obtained, linear regressions were fitted to every dataset out
of five consecutive points. The results obtained are presented in Figure 9.
The slope-values of the linear regressions fitted to the visual data exhibited a pro-
nounced scatter, indicating deviation of ( / ) / plotted versus from linearity.
This can be attributed to the effect of additional damage processes on the main mid-plane
crack propagation. On the other hand, the deviation from linearity, or part of that, could
also be caused by erroneous crack length measurements made by the machine operator
using a travelling microscope [48]. In any case, this means that the length correction factor
∆ found using the visual data highly depends on the number of points fitted to the linear
regression. Interestingly, when the crack length reached about 39 and 48 mm in c-5-330-
01 and f-5-330-03, respectively, the compliance continued to increase with the following
cyclic loading without yielding a crack increment (Figure 8a, c). This likely implies that
although there was no visual crack increment, the specimen compliance increased due to
other damage processes occurring in the specimens. In contrast to the visual data, the lin-
ear regression slopes of the machine data, obtained for , gradually decreased with
the crack growth, or stayed nearly constant (Figure 9). Whereas the data, obtained for
, had a constant slope over the entire range of the crack length for every specimen,
due to the linear relationship between ( / ) / and as follows from Equation
(5).
In order to estimate the change in the effective flexural modulus throughout the
tests, ∆ was determined at the beginning and end of testing using the machine data ob-
tained for . To this end, linear regressions were fitted to the data range of the first
and last 2.5 mm of the crack increment, and also to the entire data range. The results of
obtained are summarized in Table 3. The results of ∆ can be found in Table S3 in the
Supplementary Information. For specimens with ∆ < 0, the absolute value of ∆ was
higher at the end than at the beginning of testing, indicating that the effective flexural
modulus was increasing with the crack growth. Their values of ∆ were in a range
between corresponding ∆ and ∆ . For the specimens with positive ∆, the effective
flexural modulus had a constant value throughout testing since for its calculation a zero
value of ∆ was used (Equation (8)). The effective flexural moduli of specimens with ∆ <
0 significantly exceeded their _ obtained using the three-point bending test (Table
2). High absolute values of the crack length correction factor ∆ lead to a rapid increase in
the values of the effective flexural modulus because the latter is a cubic function of the
crack length (Equation (8)).Materials 2021, 14, 1476 13 of 24
(a) (b)
(c) (d)
Figure 8. Plots of ( / ) / versus , where is either , , or for: (a) c-5-330; (b) c-10-350; (c) f-5-330; and
(d) f-10-350. The legend refers to every plot.
Table 3. calculated at the first and last 2.5 mm of the crack increment ( and ), and
at the entire range of the crack length ( ) for clamping- and flipping-laminates
tested under fatigue mode I loading.
Clamping
5-330 10-350
, , , , , ,
Specimen Specimen
GPa GPa GPa GPa GPa GPa
01 77 ± 1 77 ± 1 77 ± 1 01 179 ± 1 192 ± 1 186 ± 1
02* 639 ± 2 754 ± 2 697 ± 1 02 * 311 ± 1 353 ± 1 331 ± 1
03 197 ± 1 236 ± 1 215 ± 1 03 96 ± 1 96 ± 1 95 ± 1
Flipping
5-330 10-350
, , , , , ,
Specimen Specimen
GPa GPa GPa GPa GPa GPa
01 99 ± 1 104 ± 1 101 ± 1 01 * 202 ± 1 214 ± 1 208 ± 1
02 * 222 ± 1 250 ± 1 235 ± 1 02 70 ± 3 70 ± 3 70 ± 3
03 330 ± 1 377 ± 2 352 ± 1 03 75 ± 2 75 ± 2 75 ± 2
* A single mid-plane delamination was observed visually on the specimen surface during testing.Materials 2021, 14, 1476 14 of 24
(a) (b)
(c) (d)
Figure 9. The values of the slopes of linear regressions fitted to datasets of five consecutive points for: (a) c-5-330; (b) c-10-
350; (c) f-5-330; and (d) f-10-350. 01-03 numbers refer to serial numbers of the specimens. The legend applies to every plot.
3.5. Damage Parameter
The degree of damage was estimated using the damage parameter that was cal-
culated using ∆ , ∆ , and ∆ obtained in the previous paragraph (Equation
(11)). The results of are summarized in Table 4. The results of are presented in Table
S4 in the Supplementary Information. In order for to be in a range between 0 and 1, |∆|
should be greater than |∆ | estimated to be about 3.7 mm (Equation (10)). Addition-
ally, it was derived from Equation (9) that smaller than 5.23 yields unphysical values
of higher than 1. This corresponds to steep slopes of ( / ) / plotted versus crack
length , where the intercept of the linear regression is at a positive crack length value.
For specimens with in a range between 0 and 1, was slightly greater
than , indicating the absence of a progressive damage accumulation in them. It is also
interesting to note that the specimens that exhibited a single mid-plane delamination vis-
ually observed on the side specimen surface, namely c-5-330-02, c-10-350-02, f-5-330-02,
and f-10-350-01, had damage parameters smaller than those obtained for the specimens
with multiple cracking (Figure 6). This finding highlight that the mid-plane delamination
was not a sole damage process occurring in specimens during fatigue loading. With re-
gard to the results of the microscopic analysis of the selected specimens’ cross-sections
after fatigue testing, only one of them showed in a range between 0 and 1, namely f-5-
330-01 (Figure 7d, Table 4).Materials 2021, 14, 1476 15 of 24
Table 4. calculated using ∆ , ∆ , and ∆ for clamping- and flipping-specimens
tested under fatigue mode I loading.
Clamping
5-330 10-350
Specimen Specimen
01 426.171 ** 426.171 ** 426.171 ** 01 0.112 0.088 0.097
02 * 0.018 0.014 0.016 02 * 0.066 0.049 0.056
03 0.038 0.026 0.031 03 391.190 ** 391.190 ** 391.190 **
Flipping
5-330 10-350
Specimen Specimen
01 * 0.175 0.143 0.158 01 * 0.279 0.200 0.233
02 0.074 0.051 0.061 02 417.974 ** 417.974 ** 417.974 **
03 0.044 0.031 0.037 03 432.337 ** 432.337 ** 432.337 **
* A single mid-plane delamination was observed visually on the specimen surface during test-
ing; ** unphysical values of greater than 1.
3.6. Fatigue Crack Resistance Curves: The Paris Relation Based Approach
In the first step of the fatigue data evaluation, the Paris relation (Equation (1)) was
used to present the fatigue delamination resistance using the classic Paris-type plots,
where / was plotted versus . was calculated using either CBT with
(Equation (3)) or ECLM with (Equation (4)). The Paris-like plots obtained are
shown in Figure 10.
It can be seen that the position of the plots along the X-axis varied from specimen to
specimen within every laminate set, leading to variations of threshold values _
(Table 5). The smallest standard deviation among the machine data was shown by c-10-
350 specimens, in which the lowest extent of damage was visually observed on their side
surfaces during testing compared to the other specimens (Figure 6b). Importantly, the ma-
chine data calculated with exhibited a larger scatter than the effective data calcu-
lated with . More precisely, the highest standard deviation among the machine data
reached 30% for c-5-330, while the highest standard deviation among the effective data
was 16% for f-5-330. The values of standard deviations are given for _ , which
means that the standard deviation for _ is twice as large. Thus, the effective crack
length data with a lower scatter was used for further analysis.
The scatter in the fatigue fracture data of UD carbon fiber reinforced composites is
well-known from literature, and was discussed in detail in [49]. The authors have differ-
entiated between intrinsic and extrinsic scatter. With regard to the present work, the for-
mer comes from the process induced material morphology of the laminates including, e.g.,
voids, interlayer delaminations, fiber misalignment, and other defects observed in the
laminate micrographs (Figure 5). The extrinsic scatter could be caused by possible defi-
ciencies in the test set-up, erroneous crack length measurements by the machine operator,
and variations in the specimen geometries. The scatter of fatigue fracture data for lami-
nates with multiple delaminatons has also been pointed out by Pascoe et al. [15]. In nu-
merous works, e.g., Mujtaba et al. [29], Jones et al. [33], Yao et al. [27], the authors have
shown that a fatigue data set with a large scatter can be collapsed into a single linear ‘mas-
ter’ curve, using the modified Hartman-Schijve equation [20] to present the fatigue data.
Therefore, it was decided to apply the Hartman-Schijve based approach in the present
research, too.Materials 2021, 14, 1476 16 of 24
(a) (b)
(c) (d)
Figure 10. Paris-type plots of / plotted versus calculated using CBT with (Equation (3)) and ECLM
with (Equation (4)) for: (a) c-5-330; (b) c-10-350; (c) f-5-330; and (d) f-10-350. The black and red arrows along the X-
axis refer to _ of the data calculated using and , respectively. Black, red, and blue lines refer to linear
regressions fitted to the effective data.
Table 5. Quasi-static initiation value of the crack growth and _ of the Paris-type
plots showed in Figure 10.
_ , Using _ , Using
Laminate ,
c-5-330 80.4 ± 64.8 (81%) 10.3 ± 3.1 (30%) 11.4 ± 1.4 (12%)
c-10-350 205.4 ± 40.7 (20%) 14.8 ± 2.1 (14%) 16.1 ± 1.4 (8%)
366.9 ± 401.1
f-5-330 15.4 ± 3.9 (25%) 17.2 ± 2.7 (16%)
(109%)
f-10-350 195.4 ± 58.6 (30%) 16.7 ± 3.2 (19%) 16.4 ± 1.2 (7%)
3.7. Fatigue Crack Resistance Curves: The Hartman-Schijve (H-S) Based Approach
The modified H-S equation includes two parameters and , that should
be defined for every fatigue data set. According to Jones et al. [20], these parameters are
(cite) “perhaps best viewed as parameters that are used to ensure that the entire range ofMaterials 2021, 14, 1476 17 of 24
data fits the equation”. Further, Jones et al. [26] write that / should be plotted ver-
sus ( − , )/ 1 − on a logarithmic scale, taking parameter
√
(cite) “to be the quasi-static value of the fracture energy, , or any reasonable first esti-
mate”. Jones et al. [33] further noted that corresponds to the quasi-static initiation value
of the crack growth, . Thereby, equivalent to was used in the H-S based ap-
proach, for example, in [26,27,32]. However, Yao et al. [27] have reported -values that
significantly exceeded the corresponding . In the present study, two different ap-
proaches were applied to use the modified H-S equation to present the fatigue crack
growth curves.
According to the first approach, both parameters and , were varied for
every individual test data set in a way that a linear regression fitted to this data reaches
the highest R2-correlation value. In the second approach, was kept constant and
, was varied to achieve the highest value of R 2-correlation of the linear fit. The
appropriate parameters were configured automatically by means of a script written in
Python. From the formula (Equation (2)), , must be smaller than the smallest
value of from a dataset, so that the right-hand member of the equation is positive,
while √ must be greater than this value, so that the radicand of the square root is posi-
tive. Thus, in the first approach, was continuously increased from a value a bit higher
than with an increment step of 50 / . In the second approach, a value of 950
/ was used for , which was reported in [11] as a reference value for UD CF/PPS
laminates produced by ATPisc. could not be taken to be equivalent to actual val-
ues obtained from the quasi-static pre-cracking, because they were smaller than the small-
est value of for nearly all specimens (Table 5). For every , , was con-
tinuously increased from a value of 1 / with an increment step of 0.05 / till the
highest value of . Following this procedure, the highest R2- correlation of the linear
fits were determined. The results obtained are summarized in Table 6. Figure 11 illustrates
the crack growth rate / plotted versus the right-hand component of the modified
H-S equation with and , from Table 6.
Following the first approach, the highest values of R2-correlation of linear regressions
were achieved with -values significantly higher than (Table 6), which can no longer
have a physical meaning. Only of about 690 / obtained for specimens f-10-350-01
and -02 were in a comparable range with . Remarkably, the second approach where
was kept constant as 950 / , which seems to be a reasonable value for the initiation
value of the crack growth in UD CF/PPS laminates, yielded the results of , close
to those from the first approach. At the same time, the difference in their values of R2-
correlation was observed only in the third digit after the decimal point. In addition, the
second approach yielded a better agreement of the fatigue crack growth curves of flip-
ping-laminates compared to the first approach (Figure 11). There was no such significant
difference observed between the curves of clamping-laminates. These findings highlight
the second approach using a constant value of of 950 / to make overall sense in
the application to the laminates investigated.
3.8. Zero-Fiber Bridging Approach
The crack growth curves of fatigue fracture loadings sequentially performed on a
single DCB specimen of c-10-350 type are shown in Figure 12. In this figure, / is
plotted versus , where refers to either measured visually with the micro-
scope during testing (Figure 12a), calculated using Equation (7) (Figure 12b), or
calculated using Equation (5) (Figure 12c).
According to the ‘zero-fiber bridging’ methodology [21], the fatigue delamination
curves shift to the right along the X-axis of the H-S plot when sequential, quasi-static pre-
cracking is performed after a given number of fatigue cycles, yielding one mode I H-S-
curve length and developing fiber bridging between the specimen beams. The momentMaterials 2021, 14, 1476 18 of 24
when these curves no longer shift to the right, but overlap, corresponds to the fully devel-
oped or at least stationary fiber bridging state, i.e., fiber bridging saturation or equilibrium
between creation and failure of bridging fibers during delamination propagation.
Table 6. and , which yield the highest -correlation of the linear fits of the fatigue
data using the modified Hartman-Schijve equation where ( was varied// was kept constant).
Specimen , / , , / -Correlation
c-5-330-01 5322//950 9.8//10.5 0.9852//0.9845
c-5-330-02 5135//950 4.1//5.1 0.9700//0.9698
c-5-330-03 5183//950 7.7//8.0 0.9854//0.9849
Average ± st.dev. 7.2 ± 2.9 (40%)//7.9 ± 2.7 (34%)
c-10-350-01 5606//950 12.5//14.8 0.9815//0.9792
c-10-350-02 5381//950 11.9//12.4 0.9894//0.9888
c-10-350-03 5694//950 11.6//14.3 0.9904//0.9863
Average ± st.dev. 12.0 ± 0.5 (4%)//13.8 ± 1.3 (9%)
f-5-330-01 5861//950 10.8//17.9 0.9907//0.9707
f-5-330-02 5408//950 10.9//11.8 0.9728//0.9719
f-5-330-03 5655//950 13.6//16.2 0.9791//0.9779
Average ± st.dev. 11.8 ± 1.6 (14%)//15.3 ± 3.1 (21%)
f-10-350-01 652//950 13.8//13.2 0.9713//0.9709
f-10-350-02 731//950 16.4//15.9 0.9683//0.9663
f-10-350-03 5677//950 11.9//14.8 0.9825//0.9766
Average ± st.dev. 14.1 ± 2.2 (16%)//14.6 ± 1.4 (9%)
(a) (b)
(c) (d)
Figure 11. Fatigue crack growth resistance curves obtained using the modified Hartman-Schijve equation, where the pa-
rameter was either varied (a,b) or kept constant (c,d) for every specimen of clamping- (a,c) and flipping- (b,d) laminates.Materials 2021, 14, 1476 19 of 24
Red and blue lines refer to linear regressions fitted to the data of laminates produced with 5 m/min and 330 °C and to
those produced with 10 m/min and 350 °C, respectively.
In the data determined from visually measured delamination lengths, the shift to the
right was observed for the second fatigue loading with respect to the first fatigue loading
(Figure 12a). This is in agreement with the ‘zero-fiber bridging’ methodology. However,
the curve of the third fatigue loading appeared to the left of the second curve. The fourth
curve of the last fatigue loading performed nearly overlapped with the third curve, indi-
cating an apparent saturation state. Whether this is really the case requires further quasi-
static pre-cracking followed by cyclic fatigue fracture steps. The unexpected shift to the
left of the 3rd curve could possibly be caused by a failure of a larger fiber bundle or a more
massive “laminate ply bridge” connecting the two specimen beams. After such a break-
age, the crack would propagate faster due to a lesser retarding effect of fiber bridging,
which would lead to a reduction of . Thereby, two competing mechanisms can be
distinguished, i.e., a consistent increase of the typical fiber bridging until a saturation or
steady state is reached versus the discrete formation and stochastic failure of “large” fiber
or laminate ply bridges. In addition, interlayer delaminations developing during testing
influence the bending moments of the specimen beams, which in turn affects the specimen
stiffness and the strain energy release rate. Therefore, the “zero-fiber bridging” method-
ology may not work in case of a discontinuous development of fiber bridging (or of more
massive bridging of the main delamination, e.g., caused by multiple cracks) that results in
stochastic bridge-breaks and hence does not continuously evolve into a steady-state.
Interestingly, the shift to the left of the 3rd and 4th curves was not so pronounced for
the data of (Figure 12b). Whereas for the effective data of , the 2nd, 3rd, and 4th
curves overlapped at their upper parts and even exhibited a shift to the right comparing
their middle parts (Figure 12c). These findings indicate that the mid-plane crack propaga-
tion was significantly influenced by multiple cracking. On the other hand, they could also
suggest that, at least to some extent, the visual measurement of the crack length yielded
incorrect values during testing. The crack length measurements performed visually using
a travelling microscope proved to be very challenging in the case of such a complex crack
propagation behavior combined with the sequential series of quasi-static and fatigue load-
ings.Materials 2021, 14, 1476 20 of 24
(a) (b)
(c)
Figure 12. Fatigue crack growth curves of a sequential series of fatigue loadings performed on one DCB specimen (c-10-
350) for: (a) measured visually with the microscope; (b) calculated using Equation (2); (c) calculated using
Equation (3).
The next steps of the “zero-fiber bridging” methodology were performed on the fa-
tigue crack growth curves with (Figure 12c), since they showed the most similar be-
havior to that described in this methodology [21]. Firstly, the data points of every curve
were translated to an arbitrary value of / of 10−7 m/cycle using Equation (12)
(Figure 13). After that, average values ,
of the data translated were calcu-
lated for every curve.
log √ , = log − log + log √ , (12)
where / = 10−7 m/cycle, is the power index in the Paris equation (Equation (1)).
Figure 13b shows a plot of ,
versus the corresponding crack length,
which is described with a non-linear relationship. Alderliesten et al. [21] note that this
relationship can be described with a second order polynomial function of ( − ), which
reaches a horizontal asymptote at the moment of full development of fiber bridging or a
steady state. Further, the regression analysis was performed using Equation (13) as de-
scribed in the methodology. Finally, the zero-fiber bridging curve ( − = 0) was ob-
tained then using Equation (14) and presented in Figure 13a. , deduced from
this curve is about 13.9 / , which is in good agreement with the Hartman-Schijve re-
sults for c-10-350 (Table 6).Materials 2021, 14, 1476 21 of 24
log = + ( − )+ log + ( − ) + log , (13)
where are constants obtained through regression, = [0,4].
log = + log + log (14)
(a) (b)
Figure 13. The “zero-fiber bridging” analysis: (a) The data translated to an arbitrary value of / = 10−7 m/cycle for
every curve (unfilled symbols) and the final zero-bridging curve (pink rhombs); (b) the average values of the translated
data versus the crack length.
It is important to note that the zero-bridging curve was obtained for a single speci-
men in the present study. Thus, without data from several specimens this curve does not
represent the intrinsic scatter coming from material and manufacturing protocols used.
Hence, it can be less conservative than the upper-bound curves obtained from using val-
ues of , minus either two or three standard deviations of the mean data de-
scribed by Jones et al. [33]. However, the single specimen analysis indicates that the zero-
fiber bridging procedure works in principle even for DCB specimens with fiber bridging
and multiple delaminations.
4. Summary, Conclusions and Outlook
The present study deals with unidirectional CF/PPS laminates produced by auto-
mated tape placement with in-situ consolidation (ATPisc) combining two different lami-
nate build-up procedures (labelled “clamping” and “flipping”) with two tape placement
speed/control temperature settings (5 m/min and 330 °C versus 10 m/min and 350 °C, ba-
sically “low” and “high”, respectively) resulting in four different laminate types. All lam-
inates exhibited multiple interlayer cracking during mode I quasi-static and fatigue frac-
ture testing.
Since there are no established methods for quantifying mode I fatigue delamination
resistance when multiple delaminations initiate and propagate, selected approaches that
had proven useful in quantifying multiple delaminations for quasi-static mode I loading
[50] were adapted and applied to cyclic fatigue fracture and compared. The cube root of
the specimen compliance plotted versus the visually observed delamination length usu-
ally yields a roughly straight line, the extrapolation of which provides a delamination
length correction for root rotation in the quasi-static tests [36]. This line for the Mode I
fatigue fracture tests discussed here, however, was not straight, but curved with clearly
different slopes at the beginning and at the end. This finding indicates a decreasing, back-Materials 2021, 14, 1476 22 of 24
calculated flexural modulus of the DCB half beams during the test points at the presence
of additional damage processes occurring outside main mid-plane delamination. Three-
point bending tests performed on these half beams looking for changes in flexural modu-
lus turned out to not be sensitive enough. Therefore, in order to quantify the degree of
damage in each specimen, a damage parameter , developed from the analysis of quasi-
static Mode I fracture tests [19] was determined. The comparison of at the beginning
and at the end of testing enabled a better understanding of the damage development and
a quantitative comparison for the tested specimens. The fatigue delamination propagation
data was then graphically presented as Paris [23,24] and a modified Hartman-Schijve re-
lation [26]. The modified Hartman-Schijve equation was shown to be suitable for the
quantitative representation of fatigue crack growth for laminates with multiple delamina-
tions.
Bridging tractions between multiple delaminations propagating in different ply lev-
els involving large fiber bundles, fully or partly still embedded in the matrix, are beyond
the resistance effects from large-scale fiber bridging between the two fracture surfaces of
a single interlaminar delamination. Hence, a recently proposed methodology for elimi-
nating large-scale fiber bridging effects in Mode I fatigue fracture tests with single mid-
plane delaminations [21] was applied to one specimen with multiple cracking for the first
time. The result indicated that this method also has potential to deal with more massive
Mode I bridging in CFRP laminates.
Clearly, more data have to be generated and analyzed, before a conclusive recom-
mendation on the applicability and potential limitations of the proposed methodologies
can be made. The approach presented here, nevertheless, provides a promising road-map
for exploring and developing quantitative mode I fatigue fracture characterization of UD
carbon fiber reinforced laminates exhibiting multiple cracking. Future research shall also
test more specimens from a range of different laminates with thermoplastics and thermo-
set matrices in order to obtain scatter bands and upper-bound curves required for safe
design limits as outlined by Jones et al. [33].
Supplementary Materials: The following are available online at www.mdpi.com/1996-
1944/14/6/1476/s1, Table S1: The transverse and shear moduli calculated for the laminates, Table S2:
Fiber weight and volume fractions of the laminates obtained using TGA, Table S3: ∆ calculated at
the first and last 2.5 mm of the crack length (∆ and ∆ ) and at the entire range of the crack
length (∆ ) for clamping- and flipping-specimens tested under fatigue mode I DCB
loading, Table S4: calculated using ∆ , ∆ and ∆ for clamping- and flipping-
specimens tested under fatigue mode I DCB loading.
Author Contributions: Conceptualization, A.K., A.J.B., G.P., M.W.; methodology, A.K., A.J.B., G.P.,
M.W.; software, G.P., A.K.; validation, A.K.; investigation, A.K., visualization, A.K.; resources, G.P.;
data curation, M.W., A.J.B., G.P.; writing—original draft preparation, A.K.; writing—review and
editing, M.W., A.J.B., G.P.; supervision, M.W., G.P.; project administration, M.W.; funding acquisi-
tion, M.W. All authors have read and agreed to the published version of the manuscript.
Funding: The research work was performed within the COMET project VI-2.06, ‘New strategies
towards laser assisted manufacturing of fibre reinforced thermoplastic composites,’ at the Polymer
Competence Center Leoben GmbH (PCCL, Austria) within the framework of the COMET program
of the Federal Ministry for Transport, Innovation and Technology and the Federal Ministry of Sci-
ence, Research and Economy with contributions by Technical University of Munich (Institute for
Carbon Composites), Montanuniversitaet Leoben (Institute of Material Science and Testing of Pol-
ymers), AFPT and Cevotec. The PCCL is funded by the Austrian Government and the State Gov-
ernments of Styria, Lower Austria and Upper Austria.
Institutional Review Board Statement: Not applicable.
Informed Consent Statement: Not applicable.
Data Availability Statement: Data is contained within the article or supplementary material.
Acknowledgments: Special thanks go to Thomas Wettemann for the laminate manufacturing, Se-
bastian Maar and Franz Grassegger for their assistance with the specimen preparations.Materials 2021, 14, 1476 23 of 24
Conflicts of Interest: The authors declare no conflict of interest. The funders had no role in the
design of the study; in the collection, analyses, or interpretation of data; in the writing of the manu-
script, or in the decision to publish the results.
References
1. Abrate, S.; Walton, D. Machining of composite materials. Part I: Traditional methods. Compos. Manuf. 1992, 3, 75–83,
doi:10.1016/0956-7143(92)90119-f.
2. Liao, K.; Schultheisz, C.R.; Hunston, D.L.; Brinson, L.C. Long-term durability of fiber-reinforced polymer-matrix composite
materials for infrastructure applications: A review. J. Adv. Mater. Covina 1998, 3–40.
3. Offringa, A.R. Thermoplastic composites—rapid processing applications. Compos. Part A: Appl. Sci. Manuf. 1996, 27, 329–336,
doi:10.1016/1359-835x(95)00048-7.
4. Costa, A.P.; Botelho, E.C.; Costa, M.L.; Narita, N.E.; Tarpani, J.R. A review of welding technologies for thermoplastic com-
posites in aerospace applications. J. Aerosp. Technol. Manag. 2012, 4, 255–265.
5. Campbell, F. Structural Composite Materials; ASM International, 2010;.
6. Grouve, W.; Warnet, L.; Rietman, B.; Visser, H.; Akkerman, R. Optimization of the tape placement process parameters for car-
bon–PPS composites. Compos. Part A: Appl. Sci. Manuf. 2013, 50, 44–53, doi:10.1016/j.compositesa.2013.03.003.
7. Ray, D.; Comer, A.J.; Lyons, J.G.; Obande, W.; Jones, D.J.; Higgins, R.M.O.; McCarthy, M.A. Fracture toughness of carbon fi-
ber/polyether ether ketone composites manufactured by autoclave and laser-assisted automated tape placement. J. Appl. Polym.
Sci. 2014, 132, 132,,, doi:10.1002/app.41643.
8. Modi, D.; Comer, A.; O’Higgins, R.M.O.; McCarthy, M.A. Thermoplastic composites: In-situ consolidation or in-situ welding.
In Proceedings of the 19th International Conference on Composite Materials (ICCM 19), Montreal, QC, Canada, 28 July–2 Au-
gust, 2013.
9. Qureshi, Z.; Swait, T.; Scaife, R.J.; El-Dessouky, H. In situ consolidation of thermoplastic prepreg tape using automated tape
placement technology: Potential and possibilities. Compos. Part B: Eng. 2014, 66, 255–267, doi:10.1016/j.compositesb.2014.05.025.
10. Bandaru, A.K.; Clancy, G.J.; Peeters, D.; O’Higgins, R.; Weaver, P.M. Interface Characterization of Thermoplastic Skin-Stiffener
Composite Manufactured using Laser-Assisted Tape Placement. In Proceedings of the 2018 AIAA/ASCE/AHS/ASC Structures,
Structural Dynamics, and Materials Conference; American Institute of Aeronautics and Astronautics, 2018; p. 481.
11. Sacchetti, F.; Grouve, W.J.; Warnet, L.L.; Villegas, I.F. Effect of cooling rate on the interlaminar fracture toughness of unidirec-
tional Carbon/PPS laminates. Eng. Fract. Mech. 2018, 203, 126–136, doi:10.1016/j.engfracmech.2018.02.022.
12. Sørensen, B.F.; Gamstedt, E.K.; Østergaard, R.C.; Goutianos, S. Micromechanical model of cross-over fibre bridging – Prediction
of mixed mode bridging laws. Mech. Mater. 2008, 40, 220–234, doi:10.1016/j.mechmat.2007.07.007.
13. Yao, L.; Alderliesten, R.; Benedictus, R. The effect of fibre bridging on the Paris relation for mode I fatigue delamination growth
in composites. Compos. Struct. 2016, 140, 125–135, doi:10.1016/j.compstruct.2015.12.027.
14. Goutianos, S.; Sørensen, B.F. Fracture resistance enhancement of layered structures by multiple cracks. Eng. Fract. Mech. 2016,
151, 92–108, doi:10.1016/j.engfracmech.2015.10.036.
15. Pascoe, J.; Rans, C.; Benedictus, R. Characterizing fatigue delamination growth behaviour using specimens with multiple de-
laminations: The effect of unequal delamination lengths. Eng. Fract. Mech. 2013, 109, 150–160, doi:10.1016/j.engfrac-
mech.2013.05.015.
16. Funari, M.F.; Lonetti, P. Initiation and evolution of debonding phenomena in layered structures. Theor. Appl. Fract. Mech. 2017,
92, 133–145, doi:10.1016/j.tafmec.2017.05.030.
17. Alfano, G.; Crisfield, M.A. Finite element interface models for the delamination analysis of laminated composites: mechanical
and computational issues. Int. J. Numer. Methods Eng. 2001, 50, 1701–1736, doi:10.1002/nme.93.
18. Mulian, G.; Rabinovitch, O. Debonding dynamics in FRP plated beams: high order cohesive FE formulation and parametric
sensitivity. Int. J. Fract. 2015, 195, 53–78, doi:10.1007/s10704-015-0048-8.
19. Brunner, A.; Blackman, B.; Williams, J. Calculating a damage parameter and bridging stress from GIC delamination tests on
fibre composites. Compos. Sci. Technol. 2006, 66, 785–795, doi:10.1016/j.compscitech.2004.12.040.
20. Jones, R.; Pitt, S.; Bunner, A.; Hui, D. Application of the Hartman–Schijve equation to represent Mode I and Mode II fatigue
delamination growth in composites. Compos. Struct. 2012, 94, 1343–1351, doi:10.1016/j.compstruct.2011.11.030.
21. Alderliesten, R. Fatigue delamination of composite materials – approach to exclude large scale fibre bridging. IOP Conf. Series:
Mater. Sci. Eng. 2018, 388, 012002, doi:10.1088/1757-899x/388/1/012002.
22. Brunner, A.J.; Stelzer, S.; Pinter, G. Determination of Mode I Fatigue Delamination Propagation in Unidirectionally Reinforced
Materials (Version 2, 2009): Test Protocol by ESIS Technical Committee 4 on Fracture of Polymers, Composites and Adhesives,
Mon-tanuniversitaet Leoben, Leoben, Austria, p. 1- 14.
23. Stelzer, S.; Pinter, G.; Wolfahrt, M.; Brunner, A.J.; Noistnernig, J. Cyclic Interlaminar Crack Growth in Unidirectional and
Braided Composites. In Proceedings of the 5th International Conference on Fatigue of Composites, ICFC5, Eds. W.-X. Yao, J.
Renard, N. Himmel, 2010.
24. Stelzer, S.; Pinter, G.; Brunner, A.J. Comparison of Quasi-static and Cyclic Fatigue Delamination Resistance of Carbon Fiber
Reinforced Polymer-matrix Laminates under Different Mode Loading. Procedia Mater. Sci. 2014, 3, 1087–1092,
doi:10.1016/j.mspro.2014.06.177.You can also read