Rating States, Grading Schools - What Parents and Experts say States Should Consider to Make School Accountability Systems Meaningful
←
→
Page content transcription
If your browser does not render page correctly, please read the page content below

Rating States,
Grading Schools
What Parents and Experts say States Should Consider
to Make School Accountability Systems Meaningful

                                           AUGUST 2014
TABLE OF CONTENTS
  Executive Summary                           |   1                         Authors:
                                                                            Marga Mikulecky
           Introduction                       |   2                          ECS Policy Analyst

Section I: Researchers                        |   6                         Kathy Christie
                                                                             ECS Vice President, Knowledge/Information
   Section II: Parents                        |   9                          Management & Dissemination
   Section III: Experts                       |   14                         QUESTIONS? Contact kchristie@ecs.org

             Conclusion                       |   22                        Designer:
                                                                            Kym Bloom
              Appendix                        |   23                         ECS Print and Web Designer

              Endnotes                        |   24

© 2014 by Education Commission of the States (ECS). All rights reserved.
  ECS is the only nationwide, nonpartisan, interstate compact devoted to education.
Citation: Marga Mikulecky and Kathy Christie, Rating States, Grading Schools: What Parents and Experts
say States Should Consider to Make School Accountability Systems Meaningful (Denver, CO: Education
Commission of the States, May 2014).
This paper is available online at: www.ecs.org/docs/rating-states,grading-schools.pdf.

Note: American Samoa, Guam, Puerto Rico and the U.S. Virgin Islands are included in the ECS school
accountability database, but their numbers are not included in this paper.

PAGE 2 | RATING STATES, GRADING SCHOOLS: WHAT PARENTS AND EXPERTS SAY STATES SHOULD CONSIDER TO MAKE SCHOOL ACCOUNTABILITY SYSTEMS MEANINGFUL
EXECUTIVE SUMMARY
P
arents and policymakers have long sought to measure the quality of their public schools and to
report that publicly in ways that are fair and equitable. In recent years, with a renewed focus on
student outcomes, this effort has become a very public and sometimes acrimonious debate.
With this project, ECS sought to answer three key questions from various stakeholders in a way that
assists parents and policymakers in creating school accountability systems or “report cards” that are
transparent and effective.
The key questions we asked:
Of researchers – Are the report cards easy to find?
Of parents – Are the report cards easy to understand?
Of experts – What indicators are essential for measuring school and district performance?
The responses, in brief:
Researchers agreed upon eight state report cards as easy-to-find, informative and readable. Their top
three picks are in bold:
Arizona Delaware Massachusetts
Illinois Kentucky Maine
Ohio Louisiana
Parents identified six state report cards as the best of the 50 states, based on ease of reading, providing
sufficient data and overall usefulness. Their top three picks are in bold:
Delaware Arkansas
District of Columbia Ohio
Illinois Wisconsin
Experts selected five indicators they see as essential for any state’s school accountability system:
Student achievement
Student academic growth
Achievement gap closure
Graduation rates
Postsecondary and career readiness
The co-authors of this report then reviewed ECS’ 50-state accountability database, released in January,
and identified 14 states that are both including all five essential indicators in calculating their state school
reports and publicly reporting all five indicators. Those 14 states:
California Nevada Pennsylvania
Colorado New Mexico Tennessee
Florida North Carolina Utah
Kentucky Ohio (final element coming in 2015) Wisconsin
Louisiana Oklahoma
Interestingly, different states excelled in different aspects considered in this project. At ECS, we believe
states can improve their education systems by learning from each other. We hope this report assists in
those continuing efforts.
EDUCATION COMMISSION OF THE STATES | PAGE 1
Introduction
S
tate leaders are striving to increase This report includes input from three different
transparency about how well their public groups in an attempt to help state policymakers
schools are educating children. The result is create accessible, useful and effective school report
an increase in the information about schools’ cards.
challenges and successes being shared with their The key questions and responding groups:
communities through annual reports, often in the
form of “report cards.” This wave of accountability 1. Are the report cards easy to find?
makes it important — now more than ever — to Experienced researchers at the Education
analyze which measures best signal the quality Commission of the States (ECS) were asked
of schools and how that information is effectively to find selected state report cards online to
shared and used to improve performance. determine the accessibility of the cards.
Transparency is important but, unlike in years 2. Are they understandable to parents?
past, it is not itself the end goal. Ultimately, today’s More than a dozen parents were asked
accountability systems are designed to hold schools to rate the report cards on a 1-5 scale in
responsible for their contribution to students’ the categories of “easy to read,” “provides
postsecondary success and to equip parents with sufficient data” and “useful.”
the information they need to insist upon change
3. What are best practices?
if they don’t believe their children are being well-
Finally, a dozen experts convened to discuss
served. Valid metrics are necessary if policymakers
the essential metrics for any accountability
are to implement meaningful school ranking
system, key considerations for policymakers
systems and, subsequently, school improvement
and important decision points.
plans that parents and others can trust.
Accountability Efforts: A National Evolution
State school accountability systems, and their goals, have evolved over the years:
Accountability 1.0 (1900–80) – Accreditation: Initially based on inputs such as staff degrees
and numbers of library books, this version evolves in the 1980s into a focus on performance.
Accountability 2.0 (1990–2001) – Standards-Based Accountability: State lawmakers set
academic standards and begin state testing, sometimes with rewards and/or sanctions.
Florida launches the first state school report cards, grading schools from A to F.
Accountability 3.0 (2001–10) – No Child Left Behind: Federal lawmakers mandate state testing
and outline incentives and consequences with an unprecedented level of detail. Parents in
some states receive report cards with two sets of ratings, state and federal.
Accountability 4.0 (2010–present) – Race to the Top: With the renewal of NCLB stalled in
Congress, President Obama entices states to implement reforms, such as linking student test
scores to teacher evaluations, with Race to the Top grants.
Accountability 5.0 (2013–present) – Standards, Round 2: States adopting standards such as
the Common Core are figuring out new assessments and tweaking accountability systems to
measure and report results.
PAGE 2 | RATING STATES, GRADING SCHOOLS: WHAT PARENTS AND EXPERTS SAY STATES SHOULD CONSIDER TO MAKE SCHOOL ACCOUNTABILITY SYSTEMS MEANINGFUL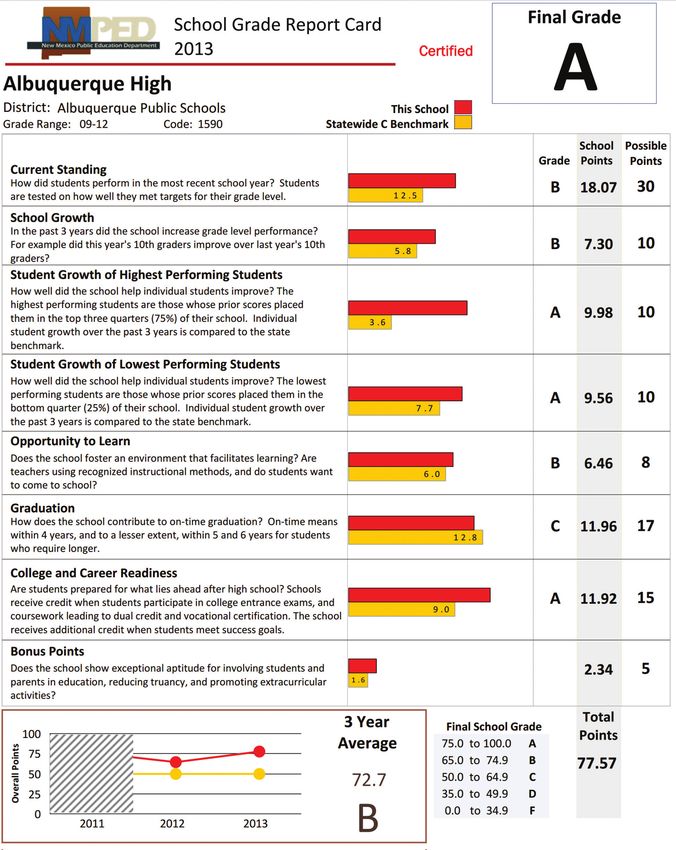
Door plates to D’s: Common indicators of today’s report cards
States have long sought to publicly report school                  for good schools and red for struggling schools,
quality but the measures used to determine quality                 or various descriptors, such as a “continuous
look much different today than they did 100 years                  improvement” or “reward” school.
ago. As early as 1897, the state of Minnesota                      Researchers at the Education Commission of the
enacted a law requiring schools to meet certain                    States compiled a 50-state database of what’s
minimum requirements to receive state aid. In                      measured and reported by each state. What’s
1907, Illinois began awarding door plates to schools               measured and what’s reported are not necessarily
it deemed “superior.” And by 1925, 30 state                        identical. States may measure various data and
departments of education were publicly reporting                   use that information in calculating a final letter
on factors such as the number of teachers with                     grade, index score, color or descriptor. But not
academic and professional qualifications and the                   all data collected by all states is factored into
frequency of community meetings.1                                  such calculations; some states simply report out
Today, every state annually publishes individual                   additional information for the public to see.
district and school report cards to provide a                      As part of this report, ECS convened a School
snapshot of how well that district and school is                   Accountability Advisory Group to discuss which
educating its students. The metrics used vary but                  measures should be included in every state’s
the focus has clearly shifted from inputs, such                    accountability system. The members, listed in the
as the number of library books in a school, to                     appendix, identified five essential indications. The
outcomes, such as student academic growth on                       indicators, and the states currently measuring and
state exams. Door plates have given way to report                  reporting those indicators according to the ECS
card rating systems including A-F grades, 1 to 5                   accountability database, are shown below.
stars, numerical index scores, colors such as green

States and the five essential indicators for school accountability
   Data from ECS’ 50-state database on school accountability systems show which states are using the indicators:

              Indicator Used for
                                                     No. of States Measuring                 No. of States Reporting
             School Accountability
             Student achievement                      50 + Washington, D.C.                           50 + D.C.
          Student academic growth                              42 + D.C.                              34 + D.C.
          Achievement gap closure                              36 + D.C.                              39 + D.C.
               Graduation rates                                50 + D.C.                              50 + D.C.
              Postsecondary and                     20 (explicit mention; 25 if               13 (30 + D.C. if count
               career readiness                    count proxies for readiness)               proxies for readiness)
        Source: Education Commission of the States, http://www.ecs.org/html/educationissues/accountability/stacc_intro.asp.2

What’s the difference between what’s measured and what’s reported?
What’s measured refers to data that states use in calculating their school performance ratings. What’s reported
refers to data that states make publicly available but do not necessarily include in those calculations. Twenty-three
states include all five essential indicators in measuring school performance: Alabama (2015-16), Alaska, California,
Colorado, Florida, Hawaii, Indiana, Kentucky, Louisiana, Minnesota, Nevada, New Mexico, North Carolina, Ohio,
Oklahoma, Pennsylvania, South Carolina, Tennessee, Texas, Utah, Virginia, Wisconsin and Wyoming.

What is meant by postsecondary and career readiness indicators or their proxies?
Some states explicitly refer in their accountability laws to postsecondary and career readiness indicators while
others use indicators that serve to suggest such readiness, including college-going rates and ACT/SAT results.

                                                                                             EDUCATION COMMISSION OF THE STATES | PAGE 3
Communication and trust: Two factors that matter, but aren’t rated
ECS’ review of school accountability systems found calculations used by states to reach a school’s final
grade or rating are rarely simple, often relying on algebraic equations and other mathematical formulas.
While this may be necessary to ensure numerous indicators are represented and to create the most
accurate ratings, such formulas can be difficult to communicate clearly to the public.
Teachers, parents and communities like to have a basic understanding about how a school’s grade was
derived. Weights and proportions matter. States can measure carefully selected indicators of quality but
if the indicators are weighted incorrectly — at least, according to some observers — the result can be a
grade or rating that some members of the public see as inaccurate and, worse, intentionally so.
Trust is an issue. This is not surprising since the results of school ratings can range from accolades to
staff firings to closures. Letter grades are easiest for parents and other constituents to understand. But if
a clear rating sits atop a hill of measures that communities don’t trust, questions are likely to follow.
Where does it go wrong? Here are some common complaints:
T
he metrics aren’t right. For example, too much emphasis is placed on test performance and/or
too few subjects are tested.
The metrics, weights, measures and formula do not accurately reflect school performance.
Composite scores are seen as less transparent and nuanced than separate indicators.
Communication about how the grades are determined is vague or inconsistent.
Even a rocket scientist can’t figure out the formula.
The metrics, weights, formula and report card do not reflect public values.
Creating a robust, valid and easy-to-understand report card is harder than it sounds. State legislatures
and departments of education have worked years to create such report cards — only to be rewarded with
a cacophony of criticism from their constituents. The rest of this paper is divided into three sections —
researchers, parents and experts — that seek to help state policymakers get it right.
It’s complicated:
Attempting to overcome “composition bias”
An issue with nearly every performance indicator is composition bias. Simply stated, this refers to
the correlation between a school’s student demographics and its performance levels. Attempts to
resolve this concern have resulted in greater attention to academic growth, rather than absolute
performance levels, and a number of more complicated accountability systems.
For example, states may use regression analysis, a statistical process for estimating the relationships
among variables, to determine the weight to give poverty. Or a state may use value-added modeling,
charting student progress over time, in an attempt to determine teaching contributions to student
growth. While these techniques may be used to improve accuracy, they can be difficult to easily
explain in communications about accountability systems.
PAGE 4 | RATING STATES, GRADING SCHOOLS: WHAT PARENTS AND EXPERTS SAY STATES SHOULD CONSIDER TO MAKE SCHOOL ACCOUNTABILITY SYSTEMS MEANINGFUL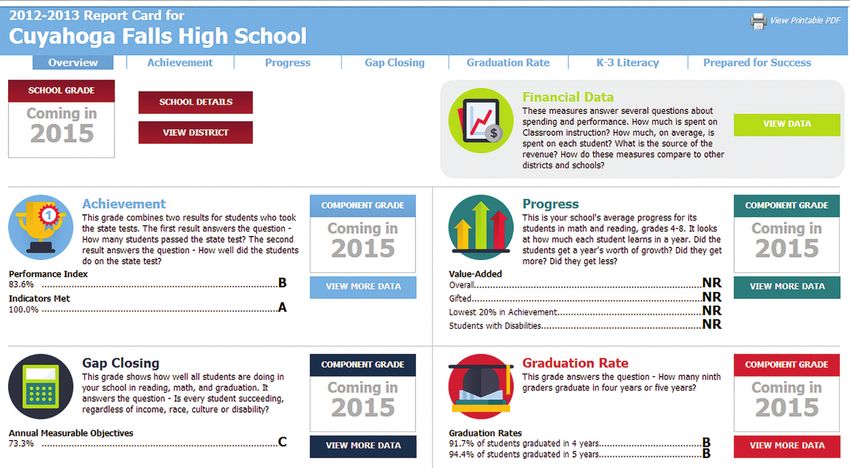
What’s the secret formula? It has to be understandable!
      Examples of easy-to-understand state report card formulas include Louisiana,
               one of the top states selected by researchers and experts.

Source: http://www.louisianaschools.net/docs/test-results/8-19-13-report-card-infographic.pdf?sfvrsn=6

                                                                           EDUCATION COMMISSION OF THE STATES | PAGE 5
Section I: Researchers
Are the report cards easy to find?
Researchers with the Education Commission of                              in the following categories: Findable, Readable,
the States were assigned to find state report cards                       Understandable and Graphics. For the latter
online in an effort to see how easy the cards are to                      category, the question was “Were graphics used
locate. They were given the name of a particular                          well to convey the information?” Even those
school in a particular state and asked to find its                        experienced in online research had difficulty: “I
most recent report card. One goal was to ascertain                        wasn’t able to find school-level report cards,”
the level of computer skill required to find the state-                   lamented one while another noted, “Could not find
issued cards. In many cases, private school-rating                        using a Google search – lots of confounding search
websites such as GreatSchools.org, city-data.com                          results.” They identified eight report cards as
or 50Can.org came up first in computer searches,                          above average in all categories: Arizona, Delaware,
while serious diligence and technical understanding                       Illinois, Kentucky, Louisiana, Massachusetts,
were needed to find the state-sponsored reports.                          Maine and Ohio. Of those, they agreed Arizona,
The three researchers were asked to rate each                             Illinois and Ohio had overall the best easy-to-find,
report card from 1 (unsatisfactory) to 3 (excellent)                      informative and readable report cards.

                      Researchers’ ratings: “These states do it best!”
                                                                ARIZONA
Summary: This report card received excellent ratings in nearly all categories. It was particularly noted
for being easy to find and to understand, though the PDF version of the card was not rated as highly.
               “The simple format is very reader-friendly. All the essential information is present
             and easy to process ... The graphics are well-done and convey information at a glance.”

PAGE 6 | RATING STATES, GRADING SCHOOLS: WHAT PARENTS AND EXPERTS SAY STATES SHOULD CONSIDER TO MAKE SCHOOL ACCOUNTABILITY SYSTEMS MEANINGFUL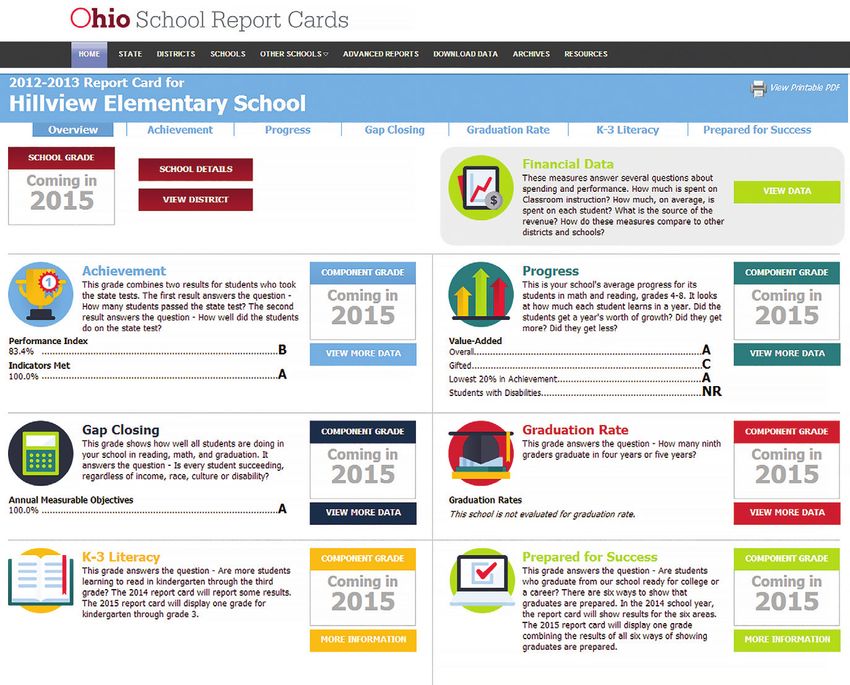
ILLINOIS
Summary: Given top marks in most categories, this report card was particularly noted for being easy to
understand and for its use of graphics. Also praised: Links allowing readers to “drill down” to learn more.
     “I really like the overview on the first page with the snapshot and basic graphs. It made the basic
    information very easy to understand and to digest. I also liked how the graphics were interactive.”

                                                    OHIO
Summary: Another report card with nearly perfect scores, Ohio’s effort was lauded for its graphics and
for being easy to read and understand. One concern: Several data points are labeled “Coming in 2015.”
                   “Very well-designed and easy to understand. The graphics are outstanding.
     I really like the little ‘gauge’ graphics.” The different data points are explained well and concisely.”

                                                                               EDUCATION COMMISSION OF THE STATES | PAGE 7
Researcher Review “Likes”
                                           IS THE REPORT CARD EASY TO FIND?
           “It was relatively easy to find (after minimal digging) and I like that you can download the report.”
                        “The school-specific information did not come up through an Internet search,
                            but found relatively easily through the state education department.”

                                           IS THE REPORT CARD EASY TO READ?
      “The report card was very good. Easy to read. Not too much information shown, but links to more detailed
                                        information were easily accessible.”
                                      “I also liked that information was available in Spanish.”

                                    IS THE REPORT CARD EASY TO UNDERSTAND?
                    “I like that there’s a two-page snapshot as well as the more detailed online version.
                               Information was broken down into tabs, which I think is helpful.”
    “Nice balance of data and narrative explanation. ‘For Parents’ and ‘for Educators’ are GREAT features to see.”
                          DOES THE USE OF GRAPHICS HELP CONVEY INFORMATION?
                       “The graph titles also provide additional information by hovering over the text.”
                       “I really like the overview on the first page with the snapshot and basic graphs.
                               It made the basic information very easy to understand and digest.
             I also liked how the graphics were interactive and allow users to click through for more details.”

                                         Researcher Review “Dislikes”
                                           IS THE REPORT CARD EASY TO FIND?
   “When I searched for report cards on the Department of Education site, the first link it brought up was broken.
                   It took me nine minutes to get to the accountability reporting system page.”
“Found right away with a Google search, but the website doesn’t work right with Firefox. Worked fine with MS Explorer.”

                                           IS THE REPORT CARD EASY TO READ?
     “This report card was clearly not designed with parents in mind. It looks like it’s just to meet state/or federal
             reporting requirements. There’s no explanation of the contents and no total score or rating.”
                                “I don’t think the format (requires lots of clicks) is user-friendly.”

                                    IS THE REPORT CARD EASY TO UNDERSTAND?
“Oddly, the school’s A-F grade doesn’t appear on the report. You have to go to the Excel spreadsheet to get the A-F
   grade. There’s information on the web page about how the grades are calculated, but you have to be willing
                                  to click and read several different documents.”
  “I see that the school got a four-star rating, but I don’t see any content around that. Four out of what? Five? Ten?”

                          DOES THE USE OF GRAPHICS HELP CONVEY INFORMATION?
      “There are a bunch of nice charts and graphs, but you have to click on each thing separately to see them.”
                “Nearly unreadable. It was very difficult to understand what was being tracked or scored.”

PAGE 8 | RATING STATES, GRADING SCHOOLS: WHAT PARENTS AND EXPERTS SAY STATES SHOULD CONSIDER TO MAKE SCHOOL ACCOUNTABILITY SYSTEMS MEANINGFUL
Section II: Parents
Do the report cards contain useful information?
To determine how useful the report cards actually Overall, the parents favored report cards with clear
are to parents, ECS asked parents from across graphics that made the data easy to understand.
the country to follow a link to an individual school They also liked when additional information was
report card from each of the 50 states. The 14 available if a viewer wanted to drill down. However,
parents were selected by ECS staff and represent there was not always consistent agreement. On
a mix of educational attainment, ethnicity, income the same high school report card, for example, one
levels and geography, both in terms of urban/rural parent labeled the report card as unacceptable in
and in terms of U.S. states. Their children range in each category while another parent labeled the
age from kindergarten to high school. report card as excellent in all categories.
Each of the parents reviewed report cards from all Report cards from Illinois and the District of
50 states and rated them from 1 (unacceptable) Columbia were identified as favorites by a majority
to 5 (excellent) in the categories of “easy to of parents, or eight of the 14. They were closely
read,” “provides sufficient data” and “useful.” ECS followed by Delaware (chosen by six parents) and
selected for review a mix of elementary, middle then Arkansas, Ohio and Wisconsin (each selected
and high schools that were moderately diverse in by five parents).
student population and that received ratings in the
moderate to upper range.3
Parents speak: “These states got it right!”
DISTRICT OF COLUMBIA
Summary: Parents raved about the “very clear” presentation of information and features such as the
ability to compare schools and the option to ask for more data via a readily available email form.
“Wow!! This is one of my favorites. The ability to ‘explore’ the data is really nice. No other school we
looked at had this feature,” said one parent while another noted, “I wanted to read it more.”
EDUCATION COMMISSION OF THE STATES | PAGE 9ILLINOIS
Summary: Parents applauded this site for being easy for navigate, noting its clear directions and
‘appealing’ graphics. They liked the ability to compare schools and to convert information to Excel.
“Fabulous graphics on Fast Facts front page. Also, terrific tech use of ‘scan QR code’ on the At-A-
Glance report,” said one parent while another noted “The whole website is really easy to interpret.”
DELAWARE
Summary: Parents were enthusiastic about the inclusion of more staff data than other states and the
ability to drill down from tabs labeled School, Student and Staff. A common refrain: “User friendly.”
“Loved this one – especially the school, teachers, students tabs to help sort out data!” said one parent
while another commented, “Nice front-page summary, easy to drill down for more data.”
PAGE 10 | RATING STATES, GRADING SCHOOLS: WHAT PARENTS AND EXPERTS SAY STATES SHOULD CONSIDER TO MAKE SCHOOL ACCOUNTABILITY SYSTEMS MEANINGFULA Clear Winner: Illinois
Illinois was the only state whose school report cards, found
easily at: www.illinoisreportcard.com, were selected in the
top three by both researchers and parents.
The interactive site is rich with graphics, pop-up explanations
and links to at-a-glance reports, videos and additional
resources. Indicators are typically accompanied by tabs
labeled “Explanation of Display,” “Context” and “Resources.”
An example is the display regarding student academic
growth, a concept that can be tough to explain. Illinois uses
a short video to explain the concept, describes how growth
fits into the overall performance picture and links to a
Frequently Asked Questions document prepared by the state.
Additional comments from parents:
“Easily accessible.”
“Easy to navigate.”
“Provided directions as to how to navigate the
page and was not overwhelming with data.”
“Had links to compare the school to district & state.”
“Very informative.”
Additional comments from researchers:
“Very good. Easy to read. Not too much information
shown, but links to more detailed information were
easily accessible.”
“THE BEST SO FAR. Easy to interpret, everything is
clickable for more information.”
EDUCATION COMMISSION OF THE STATES | PAGE 11Parent Review “Likes”
IS THE REPORT CARD EASY TO READ?
“I like that the data is presented in both table and bar graph format.
Four-color bar graph easy to decipher at a glance.”
“Everything is on one page. You can get additional information from just one click on the graph and
the breakdown of data pops up. The information is very clearly presented.”
“Tabs across top make navigation quick.”
DOES THE REPORT CARD PROVIDE SUFFICIENT DATA?
“As a parent, I could find information that would be important to me when making decisions about schools.
I felt like I got an understanding of the school without going there from what is on this site.”
“I could learn about more than just data about the schools from this site.”
“Very thorough – WOW! Could be a bit much to some but I’m sure most parents
would love more information than less.”
IS THE REPORT CARD USEFUL?
“Additional information such as school safety, graduation rates, etc., help to paint a whole picture of this school.”
“Great summary/comparison to the state – demonstrating this school outperforms state average.”
“Postsecondary and workforce readiness category is nice to know.”
Parent Review “Dislikes”
IS THE REPORT CARD EASY TO READ?
“This report made the user have to use dropdown boxes and select what you wanted to see.
Not easy to compare everything like charts and spreadsheets/graphs.”
“They use words that are not meaningful to the general public (Cell Count, etc.).”
“+/- I really liked this report card although it is not supported for tablet or smartphone.”
DOES THE REPORT CARD PROVIDE SUFFICIENT DATA?
“So much emphasis on enrollment in the past 10 years, but not much information on performance or assessment.”
“Not much reference or explanation of the ‘B’ grade in the upper right-hand corner. Amount of data insufficient.”
“No growth comparisons from years past. Data is very limited.”
IS THE REPORT CARD USEFUL?
“Extremely boring and data in tables not clearly labeled or explained.”
“Nice summary, but very little info. Would not be good if you were moving to area and wanted more school info.
Where is the rest of the data?”
“Like reading a corporate financial report of 20 pages to get information.
Lot of data that is scattered and not formatted to be easily understood.”
PAGE 12 | RATING STATES, GRADING SCHOOLS: WHAT PARENTS AND EXPERTS SAY STATES SHOULD CONSIDER TO MAKE SCHOOL ACCOUNTABILITY SYSTEMS MEANINGFULAn important consideration
Overall, parent reactions to the report cards broke down into a fairly even distribution — a third of the
cards rose to the top, a third sank to the bottom and a third landed somewhere in the middle. Individual
reactions to some state’s accountability reports, however, were widely disparate. A sampling of those
opinions is presented here to further illustrate how difficult it can be to create public reporting systems
that please everyone:
One card, different responses: A matter of preference
While many of the scores reported by the parent panel were in the same range, there were definite
differences of opinion.
ALASKA VERMONT
PRO – “Performance index was easy to read and PRO – “You have a lot of control in
provides a good feel for each school’s building the type of reports you
performance” and “Good data, easy to read!” want to view. If you know exactly
CON – “ One 96-page document with one page for what you are looking for, this is a
each school in Alaska. Rates three subjects useful website.”
and just gives percent proficient, not levels CON – “ Vague, would like to see a grade
or what percentages were in previous in the district – A, B, C.”
years. No demographic or teacher data
included. ... What is a good score?”
EDUCATION COMMISSION OF THE STATES | PAGE 13Section III: Experts
Essential metrics states should use to measure school success
Because of the complexities involved with selecting Or, if a state such as Massachusetts wants to
school measures that accurately and reliably signal focus on a P-20 system, measures should signal
the quality and health of schools, ECS convened a success throughout that system. That might
panel of 12 experts in December 2013 to look at mean inclusion of a pre-K indicator. Creating a
what states measure and what they should report common goal for the state encourages public
regarding the quality and health of their schools.4 buy-in and a cohesive message.
The robust discussion covered the maturation When choosing the indicators or metrics to
of state accountability and report card efforts, measure school performance, experts say it is
and the pitfalls facing states when the measures important to link the causes, interventions and
become political liabilities. The experts pinpointed reliable outcomes that will lead to achieving the
essential metrics, caveats, key considerations and overall goal or “North Star.”
important policymaker decision points.
2. Beware unintended consequences
The ECS School Accountability Advisory Group
grappled with many questions, including: Prior to delving into essential indicators for
states, the experts’ panel discussed over-arching
Is more information necessarily better? concerns about accountability. A major theme
D
o metrics and formulas accurately was that states and districts must be careful
measure which schools are doing well? in how they hold schools accountable and how
W
hat level of data is necessary? the information is reported to the public. That’s
Student-level or cohort-level? because what is measured and reported has the
possibility of driving bad behaviors.
Is there an absolute level on an indicator
below which no school should operate? For example, grading a school based on the
number of expulsions may have the unintended
D
o you weigh progress toward a goal or
consequence of encouraging teachers and
an absolute measure?
administrators to be more lenient on behavioral
S
ince you cannot account for everything, infractions.
what are the best metrics for examining
3. Ensure state systems can handle the data
the health of a school or system?
Because the most accurate accountability
H
ow do you ensure growth toward a goal
systems typically require a reliable student-level
is recognized while not losing focus on
data system, the experts noted policymakers
reaching the goal?
must consider the capacity of their state
longitudinal data system and staff when choosing
Key Findings: metrics. Many state data systems were initially
created to track school-level accountability
1. Set a clear goal or “North Star” data and weren’t designed to capture student-
The expert group noted that states need a clear level data in a secure and shareable manner.
goal or “North Star” of what they are trying to Portability of data across schools, districts and
accomplish with renewed school improvement platforms is critical for understanding the growth
efforts. students are making, but existing state data
For example, Kentucky lists its “College or career systems may not be up to the task.
ready for all” goal with their formula and on the
state landing page for its school report cards.
PAGE 14 | RATING STATES, GRADING SCHOOLS: WHAT PARENTS AND EXPERTS SAY STATES SHOULD CONSIDER TO MAKE SCHOOL ACCOUNTABILITY SYSTEMS MEANINGFULFive essential indicators every state should measure and report
While the experts encouraged additional metrics based on individual state and district issues, they
recommended every state report card include these indicators:
Student achievement
Student academic growth
Achievement gap closure
Graduation rates
College and career readiness
For each indicator, the experts examined the various metrics used, advantages, caveats and key state
decision points. Detailed findings for each indicator are listed on the following pages.5
ECS Experts’ Advice
to Policymakers
Identify and publicize your state’s
“North Star.”
R
e-engage people in your
schools. Good communication is
vital to ensuring the data and
accountability story is easily
understood by everyone.
C
hoose your indicators and metrics
carefully. Know how to use an
indicator — make it less about
grading and shaming and more
about what research says works
and how to address problems.
B
e realistic about the limits of
your data system. Highly mobile
students may create special
challenges in tracking proficiency
and growth data.
C
onsider the potential unintended
consequences of what’s being
measured, rewarded or punished.
EDUCATION COMMISSION OF THE STATES | PAGE 15Making the Grade: States Meeting the Five Essential Indicators
The experts convened by ECS did not focus on how to find state report cards or, once found, how to
navigate them. Their charge was different: Identify the essential metrics for any accountability system.
So it may not be surprising that there is little cross-over between the top states picked by parents and
researchers and those states identified as measuring and reporting on the five essential indicators.
The 14 states identified as meeting the experts’ criteria are California, Colorado, Florida, Kentucky, Louisiana,
Nevada, New Mexico, North Dakota, Ohio, Oklahoma, Pennsylvania, Tennessee, Utah and Wisconsin.
This example of a New Mexico state report card for Albuquerque High School illustrates the use of the
five essential indicators:
ESSENTIAL
INDICATORS
1 STUDENT
ACHIEVEMENT
2
STUDENT
ACADEMIC
GROWTH
3 ACHIEVEMENT
GAP CLOSURE
4 GRADUATION
RATES
5
POSTSECONDARY
AND CAREER
READINESS
Source: http://webapp2.ped.state.nm.us/SchoolData/docs/1213/SchoolGrading/001_590_ALBUQUERQUE_PUBLIC_
SCHOOLS_ALBUQUERQUE_HIGH_SchoolGrading_2013.pdf
PAGE 16 | RATING STATES, GRADING SCHOOLS: WHAT PARENTS AND EXPERTS SAY STATES SHOULD CONSIDER TO MAKE SCHOOL ACCOUNTABILITY SYSTEMS MEANINGFULEssential Indicator #1: Student Achievement
Every state gives students standards-based assessments and reports those results to schools and
parents. States choose the subjects to be tested and set the cut scores necessary for students to show
proficiency. Reporting overall or absolute levels of student achievement typically indicates the number or
percentage of a school’s students who are deemed to be performing proficiently in particular subjects.
Many states have defined proficient as achieving grade-level expectations.
But many students come to schools with significant disadvantages. Some states, such as Tennessee,
seek to accommodate for such disadvantages with statistical models. These models attempt to reduce
the likelihood that schools serving large numbers of disadvantaged students will have their performance
designation affected by conditions over which they have little control.
Including absolute levels of student achievement as an indicator in an accountability system is typically
seen as an advantage for schools serving more affluent populations. To balance that concern, many
states include changes in school achievement levels over time in their ratings formulas and some include
student academic growth measures. In addition, a number of states have created comparisons among
schools of similar demographics. California, for example, ranks its schools statewide and compares each
school to another 100 schools with similar rates of poverty, parent education and other indicators.
Factors for Questions for
policymakers to consider: policymakers to consider:
C
ritics believe a focus on test scores may W
hich subjects will be tested and in which
create a “high-stakes” environment for grades?
students, teachers and administrators. D
o the tests fully align to the standards and
C
ommunities may have a hard time rallying do they meet college- and career-ready
behind the tests without alignment between expectations?
the tests, grade levels and learning H
ow are the cut scores for the assessments
requirements. determined? Who makes those decisions and
S
etting the cut scores for proficiency on the how often will the cut scores be re-examined?
tests is not a perfect science. W
ill the results for groups of students, such as
If tests change, school accountability English language learners, minorities or low-
systems should too. When moving to a new income students, be explicitly reported as part
assessment, states should carefully align of the accountability system? Will these results
the old and new tests to validate that the factor in a school’s final ranking or grade?
standards are being met. D
oes the accountability system consider trend
data, such as the past two or three years, or is
it based on one year’s results?
W
ill end-of-course exams or other
assessments, such as college entrance tests
including the ACT or SAT, be included in the
school and district rating system?
EDUCATION COMMISSION OF THE STATES | PAGE 17Essential Indicator #2: Student Academic Growth
A small but increasing number of states are refining their accountability systems to measure and
reward student academic growth. Based on a review of students’ test score gains from previous grades,
researchers can predict the amount of growth those students are likely to make in a given year and then
compare to actual performance. This differs from changes in school-level performance over time because
actual individual student performance is tracked, even as students move in and out of schools.
This prediction can help determine whether a student is making expected progress in a particular subject.
Measuring student academic growth is one way of analyzing test data to measure teaching and learning.
It’s often referred to as “value-added” or looking to see whether a teacher has added value to a student’s
body of knowledge.
In addition, measuring student academic growth and using past growth to predict future results can
be used as part of “catch up” or “keep up” indicators. The “catch up” indicator examines the progress
of lower-performing students who need to catch up to the performance of their peers. The “keep up”
indicator looks at the growth of the highest-performing students, who may stagnate if growth isn’t
recognized as a priority.
Measuring and reporting student academic growth is generally seen as a way of resolving concerns about
composition bias and of recognizing schools and districts that are working hard, even if their results fall
short of absolute performance goals.
Factors for Questions for
policymakers to consider: policymakers to consider:
“ Growth” is often perceived as being too confusing W
ill growth be measured against
— people may not understand it because the an absolute proficiency standard or
underlying statistical calculations are complex and against “peer” schools with similar
not easily replicated by non-statisticians. demographics?
C
ommunication strategies for explaining growth H
ow can growth calculations keep from
are critically important. It is possible to keep the working against or accommodate for
explanations simple, even if the methodology is high-performing schools with less room
complex. for growth? Does your state rating
B
ecause simple growth models depend largely formula ensure that achievement
on the formula determining individual student growth within the highest-performing
growth, it is possible to game the system and quartile also matters?
make the data look better than it actually is. W
ill student academic growth be
Calculations should address students who switch considered in evaluating teacher
schools midyear, those who start or finish a performance? If so, does the system
course outside of the normal academic calendar, used for determining growth align with
who have missing data or those who are far below what’s needed to measure teacher
or above grade level for their cohort. performance?
A
ttempting to control for student demographics
may increase the precision of results in models
that don’t use all available prior achievement data,
but it might have the effect of implying there are
different standards for different students.
PAGE 18 | RATING STATES, GRADING SCHOOLS: WHAT PARENTS AND EXPERTS SAY STATES SHOULD CONSIDER TO MAKE SCHOOL ACCOUNTABILITY SYSTEMS MEANINGFULEssential Indicator #3: Achievement Gap Closure
Gaps in achievement separating groups of students by income and ethnicity have been the focus of
numerous studies, policy innovation and public concern for many years. Researchers have identified
a variety of factors that appear related to these achievement gaps, including family income, parent
education levels, access to high-quality preschool, peer influences, curricular and instructional quality,
and teacher expectations.
Many states have chosen to focus on these particular achievement gaps as a means of ensuring
progress — or a lack thereof — is highlighted. Equally as important, however, are indicators that focus
on achievement gaps such as those between English language learners and native English speakers,
students performing in the lowest quartile versus those performing better, male students and female
students, and so on. In short, the intent of reporting and/or measuring achievement gaps should be to
ensure that all students are being served.
It’s also important to consider the size of the groupings used in this analysis. For example, the
performance of all boys versus all girls in a school may not be useful. But a further breakdown by
academic subject and grade may yield more helpful data.
Factors for Questions for
policymakers to consider: policymakers to consider:
While
challenging, experts agree it is W
hich achievement measures will be used
important to measure and report disparities in — test scores, graduation rates, growth,
performance levels among different groups of etc.?
students. W
hich subgroups should be included
C
losing achievement gaps should benefit all and which excluded — by income, race,
students – accelerating the growth of lower achievement level, etc.?
performers without reducing growth in higher A
re achievement gaps measured within
achievers. schools and within districts?
In addition to subgroups based on student A
re multiple years of data used for school
demographics, consider subgroups based performance measures?
solely on achievement. For example, closing
gaps between historically struggling and S
hould performance measures specifically
higher-performing readers in a grade level or target academic growth of the lowest
school. quartile by giving that group additional
weight in the accountability formula?
D
ecisions surrounding determination of
subgroup size matter. Subgroup size can H
ow can unintended consequences of
enhance fairness but the use of “super subgroup size be accommodated in small,
subgroups” — such as grouping all ethnicities rural schools?
under the term minority versus breakdowns
by individual ethnicity — may risk covering up
low performance by smaller subgroups.
F
ederal regulations governing the reporting
of assessment results for minimum sample
sizes, to avoid releasing personally identifiable
information, should be consulted.
EDUCATION COMMISSION OF THE STATES | PAGE 19Essential Indicator #4: Graduation Rates
Measuring graduation rates is intended to encourage all schools to ensure all students complete
requirements to receive a diploma. The credential, which data has long demonstrated results in better
employment prospects and higher pay, can have a profound impact on student life outcomes.
The U.S. Department of Education’s required calculation for a school’s four-year graduation rate is to
divide the number of students graduating in four years with a regular high school diploma by the number
of students who entered the school as freshmen four years previously. This calculation is adjusted to
account for student movement in and out of the school during the four-year period.
A graduation rate would seem to be a fairly easy metric on its face. Yet it offers a myriad of complexities
when considering how to encourage schools to serve students who might “count” against them, such
as those who have left school and returned or who have been slow to accumulate enough credits to
graduate. For example, how does a state consider students who take five or six years to graduate? Such
decisions can have a significant influence on the effort schools put forth in educating at-risk students.
Factors for Questions for
policymakers to consider: policymakers to consider:
A
llowing credit for five-year and six-year S
hould five-year and six-year graduation
graduation rates, in addition to the four- rates be included in the state accountability
year rate, could encourage schools to work system to encourage schools to work with
with struggling students. struggling students?
A
lternately, does allowing credit for five- W
ill a school’s graduation rate be measured
year and six-year graduation rates reduce against an absolute goal, such as 100 percent,
pressure to help students reach credential or a state average when determining a grade
completion within four years? or score for the report card?
B
ecause graduation requirements differ in S
imilarly, should a school’s graduation rate be
states, with some requiring end-of-course compared against demographically similar or
exams versus credit accumulation, accurate “peer” schools, all schools or perhaps both?
cross-state comparisons are difficult. W
ill trend data, such as three years’ worth
M
anaging student mobility data requires a of graduation rates, be used to determine if
strong longitudinal data tracking system. progress is being made?
E
ven with common calculations, schools C
onsider potential loopholes schools might
have the potential to “game the system” use to improve their ratings, such as excluding
by being selective about which students some students, and figure out how to close
are included in a four-year graduation them.
rate. Is there a minimum graduation rate below
which a school would fall into the lowest
performance category?
PAGE 20 | RATING STATES, GRADING SCHOOLS: WHAT PARENTS AND EXPERTS SAY STATES SHOULD CONSIDER TO MAKE SCHOOL ACCOUNTABILITY SYSTEMS MEANINGFULEssential Indicator #5: Postsecondary and Career Readiness
While many states are working to define postsecondary and career readiness, the ECS School
Accountability Advisory Panel defined it as when a student can perform college level-work without the
need for remediation. Often, the more explicit definition in terms of metrics is provided at the state level.
An indicator of career readiness creates the need for clarity in defining what career-ready looks like.
These indicators of postsecondary and career readiness were commonly used by states:
Dual enrollment participation and/or completion Percentage of students taking algebra in grade 8
Advanced Placement participation and/or results Industry certifications earned
ACT/SAT participation and/or results P
ercentage of students enrolled in
International Baccalaureate program postsecondary programs
participation P
ercentage of students assessed as needing
College-going rate college remediation
Factors for Questions for
policymakers to consider: policymakers to consider:
N
o single formula or definition guarantees freshman- W
hat other metrics might
year college success. be considered to measure
S
tates must increase the dialogue between all aspects postsecondary or career readiness?
of K-12 and postsecondary education to create an Is the data capability available to
aligned P-20 system. Each part of the system provides measure those?
a necessary building-block for postsecondary success or W
hich advanced offerings, such as
workforce readiness. Those blocks must be aligned for Advanced Placement, International
individual college- and career-readiness measures. Baccalaureate or dual enrollment
M
easures related to dual enrollment should recognize courses, are available to all
that dual enrollment may be limited by student location students?
or availability of online courses. Additionally, whether D
oes the state have the
students take part in dual enrollment may be limited by longitudinal student-level data
counseling availability and teacher support. necessary to determine if students
W
hen including courses and tests that students select are successful in postsecondary
into, such as Advanced Placement, ACT and SAT, education and/or the workforce?
include both the course or test-taking and the course D
o the state metrics accurately tell
or test-passing rates. the story of whether K-12 students
Including Advanced Placement participation and results are attending college without the
in an accountability formula bring into question the need for remediation?
availability of courses offered in person and online and
test cut scores.
D
etermining whether students entered college ready
to perform college-level work requires a relatively
stable student population and a strong longitudinal data
tracking system.
EDUCATION COMMISSION OF THE STATES | PAGE 21Conclusion
F
or more than a century, states have created a state school and district rating system to be
different ways of reporting on the quality of most effective, students, parents, teachers,
their public schools. It’s only in the last 30 administrators, policymakers, employers and
years, however, that the reporting has shifted community members must understand the state’s
from inputs to outcomes and to how well children goal and what their schools are doing — or not
are being served. This is a dramatic change and doing — to achieve it.
one that likely will continue to evolve. Is your state’s “North Star” ensuring college
Increased public reporting about school and career readiness for all? Is it graduating
performance has prompted concerns about the students with 21st century skills? Is it serving
fairness of comparing schools serving different the whole child? Is it reducing the gap between
populations. Many states have sought to address high-achieving and low-achieving students and
this issue by compensating for poverty, which is providing opportunities for all students? Is it
linked to many out-of-school factors affecting providing an accurate picture of school quality —
achievement, in some way in their district and or the lack thereof?
school rating systems. Often, this has sparked As states continue with their efforts, some may
criticism that expectations are lower for different need to re-evaluate their ratings systems and
groups of students. Balancing fairness for all make necessary course corrections to reach their
schools and rigor for all students is widely viewed goals. State leaders should consider whether
as a challenge in creating accountability systems. the public reports are providing increased
The findings of the ECS School Accountability transparency and serving the needs of parents
Advisory Group, the results from researchers and communities. A perfect metric, accountability
and the survey of parents make it clear that formula or school report card does not exist.
communication of a state’s overarching goal There is always room for improvement and the
for schools is imperative. To what end are accountability landscape will continue to evolve.
schools being graded? Schools have long served, The key is to determine which metrics will drive
and continue to serve, as community centers. the desired outcomes and whether measuring,
Accountability systems impacting schools carry reporting, incentivizing or leveling sanctions will
the potential for disrupting communities. For best move the state closer to its goal.
PAGE 22 | RATING STATES, GRADING SCHOOLS: WHAT PARENTS AND EXPERTS SAY STATES SHOULD CONSIDER TO MAKE SCHOOL ACCOUNTABILITY SYSTEMS MEANINGFULAppendix
Members of the ECS School Accountability Advisory Group
The Education Commission of the States convened its School Accountability Advisory Group on
Dec. 12-13, 2013 in Denver. Members are the following:
F
acilitator - Christopher Cross
Chairman of Cross & Joftus, LLC and an ECS 2014 Distinguished Senior Fellow
Jean-Claude Brizard
President, UpSpring Education and former Chief Executive Officer, Chicago Public Schools
Sandy Kress
Partner, Akin, Gump, Straus, Hauer & Feld, LLP
Eric Lerum
Vice President for National Policy, Students First
Patricia Levesque
Chief Executive Officer, Foundation for Excellence in Education
Aaron Pallas
Professor of Sociology and Education, Teachers College Columbia University
Paul Reville
Professor of Educational Policy and Administration, Harvard Graduate School of Education
Joan Sullivan
Chief Executive Officer, Partnership for Los Angeles Schools
P
hilip “Uri” Treisman
Executive Director, Charles A. Dana Center at the University of Texas, Austin
John White
Director, SAS EVAAS for K-12, SAS Institute
Priscilla Wohlstetter
Senior Research Fellow, Consortium for Policy Research in Education
EDUCATION COMMISSION OF THE STATES | PAGE 23Endnotes
1. E
ducation in the States: Nationwide Development since 1990, Jim B and Edgar Fuller (editors), Pearson (Author), National
Education Association (Publisher), 1969.
2. Data notes for this graph:
D
eterminations were based on statutory requirements, although we also reviewed state-requested waivers to the
No Child Left Behind Act. Reconciling the two made it difficult to maintain accurate counts.
A
chievement gap elements reflect state statutory language explicitly targeting closing achievement gaps or explicit
targeting of the lowest-performing quartile or English Language Learners.
S
ome states explicitly measure college and/or career readiness (and measure via proxies such as ACT/SAT scores,
dual enrollment, college-going rate, industry certifications) while others might simply measure and/or report on the
proxies of readiness.
3. E
ducation Commission of the States’ School Accountability Parent Panel reviewed state school report cards between
Jan. 20 and Feb. 10, 2014. For parent feedback, ECS selected a mix of elementary, middle and high schools that were
moderately diverse in student population and received ratings that were in the moderate to upper range. This resulted in a
total of 700 report card reviews - 14 parents, each reviewing 50 state school report cards = 700 report card reviews.
4. The ECS School Accountability Advisory Group met Dec. 12-13, 2013 in Denver. Members of the group are identified by
name and title in an appendix to this report. The group was facilitated by Christopher Cross, chairman of Cross & Joftus,
LLC, and an ECS 2014 Distinguished Senior Fellow.
5. G
illian Locke, Joe Ableidinger, Bryan C. Hassel and Sharon Kebschull Barrett, Virtual Schools: Assessing Progress and
Accountability, A Final Report of Study Findings (Washington D.C.: National Charter School Resource Center at American
Institutes for Research, February 2014),
http://www.charterschoolcenter.org/sites/default/files/Virtual%20Schools%20Accountability%20Report.pdf.
Below are links where you can find school accountability reports for each state.
Alabama Idaho Minnesota North Dakota Vermont
Alaska Illinois Mississippi Ohio Virginia
Arizona Indiana Missouri Oklahoma Washington
Arkansas Iowa Montana Oregon West Virginia
California Kansas Nebraska Pennsylvania Wisconsin
Colorado Kentucky Nevada Rhode Island Wyoming
Connecticut Louisiana New Hampshire South Carolina Washington D.C.
Delaware Maine New Jersey South Dakota American Samoa
Florida Maryland New Mexico Tennessee Guam
Georgia Massachusetts New York Texas Puerto Rico (Spanish)
Hawaii Michigan North Carolina Utah U.S. Virgin Islands
PAGE 24 | RATING STATES, GRADING SCHOOLS: WHAT PARENTS AND EXPERTS SAY STATES SHOULD CONSIDER TO MAKE SCHOOL ACCOUNTABILITY SYSTEMS MEANINGFULYou can also read