Semi-Automatic Adaptation of Diagnostic Rules in the Case-Based Reasoning Process - MDPI

Page created by Charlie Lewis
 
CONTINUE READING
Semi-Automatic Adaptation of Diagnostic Rules in the Case-Based Reasoning Process - MDPI
applied
              sciences
Review
Semi-Automatic Adaptation of Diagnostic Rules in the
Case-Based Reasoning Process
L’udmila Pusztová * , František Babič                     and Ján Paralič

                                           Department of Cybernetics and Artificial Intelligence, Faculty of Electrical Engineering and Informatics,
                                           Technical University of Košice, Letná 9, 042 00 Košice, Slovakia; frantisek.babic@tuke.sk (F.B.);
                                           jan.paralic@tuke.sk (J.P.)
                                           * Correspondence: ludmila.pusztova.2@tuke.sk

                                           Abstract: The paper presents a new approach to effectively support the adaptation phases in the case-
                                           based reasoning (CBR) process. The use of the CBR approach in DSS (Decision Support Systems) can
                                           help the doctors better understand existing knowledge and make personalized decisions. CBR simu-
                                           lates human thinking by reusing previous solutions applied to past similar cases to solve new ones.
                                           The proposed method improves the most challenging part of the CBR process, the adaptation phase.
                                           It provides diagnostic suggestions together with explanations in the form of decision rules so that
                                           the physician can more easily decide on a new patient’s diagnosis. We experimentally tested and
                                           verified our semi-automatic adaptation method through medical data representing patients with
                                           cardiovascular disease. At first, the most appropriate diagnostics is presented to the doctor as the
                                           most relevant diagnostic paths, i.e., rules—extracted from a decision tree model. The generated
                                           rules are based on existing patient records available for the analysis. Next, the doctor can consider
                                           these results in two ways. If the selected diagnostic path entirely covers the actual new case, she can
                                           apply the proposed diagnostic path to diagnose the new case. Otherwise, our system automatically
                                           suggests the minimal rules’ modification alternatives to cover the new case. The doctor decides if the
                                           suggested modifications can be accepted or not.
         
         
                                           Keywords: medical diagnostics; Case-Based reasoning; rules adaptation; cardiovascular disease
Citation: Pusztová, L’.; Babič, F.;
Paralič, J. Semi-Automatic Adaptation
of Diagnostic Rules in the Case-Based
Reasoning Process. Appl. Sci. 2021, 11,
                                           1. Introduction
292. https://doi.org/10.3390/
app11010292                                     Machine learning promises significant advancement in the healthcare domain up to
                                           personalized medicine [1]. Currently, the most often used are predictive models, trained on
Received: 27 November 2020                 various sorts of medical data. Predictions include the use of advanced analytical technology,
Accepted: 27 December 2020                 modeling, machine learning, and data mining algorithms, running simulations, and pattern
Published: 30 December 2020                searching. Some machine learning models provide excellent predictive accuracy but do
                                           not offer understandable insights about their predictions. This is a severe problem in the
Publisher’s Note: MDPI stays neu-          medical domain. Explaining data patterns is useful in every way to understand and trust
tral with regard to jurisdictional clai-   the system and its predictions. Data scientists interpret large amounts of data, use analytical
ms in published maps and institutio-       algorithms, and convey knowledge through visual and textual descriptions to help people
nal affiliations.                          understand details.
                                                Today, healthcare providers generate and collect large amounts of data and gradu-
                                           ally deploy analytical solutions of various types. This situation requires effective data
Copyright: © 2020 by the authors. Li-
                                           processing and analytics with results in a simple, understandable form for target users
censee MDPI, Basel, Switzerland.
                                           represented, e.g., by general practitioners, doctors, specialists, or researchers. It is not
This article is an open access article
                                           easy for a doctor to consider a large amount of data when diagnosing or determining the
distributed under the terms and con-       right treatment. Due to its complexity, this process is prone to errors and widespread
ditions of the Creative Commons At-        misdiagnosis. There are many cases in which the symptoms and diseases overlap and may
tribution (CC BY) license (https://        be characteristic of several diseases. According to the World Health Organization (WHO),
creativecommons.org/licenses/by/           up to 5% of outpatients were misdiagnosed in 2015, which is a very worrying result. Thus,
4.0/).                                     the correct diagnosis of a disease or condition relies on the availability of all the necessary

Appl. Sci. 2021, 11, 292. https://doi.org/10.3390/app11010292                                                   https://www.mdpi.com/journal/applsci
Semi-Automatic Adaptation of Diagnostic Rules in the Case-Based Reasoning Process - MDPI
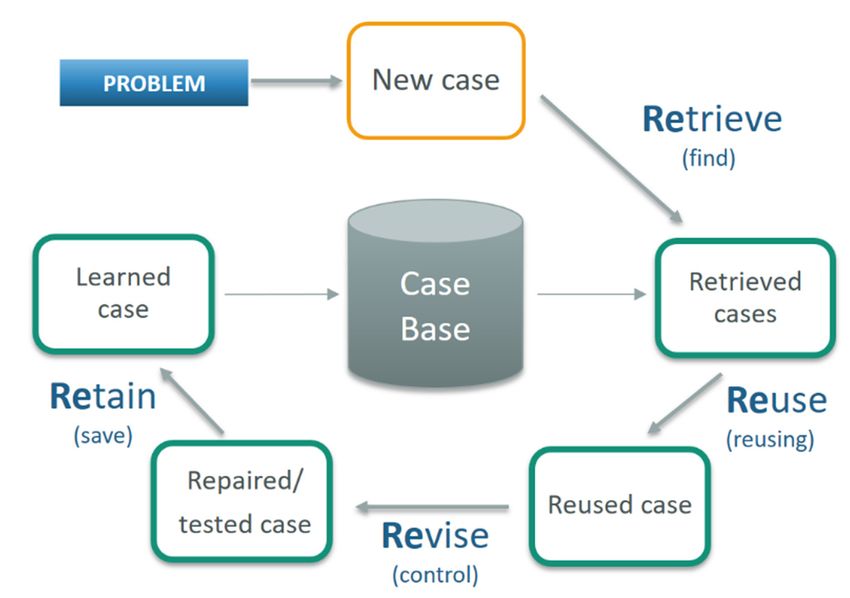
Appl. Sci. 2021, 11, 292                                                                                            2 of 18

                           information. The volume, complexity, and dynamics of this situation challenge doctors
                           and other health professionals. The number of symptoms is non-specific and variable
                           depending on the case; many diagnostic tests are expensive, irregular, and sometimes do
                           not give the correct answer. Also, physicians usually rely on their cognitive abilities and
                           experience in diagnosing similar or identical symptoms. Given the growing diversity of
                           treatments and medicines, the speed of data collection, the availability of diagnostic tests,
                           and the differences of opinion between doctors, the use of a diagnostic decision support
                           system can help.
                                 Traditional decision support models use rules extracted from the historical data to
                           evaluate new cases. However, what is to be done if the new case does not meet any of the
                           existing rules? The typical approach represents the re-generation of all rules based on the
                           extended data sample and requires the time and effort of a data or knowledge engineer
                           who may not be available at the time. It is not ideal in clinical practice, where new patients
                           or the same patients with different medical conditions come every day. This problem is
                           partially solved by case-based reasoning method, which uses the knowledge and solutions
                           used in past cases based on their similarity to the new case.
                                 The case-based reasoning (CBR) method predicts future situations based on similar
                           historical conditions. This approach itself is not entirely new, but after reading a number of
                           studies dealing with case-based reasoning [2–8] and its applications in medical data [9–21],
                           we found that this area still offers several research problems that have not yet received
                           sufficient attention, or a suitable solution has not previously been proposed and tested [9].
                           One of them is a semi-automatic adaptation of decision models using expert knowledge.
                           In medicine, the adaptation phase of the CBR is a significant challenge, which is avoided
                           by several systems using the CBR method. This fact motivated us to propose an approach
                           to solving this problem without a need to regenerate the decision models for each new case.
                           We published the initial idea in our work “How to improve the adaptation phase of the
                           CBR in the medical domain” [22], presented at the International Cross-Domain Conference
                           for Machine Learning and Knowledge Extraction in 2019.
                                 In this paper, we aimed to create a new mechanism for the semi-automatic adaptation
                           of the case base in the CBR cycle. The logic in the background is still the same; the character
                           of the input data is essential. We describe a pilot case of the data representing patients with
                           cardiovascular diseases. We created a decision support system to test our mechanism using
                           this data. Since we used the rule based CBR system, we chose the decision trees method
                           to generate the decision models as basis for the case base. We believe that this approach
                           will increase the accuracy of cardiovascular disease’s diagnostic process, choose the right
                           treatment method, or identify potentially useful and, at first glance, hidden knowledge.
                                 The paper is organized as follows. The first section describes our motivation and
                           identified challenges in this field. The second section presents the methodology, specifically,
                           a description of the case-based reasoning method, the decision tree algorithm, and a
                           brief introduction to decision support systems. The last two sections are devoted to the
                           developed decision support system, integrating our innovated CBR method into this
                           system, and its experimental evaluation on a cardiovascular disease data sample.

                           2. Materials and Methods
                                This section briefly presents basic principles of clinical decision support systems,
                           case-based reasoning, and decision tree machine learning model, which are the tree main
                           approaches and methods used in the proposed solution.

                           2.1. Decision Support System (DSS)
                                DSS is an interactive and flexible computer system that helps subjects make decisions
                           and solve various types of problems. There are many types of DSS, but for the medical
                           field, the most well-known are knowledge based DSS, also called expert systems (ES).
                           These systems are equipped with the knowledge of an expert a specialist in a specific area
                           (the knowledge base), and an inference mechanism able to derive valid conclusions based
Semi-Automatic Adaptation of Diagnostic Rules in the Case-Based Reasoning Process - MDPI
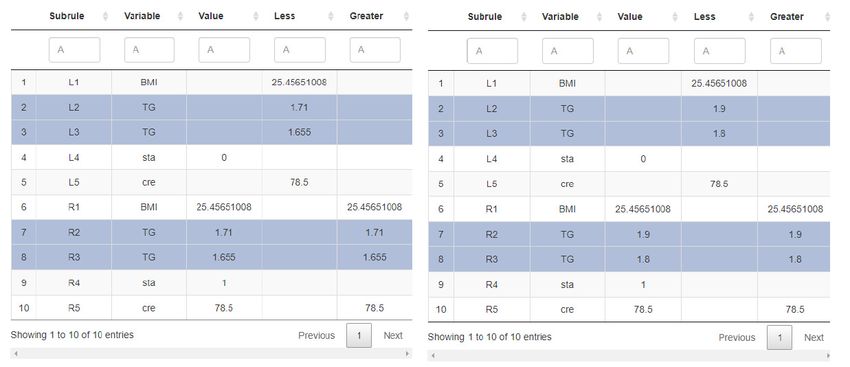
Appl. Sci. 2021, 11, 292                                                                                              3 of 18

                           on the input information and the knowledge base. As a result, ES can propose solutions
                           similar as the human expert would do.
                                 In recent years, the use of DSS in the healthcare domain has increased. The systems
                           assist medical staff in day-to-day decision-making processes such as diagnosing one or
                           more diseases, proposing appropriate treatment, diagnosing the absolute absence of some
                           illness, or looking for their causes. Older expert systems were designed to handle only one
                           problem [23–25], such as heart disorders [26]. Current expert systems already cover a wide
                           range of medical issues, from diagnosis and response to test results to prescribing drugs
                           for various diseases [27].
                                 The first medical expert systems have existed since 1960 [23,28,29] and are still be-
                           ing developed with gradual improvements for today. Typical representatives of these
                           systems are DENDRAL [24]—its primary goal was to study the formation of hypotheses
                           and discoveries in science, which resulted in a specific task: to assist chemists identifying
                           unknown organic molecules by analyzing their spectra using knowledge from chemistry.
                           MYCIN [23]—its main task was to help doctors identify bacteria causing serious infec-
                           tious diseases and to recommend treatment with antibiotics at a dose adjusted according
                           to the patient’s body weight (the name MYCIN derived from antibiotics with the suf-
                           fix “-mycin”). MOLGEN [25]—the best-known ES in genetics, provides an intelligence
                           consultant to a molecular geneticist in designing experiments, including DNA treatment.
                           INTERNIS-1 [30]—is an educational project developed at the University of Pittsburgh in
                           the early 1970s. This system aimed to assist healthcare professionals in the diagnosis of
                           diseases in general internal medicine. The Expert Disease Program [26] focused on treating
                           heart disease. It allowed the physician to write-in information about the patient’s history,
                           physical examination, and laboratory tests, and then generate a detailed explanation of
                           the differential diagnoses indicating the clinical data that support each diagnosis of heart
                           disease. PUFF [31]—expert system PUFF (Pulmonary Function System) diagnoses the
                           results of a pulmonary function (PF) test, such as lung volume, the patient’s ability to
                           move air to and from the lungs, as well as the lung’s ability to get oxygen to the blood
                           and carbon dioxide. The result is a set of interpreted patient statements and diagnoses.
                           Other expert systems include, for example, ONCOCIN (aimed at treating patients with
                           chemotherapy), or TRAUMA Advisor, whose primary role is to help clinicians in rural
                           areas in the diagnosis and treatment of trauma patients with head injuries. The work of
                           Singla et al. [32] provides a brief overview of medical diagnostic expert systems based on
                           already existing studies.

                           2.2. Case-Based Reasoning (CBR)
                                 Case-based reasoning has become a more well-known approach based on solving
                           new problems using solutions of previous similar problems. Memory, learning, planning,
                           and problem resolution are essential features of the CBR approach, providing the basis
                           for new intelligent computing technology. This process involves adapting used solutions
                           to meet the new requirements and using historical cases to explain the new solutions.
                           The CBR process gained a lot of attention because the basic idea of reusing experience in
                           solving previous problems imitates human thinking. Relying on previous experience is an
                           intuitive and commonly used way of solving problems. In the late 20th century, researchers
                           examined people’s ability to solve problems. They found that most people gather solutions
                           to issues based on historical experience with similar situations. Unlike other approaches,
                           which rely only on general knowledge of the problem area, CBR can use specific knowledge
                           about previous problem situations [21], as also confirmed by the authors of [3].
                                 According to Kolonder [4], the CBR cycle consists of two main tasks. At first, the
                           most similar case is retrieved and selected from the knowledge base. The individual
                           cases must be compared to find the most similar ones to the new. If the knowledge base is
                           relatively small, it is possible to perform sequential retrieval or use classification algorithms.
                           The second task is to adapt the existing solution to match the current case and store it
                           in the case database. If the new and retrieved cases are similar, a simple transfer of the
Semi-Automatic Adaptation of Diagnostic Rules in the Case-Based Reasoning Process - MDPI
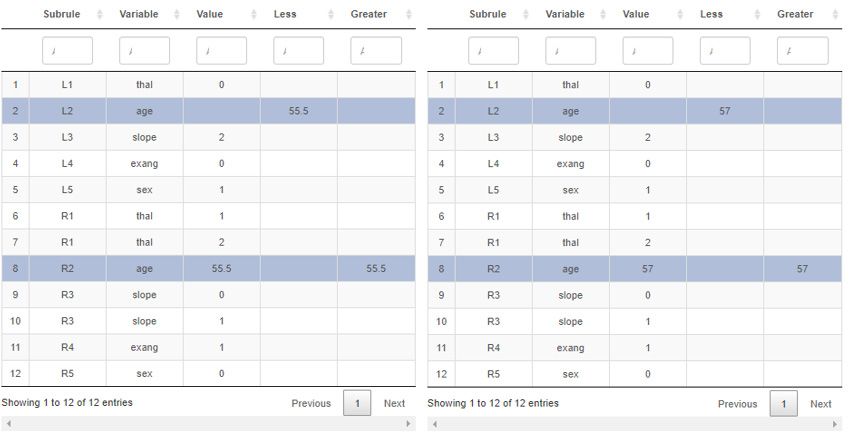
Appl. Sci. 2021, 11, x FOR PEER REVIEW                                                                                                          4 of 18

                                  small, it is possible to perform sequential retrieval or use classification algorithms. The
 Appl. Sci. 2021, 11, 292         second task is to adapt the existing solution to match the current case and store it in 4the                        of 18
                                  case database. If the new and retrieved cases are similar, a simple transfer of the solution
                                  is most appropriate. But if it is not the case, the adaptation is needed, which is a very
                                  complicated process. It has not yet been published a general adaptation method, and this
                                    solution is most appropriate. But if it is not the case, the adaptation is needed, which is
                                  step is entirely
                                    a very             domain-dependent
                                             complicated        process. It hasfor   notthe best
                                                                                          yet beenof published
                                                                                                      our knowledge.      In this
                                                                                                                    a general       paper, we
                                                                                                                                adaptation          pro-
                                                                                                                                                method,
                                  posed    an  original   semi-automatic         adaptation    model.
                                    and this step is entirely domain-dependent for the best of our knowledge. In this paper,
                                    weThe     typicalan
                                         proposed       CBR    life cycle
                                                          original          consists of the
                                                                      semi-automatic           RETRIEVE
                                                                                            adaptation         phase (searching for and retriev-
                                                                                                           model.
                                  ing theThemost   similar   cases),   REUSE      (reusing   the  proposed
                                                 typical CBR life cycle consists of the RETRIEVE phase          solution),  REVISE
                                                                                                                      (searching    for(checking     the
                                                                                                                                         and retrieving
                                  proposed
                                    the mostsolution),       and RETAIN
                                                 similar cases),                (preserving)
                                                                    REUSE (reusing              the learned
                                                                                          the proposed          case forREVISE
                                                                                                             solution),  future use).     The REUSE
                                                                                                                                   (checking     the pro-
                                  and  REVISE      steps   many     researchers      combine    into   a single  phase
                                    posed solution), and RETAIN (preserving) the learned case for future use). The REUSE called  ADAPT       (adapta- and
                                  tion).
                                    REVISE steps many researchers combine into a single phase called ADAPT (adaptation).
                                       The Theexisting
                                                 existingliterature
                                                            literature contains
                                                                          contains  several
                                                                                       severalmodels
                                                                                                models   ofof
                                                                                                            operation
                                                                                                               operationofofthis cycle,
                                                                                                                              this cycle, such
                                                                                                                                            such asasthe
                                                                                                                                                       the
                                  Hunt    model,    the  Allen    model,     the   model    by Kolodner       and  Leake
                                    Hunt model, the Allen model, the model by Kolodner and Leake [5], and the R4 model     [5], and   the   R4  model
                                  designed
                                    designed   bybyAamodt
                                                     Aamodt    andandPlaza
                                                                       Plaza  [5]. Model
                                                                                [5].  Model R4R4is is
                                                                                                   oneoneofof
                                                                                                            the  most
                                                                                                               the mostwidely
                                                                                                                         widely  used
                                                                                                                                   used andandis is
                                                                                                                                                  atat
                                                                                                                                                     the
                                                                                                                                                       the
                                  highest
                                    highestlevel
                                               levelofofgenerality.
                                                         generality. It    can be
                                                                        It can   berepresented
                                                                                      representedbybya schematic
                                                                                                           a schematic    cycle
                                                                                                                       cycle     containing
                                                                                                                              containing    “four “four
                                                                                                                                                     REs,”
                                  REs,”   as shown
                                    as shown           in Figure
                                                  in Figure   1. The1. The
                                                                       casecase     database
                                                                               database        includes
                                                                                          includes          experiences
                                                                                                      experiences         that have
                                                                                                                     that have   solved solved    prob-in
                                                                                                                                           problems
                                  lems  in  the
                                    the past.     past.

                                    Figure
                                  Figure 1. 1. Case-based
                                            Case-based    reasoning
                                                        reasoning   (CBR)
                                                                  (CBR)   cycle
                                                                        cycle   designed
                                                                              designed byby Aamodt
                                                                                          Aamodt   and
                                                                                                 and   Plaza.
                                                                                                     Plaza.

                                           Each
                                        Each     step
                                              step  inin   this
                                                         this   figure
                                                              figure   has
                                                                     has  itsits  place
                                                                               place  andand importance
                                                                                           importance  forfor the
                                                                                                            the    successful
                                                                                                                successful     functioning
                                                                                                                             functioning    ofof
                                    the
                                  the    CBR
                                       CBR     system.
                                             system.
                                           RETRIEVE       phase—findingand
                                        RETRIEVE phase—finding              andretrieving
                                                                                   retrieving the
                                                                                              the most
                                                                                                  most similar
                                                                                                       similar cases.
                                                                                                                 cases. According
                                                                                                                        Accordingtotoseveral
                                                                                                                                         sev-
                                    authors    [7,8],  this phase   is one   of  the  most  important  because
                                  eral authors [7,8], this phase is one of the most important because it forms theit forms  thebasis
                                                                                                                                 basisfor
                                                                                                                                        forthe
                                                                                                                                             the
                                    system’s    overall    work.   The  retrieving    includes  finding cases   within  those
                                  system’s overall work. The retrieving includes finding cases within those cases that are      cases  that  are
                                    most    similar   to  the currently   examined      new   case. Techniques    such
                                  most similar to the currently examined new case. Techniques such as nearest neighbor  as nearest  neighbor
                                    search, inductive approaches, knowledge approaches, and validated search are the most
                                  search, inductive approaches, knowledge approaches, and validated search are the most
                                    used for retrieving in this phase.
                                  used for retrieving in this phase.
                                           REUSE and REVISE phases—reuse and control of the proposed solution. In many
                                        REUSE and REVISE phases—reuse and control of the proposed solution. In many
                                    practical applications, it is often difficult to distinguish between these two steps. Many re-
                                  practical applications, it is often difficult to distinguish between these two steps. Many
                                    searchers combine them into a single-phase called ADAPT [1]. In the early 1990s, CBR sys-
                                  researchers combine them into a single-phase called ADAPT [1]. In the early 1990s, CBR
                                    tems focused only on the retrieval step. The study of various aspects of adaptation only
                                  systems focused only on the retrieval step. The study of various aspects of adaptation only
                                    started after this period [10]. Most progress has also been made in the CBR cycle, re-
                                  started after this period [10]. Most progress has also been made in the CBR cycle, retrieve,
                                    trieve, and reuse step [11]. In the reuse phase, progress has been made depending on the
                                  and reuse step [11]. In the reuse phase, progress has been made depending on the system’s
                                    system’s purpose, i.e., diagnosis, classification, learning, and planning (such as therapy
                                  purpose, i.e., diagnosis, classification, learning, and planning (such as therapy support).
                                    support). In terms of diagnostics and classification, most systems rely on adaptation meth-
                                  In terms of diagnostics and classification, most systems rely on adaptation methods,
                                    ods, which consist of copying the solution of the most similar case or a combination thereof,
                                    i.e., reuse of the solution [12].
                                           RETAIN phase—preservation of the learned case for future use. After reusing and
                                    checking the proposed solution, the next step in the CBR cycle is to save the new (just re-
                                    solved) case. There are many approaches to achieving this goal. Many systems only store a
Semi-Automatic Adaptation of Diagnostic Rules in the Case-Based Reasoning Process - MDPI
Appl. Sci. 2021, 11, 292                                                                                             5 of 18

                           previous problem solution, while some systems also store a new case solution. In many
                           cases, this process leads to uncontrolled growth of the case base, which causes a deteriora-
                           tion in system performance in terms of speed, as mentioned in the work of Lawanna and
                           Daengdej [33].
                                 The most critical limitation in the use and implementation of CBR systems is the
                           adaptation phase problem. D’Aquin et al. [13] argue that the adaptation process is rel-
                           atively demanding because it must address the lack of relevant information about the
                           case, the applicability, and the consequences of the decision. Other limitations include,
                           for example, the complex generalization of similar cases and the processing of noisy data.
                                 CBR in the medical domain is currently an active area of research. The base of
                           medical knowledge is constantly changing; sometimes there is more than one solution,
                           and doctors have different approaches and treatments. This area is expected to grow
                           because the health sector is continually expanding and is increasingly accepting decision
                           support systems. The very fact that the methodology of CBR systems is very similar to the
                           physician’s thought process suggests the successful use of CBR in the medical domain [14].
                           According to work by Choudhury [1], CBR systems in the medical field have a wide range
                           of applications. Most of these systems are developed specifically to address a disease;
                           most systems function as prototypes and not as a final product (as mentioned by Blanco in
                           work [15]). Such systems require a human expert to interpret the result. Another visible
                           trend is the successful hybridization of CBR with various computational methods.
                                 We also used the CBR method in our work [34], which worked only as a retrieval
                           system. The system allowed the user to find the most similar historical patients to a new
                           patient and suggested the most likely potential outcome of an examination called coronary
                           angiography. It also provided useful data visualizations through tables and graphs for the
                           cardiologist who is responsible for the final decision on recommending a new patient for
                           coronary angiography or not.
                                 Some systems avoid entirely automatic adaptation, so they only work as search
                           engines. However, systems that support the adaptation phase often have a reasoning
                           mechanism (CBR) associated with rule based reasoning (RBR) or various computational
                           methods (classification tree, neural networks, etc.). The problem of adaptation, therefore,
                           also occurs in the medical domain. In the adaptation process, it is necessary to process the
                           lack of information about patients, which is traditionally done manually by experts in the
                           field. As a result of these challenge, most of the progress made in CBR medical systems
                           focus mainly on the search phase, and the adaptation phase is therefore limited to planning
                           tasks [12]. No general models for adaptation have been developed yet because they depend
                           primarily on the domain’s characteristics and application. Systems in the medical field that
                           apply the full CBR method (retrieve, reuse, revision, retain) are still very seldom.
                                 Some authors tried to solve the problem of adaptation in the medical domain. The
                           CASEY medical expert system [16] used rule-based domain theory. Some of the newer
                           systems successfully perform adaptation using computational techniques, e.g., eXiT *
                           CBR.v2 [17] revises and reuses cases using genetic algorithms; EquiVox developed by Hen-
                           riet et al. [18] performs adaptation using artificial neural networks. Sharaf-El-Deen et al. [21]
                           and Saraiva et al. [19] decided to solve adaptation by creating a CBR system that integrated
                           CBR and RBR. They made a hybrid CBR model for medical diagnostic procedures that au-
                           tomatically applied the adaptation process using adaptation rules. Salem and Bagoury [20]
                           proposed a hybrid adaptation model combining transformation and hierarchical adaptation
                           techniques with artificial neural networks and specific factors to diagnose thyroid cancer.
                           Zubi and Saad [35] used combined data mining techniques with neural networks to diag-
                           nose lung cancer early. Keles et al. [36] used neuro-fuzzy rules to diagnose breast cancer,
                           while Shafar-El-Deen and Moawad [21] introduced a hybrid approach that also combined
                           CBR and RBR reasoning. The major drawback of existing approaches is the lack of their
                           ability to provide explanations (particularly in the case of hybrid approaches making use
                           of black box type of artificial intelligence methods). Moreover, it is usually only the new
                           case which is retained for future learning and improving of the system. In this paper we
Semi-Automatic Adaptation of Diagnostic Rules in the Case-Based Reasoning Process - MDPI
Appl. Sci. 2021, 11, 292                                                                                            6 of 18

                           propose a new adaptation method, which has strong explanation capabilities because of
                           using decision rules. Also, it also learns the new knowledge acquired when solving the
                           new case in form of rule modifications, which is a more general form of knowledge than
                           just on the case level.

                           2.3. Decision Tree
                                 Decision trees are among the most widely used data analysis techniques in medicine
                           because of their straightforward interpretation and understanding. The result is presented
                           in a simple, understandable graphic form like a tree. Each structure starts at the root of the
                           tree and goes through the individual nodes to the leaf node, determining the instance’s
                           classification. Internal nodes specify a test performed on the selected instance attribute,
                           with each possible test result represented by one branch. In such a way a decision path
                           from the root to a specific leaf node represents one particular decision rule. Decision trees
                           are usually presented also in a graphical representation.
                                 Authors Sharma and Om [37], Wang et al. [38], and Zolbanin et al. [39] applied the
                           decision tree method to examine medical data, the rules of which they used to predict the
                           disease and evaluate them for accuracy. We use a similar approach in our research group;
                           we use the decision tree method to support the diagnosis of Mild cognitive impairment,
                           Metabolic syndrome [40–42], or Parkinson’s disease [43]. However, in the work presented
                           here we use it differently. Decision paths are used as a form of summarized knowledge
                           extracted from previous cases. Moreover, decision rules corresponding to those decision
                           paths are used as a basis for the adaptation method. We use in our implementation the
                           rpart package in R.
                                 Typical representatives of the decision rules generation are C4.5 (can work with
                           missing values, uses trimming, uses numeric attributes, branching criterion is proportional
                           information gain [44]); C5.0 (improved algorithm C4.5, better work with memory, ability to
                           work with continuous and discrete values, the criterion of branching is information gain
                           and entropy [45]). Rpart (Recursive PARTitioning) is an R implementation of the main
                           ideas from well-known CART (Classification and Regression Tree) algorithm. It is based
                           on a recursive division of the data set; the subsets created during the division are further
                           subdivided until a predetermined termination criterion is reached [45]. Exporting rules [46]
                           using this algorithm is very popular, as it provides the ability to display the generated rules
                           (as a plot), to create a list of all rules and a list of sub-rules in the form of tables.

                           3. Results and Discussion
                                As mentioned before, we proposed a semi-automatic adaptation method of the existing
                           case base according to a new case and expert’s decision based on automatically proposed
                           decision rule modifications. Our motivation was to prevent continuously re-generating
                           decision models using machine learning algorithms. Finally, in this study we integrated
                           the innovative CBR approach into our DSS and experimentally tested on available medical
                           samples about cardiovascular disease patients.
                                This section will briefly introduce our approach (Figure 2), published in one of our
                           previous papers [22].
Appl.
Appl.Sci. 2021,11,
      Sci.2021, 11,292
                    x FOR PEER REVIEW                                                                                               77 of
                                                                                                                                       of 18
                                                                                                                                          18

                              Figure 2. CBR
                              Figure 2. CBR cycle
                                            cycle with
                                                  with semi-automatic
                                                       semi-automatic adaptation
                                                                      adaptationof
                                                                                 ofthe
                                                                                    thestored
                                                                                        storedcases.
                                                                                               cases.

                                       The
                                       The cycle
                                            cycle starts
                                                   starts with
                                                          with information
                                                                 information provided
                                                                                provided aboutabout aa new
                                                                                                       new patient
                                                                                                             patient(case).
                                                                                                                     (case). The
                                                                                                                             The user
                                                                                                                                  user will
                                                                                                                                        will
                                 add  information    about   this patient  by means    of   the user interface  in the predefined
                                 add information about this patient by means of the user interface in the predefined format         format
                                 containing
                                 containing all
                                              all necessary
                                                  necessary characteristics
                                                               characteristics (input
                                                                                 (input variables).
                                                                                           variables). In
                                                                                                        In the
                                                                                                           the RETRIEVE
                                                                                                                RETRIEVE step,
                                                                                                                             step, the
                                                                                                                                   the new
                                                                                                                                       new
                                 case  is compared     with   existing   historical  cases    stored  in the  case  base
                                 case is compared with existing historical cases stored in the case base using inference  using  inference
                                 mechanism
                                 mechanism (IM).
                                               (IM). The
                                                      The cases
                                                           cases are
                                                                  are stored
                                                                      stored as
                                                                              as IF-THEN
                                                                                  IF-THEN rulesrules extracted
                                                                                                     extracted from
                                                                                                                 from the
                                                                                                                       the decision
                                                                                                                           decision model
                                                                                                                                     model
                                 generated   by the  decision   trees algorithm    described    in previous
                                 generated by the decision trees algorithm described in previous section. The section. The  comparison
                                                                                                                               comparisonis
                                 determined by calculating the distances between the cases using original similarity metric
                                 is determined by calculating the distances between the cases using original similarity met-
                                 based on decision (sub)rules transcripts. The comparison can result in one of the following
                                 ric based on decision (sub)rules transcripts. The comparison can result in one of the fol-
                                 three alternatives:
                                 lowing three alternatives:
                                 1.    The IM finds a perfectly fitting decision path for the new case. The value of the
                                 1. The IM finds a perfectly fitting decision path for the new case. The value of the new
                                       new case’s target attribute will be the same as corresponding decision rule suggests.
                                       case’s target attribute will be the same as corresponding decision rule suggests. The
                                       The system will return the diagnosis to the user.
                                       system will return the diagnosis to the user.
                                 2.    The IM does not find any at least partially relevant decision rule, i.e., all existing cases
                                 2. The IM does not find any at least partially relevant decision rule, i.e., all existing cases
                                       stored in the case base differ significantly from the new one. This situation requires
                                       stored in the case base differ significantly from the new one. This situation requires
                                       the intervention of an expert who classifies the new case (determines the value of the
                                       the intervention of an expert who classifies the new case (determines the value of the
                                       target attribute). Then, the system will generate the decision rules again from the
                                       target attribute). Then, the system will generate the decision rules again from the ex-
                                       extended data set.
                                 3.    tended
                                       The IM data    set.a list of partially similar decision rules with different target attribute
                                                returns
                                 3. The     IM The
                                       values.  returns
                                                     CBRa cycle
                                                            list ofwill
                                                                    partially similar
                                                                        proceed    withdecision
                                                                                          the stepsrules  withREVISE,
                                                                                                     REUSE,     differentand
                                                                                                                           target attribute
                                                                                                                              RETAIN.
                                       values. The CBR cycle will proceed with the steps REUSE, REVISE, and RETAIN.
                                       Before the cycle continues to these steps, it is necessary to examine and determine the
                                       Beforebetween
                                 differences   the cyclethe
                                                          continues
                                                              new and  to similar
                                                                          these steps,
                                                                                   cases.it Two
                                                                                            is necessary  to examine
                                                                                                 situations   can occur:and determine the
                                 differences between the new and similar cases. Two situations can occur:
Appl. Sci. 2021, 11, 292                                                                                             8 of 18

                           •    The cases differ in only one condition (parameter) on the left side of the rule. The expert
                                may consider modifying this rule (ADAPT phase), check the proposed classification
                                of the new case according to this rule (REVISE phase), and then the new case will
                                be classified according to the value of the target attribute of this rule (REUSE phase).
                                The new case can be saved/not saved (RETAIN phase) in the case base according to
                                the user’s decision. If the system finds several cases that differ from the new case in
                                only one condition, the expert decides on the rule containing the difference in the less
                                severe attributes. It is also possible to assign weights to the difference according to the
                                expert’s decision.
                           •    The cases differ in several conditions (parameters) on the left side of the rule. Initially,
                                a list of different conditions (parameters) is identified. The difference between a similar
                                case and a new case is calculated using the similarity and score metrics. In this case,
                                an expert can also assign the scales according to their importance to specific differences.
                                The expert determines the value of the new case’s target attribute, while our system
                                automatically proposes the rules with the highest similarity and the lowest score to
                                the new case (ADAPT, REUSE, REVISE phase), which can help the expert to decide.
                                As needed, it can adapt the rules (adjust boundaries or change the target value),
                                which can also be saved and will be immediately available for the next iteration of
                                adding a new patient. The new case can be saved/not saved in the case database
                                (RETAIN phase).
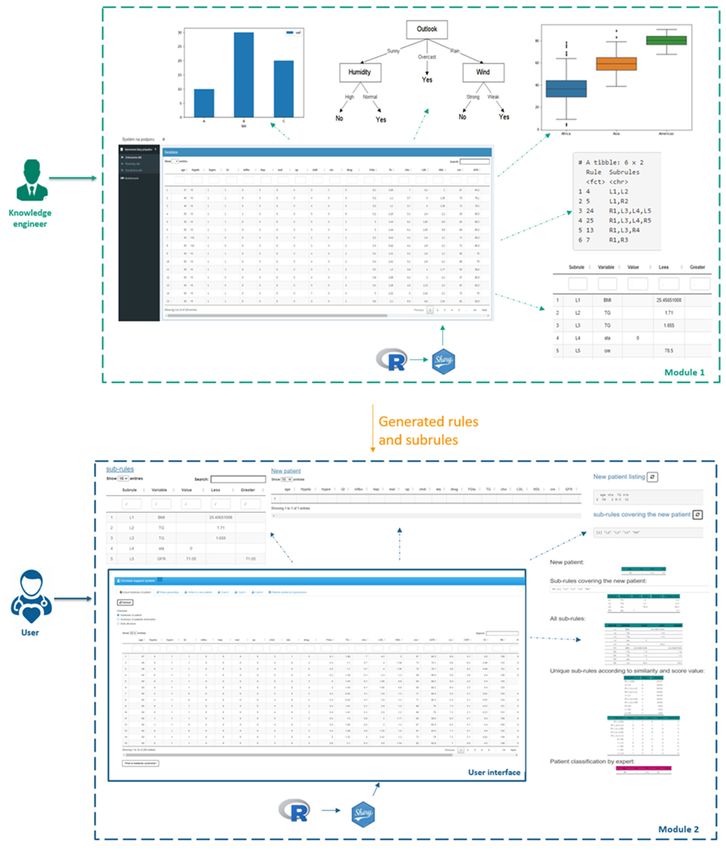
                                 The DSS software implementation consists of two modules (Figure 3) and is realized
                           within the R programming language as an interactive web application.
                                 First, we created module 1 (upper part in Figure 3) providing typical analytical features
                           like data visualization in a table or in suitable graphical form like boxplot for numerical
                           variables and histogram for categorical ones. Also, it runs the decision tree algorithm to
                           generate the models.
                                 The user can extract a set of rules and sub-rules from the model. One rule can be
                           formed by one or more sub-rules connected by the logical operator “AND”. A set of sub-
                           rules and rules can be downloaded in the form of a table. In this way, a case base contains a
                           list of sub-rules. The number of sub-rules depends on the size of the input data file entering
                           the 1st module. Inputs to this module are entered only by the knowledge engineer.
                                 The second module (lower part in Figure 3) represents an interface to the decision
                           support system using our case-based reasoning cycle. This module uses the most successful
                           model and case base from module 1. Most of the results in this model are displayed in
                           tabular form for easy understanding. For larger data, clustering can be applied before
                           generating the decision models. This will reduce the search space and make more tailored
                           results available to users.
Appl. Sci. 2021, 11, 292                                                                                                       9 of 18
  Appl. Sci. 2021, 11, x FOR PEER REVIEW                                                                                    9 of 18

                         Figure3.3.The
                        Figure      Theimplementation
                                        implementation of
                                                       of updated
                                                          updated CBR cycle into
                                                                            into our
                                                                                 our decision
                                                                                     decisionsupport
                                                                                              supportsystem.
                                                                                                      system.

                                         First, we created module 1 (upper part in Figure 3) providing typical analytical fea-
                                   3.1. Decision Support Systems Function
                                    tures like data visualization in a table or in suitable graphical form like boxplot for nu-
                                        We generated
                                    merical             several
                                             variables and       decision
                                                           histogram       models in module
                                                                       for categorical         1 with
                                                                                       ones. Also,      a holdout
                                                                                                   it runs         method
                                                                                                           the decision  tree (60/40,
                                                                                                                               algo-
                                   70/30,  80/20,  90/10)  and  the
                                    rithm to generate the models.   following   algorithms:  C5.0,  rpart, and  C4.5. If  the expert
                                   has available a large volume of input records, he can apply clustering at first to divide
                                   the patients into some groups based on their similarity. This step can help the expert
results available to users.

                           3.1. Decision Support Systems function
                                We generated several decision models in module 1 with a holdout method (60/40,
Appl. Sci. 2021, 11, 292   70/30, 80/20, 90/10) and the following algorithms: C5.0, rpart, and C4.5. If the expert              10 of
                                                                                                                                   has18

                           available a large volume of input records, he can apply clustering at first to divide the
                           patients into some groups based on their similarity. This step can help the expert to pro-
                           vide  more personalized
                           to provide                  diagnostics.
                                         more personalized            Next, the
                                                               diagnostics.       system
                                                                              Next,        offers the
                                                                                      the system        bestthe
                                                                                                     offers   decision    tree model,
                                                                                                                 best decision     tree
                           and  the  corresponding     decision  rules  are  generated.    The   graphical
                           model, and the corresponding decision rules are generated. The graphical form      form   of  the decision
                                                                                                                                of the
                           tree is often
                           decision  tree quite   problematic
                                           is often            for practical
                                                    quite problematic          use. There
                                                                        for practical   use. is a high
                                                                                             There   is a probability   that the
                                                                                                          high probability    thattree
                                                                                                                                    the
                           will
                           tree will be broadly branched and not readable. We prevent this situation with a table form
                                be  broadly    branched   and  not  readable.  We    prevent    this situation   with   a  table form
                           visualization.   The sub-rules
                           visualization. The     sub-rules generation
                                                            generationisisoneoneofofthe
                                                                                     theessential
                                                                                          essentialfunctions
                                                                                                      functions ofof
                                                                                                                  thethe   DSS,
                                                                                                                        DSS,     with-
                                                                                                                              without
                           out  which   it would   not be possible   to continue   working     with  the   system.  In
                           which it would not be possible to continue working with the system. In the Figure 4, we can  the  Figure   4,
                           we  can  see  10 sub-rules  exported   from   the best
                           see 10 sub-rules exported from the best decision model. decision   model.

                           Figure 4.
                           Figure     TheDecision
                                   4. The  DecisionSupport
                                                    SupportSystem
                                                            System(DSS)
                                                                    (DSS)visualizes
                                                                          visualizesthe
                                                                                     thesubrules
                                                                                         subrulesgenerated
                                                                                                  generatedfrom
                                                                                                             fromthe
                                                                                                                   thedecision
                                                                                                                       decision
                           tree as
                           tree as a table (L—left branch, R—right branch).

                                 The first
                                The    first column
                                             column ininFigure
                                                         Figure44contains
                                                                    containsthe
                                                                              thegiven
                                                                                  givensub-rule
                                                                                         sub-ruledesignation
                                                                                                   designationin Li
                                                                                                                 in or
                                                                                                                    Li Ri’s format,
                                                                                                                        or Ri’s for-
                           depending      on  whether   it is the left branch  in the tree (L) or the right one  (R).
                           mat, depending on whether it is the left branch in the tree (L) or the right one (R). The   The  second
                           columncolumn
                           second     contains   a specific
                                               contains       attribute
                                                         a specific      representing
                                                                      attribute         the corresponding
                                                                                representing                 intermediate
                                                                                               the corresponding              node
                                                                                                                     intermediate
                           from   the decision   tree. The  next  three  columns   describe the interval condition
                           node from the decision tree. The next three columns describe the interval condition for afor  a sub-rule
                           of the corresponding decision variable. Based on the corresponding value condition, it can
                           sub-rule of the corresponding decision variable. Based on the corresponding value condi-
                           have a value “equal to”, “less than”, or “greater than” the value in the respective row and
                           tion, it can have a value “equal to”, “less than”, or “greater than” the value in the respec-
                           column. If there is value in more than one column in one row, it means a conjunction of
                           tive row and column. If there is value in more than one column in one row, it means a
                           these corresponding intervals.
                           conjunction of these corresponding intervals.
                                 The generated sub-rules are not only used to determine the “coverage” of a new
                           patient, but the cardiologist can also see the current database of patients extended by a col-
                           umn, expressing which rule and conjunctions of the sub-rules cover each historical patient
                           (past cases) in this database. One can see it in Figure 5. The first columns represent the data
                           samples attributes, and the last column Subrules represents the sub-rule/conjunctions of
                           the sub-rules covering a particular record (case).
                                 The system also provides the results of matching between the new case and the most
                           relevant decision (sub)rules in form of a table (see Figure 6). The first column in Figure 6
                           entitled “similarity” represents the similarity value between the new case and historical
                           cases, which can take values between 0 and 100. In means the overlap between the set of
                           subrules valid for the new case and the set of subrules of the compared historical case in
                           percent. The second column represents the score value calculated using the Levenshtein
                           distance [47]. It is a real value representing the minimum number of operations that we
                           need to do in order to make the historical case (in form of covering subrules set encoded
                           as string) match the current new case (string constructed in the same way as for historical
                           case). The number and type of necessary operations contain the next three columns—insert,
                           delete, and substitution. For example, if the score is three, it can represent a combination of
                           one insert, one delete, and one substitution operations, but also two insert, one delete and
                           zero substitution operations.
The generated sub-rules are not only used to determine the “coverage” of a new pa-
                tient, but the cardiologist can also see the current database of patients extended by a col-
                umn, expressing which rule and conjunctions of the sub-rules cover each historical patient
                (past cases) in this database. One can see it in Figure 5. The first columns represent the
Appl. Sci. 2021, 11, 292                                                                                                          11 of 18
                data samples attributes, and the last column Subrules represents the sub-rule/conjunc-
                tions of the sub-rules covering a particular record (case).

                                   Figure 5. The DSS visualizes a patients table with coverage by sub-rules.

                                      The system also provides the results of matching between the new case and the mo
                               relevant decision (sub)rules in form of a table (see Figure 6). The first column in Figure
                               entitled “similarity” represents the similarity value between the new case and historic
                               cases, which can take values between 0 and 100. In means the overlap between the set o
                               subrules valid for the new case and the set of subrules of the compared historical case i
                               percent. The second column represents the score value calculated using the Levenshtei
                               distance [47]. It is a real value representing the minimum number of operations that w
                               need to do in order to make the historical case (in form of covering subrules set encode
                               as string) match the current new case (string constructed in the same way as for historic
                               case). The number and type of necessary operations contain the next three columns—in
                               sert, delete, and substitution. For example, if the score is three, it can represent a comb
                               nation of one insert, one delete, and one substitution operations, but also two insert, on
                           Figure
            Figure 5. The DSS     5. The DSS
                              visualizes     visualizes
                                          a patients    a patients
                                                     table         table withby
                                                           with coverage      coverage by sub-rules.
                               delete and    zero substitution     operations.sub-rules.
                       The system also provides the results of matching between the new case and the most
               relevant decision (sub)rules in form of a table (see Figure 6). The first column in Figure 6
               entitled “similarity” represents the similarity value between the new case and historical
               cases, which can take values between 0 and 100. In means the overlap between the set of
               subrules valid for the new case and the set of subrules of the compared historical case in
               percent. The second column represents the score value calculated using the Levenshtein
               distance [47]. It is a real value representing the minimum number of operations that we
               need to do in order to make the historical case (in form of covering subrules set encoded
               as string) match the       current
                                      Figure         new   case (stringtheconstructed    in the same    wayhistorical
                                                                                                              as for historical
                                    Figure   6. 6.
                                                TheThe DSS
                                                     DSS    calculates
                                                         calculates          similarity
                                                                    the similarity      between
                                                                                   between new andnew   and
                                                                                                     historical patient. patient.
               case). The number and type of necessary operations contain the next three columns—in-
               sert, delete, and substitution.
                                           Identified
                                             IdentifiedFor  example,
                                                        matches
                                                           matches areareif automatically
                                                                            the score issorted
                                                                        automatically     three,  it can
                                                                                                based
                                                                                            sorted        represent
                                                                                                         on
                                                                                                      based  their     a similarity
                                                                                                                          combi-and and
                                                                                                                     similarity
                                                                                                              on their                score.
                                                                                                                                           score. Th
               nation of one insert,The
                                      mostmost
                                           one   interesting
                                                 delete, and
                                              interesting    case
                                                               one
                                                            case  from   the adaptation
                                                                     substitution
                                                                  from                   point of
                                                                                     operations,
                                                                          the adaptation          view
                                                                                            point but   is partial
                                                                                                         also is
                                                                                                    of view     twosimilarity,
                                                                                                                     insert,
                                                                                                                  partial      when
                                                                                                                              one    expert
                                                                                                                           similarity,  when expe
                                    isispresented    by thethe
                                                            DSSDSS
                                                                 withwith
                                                                        the most   promising  subrules   Expert Expert
                                                                                                                  will consider  respectiverespectiv
Appl. Sci. 2021,delete   and
                 11, x FOR    zero
                           PEER    substitution
                                REVIEW   presented   operations.
                                                       by                    the most   promising     subrules             will consider
                                                                                                                                    12 of 18
                                    subrules and can adapt them according to the new case. In the following two tables in
                                      subrules and can adapt them according to the new case. In the following two tables i
                                    Figure 7, we can see such an adaptation of 4 sub-rules with the same attribute.
                                      Figure 7, we can see such an adaptation of 4 sub-rules with the same attribute.

            Figure 6. The DSS calculates the similarity between new and historical patient.

                 Identified matches are automatically sorted based on their similarity and score. The
            most interesting case from the adaptation point of view is partial similarity, when expert
            is presented by the DSS with the most promising subrules Expert will consider respective
            subrules and can adapt them according to the new case. In the following two tables in
            Figure 7, we can see such an adaptation of 4 sub-rules with the same attribute.
            Figure 7.
            Figure 7. The
                      The DSS
                          DSS visualizes
                              visualizes the
                                         the sub-rules
                                             sub-rules adaptation
                                                       adaptation process
                                                                  process (left—previous
                                                                           (left—previousversion,
                                                                                         version,right—adapted
                                                                                                  right—adaptedone).
                                                                                                                one).

                                       The left table represents the sub-rules before adaptation. The expert decided to adapt
                                  the TG attribute in which he changed the boundaries from TG < 1.71 to TG < 1.9; from TG
                                  < 1.655 to TG < 1.8; from TG ≥ 1.71 to TG ≥ 1.9 and from TG ≥ 1.655 to TG ≥ 1.8. Boundary
                                  values can be changed by double-clicking on a given value in the table. Subsequently, it
                                  is important to store this table with adapted sub-rules.
Appl. Sci. 2021, 11, 292                                                                                                             12 of 18

                                            The left table represents the sub-rules before adaptation. The expert decided to
                                       adapt the TG attribute in which he changed the boundaries from TG < 1.71 to TG < 1.9;
                                       from TG < 1.655 to TG < 1.8; from TG ≥ 1.71 to TG ≥ 1.9 and from TG ≥ 1.655 to TG ≥ 1.8.
                                       Boundary values can be changed by double-clicking on a given value in the table. Subse-
                                       quently, it is important to store this table with adapted sub-rules.
                                            The system stores adapted sub-rues in the knowledge base, ensuring up-do-date
                                       diagnostics for new patients, without the need to regenerate decision models.
                                            We used the publicly available Heart Disease Dataset (HDD) for experimental evalua-
                                       tion and verification, representing anonymized medical data on suffering/not suffering
                                       from heart disease. The system’s primary goal is to help the cardiologist (the target user)
                                       determine a new patient’s final diagnosis based on the most similar known patterns from
                                       the case base. Also, he can perform adaptation steps of stored rules, according to his
                                       knowledge and actual conditions.
                                            The proposed system is not intended for working with raw medical data. Its use
                                       includes a team consisting not only of medical but also analytical experts. They will prepare
                                       the input data in the required form.

                                       3.2. Data Description and Preparation
                                           HDD (https://www.kaggle.com/redwankarimsony/heart-disease-data) was created
                                      by integrating 4 data samples collected from four different clinics, with the individual data
                                      samples containing the same attributes but additional records. The personal records repre-
                                      sent medical information about people with a positive/negative diagnosis of heart disease.
                                      We started with data preparation. First, it was necessary to join the individual data samples
                                      into one common database, which contained 924 records and 14 attributes (including the
                                      target). In the preprocessing phase we did not fil out the missing values because of the
                                      medical domain specificity avoiding incorrect values imputation. We aggregated the initial
                                      target values into binary target attribute, i.e., 1 to 4 were replaced by 1. After that, the
                                      database contained 415 patients without heart disease and 509 patients with heart disease.
                                      Table 1 describes all the input variables.

                       Table 1. Description of individual attributes and their current values after the transformation.

  Attribute Name                 Attribute Description              Attribute Type                       Range of Values
          age                     Patient’s age in years              Numerical          
          sex                         Patient’s sex                    Binary            (0) men, (1) women
                                                                                         0 (asymptomatic patient),
                                                                                         1 (atypical angina),
          Cp                         Chest pain type                  Categorical
                                                                                         2 (non-anginal pain),
                                                                                         3 (typical angina)
       Trestbps                  Patient’s Blood pressure             Numerical
                             value measured after admission
                                                                                         
                            to the hospital (this is the systolic
                              (upper) blood pressure given
                                    in units of mm Hg)
         Chol                     Blood cholesterol level             Numerical          
         Fbs                  Fasting blood sugar (the value           Binary            0 (patient has a blood sugar level of less than
                           indicates whether the patient has an                          120 mg/dl and therefore does not
                            increased blood glucose level after                          suspect diabetes),
                            8 h of fasting, when the patient ate                         1 (patient has a blood sugar level greater than
                           nothing and drank only clean water)                           120 mg/dl and therefore has
                                                                                         suspected diabetes)
                                                                                         0 (no abnormality was found in the results),
                                                                                         1 (T wave inversion was found in the results
                                                                                         and/or ST segment elevation or depression was
        Restecg                    Resting EKG results                Categorical        greater than 0.05 mV),
                                                                                         2 (the patient was diagnosed with left ventricular
                                                                                         hypertrophy, ie enlarged and densified walls of
                                                                                         the left ventricle of the heart)
Appl. Sci. 2021, 11, 292                                                                                                                  13 of 18

                                                                 Table 1. Cont.

  Attribute Name                Attribute Description                Attribute Type                          Range of Values
        Thalach              Maximum heart rate achieved                Numerical
                            (maximum number of beats the                                   
                           heart can perform in one minute)
        Exang                     Occurrence of chest                     Binary           0 (no), 1 (yes)
                                  pain during exercise
       Oldpeak                ST depression induced by                  Numerical          
                                exercise relative to rest
                                                                                           0 (downsloping),
          Slope                The slope of the peak                    Categorical        1 (flat),
                               exercise ST segment                                         2 (upsloping)
           Ca               Number of major vessels (0-3)               Categorical        0,1,2,3
                              colored by flourosopy
                                                                                           0 (the patient did not have a heart problem),
          Thal                    Thallium heart scan                   Categorical        1 (patient overcame a heart problem),
                                                                                           2 (blood flow is blocked)
          Num                 Diagnosis of heart disease                  Binary           0 (the patient does not have heart disease),
                            (angiographic disease status)                                  1 (the patient has heart disease)
                                    We tested both modules and the whole DSS using the prepared data sample.

                                     3.3. Experiments
                                         We generated several decision models using selected algorithms like ctree, C5.0, rpart,
                                     and C4.5 with the results presented in Tables 2 and 3.

                                       Table 2. The models’ accuracy without the clustering method.

  Ratio      DT Type          %        Ratio     DT Type         %         Ratio      DT Type        %          Ratio   DT Type            %
  60/40                                70/30                               80/20                                90/10
                  ctree     80.6%                    ctree     80.4%                    ctree      82.2%                  ctree       83.3%
                  C5.0      80.6%                    C5.0      78.5%                    C5.0       76.2%                  C5.0        84.5%
                  rpart     86.2%                    rpart     86.6%                    rpart      85.4%                  rpart       84.9%
                  C4.5                               C4.5                               C4.5                              C4.5

                                     Table 3. The models’ accuracy with the clustering method.

                                       Number of Clusters              60/40              70/30                80/20              90/10
                                                 2                   85.1%               86.5%                  87%               87.3%
                                                 3                   87.7%               86.3%                 88.2%              89.4%
                                                 4                   85.1%               88.2%                 85.8%              86.1%

                                           The clustering functionality is primarily designed for large datasets. The HDD is a
                                     relatively small sample; therefore, we used the best model from Table 2. It is visualized in
                                     Figure 8, where we can see that number of rules is 6. Among the most important decision
                                     attributes used for division in not leaf nodes were used attributes thal, age, slope, exang,
                                     and sex.
                                           From this model we extracted the rules and sub-rules. The total number of sub-rules
                                     is 12, and their combinations create a specific rule. For example, the first rule consists of
                                     sub-rules L1, R2, and L3, see Figure 9. The sub-rules mainly contained categorical variables
                                     like thal, slope, sex, exang, and numerical one age.
4                      85.1%             88.2%              85.8%              86.1%
                                    attributes used for division in not leaf nodes were used attributes thal, age, slope, exang,
                                    and The
                                         sex. clustering functionality is primarily designed for large datasets. The HDD is a
                                   relatively small sample; therefore, we used the best model from Table 2. It is visualized in
                                   Figure 8, where we can see that number of rules is 6. Among the most important decision
Appl. Sci. 2021, 11, 292                                                                                                  14 of 18
                                   attributes used for division in not leaf nodes were used attributes thal, age, slope, exang,
                                   and sex.

        Figure 8. The DSS visualizes best decision model based on the accuracy metrics. The color and shade of nodes signalize
        the prevalent class in that node (blue for patients without and pink for patients with heart disease). The box’s first value
        represents the target attribute value—1 (patient suffers from heart disease), 0 (patient doesn’t suffer from heart disease).
        The second value is the probability of occurrence of heart disease. The third value is what percentage of patients in each
        branch who suffer/not suffer from heart disease.
       Figure 8.
      Figure      The DSS
               8. The  DSS visualizes
                            visualizes best
                                          best decision
                                               decision model
                                                         model based
                                                                 based on
                                                                        on the
                                                                           the accuracy
                                                                               accuracy metrics.
                                                                                          metrics. The
                                                                                                   The color
                                                                                                         color and
                                                                                                               and shade
                                                                                                                   shade of
                                                                                                                          of nodes
                                                                                                                             nodes signalize
                                                                                                                                      signalize
       the prevalent
      the  prevalent class
                       class in
                              in that
                                 that node
                                      node (blue
                                            (blue for
                                                   for patients
                                                       patients without
                                                                 without and
                                                                          and pink
                                                                               pink for
                                                                                    for patients
                                                                                        patients with
                                                                                                 with heart
                                                                                                        heart disease).
                                                                                                              disease). The
                                                                                                                        The box’s
                                                                                                                             box’s first
                                                                                                                                    first value
                                                                                                                                          value
                                              From this model we extracted the rules and sub-rules. The total number of sub-rules
      represents   the target   attribute  value—1   (patient  suffers from  heart disease), 0 (patient  doesn’t suffer from  heart
       represents the target attribute value—1 (patient suffers from heart disease), 0 (patient doesn’t suffer from heart disease).   disease).
                                       is 12, and their combinations create a specific rule. For example, the first rule consists of
      The
      The second
            second value
                    value is
                           is the
                               the probability
                                    probability of
                                                 of occurrence
                                                    occurrence ofof heart
                                                                    heart disease.
                                                                          disease. The
                                                                                   The third
                                                                                        third value
                                                                                              value is
                                                                                                     is what
                                                                                                        what percentage
                                                                                                              percentage of
                                                                                                                          of patients
                                                                                                                             patients inin each
                                                                                                                                           each
      branch   who   suffer/not        sub-rules
                                  suffer from  heart L1, R2, and L3, see Figure 9. The sub-rules mainly contained categorical varia-
                                                      disease.
       branch who suffer/not suffer from heart disease.
                                    bles like thal, slope, sex, exang, and numerical one age.
                                        From this model we extracted the rules and sub-rules. The total number of sub-rules
                                   is 12, and their combinations create a specific rule. For example, the first rule consists of
                                   sub-rules L1, R2, and L3, see Figure 9. The sub-rules mainly contained categorical varia-
                                   bles like thal, slope, sex, exang, and numerical one age.

     Appl.                                    9. The DSS visualizes a list of sub-rules
                                       Figure 9.                              sub-rules generated
                                                                                        generated from
                                                                                                  from the
                                                                                                        the best
                                                                                                            best model.
                                                                                                                 model.
     Appl. Sci.
           Sci. 2021,
                2021, 11,
                      11, xx FOR
                             FOR PEER
                                 PEER REVIEW
                                      REVIEW                                                                                        1515of
                                                                                                                                        of 18
                                                                                                                                           18

                                         The other rules were formed by following conjunctions: 2(L1,R2,R3,R4), 3(R1), 4(L1,L2),
                                   5(L1,R2,R3,L4,L5), and 6(L1,R2,R3,L4,R5). Most patients were covered by rule 4, i.e., sub-
                                             The other    rules were formed by following conjunctions: 2(L1,R2,R3,R4), 3(R1),
                                   rule L1The  and other
                                                   L2. rules were formed by following conjunctions: 2(L1,R2,R3,R4), 3(R1),
                                   Figure   9.
                                      4(L1,L2),
                                      4(L1,L2),The DSS visualizes  a listand
                                                  5(L1,R2,R3,L4,L5),
                                                  5(L1,R2,R3,L4,L5),      of sub-rules
                                                                         and            generated from
                                                                              6(L1,R2,R3,L4,R5).
                                                                              6(L1,R2,R3,L4,R5).  Most
                                                                                                   Mostthe best model.
                                                                                                        patients
                                                                                                        patients were
                                                                                                                 were covered
                                                                                                                       covered by
                                                                                                                               by rule
                                                                                                                                  rule 4,
                                                                                                                                       4,
                                         We tested    the similarity calculation     for three new   patients.
                                      i.e., sub-rule  L1  and
                                      i.e., sub-rule L1 and L2.L2.
                                             We
                                             We tested
                                         Patient    no.1the
                                                 tested  the similarity
                                                             similarity calculation
                                                                          calculation for
                                                                                       for three
                                                                                           three new
                                                                                                 new patients.
                                                                                                     patients.
                                      Patient no.1
                                      Patient no.1
                                       age exang thal
                                       1
                                       age56
                                           exang 1
                                                 thal 0
                                       1   56     1     0
                                            DSS found these sub-rules covering the patient 1:
                                          DSS
                                       [1] “L1”
                                               found “R4”
                                                     these sub-rules covering the patient 1:
                                            DSS“R2”
                                                 found these sub-rules covering the patient 1:

                                           The “R2”
                                      [1] “L1”  system   calculated the highest similarity for L1, R2, R3, R4, namely 75% and score
                                                      “R4”
                                      value 1 (operation of insertion in the sub-rule R3). This condition covered 15 historical
                                      patients. The database also contained patients with a 66.67% similarity and 0% covered
                                           The system calculated the highest similarity for L1, R2, R3, R4, namely 75% and score
                                      byThe
                                         sub-rule R1 calculated
                                                       with a score  value of 3.
                                      value 1system                the
                                               (operation of insertion highest
                                                                         in the similarity for L1,
                                                                                 sub-rule R3). ThisR2, R3, R4, namely
                                                                                                    condition   covered 75%  and score
                                                                                                                         15 historical
                                    value 1Tables  in
                                            (operationFigure
                                                          of  10 have
                                                             insertion been
                                                                        in  shown
                                                                           the      to theR3).
                                                                               sub-rule    cardiologist
                                                                                               This     to support
                                                                                                    condition      his decision,
                                                                                                                 covered  15     sug-
                                                                                                                             historical
                                      patients. The database also contained patients with a 66.67% similarity and 0% covered
                                      gesting a new patient’s target attribute classification as 1 (the patient has heart disease).
                                      by sub-rule R1 with a score value of 3.
                                      This situation would occur if the cardiologist did not decide to modify the rules. If the
                                           Tables in Figure 10 have been shown to the cardiologist to support his decision, sug-
                                      cardiologist decides to adapt sub-rules L2 and R2 with the attribute “age”, the result is
                                      gesting a new patient’s target attribute classification as 1 (the patient has heart disease).
                                      visualized on the right side. The boundaries were changed from age < 55.5 to age < 57 and
                                      This situation would occur if the cardiologist did not decide to modify the rules. If the
                                      from age ≥ 55.5 to age ≥ 57. Subsequently, the adapted rules were stored.
                                      cardiologist decides to adapt sub-rules L2 and R2 with the attribute “age”, the result is
We tested the similarity calculation for three new patients.
                                     1    56     1    0
                                         Patient no.1
                                         ageDSS  found
                                             exang thal   these sub-rules covering the patient 1:
                                       1 56      1   0
                                     [1] “L1” “R2” “R4”
Appl. Sci. 2021, 11, 292                                                                                                                       15 of 18
                                               DSS found these sub-rules covering the patient 1:
                                           The system calculated the highest similarity for L1, R2, R3, R4, namely 75% and score
                                        [1] “L1”
                                     value        “R2” “R4” of insertion in the sub-rule R3). This condition covered 15 historical
                                            1 (operation
                                     patients.  The   databasealso
                                     patients. The database       alsocontained
                                                                        containedpatients
                                                                                       patientswith
                                                                                                 with  a 66.67%
                                                                                                     a 66.67%        similarity
                                                                                                                  similarity  andand0%0%     covered
                                                                                                                                         covered     by
                                             The system calculated the highest similarity for L1, R2, R3, R4, namely 75% and score
                                     by sub-rule
                                     sub-rule       R1 with
                                               R1 with        a score
                                                          a score       value
                                                                    value   of 3.of 3.
                                        value 1 (operation of insertion in the sub-rule R3). This condition covered 15 historical
                                           Tables in Figure
                                                       Figure10  10have
                                                                     havebeenbeen shown
                                                                                     shownto to
                                                                                              thethe
                                                                                                  cardiologist
                                                                                                      cardiologist to support   his decision,
                                                                                                                       to support                 sug-
                                                                                                                                       his decision,
                                        patients. The database also contained patients with a 66.67% similarity and 0% covered
                                     gesting a new
                                     suggesting   a newpatient’s   target
                                                           patient’s  targetattribute
                                                                               attributeclassification
                                                                                          classificationasas1 1(the
                                                                                                                 (thepatient
                                                                                                                       patienthas
                                                                                                                               hasheart
                                                                                                                                     heart disease).
                                                                                                                                            disease).
                                        by sub-rule R1 with a score value of 3.
                                     This situation                        the cardiologist did did not
                                                                                                     not decide
                                                                                                          decide to  to modify
                                                                                                                        modify thethe rules.
                                                                                                                                        rules. If
                                                                                                                                                If the
                                                                                                                                                    the
                                             Tables inwould
                                                         Figureoccur
                                                                 10 haveif the
                                                                           beencardiologist
                                                                                   shown to the cardiologist      to support  his decision,    sug-
                                     cardiologist    decides   to  adapt   sub-rules    L2  and   R2  with
                                        gesting a new patient’s target attribute classification as 1the     the    attribute
                                                                                                             (theattribute    “age”,
                                                                                                                             “age”,
                                                                                                                    patient has         the  result
                                                                                                                                            result is
                                                                                                                                 heart disease).      is
                                     visualized
                                     visualized   on the
                                                 on
                                        This situationthewould
                                                           right side.
                                                          right   side. The
                                                                  occurThe    boundaries
                                                                              boundaries
                                                                         if the              were
                                                                                             were
                                                                                  cardiologist      changed
                                                                                                didchanged
                                                                                                     not decide from
                                                                                                               from    age
                                                                                                                    toage
You can also read