Multi Asset Demand Execution - (MADE) Closedown Report - Western Power ...
←
→
Page content transcription
If your browser does not render page correctly, please read the page content below
Multi Asset Demand Execution (MADE)

Multi Asset Demand Execution
(MADE)
Closedown Report
Version Control
 Issue                                                       Date

 1                                                           23.07.2021

Publication Control
 Name                                                        Role

 Matt Watson                                                 Author

 Steve Pinkerton-Clark                                       Reviewer

 Yiango Mavrocostanti                                        Approver

Contact Details
Email
wpdinnovation@westernpower.co.uk

Postal
Innovation Team
Western Power Distribution
Pegasus Business Park
Herald Way
Castle Donington
Derbyshire DE74 2TU

Disclaimer
Neither WPD, nor any person acting on its behalf, makes any warranty, express or implied, with respect to the use of
any information, method or process disclosed in this document or that such use may not infringe the rights of any third
party or assumes any liabilities with respect to the use of, or for damage resulting in any way from the use of, any
information, apparatus, method or process disclosed in the document.
Western Power Distribution 2020

Contains OS data © Crown copyright and database right 2020
No part of this publication may be reproduced, stored in a retrieval system or transmitted, in any form or by any means
electronic, mechanical, photocopying, recording or otherwise, without the written permission of the Innovation
Manager, who can be contacted at the addresses given above
Contents

1.    Executive Summary ------------------------------------------------------------------------------------------------------------------------ 4
2.    Scope and Objectives --------------------------------------------------------------------------------------------------------------------- 6
3.    Success Criteria ----------------------------------------------------------------------------------------------------------------------------- 8
4.    Details of Work Carried Out -------------------------------------------------------------------------------------------------------------- 9
5.    Performance Compared to Original Aims, Objective and Success criteria --------------------------------------------------24
6.    Required Modifications to the Planned Approach during the Course of the Project ---------------------------------------25
7.    Project Costs --------------------------------------------------------------------------------------------------------------------------------26
8.    Lessons Learnt for Future Projects ----------------------------------------------------------------------------------------------------27
9.    Dissemination -------------------------------------------------------------------------------------------------------------------------------29
10.      The Outcomes of the Project --------------------------------------------------------------------------------------------------------30
11.      Data Access Details -------------------------------------------------------------------------------------------------------------------32
12.      Intellectual Property Rights ----------------------------------------------------------------------------------------------------------33
13.      Planned Implementation --------------------------------------------------------------------------------------------------------------34
14.      Contact ------------------------------------------------------------------------------------------------------------------------------------36
Glossary --------------------------------------------------------------------------------------------------------------------------------------------37
1. Executive Summary
The MADE (Multi Asset Demand Execution) project set out to explore the impact of multiple Low Carbon Technologies
(LCTs) in the home on the electricity distribution network, and the potential for reducing this impact by coordinating the
assets.
All scenarios for the transition to 2050 decarbonisation goals present a large proportion of UK homes heated by hybrid
heat pumps, have solar PV panels generating electricity to use at home and export to the grid, a battery system
installed to store the solar generation and also take advantage of cheap renewably-generated electricity from the grid,
and the occupants will drive an EV (Electric Vehicle) which can be charged at home. The project aimed to replicate
this combination of technologies for the first time and integrated within the home to make the most of the combined
flexibility that these technologies have the potential to create and also orchestrated between homes to offer services
to address local grid constraints.
The project was delivered in collaboration with PassivSystems who provided the heating technology, Everoze who
undertook research and modelling, Delta EE who also undertook research and Imperial College who provided the
electricity system analysis.
Following the analysis of the data collected during the project the following findings, learnings and benefits of
coordinated control can be found.
Aggregated, optimised low carbon technologies
Predictive LCT controls that can optimise and coordinate asset behaviour play a key role in delivering best value
from the assets to the consumer as well as harmonising patterns of behaviour desired by the local and national
electricity grid. The greater the level of coordination between the low carbon technologies, the greater the savings
in consumer electricity costs.
Time-varying tariffs can offer significant running cost benefits to consumers with MADE assets. This is in particular
where the battery and heat pump are coordinated to store energy in the right balance between the battery and the
thermal fabric of the building and then making the optimising for available PV generation.
Even slight variations in tariff can introduce demand peaks, for example due to batteries delivering arbitrage.
These peaks can easily be mitigated by a smart control system, at only a small incremental cost to the
householder, as long as the provision of cheap electricity is not significantly reduced.
Smart controls could effectively deliver both Secure and Dynamic Flexible Power services using the MADE
assets, by pre-charging both the battery and the home in advance of the availability window. This though would
needed to be tested.
Consumer benefits from smartly coordinated LCTs
Domestic flexibility provides a notable value opportunity. The Phase 1 desktop modelling work by Everoze
Consultants showed possible savings of up to £260 per annum, per household 1.
Local network benefits from aggregated, reactive LCTs
Analysis by Imperial College 2 has shown that there is significant potential for coordinated control to deliver
distribution network cost savings across different voltage levels and asset types, which can reach £200m to
1 https://www.westernpower.co.uk/downloads-view-reciteme/231478
2 https://www.westernpower.co.uk/downloads-view-reciteme/231487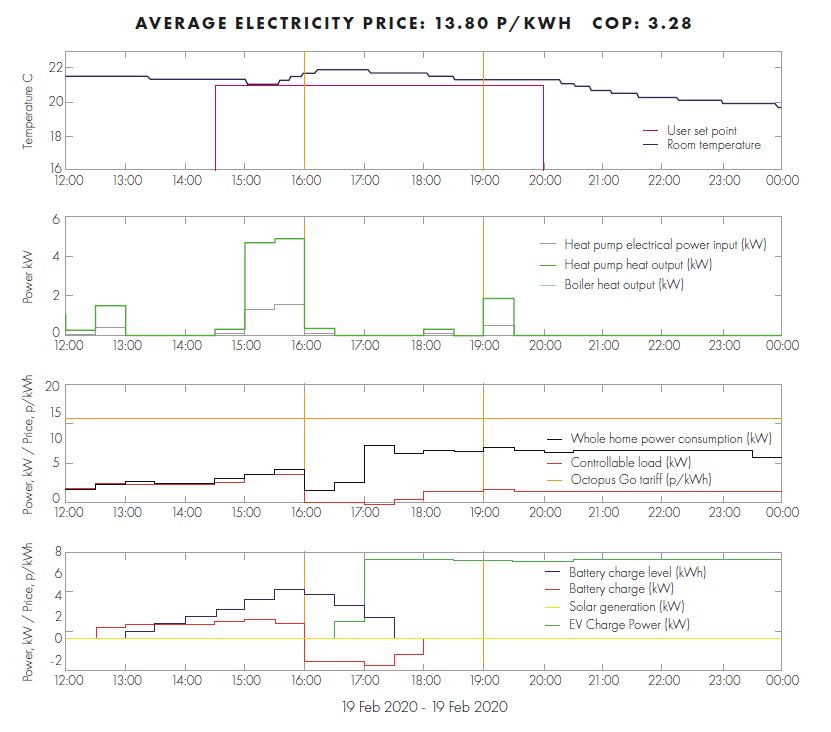
£500m of avoided annualised reinforcement cost by 2035. These add to the savings enabled by smart asset
control and help to offset some of the increased reinforcement spend needed to accommodate the significant load
increase on the network.
In collaboration with PassivSystems, Everoze3 has identified that distribution networks can utilise the MADE
concept by limiting loads to 33% of the 14 kW fuse limit at a property level without compromising household
consumption behaviour and savings that can be achieved (based on half-hourly average loads). There is a
notable potential for using residential consumers to manage peak loads on the network.
The MADE concept offers material peak load shifting potential for the distribution network of between 35% and
40% reduction in peak loads on the network compared to optimised low carbon technologies optimised but in silo
operation (based on half- hourly data).
Whole-system network benefits from peak load shifting
Whole-system case studies run by Imperial College 4 demonstrate that there are opportunities to deliver significant
cost savings by utilising distributed residential flexibility based on the MADE concept. The opportunities for cost
savings increase with the level of uptake of the MADE flexible solution. From the Imperial College research, on
the 2035 horizon, the net benefits of MADE (including the cost of enabling residential flexibility) could reach
between £500m and £2.1bn per year, through allowing the electricity system to achieve the carbon target more
cost-effectively, while at the same time reducing the need for high volumes of peaking generation capacity and
distribution network reinforcements.
3
https://www.westernpower.co.uk/downloads-view-reciteme/231478
4 https://www.westernpower.co.uk/downloads-view-reciteme/231487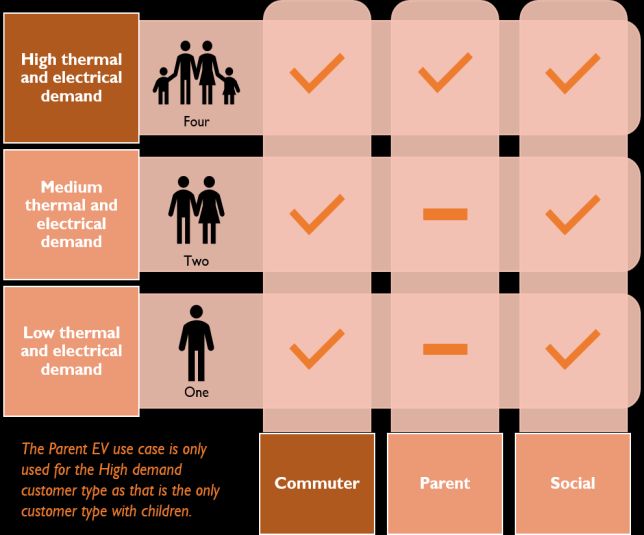
2. Scope and Objectives
When scoping this project, there was a clear understanding that in order to meet the UKs decarbonisation objectives,
a large roll out of LCTs will be required. This requirement has solidified over the duration of the project with the
commitment by the UK Government to achieve Net Zero by 2050 and the recent 10 point plan.
Several innovation trials have highlighted the possibilities for individual LCTs to provide flexibility to the DNO
(Distribution Network Operator) such as Electric Nation, Freedom and Sola Bristol. However, each of these trials has
looked at a single technology in isolation. As such DNOs do not have sufficient understanding as to how these
technologies could interact and whether any potential flexibility is complementary, optimal, or counter-acting.
The research objective of this project was to better understand the feasibility of managing and aggregating multiple
energy assets (EV, hybrid heating system and solar PV) affordably through the use of advanced algorithms to unlock
value from energy markets. Through customer research we also evaluated consumer trust in these new technologies.
This research specifically looked at greater levels of EV charging and heating system control, and designed
appropriate user interfaces and information systems to help drive adoption.
Figure 1: MADE overview
Based on the lessons learned from previous Network Innovation Allowance (NIA) projects, MADE carried out micro-
economic and system-level analysis to extrapolate previous trial findings in order to:
Built a microeconomic model for domestic multi-asset, multi-vector flexibility for the UK today. This identified the
most attractive customer types; Identified the high potential service stacks; Quantified the value (£); Included a
particular focus on DSO (Distribution System Operator) services.
Understood how the combined operation of residential solar PV generation, heat pump systems and smart EV
charging may provide benefits to the consumer;
Assessed the whole-energy system benefits (including network infrastructure) and carbon benefits of large-
scale deployment of the MADE concept;
Considered conflicts and synergies between local community and national level objectives, in the context of the
flexibility enabled by the MADE concept.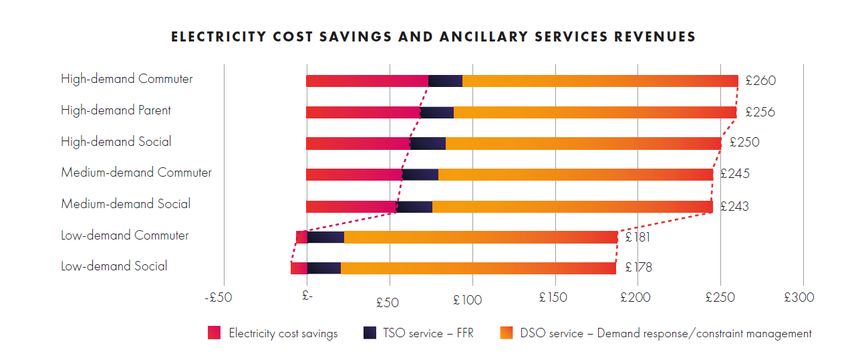
Estimated consumer benefits of the MADE concept and inform the design of the market framework that would
enable consumer to access the revenues that reflect the benefits delivered.
A five home technology trial in South Wales was used to validate the modelled learning.
The project was broken down into six work packages.
Work Package 1: Project Management
PassivSystems carried out the project management for the duration of the 18-month project to deliver the
system design, development and technical feasibility installation.
Work Package 2: Problem definition, approach and trial design
The project consolidated existing information across partners, developing the customer, DSO, local network
and national network proposition, a documented set of use cases, establishing data protection and data
management protocols.
Work Package 3: Modelling: Consumer, Micro-Economic, Local and National GB Network
PassivSystems produced a high level control strategy, simulated the MADE concept (desktop exercise) and
collaborated with Imperial College and Everoze to model the local network, national network and the
microeconomics.
Work Package 4: Hybrid Heat Pump (HHP) /EV/PV Control & Aggregation Solution
PassivSystems designed and developed its smart control to enable optimisation (by cost or carbon) of the EV
charge point, the electric heating asset and the rooftop PV generation. The included the PassivEnergy
platform that aggregates demand across households and enables the demand flexibility to be traded with
energy markets including the DSO.
Work Package 5: Technology Feasibility Trial (maximum of 5 homes)
PassivSystems delivered a five home technology trial, the field trial tested the technology deliverables and
gather data on consumer EV charge and energy system outcomes.
Work Package 6: Technology, Customer and Network Analysis – Dissemination
The project partners delivered an interim and final report on consumer, energy system and business model
outcomes. PassivSystems were responsible for sharing the findings of MADE publically during and after the
project is complete.
The Project Objectives were to:
1. Use the ability of managing multiple energy assets (EVs, hybrid heating systems and solar PV) to switch
between gas and electric load to provide fuel arbitrage and highly flexible demand response services.
2. Demonstrate the potential consumer, network, carbon and energy system benefits of large-scale deployment
of in-home multi-energy assets with an aggregated demand response control system.
3. Gain insights into the means of balancing the interests of the consumer, supplier, and network operators when
seeking to derive value from the demand flexibility.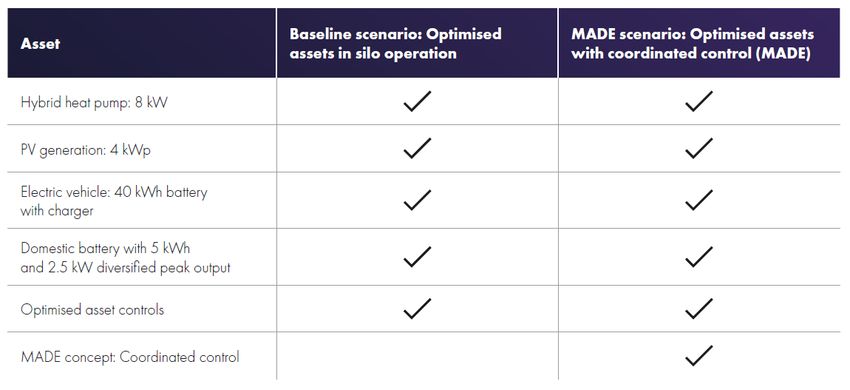
3. Success Criteria
The project success criteria were to develop:
A detailed understanding of technical feasibility of asset coordination (supported by a report and operational
data)
A detailed customer proposition for the MADE concept
A detailed understanding of the customer benefits of the MADE concept (supported by a report and operational
data)
A detailed understanding of the impact of coordinated asset control on the distribution network (supported by a
report and operational data)
A detailed understanding of the whole system benefits of coordinated asset control on the distribution network
(supported by a report)
Dissemination of key results, findings and learning to policy makers, regulators, network operators and suppliers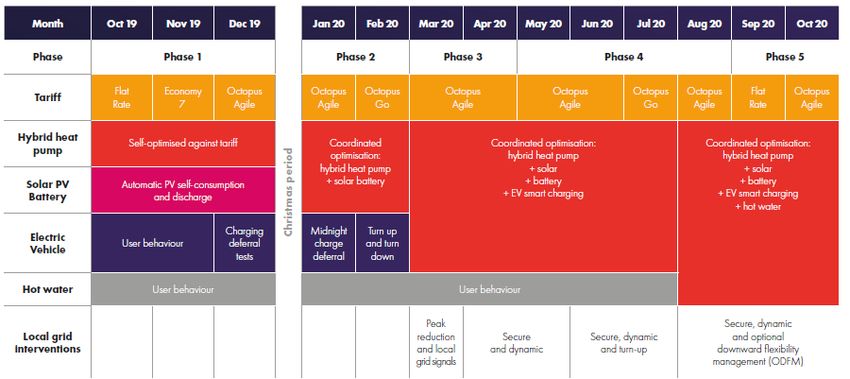
4. Details of Work Carried Out

This section provides a brief summary of the key work carried out within the project. More detail can be found in the
MADE Final Report as well as the project partner sub reports which are available on the WPD innovation website5.

At a high level the work was split into two phases.

      1. The first focussed on delivering modelling work that evaluated the feasibility and benefits of multi-asset co-
         ordination at a household, feeder and whole-system level, alongside customer engagement work.

      2. The second focussed on a technical trial, with 5 homes having PassivSystems multi-asset control, a HHP, EV
         with smart charge point and PV with storage to trial the proposed demand flexibility services. The results of
         this trial were then used to refine the analysis from phase one.

4.1.      Modelling
The key elements of modelling work are detailed in the sections below. More information is available in the various
project learning reports which can be found on the WPD Innovation website.
4.1.1. Techno-economic modelling: Everoze
Everoze Consultants undertook techno-economic modelling to evaluate the feasibility and benefits of multi-asset co-
ordinated delivery of flexibility at a domestic property level.

The full techno-economic modelling analysis report is available on the MADE page of the WPD website.

Approach

Following discussions between project partners, Delta-EE outlined three base customer types, defined by the type of
property and household make-up, to be considered in the modelling. Three EV use cases and transport patterns with
different intensity of EV use were also considered. The base customer types and the EV transport patterns were used
to inform the seven modelling cases, which can be seen in Figure 2.

Figure 2: Seven modelling cases used in the domestic level techno-economic MADE modelling

Two different modelling scenarios were considered for each customer type-EV use case combination:

5
    https://www.westernpower.co.uk/downloads-view-reciteme/231481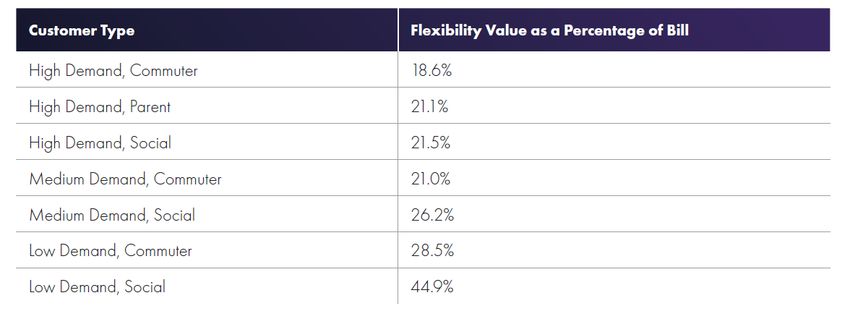
1. Baseline Case which includes a selection of Low Carbon Technology assets with no coordinated flexibility
       provision;
    2. Optimised Case with the Low Carbon Technology assets operating in a coordinated manner (at a residential
       level) for flexibility provision.

Figure 3 details the assumptions made for each of the modelled energy assets in both the baseline and optimised
cases.

Figure 3: Asset operation assumptions in the baseline and optimised cases

The following revenue opportunities were utilised in the modelling:

    ●   Peak Shifting.
    ●   Firm Frequency Response (FFR)
    ●   DSO Services

Results and Conclusions

The estimated flexibility value (£/household/year) accrued is shown in Figure 4. Modelled benefits or ‘value’ from
providing flexibility were calculated as the savings in electricity costs and revenues from ancillary services, less any
cost of additional electricity imports. This does exclude asset capital or operating costs and so ‘value’ does not imply
life-cycle value. It should also be noted that DSO services are highly geographic and as such the revenues shown
below will not be available in all areas. Additionally, price competition may reduce the value available from DSO
services as widespread flexibility increases.

                 Figure 4: Estimated Flexibility Values for the considered property types/EV use cases
The estimated flexibility value as a percentage of household bill is shown below for each customer type.
Table 1: Estimated Flexibility Values as a percentage of household bill for the considered customer types
It should be noted that there is a high degree of variability in the DSO service revenues depending on the type of
service and the cores delivery assumptions. Further sensitivity analysis around these numbers can be found in the full
Everoze report6.
Key findings from the modelling regarding electricity cost savings are as follows:
● Value from peak shifting is sensitive to consumer type: The property demand and consumption patterns,
as well as surplus solar available at the property, have a high degree of sensitivity on cost savings that can be
achieved.
● Value from peak shifting tempered by additional energy imports for ancillary services: The additional
energy cost for providing services has a material effect of reducing the savings in energy costs from peak
shifting. In some cases, this can be higher than the annual savings in energy costs.
● Low demand/EV utilisation customer types are only attractive for DSO services: The value opportunity
from peak shifting and smart charging is low for customer types with low demand and low EV utilisation levels,
and the value stack is heavily reliant on DSO services. For such customer types, if DSO service opportunities
are not available, then there is little benefit from co-ordinated flexibility at the household level.
Key findings from the modelling regarding ancillary services are as follows:
● Value from DSO services can be lucrative but is extremely locationally sensitive: DSO services form a
key part of the value stack but are subject to large variance in value depending the local network constraints
and service need. WPD’s SECURE service offers better value over the year compared to the DYNAMIC
service; although the latter has a higher utilisation tariff, the likelihood of utilisation is lower. The right kind of
DSO service opportunities appropriate for the domestic portfolio would need to be pursued, otherwise,
revenues from DSO services are not attractive.
● Co-ordinated flexibility can help maximise value from DSO service opportunities: A household or a
portfolio of assets being able to offer a higher volume with co-ordinated and combined flexibility from a suite of
battery and EV would be able to maximise value.
● FFR is a less attractive value proposition: FFR is a small portion of the value stack, and so may not be
worth pursuing given metering, testing and associated administration costs unless the entry requirements are
streamlined.
6
https://www.westernpower.co.uk/downloads-view-reciteme/231478Following the trial, Everoze undertook a validation exercise comparing the modelling outputs for the trial home for the
period compared with the real world trial data. These showed good alignment between modelled and real world
operation.
4.1.2. Whole System Modelling: Imperial College London
Imperial College investigated the whole system impact of the MADE concept.
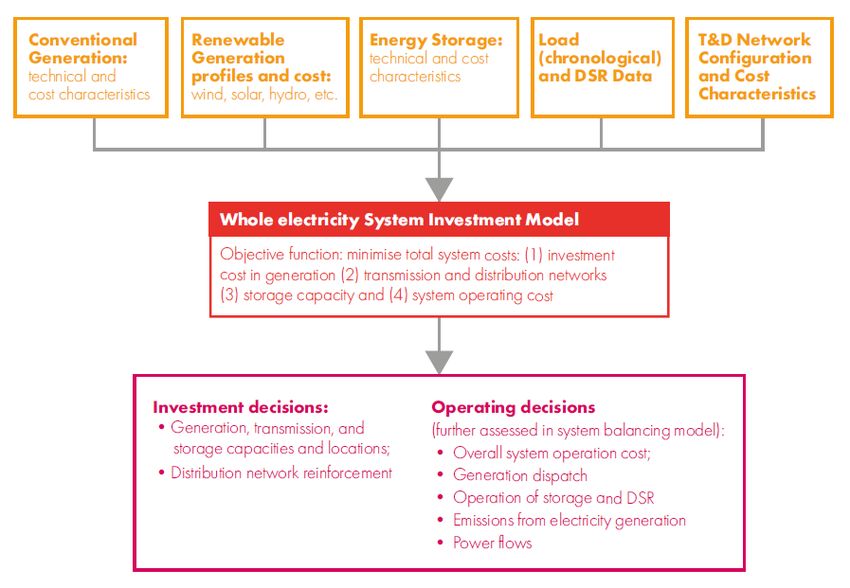
This was carried out using their Whole-electricity System Investment Model (WeSIM), a comprehensive system
analysis model that is able to simultaneously balance long-term investment decisions against short-term operation
decisions, across generation, transmission and distribution systems, in an integrated manner. WeSIM is summarised
in Figure 5 below.
Figure 5: Whole electricity system Investment Model: Imperial College
The full whole-system network modelling analysis report is available on the Project MADE page of the WPD
Innovation website.
Scenarios and key assumptions
Whole-system benefits of the Project MADE concept were quantified for four different levels of uptake of the MADE
solution: 25%, 50%, 75% and 100% (relative to the number of eligible households). For each of the uptake levels the
total system cost is compared to a counterfactual scenario that had a zero uptake of MADE concept but included
some flexibility that would likely be provided even without a large-scale rollout of MADE or a similar solution for
coordinated control of residential flexibility.
Due to the whole-system nature of Imperial College’s modelling approach, the resulting benefits are disaggregated
into components of cost savings, distinguishing between generation investment cost (both low-carbon and
conventional), operating cost and distribution investment cost. The cost of enabling MADE is also included in total
system cost and net benefit figures. Table 2 below defines the baseline scenario and MADE scenarios applied:Table 2: Baseline Vs MADE assets
It should also be noted that the analysis is focused on the benefit accrued to the system, rather than the value that can
be achieved by participants. Routes to market for many of the value streams do not currently exist.
Quantitative results
Total system cost across the five scenarios (counterfactual plus four MADE uptake scenarios) is shown in Figure 6. It
should be noted that the figures for total system cost include the total cost of generation investment and operation
cost, but only include the additional cost of reinforcement of distribution and transmission networks (i.e. do not include
the cost of existing or fixed network assets). Also, the cost of enabling DSR outside MADE households is not included,
although it would be the same across all scenarios and would therefore not affect the estimate of MADE system
benefits. The cost of enabling MADE, i.e. the cost of smart control and residential battery storage is also included in
the charts as a separate category. Total figures are reported using two sets of values, with and without including the
cost of MADE.
Figure 6: Total system cost across different MADE scenarios
The majority of the system cost is associated with investment in low-carbon generation, with sizeable components
associated with conventional generation Capital Expenditure (CAPEX), generation Operational Expenditure (OPEX),
interconnection CAPEX and distribution network reinforcement cost. It can be observed that, if the cost of enabling
MADE is ignored, the total system cost reduces as the uptake level of MADE concept increases. This cost reduction is
the fastest at low MADE uptake levels, whereas at high MADE penetrations there is limited incremental benefit of
increasing the number of MADE households. Once the cost of MADE is included in the total system cost, however,the total cost flattens at higher MADE penetrations between 75% and 100%. This suggests that at high levels of
uptake the incremental system benefits approximately drop to the level of incremental cost of enabling MADE.
To put the above total cost estimates into context, Imperial College’s estimate for the total system cost in 2020 was
around £27bn/yr. Total CAPEX of the existing asset base for both transmission and distribution, not included in the
above figures, has been previously estimated at £2.2bn/yr. and £5.6bn/yr., respectively. Therefore, the system cost in
our estimate for 2035 would be about £9-18bn/yr. higher. Of that increase, about £2.5bn/yr. in the baseline case is the
additional distribution CAPEX, dropping to £0.6bn/yr. in the scenario with 100% MADE uptake. However, it should be
noted that the demand assumed for 2020 was significantly lower due to far lower electrification levels for heat and
transport.
System benefits of a large uptake of the MADE concept across the four scenarios can be found as differences
between a given MADE uptake scenario and the relevant counterfactual (or baseline) scenarios, as shown in Figure 6
savings are reported as annual values, consisting of annual operating costs and annualised investment costs for
different asset types. As in Figure 6, total system cost savings are quantified both as gross benefits (without including
the cost of MADE) and as net benefits (reflecting the cost of enabling MADE).
Net system benefits
Gross system benefits 12
12
Annual system cost savings (£bn/yr)
10
Annual system cost savings (£bn/yr)
10
3.1 8
2.5 1.7 2.1
8
6
6 1.3 0.8
4 0.5
4 0.7 6.2 6.2
7.2 7.6
2 4.5
5.2 3.4
2 3.8
-
- 25% 50% 75% 100%
25% 50% 75% 100% Smart LCT penetration
Smart LCT penetration
Smart LCT savings Additional MADE savings
Smart LCT savings Additional MADE savings
Figure 7: System cost savings by MADE concept: (a) Gross (b) Net
The results in Figure 7 show that in addition to smart LCT controls, the flexibility delivered via MADE solutions can
achieve substantial system benefits in the order of billions of pounds per year, reaching £3.1bn per year in gross,
£2.1bn in net benefits for full MADE penetration. It is also evident that the increase in benefits slows down as the
MADE uptake increases, suggesting diminishing benefits of adding new MADE households to an already significant
number of MADE-enabled homes. Net benefits of MADE are lower and become saturated at high penetration levels.
Key components of MADE-enabled cost savings include:
Reduced investment cost of low-carbon generation: distributed flexibility allows cheaper sources of low-
carbon electricity (e.g. wind or solar PV) to be integrated more efficiently, and therefore to displace other low-
carbon sources (e.g. Carbon Capture and Storage (CCS)) while reaching the same carbon target;
Reduced investment cost of conventional generation: flexible resources can be very effective at reducing peak
demand and therefore greatly reduce the need to maintain a high volume of peaking generation capacity to
secure a sufficient generation capacity margin and the resulting security of supply;
Reduced investment cost of distribution networks: highly distributed flexible resources included in the MADE
concept can help reduce the loading level of local distribution grids and therefore significantly decrease the
requirements to reinforce distribution grids in order to cope with an increase in electricity demand;
Reduced operating cost of low-carbon generation: as shown later, flexibility can also displace the output of
low-carbon generation with relatively higher operating cost, such as CCS or biomass, which is then replaced
by lower-cost generation such as wind generation.
4.1.3. Impact of MADE on the distribution Network: Imperial CollegeAs shown in Imperial College’s earlier studies, significant distribution network reinforcements could be needed to
accommodate the rapid uptake of EVs and HHPs if these assets are not managed in a network-friendly way. Heat and
transport electrification could increase the total cumulative expenditure required on distribution networks by up to
£50bn by 2035 (or £1.8 billion per year in annualised terms). According to earlier analysis, the total replacement cost
of the entire GB distribution network is estimated around £100bn, which makes the £50bn reinforcement cost quite
material.
Utilising distributed flexibility, in particular using smart resources such as residential battery storage, EVs and HHPs,
could significantly mitigate the impact of electrification of heat and transport on distribution network reinforcement
cost. As illustrated in Figure 6 the additional cost of reinforcing GB distribution grids in the baseline scenario (i.e.
without any uptake of MADE concept or smart LCT control) is estimated at £2.7bn/yr. It is worth stressing again that
these are reinforcement costs that are additional to the CAPEX of the already installed asset base, which in the
previous assessments has been estimated at around £5.6bn/yr. With smart LCTs deployed this drops to £1.1bn/yr, a
saving of over £1.5bn/year.
When the coordinated control of the MADE concept is rolled out at 100% uptake level, the distribution network
reinforcement cost drops to £0.6bn/yr, resulting in a further distribution CAPEX savings of £0.5bn/yr.
Figure 8. Breakdown of annualised savings in network reinforcement cost driven by MADE concept across voltage
levels and network topologies
The results show that the total distribution network benefits of rolling out the MADE concept can reach up to £500m in
terms of annualised reinforcement cost, with higher benefits achieved in LV than in HV networks. At higher MADE
uptake levels the distribution network benefits tail off, with very limited additional benefits observed when moving from
75% to 100% penetration.
Within both LV and HV levels the predominant savings come from avoided reinforcement of semi urban networks,
which are characterised by a relatively high number of customers, longer network lengths per customer than urban
networks, and higher proportion of cables as opposed to overhead lines compared to rural networks. Significant
savings also materialise in urban networks, while savings in rural networks are quite low, both due to lower specific
network cost and a lower overall demand.
4.1.4. Business Models: Delta EE
The energy landscape is rapidly evolving and moving from the traditional centralised model (centralised transmission
connected power generation) to one that is decentralised, more customer-centric and lower carbon. This transition is
seeing more value being moved downstream and this is resulting in new ways for domestic customers to access
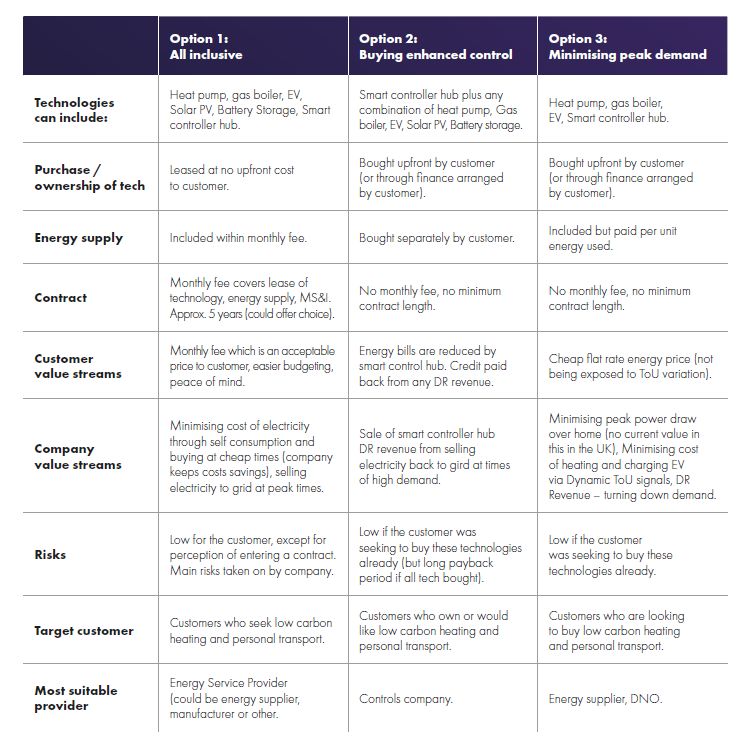
these value streams.As part of MADE, Delta-EE identified customer propositions for business models which could be developed following a large-scale deployment trial. These propositions are built upon a well-used framework for developing business models and customer propositions, and build on insight taken from studying similar business models. These are summarised in the table below: Table 3: Business Models The full business models and consumer propositions report is available on the MADE page of the WPD Innovation website. 4.1.5. Customer Engagement: Delta EE
As part of MADE, Delta-EE also carried out customer research with 750 UK car owners. This exclusively
commissioned customer research was carried out in order to better understand current views around EV ownership
(and usage patterns) as well as third-party control of EV charging. The research was carried out via an online survey
in May 2019, with a panel of UK adults which is close to representative of the broader UK population.
Depending on the technologies owned, survey respondents were directed to answer different sets of questions. The
maximum number of questions answered by any respondent was 38.
The key findings from this survey were as follows:
EV Charging. The most popular place for charging is at home. Most current EV owners charge their EVs for
less than two hours per session. If forced to allow third-party control of their EV charging for the purposes of
Vehicle to Grid (V2G), EV owners are willing to let their batteries discharge to a minimum level of 30%. EV
owners are mostly very positive about the idea of having an app to help them control their charging.
Third-party control. There was a lot of concern around third-party control of charging and heating systems
across all groups. If third-party management of assets is to be accepted, people still want to feel as if they are
ultimately in control at all times and that the third party is helping them save money.
EV and Solar PV owners are higher income and more engaged. One of the apparent trends in the results
is that the EV and solar PV owners tend to be between the ages of 25-49, are more engaged with switching
their energy supplier, tend to have higher incomes (over £64k household income/year) and own their own
homes. They also tend to live in detached homes, which are more likely to have their own driveway (for EV
charging) and more roof space (for installing solar PV panels). The majority are also interested in installing a
battery system. When asked about their attitude towards the environment, they tend to think that they are
doing as much as they can to be environmentally friendly.
Those with electric heating are more engaged. Of the survey respondents, 22% said electric heating was
their main source of heating. A higher proportion of those with electric heating (including heat pumps) had low
emission vehicles, particularly a fully electric car. Those with electric heating also switched suppliers more
often than any other group.
The Laggards. There was a group of respondents, about 10% of the total, who tended to be older (>50), drive
petrol cars and not own solar PV. They were not as interested in being green and do not regularly switch
energy suppliers. They also had little awareness of heat pumps or smart appliances or heating controls.
4.2. Trial
4.2.1. Technical trial deployment
The MADE project consisted of a small field trial of the technologies. The key aims of the technical trial were to:
Improve understanding of the real world complexities of installing hybrid heat pumps, solar PV panels,
batteries and electric vehicle (EV) chargers in homes together with the smart technology required to
coordinate their operation;
Demonstrate how coordinated control can be executed effectively within a real home and understand the
benefits to the consumer;
Collect data which can be used to validate the modelling results produced as part of the project.
The technical trial was designed to answer the following research questions:
How does real-world overall household demand shape (and balance between the assets) change depending
on time-of-use tariffs, level of asset coordination, and over the seasons?
What happens to the peak demand as we move between each scenario?
How can the demand shape be influenced by interventions?4.2.2. Deployment summary
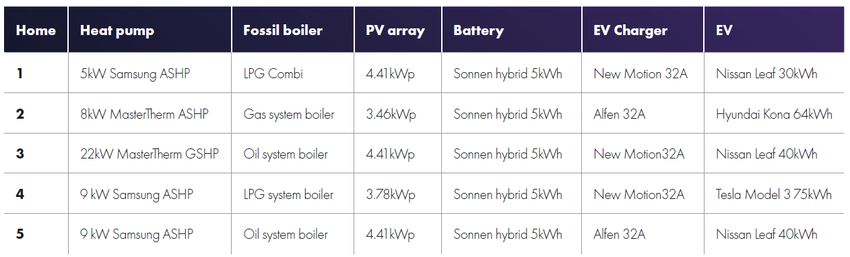
The MADE field trial involved five homes, each of which had all four low-carbon assets.
Table 4 provides details of the installations in each of these homes. Four of the heat pumps (and one EV) were pre-
existing, reducing the need to install new assets under MADE.
Table 4: Summary of the installations in the field trial homes
It should be noted that:
Hybrid heat pumps consist of a legacy fossil fuel boiler supplemented by a heat pump, with their interaction
controlled by a smart control system (see below). The system was configured to maximise heat pump
utilisation wherever possible, in order to emulate a future decarbonised energy system.
Hot water provision is from the fossil fuel boiler until the end of phase 4 of the trial, from phase 5 domestic hot
water production was generated using a combination of a hybrid heat pump and/or smart immersion switch.
Hybrid batteries. The Sonnen batteries were “hybrid” units which meant that there was a direct DC
connection to the battery from the PV panels, utilising a shared inverter for PV export or battery discharge. As
a consequence, PV generation is controllable (downwards) as the battery inverter can have its power limited.
4.2.3. Field trial design
The field trial was divided up into four phases, as outlined in Figure 9 which shows a summary of the trial plan. These
four phases are as follows:
Phase 1: Baseline - The focus was on gathering baseline data about household and asset electrical demand
with the assets largely uncoordinated and hoped to capture some of the problematic scenarios caused by
assets operating independently and synchronizing their activities on tariff transitions;
Phase 2: In-home asset coordination - This phase involved automatic coordination of the operation of the
hybrid heat pump with the battery and solar generation. It also included integrated control of the EV charge
point (although largely manually driven);
Phase 3: Full coordination including EV - This phase involved fully optimised integration of the EV charge
point along with the other assets;
Phase 4: Summertime - The last phase of the project explores the transition of the multi-asset system through
late spring into summer as the availability of solar PV generation starts to dominate the picture/
The project aimed to explore a number of contrasting dimensions simultaneously:
Time of use tariffs: which provide the first level of demand shaping through a straightforward mechanism
which exists in today’s market and rewards the consumer directly. Testing involved three tariff patterns:
(1) flat rate tariffs, set at 14p/kwh as a baseline;(2) Cheap night-time tariffs like Octopus Go, an electricity tariff designed with EV users in mind. It offers
an off-peak unit price of 5p/kWh between 12:30am and 4:30am, with a peak unit price of between 13-
14p/kWh (13.8p/kWh for the MADE trial) outside of these hours, and;
(3) Octopus Agile, an electricity tariff with half-hourly varying energy prices, calculated from wholesale
prices and the peak early-evening Distribution Use of System (DUoS) charges, and updated daily
(day-ahead prices published the evening before). This captures the major national-scale and
distribution-scale drivers which captures the major national-scale and distribution-scale drivers.
Level of asset coordination: as the project progressed, the number of assets with operation coordinated by
optimisation algorithms was increased;
Seasonality: the interplay of the assets changes significantly over the seasons: in winter, heating is dominant
over PV generation, but vice versa in summer;
Interventions: to explore the flexibility of the system to respond to local network needs.
Figure 9: Field trial intervention plan
4.2.4. Field trial results
This sections shows a single example of the type of control implemented. Full details of the field trial results are
available in the full field trial analysis which is available on the MADE page of the WPD website 7.
7
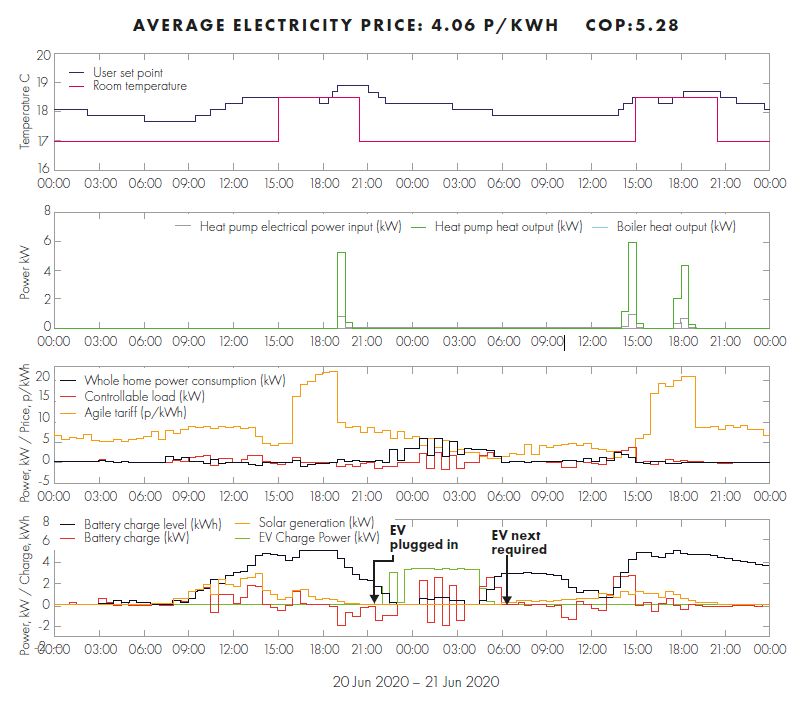
https://www.westernpower.co.uk/downloads-view-reciteme/231490Figure 10 below shows typical operation under the coordinated control strategy implemented in Phase 3 of the trial,
against the Octopus Agile tariff. The following can be observed from the figure:
Room temperature is well maintained, with a minimum of 17.7°C (Celsius) and a maximum of 18.9°C across the
two day period. For reference, the average external temperature was 15.3°C over this same period, with a high of
19.0°C and a low of 13.3°C.
o On day one the home is sufficiently heated in advance of the evening set point due to a high external
temperature and high solar irradiance, and thus no additional heating is required. After the evening Agile
peak tariff period, the heat pump kicks in to ensure that thermal comfort is maintained for the duration of
the evening.
o Day two is less sunny with a lower external temperature, therefore the heat pump is used to bring the
home up to the evening set point, with the bulk of this heating executed when the tariff is at 1.197p/kWh.
Additional heating is required during the Agile peak tariff period; however, the required power is provided
mainly by excess solar generation with some support from the battery when required to ensure the home
remains off grid during this expensive tariff period.
The EV is plugged in at 21:30 on day one, with the user requesting full charge by 06:30 the following morning.
The maximum charge rate for this particular EV is 3.6kW.
There is still some battery charge available when the EV is plugged in. As a result, the EV charges at a reduced
rate in the first half hour interval to match the amount that the domestic battery can discharge, since the tariff is
relatively expensive here compared to the rest of the night at 7.5p/kWh.
Overnight the battery charges up during cheaper tariff periods and discharges during the more expensive tariff
periods to offset EV charging, in order to maximise the consumption of cheap electricity.
At 05:30 the EV reaches full charge in advance of the end time (a buffer is allowed due to the fact the true state of
charge of the vehicle is not known). This is a good example of EV charging being delayed as late as possible to
make use of cheap tariff periods while being confident that sufficient charge is being delivered. On day one the battery charges from excess solar generation, and discharges to meet excess household
consumption.
On day two there is not as much solar and there is higher demand from other uncontrollable loads within the
home, therefore the battery discharges during the day. The battery then charges using electricity imported from
the grid between 13:30 - 15:00 when the electricity price is between 1.1 - 2.1p/kWh to enable the home to be kept
off grid overnight when the electricity price is notably higher.
Figure 10: Fully coordinated control on the Octopus Agile tariff (Home 01, 20/06/2020 - 21/06/2020)
4.2.5. Interventions
Building from the response to tariffs, a number of direct DNO interventions were also trailed based on WPD’s Flexible
Power service. An example is shown below.
Figure 11 below shows a Secure style Flexible Power intervention from Phase 2 of the project, prior to EV
coordination being implemented. Thus, in this example controllable load refers to heat pump and battery power. For
this intervention, the home was given advance notice to minimise import (or maximise export) between 16:00 - 19:00,
using the heat pump and battery.
The following can be observed from the figure:
The home is overheated slightly in advance of the intervention period. This enables the set point to be met
throughout the duration of the intervention period, without the need to run the heat pump during this time.
The battery charges up in advance of the Flexible Power intervention period and then discharges over the
intervention period, leading to negative overall controllable load.
At this stage of the project, controllable load involved the heat pump and battery, but not the EV. On this day
the EV was plugged in at 17:00 leading to a large increase of grid import, but the system could not yet shiftthe load away from the Secure intervention period. This demonstrates a clear use case where fully
coordinated control across all assets in the home would be advantageous.
Figure 11: Smart controls can effectively deliver both Secure and Dynamic Flexible Power services using the MADE
assets, by pre-charging both the battery and the home in advance of the availability window.
4.2.6. Simulations
The initial trial results presented real world examples of key behaviour patterns from the MADE project, and through
this the benefits of coordinated control were illustrated. However, it is hard to produce clear comparisons between
different scenarios (such as the level of asset coordination) because the real world always introduces significant
amounts of uncontrollable variability. Comparisons could be carried out simultaneously between different houses, but
this is not possible with such a small portfolio because each house is different; and comparisons between different
days are confounded by factors such as temperature, solar irradiation and user behaviour. As a consequence,
simulation work has been carried out to allow illustration of a more direct comparison between different control
strategies. The results of this simulation work are presented in this section.
The approach was to execute multiple simulation runs with the same inputs, but to exercise different control strategies
(such as the level of asset coordination) and provide insight into consumer cost savings.
Simulations have been carried out for two different scenarios:
Day-ahead predictions with varying levels of asset control these focus on the predictive optimisation
calculation within the PassivSystems control system and contrast the different outputs that it produces for
varying levels of asset coordination. The purpose of these simulation runs was to illustrate how asset demand
shape changes with increasing levels of control.
Two day simulations runs with varying levels of asset control: these cover optimisation over a longer
time period and are more closely aligned with likely real world performance. The purpose of these simulation
runs was to provide examples of consumer cost savings associated with increasing levels of control.An example of the day ahead simulations is shown below. A digital twin of MADE Home 5 was used to perform these optimisation calculations, for the 23rd April as of 00:00. On this day the house requires some heat from the hybrid heat pump, and we assume that the EV is assumed to require 30kWh of charge by 07:00, the battery is assumed to have 1kWh of charge at the start of the optimisation window and optimisation is performed against the Octopus Agile tariff. Figure 12 below shows the optimisation output under the Phase 1, 2 & 3.
Figure 12: Smart controls can effectively deliver both Secure and Dynamic Flexible Power services using the MADE
assets, by pre-charging both the battery and the home in advance of the availability window.
The following can be observed.
In Phase 1:
The heat pump deliberately overheats the house during the middle of the day to make the most of free solar
PV generation and to avoid having to run during the peak period but is unaware that the battery would have
been able to store this energy more efficiently for later consumption. The house is heated to a maximum of
22.6°.
The battery charges from excess solar and discharges to meet excess household load, but is not aware of the
Agile pricing, so is not able to reduce the impact of the peak Agile period (it would have been more cost
effective to fully charge the battery beforehand with grid import).
No EV optimisation is performed, and thus the EV simply charges at full power at the start of the day. There is
no coordination with the battery, therefore the only battery use during the EV charge session is when the
battery discharges the 1kWh of charge it begins the day with as early as possible, despite the fact that this is
actually the cheapest half hour period during the session.
In Phase 2:
Coordination between the heat pump and battery means that less heat needs to be stored in the fabric of the
home (relatively inefficient) and the battery can be used instead to store PV for later use (and avoiding the
peak period). The home is heated to a maximum temperature of 22.0° vs 22.6° in the previous example, and
the heat pump is able to run in the peak period utilising stored battery power. Note that the coordination
algorithm decides to use both storage mediums operating in tandem as the most efficient strategy.
The battery now charges between midnight and 3am to arbitrage the more expensive electricity between 3am
and 6am.
The EV still charges at full power at the start of the day.
In Phase 3:
During the day, the heat pump and battery operate exactly the same as the previous example.
The EV charge power is now optimised, with the EV charging during the cheapest overnight tariff periods.
Under full coordination, the battery now charges more heavily in the first part of the night in order to be able to
discharge 4am-7am to meet EV and heat pump load, avoiding the more expensive electricity at this
time. During this more expensive period the EV charge rate (usual maximum 7.3kW) is reduced in line with
the maximum battery discharge power (2.5kW) while being confident (through prediction) that the required EV
charge level will be met in time.5. Performance Compared to Original Aims, Objective and Success
criteria
Table 5: Performance compared to Objectives
Objectives Status
Use the ability of managing multiple energy assets Complete: This has been shown within the trial
(EVs, hybrid heating systems and solar PV) to switch
between gas and electric load to provide fuel arbitrage
and highly flexible demand response services.
Demonstrate the potential consumer, network, carbon Complete: This has been shown in the revised
and energy system benefits of large-scale deployment modelling
of in-home multi-energy assets with an aggregated
demand response control system.
Gain insights into the means of balancing the interests Complete: This has been shown in the revised
of the consumer, supplier, and network operators when modelling
seeking to derive value from the demand flexibility.
Table 6: Performance compared to Success Criteria
Success Criteria Status
A detailed understanding of technical feasibility of asset Complete: This has been shown within the trial.
coordination (supported by a report and operational The control strategy has been implemented and
data). the results assessed.
A detailed customer proposition for the MADE concept. Complete: the business modelling work in the first
period highlighted the potential propositions for
customers.
A detailed understanding of the customer benefits of Complete: the micro-economic model and analysis
the MADE concept (supported by a report and conducted by Everoze highlights the customer
operational data). benefits of the project.
A detailed understanding of the impact of coordinated Complete: This has been assessed by Imperial
asset control on the distribution network (supported by College London.
a report and operational data).
A detailed understanding of the whole system benefits Complete: This has been assessed by Imperial
of coordinated asset control on the distribution network College London.
(supported by a report).
Dissemination of key results, findings and learning to Complete: WPD, PassivSystems and the project
policy makers, regulators, network operators and partners have presented at a number of events and
suppliers. the project has been referenced in several
publications.6. Required Modifications to the Planned Approach during the Course of the Project Following the impact of COVID 19 lockdown on asset usage patterns the timeframe of the field trial was extended to allow for more testing in a heating season. This additional time was accommodated within the existing project timescales and the change was managed in accordance with WPD Innovation change management procedures.
7. Project Costs

The project has progressed well against the budget and is currently tracking a slightly lower spend than expected.
Table 7 summarises the details of the progress that has been made with respect to the project budget.

Table 7: Project Costs

                                                Actual Spend       Variance to      Variance to
   Spend Area              Budget (£k)
                                                (£k)               Budget(£k)       Budget %
   WPD Project
                           £81,221              £75,850            -£5,371          -6%
   Management

   PassivSystems
                           £1,357,000           £ 1,357,001        +£1              0%
   costs

   Contingency             £116,825             £0                 £0               0%

   Partner
                           £100,000             £100,000                            0%
   Contribution

   TOTAL                   £1,655,046           £1,532,851         £5,370           0%
8. Lessons Learnt for Future Projects
Throughout the project we have gained extensive learning about how coordinate control of LCTs and be implemented
and the value it creates. This is detailed in the final project report and the accompanying sub reports and summarised
below.
Capabilities of coordinated control
Predictive LCT controls that can optimise and coordinate asset behaviour play a key role in delivering best value
from the assets to the consumer as well as negotiating patterns of behaviour desired by the local and national
electricity grid. The greater the level of coordination between the low carbon technologies, the greater the savings
in consumer electricity costs.
Time-varying tariffs can offer significant running cost benefits to consumers with MADE assets, particularly where
the battery and heat pump can be coordinated to store energy in the right balance between the battery and the
thermal fabric of the building and making the right decisions about waiting for available PV generation.
Even slight variations in tariff can introduce demand peaks, for example due to batteries delivering arbitrage.
These peaks can easily be mitigated by a smart control system, at only a small incremental cost to the
householder, as long as the provision of cheap electricity is not significantly reduced.
There are a number technical challenges associated with coordinating control of assets. These range from
difficulties integrating with proprietary systems to subtleties like not triggering “sleep mode” on certain vehicles.
Traditional control of heating comfort has focussed on hitting minimum temperature requirements. However with
the advent of negative electricity pricing, maximum temperatures must all be considered to prevent the homes from
overheating.
Under certain price conditions, the batteries were doing two cycles a day:
o Charge using very cheap overnight electricity, discharge to meet morning heating demand
o Charge prior to Agile peak and discharge over peak
This is an interesting learning given that batteries are typically designed with one cycle per day in mind.
Smart controls can effectively deliver both Secure and Dynamic Flexible Power services using the MADE assets,
by pre-charging both the battery and the home in advance of the availability window.
Benefits from coordinated LCT control
It is important to be clear on baseline behaviour when looking to establish the value of the services. The value of
coordinated control should not encompass the wider value of individual smart control, but focus on the net
additional value of coordination.
Domestic flexibility provides a notable value opportunity. The Phase 1 desktop modelling work by Everoze
Consultants showed the potential for customers to save up to £260 per annum8,. The technical trial completed in
Phase 2 enabled Everoze to carry out some additional validation of this estimate. Further work would be required
though in order to fully validate these savings and this could be part of a much larger roll out of this technology.
Analysis by Imperial College9 has shown that there is significant potential for coordinated control to deliver
distribution network cost savings across different voltage levels and asset types, which can reach £200m to
8 https://www.westernpower.co.uk/downloads-view-reciteme/231478
9 https://www.westernpower.co.uk/downloads-view-reciteme/231487£500m of avoided annualised reinforcement cost by 2035. These add to the savings enabled by smart asset
control and help to offset some of the increased reinforcement spend needed to accommodate the significant load
increase on the network.
In collaboration with PassivSystems, Everoze has identified that distribution networks can utilise the MADE
concept by limiting loads to 33% of the 14 kW fuse limit at a property level without compromising household
consumption behaviour and savings that can be achieved (based on half-hourly average loads). There is a
notable potential for using residential consumers to manage peak loads on the network.
The MADE concept offers material peak load shifting potential for the distribution network of between 35% and
40% reduction in peak loads on the network compared to optimised low carbon technologies optimised but in silo
operation (based on half- hourly data).
Whole-system case studies run by Imperial College demonstrate that there are opportunities to deliver significant
cost savings by utilising distributed residential flexibility based on the MADE concept. The opportunities for cost
savings increase with the level of uptake of the MADE flexible solution.9. Dissemination
Throughout the project, the project team have strived to share learning from the project as it became available.
A summary of some of the key stakeholders and events are listed below.
The Project had a poster disseminated at the CIRED 2020 workshop in, Berlin. The project partners have also presented
MADE on a number of different occasions between April 2020 and September 2020. The aim was to create learning
opportunities for many key external stakeholders, particularly the wider DNO community, electricity suppliers, charitable
bodies, and third sector organisations. Below is a list the key of events and organisations to whom we have
disseminated:
Quarterly project briefings to BEIS Science & Innovation and Heat Policy Teams;
Briefing for Jonathan Brearley the Chief Executive of Ofgem;
Direct engagement with UK Power Networks, Scottish and Southern Networks & Northern Powergrid;
National Grid ESO Innovation team;
University College London;
Policy Connect;
Energy Systems Catapult;
Elexon
Cardiff University & Exeter University
InnovateUK;
Welsh & Scottish Governments;
Flexibility First Forum;
EnergyUK; members of the Retail, Generation, and Strategic Policy and Public Affairs teams.
British Standards Institute;
Scottish Renewables Conference
International Energy Agency
Policy UK
Westminster Forum;
Project Partners have also disseminated to organisers that could deploy the technology commercially, to help introduce
new revenue streams, develop new consumer propositions and support future housing developments. The following
organisers have received presentations from MADE project partners:
Shell Energy
So Energy
EDF Energy
Octopus Energy
Tonik Energy
Barratt Homes PLC
Sero Homes
Unite Students
The project was referenced in the EnergyUK; Barriers to Flexibility Delivering the potential benefits of a smart flexible
energy system in the transition to net zero report.
Finally, we also undertook dissemination to wider audiences through WPD innovation events (Balancing Act and
Innovation Showcase), Project specific webinars (interim and final results) as well as industry conferences (Solar
Storage Live).You can also read