RSG Deployment Case Testing Results - SL Owsley Jr MG Dodson BK Hatchell September 2005 Prepared for the U.S. Department of Energy under Contract ...
←
→
Page content transcription
If your browser does not render page correctly, please read the page content below
PNNL-16506

RSG Deployment Case Testing Results

SL Owsley Jr         TA Seim
MG Dodson            DL Alexander
BK Hatchell          WT Hawthorne

September 2005

Prepared for the U.S. Department of Energy
under Contract DE-AC05-76RL01830
DISCLAIMER

This report was prepared as an account of work sponsored by an agency of the
United States Government. Neither the United States Government nor any agency
thereof, nor Battelle Memorial Institute, nor any of their employees, makes any
warranty, express or implied, or assumes any legal liability or responsibility
for the accuracy, completeness, or usefulness of any information, apparatus,
product, or process disclosed, or represents that its use would not infringe
privately owned rights. Reference herein to any specific commercial product,
process, or service by trade name, trademark, manufacturer, or otherwise does not
necessarily constitute or imply its endorsement, recommendation, or favoring by
the United States Government or any agency thereof, or Battelle Memorial
Institute. The views and opinions of authors expressed herein do not necessarily
state or reflect those of the United States Government or any agency thereof.

            PACIFIC NORTHWEST NATIONAL LABORATORY
                               operated by
                               BATTELLE
                                  for the
              UNITED STATES DEPARTMENT OF ENERGY
                   under Contract DE-AC05-76RL01830

                        Printed in the United States of America

                    Available to DOE and DOE contractors from the
                     Office of Scientific and Technical Information,
                        P.O. Box 62, Oak Ridge, TN 37831-0062;
                                     ph: (865) 576-8401
                                    fax: (865) 576-5728
                              email: reports@adonis.osti.gov

        Available to the public from the National Technical Information Service,
       U.S. Department of Commerce, 5285 Port Royal Rd., Springfield, VA 22161
                                    ph: (800) 553-6847
                                    fax: (703) 605-6900
                             email: orders@ntis.fedworld.gov
                    online ordering: http://www.ntis.gov/ordering.htm

                        This document was printed on recycled paper.
                                          (9/2003)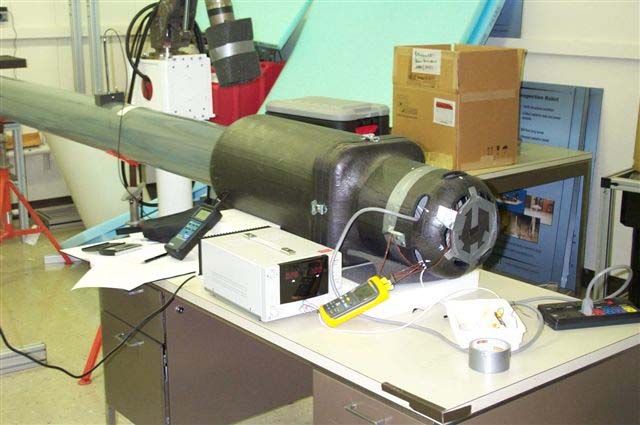
RSG Deployment
Case Testing Results

Authors:
Stan Owsley
Mike Dodson
Brian Hatchell
Tom Seim
Dave Alexander
Woody Hawthorne-Northrup Grumman Information Technology

September 2005
ii
RSG Deployment Case Design and Testing Parameters ..........................................................................................1

DESIGN PROCESS ....................................................................................................................................................1

SYSTEM REQUIREMENTS .....................................................................................................................................2
    Humidity ...................................................................................................................................................................2
    High Temperature.....................................................................................................................................................2
    Low Temperature......................................................................................................................................................2
    Temperature Shock ...................................................................................................................................................2
    Altitude......................................................................................................................................................................2
    Rain...........................................................................................................................................................................2
    Vibration ...................................................................................................................................................................2
    Shock.........................................................................................................................................................................2
    Acoustic.....................................................................................................................................................................2
    Magnetic Field Radiated Emissions .........................................................................................................................3
    Electric Field Radiated Emissions............................................................................................................................3
    Electric Field Radiated Susceptibility.......................................................................................................................3
    System Reliability......................................................................................................................................................3

TESTING OVERVIEW..............................................................................................................................................4
    High Temperature.....................................................................................................................................................4
    Low Temperature......................................................................................................................................................4
    Temperature Shock ...................................................................................................................................................4
    Altitude......................................................................................................................................................................4
    Rain...........................................................................................................................................................................4
    Humidity ...................................................................................................................................................................4
    Vibration ...................................................................................................................................................................4
    Shock.........................................................................................................................................................................5
    Acoustic.....................................................................................................................................................................5
    Magnetic Field Radiated Emissions .........................................................................................................................5
    Electric Field Radiated Emissions............................................................................................................................5
    Electric Field Radiated Susceptibility.......................................................................................................................5
    System Reliability......................................................................................................................................................5

TESTING RESULTS ..................................................................................................................................................6
    Humidity ...................................................................................................................................................................6
    High Temperature.....................................................................................................................................................7
    Low Temperature......................................................................................................................................................7
    Temperature Shock ...................................................................................................................................................7

                                                                                    iii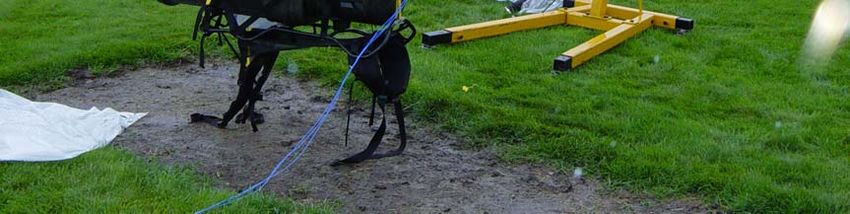
Altitude......................................................................................................................................................................8
    Rain.........................................................................................................................................................................11
    Vibration .................................................................................................................................................................14
    Shock.......................................................................................................................................................................20
    Acoustic...................................................................................................................................................................34
    Magnetic Field Radiated Emissions .......................................................................................................................45
    Electric Field Radiated Emissions..........................................................................................................................46
    Electric Field Radiated Susceptibility.....................................................................................................................47
    System Reliability....................................................................................................................................................47

Appendices .................................................................................................................................................................49

                                                                                    iv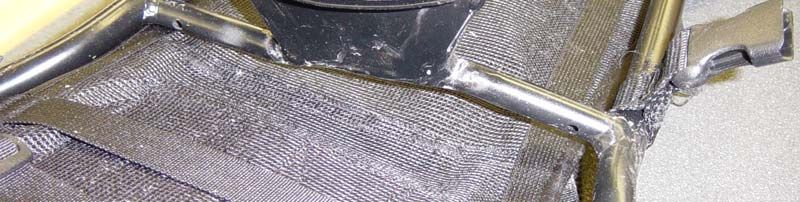
RSG Deployment Case Design and Testing Parameters
DESIGN PROCESS
The RSG deployment case design is centered on taking the RSG system and producing a
transport case that houses the RSG in a safe and controlled manner for transport. The transport
case was driven by two conflicting constraints, first that the case be as light as possible, and
second that it meet a stringent list of Military Specified requirements. The design team worked
to extract every bit of weight from the design while striving to meet the rigorous Mil-Spec
constraints. In the end compromises were made primarily on the specification side to control the
overall weight of the transport case.
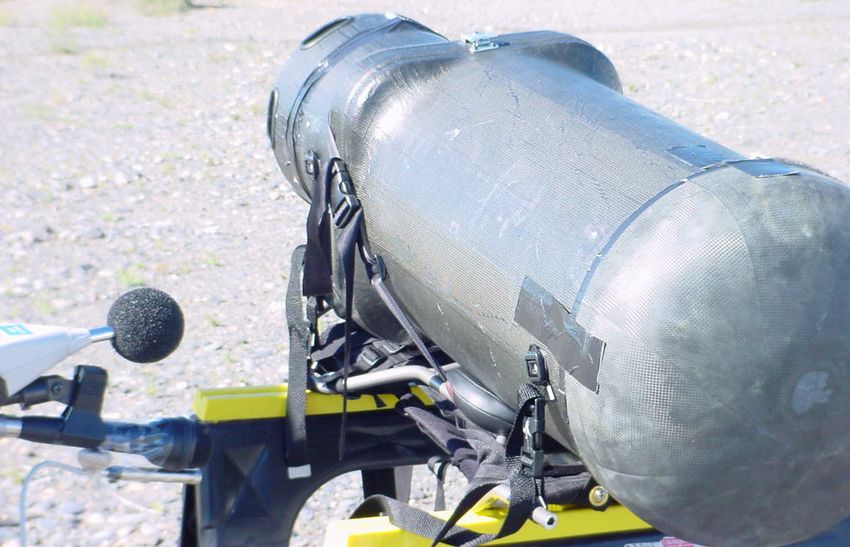
Figure 1 55 Watt Transport Full Case
The backbone of the transport system is a commercial backpack frame. These were procured
from a well known company and modified as required for the project. The RSG itself was
packaged inside a pair of rigid plenum components that housed the top and bottom with a
composite flow guide between them to duct cooling air. The entrance plenum holds a
thermostatically controlled fan that operates in response to the cooling requirements of the RSG.
Surrounding the rigid housing components are closed-cell foam components that suspend the
RSG and the previously mentioned components in the case shell. The foam was selected for
both its energy absorption and temperature performance characteristics. Housing all of the
interior components are the case outer shell and cover. These components are fabricated from
graphite composite material. Mounted externally to the composite case are the rain cover and the
electrical box. The latter contains the control circuitry for the cooling fan which operates
autonomously unless it is overridden manually by an operator.
1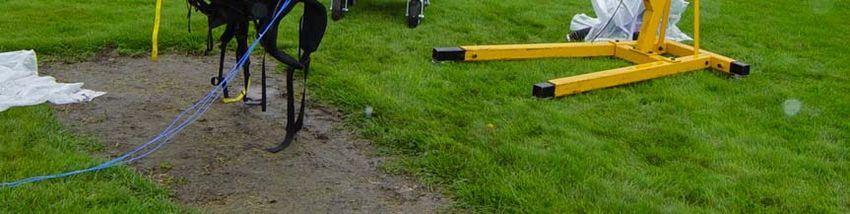
SECTION VIEW OF COMPONENTS

Appendix A, B, and C contains material specifications for materials used in the construction of
the transport case and components.

At the project inception, the transport case was required to conform and pass the following Mil-
Spec.:

                                SYSTEM REQUIREMENTS
Humidity, MIL-STD-810F, Method 507.4 (10% to 100%, including direct condensation)

High Temperature, MIL-STD-810F, Method 501.4 Procedure I, 50degree C

Low Temperature, MIL-STD-810F, Method 502.4 Procedure I, -32degree C

Temperature Shock, MIL-STD-810F, Method 503.4, Procedure I, temperature shock
requirement at the extremes (-32 degrees C to 50 degrees C)

Altitude, MIL-STD-810F, Method 500.4 Procedure I, 15,000’

Rain, MIL-STD-810F, Method 506.4 Procedure I

Vibration, MIL-STD-810F, Method 514.5 Cat 24 both general use and helicopter material for
duration of 60 minutes in each three orthogonal axes for a total test time of 3 hours.

Shock, MIL-STD-810F, Method 516.5 Procedure IV, tailored for 18” drop on to compact soil.

Acoustic, Shall not exceed the 30 meter acoustic non-detectable limit as defined in Table 2-II –
Quietest Area Ambient Noise Level in Table 2-III of MIL-Stand-1474D when measured at a
distance of 2 meter.

                                             2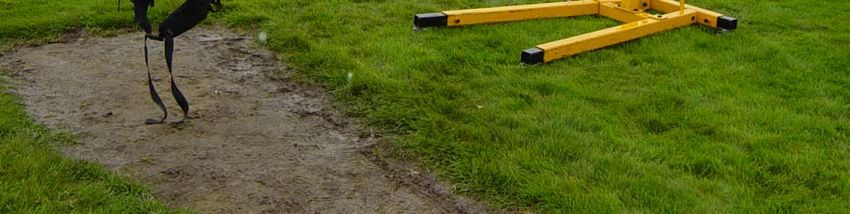
Magnetic Field Radiated Emissions, MIL-STD-461E RE101, Radiated Emissions, 10 KHz to
18GHz.

Electric Field Radiated Emissions, MIL-STD-461E RE102, Radiated Emissions, 10 KHz to
18GHz

Electric Field Radiated Susceptibility, MIL-STD-461E RE103, Radiated Susceptibility,
Electric Field, 10 KHz to 18GHz

System Reliability, MIL-HDBK-217F, 0.999 reliability per year

                                           3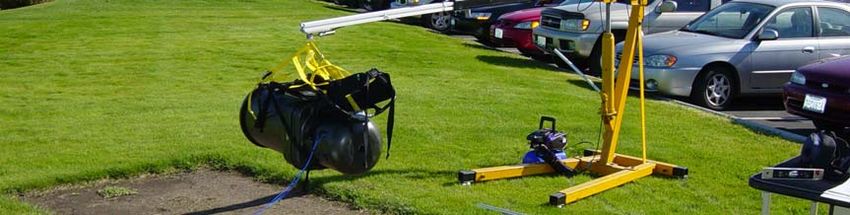
TESTING OVERVIEW
Over the course of the design and testing the following modifications to these requirements were
made at the direction of the sponsor.

High Temperature, MIL-STD-810F, Method 501.4 Procedure I, 50degree C

A modified test program was performed on the electronics package at PNNL. The test sequence
was shortened in time duration, but full temperature range was exercised in the test. The
electronics system operated at all check points. The sponsor accepted the results with
temperature specifications for all materials used in design.

Low Temperature, MIL-STD-810F, Method 502.4 Procedure I, -32degree C

A modified low temperature test was performed on the electronics package at PNNL. The
qualified chamber was only capable of a low temperature of -18C. The electronics were checked
for operation during the test sequence and the system functioned as required. Sponsor accepted
test with temperature specifications for all materials used in the design.

Temperature Shock, MIL-STD-810F, Method 503.4, Procedure I, temperature shock
requirement at the extremes (-32 degrees C to 50 degrees C)

Temperature shock test were conducted at the beginning of the Low Temperature test when the
case was placed in the -18°C chamber from 22°C room temperature. At the end of the Low
Temperature testing the case environment changed from -18°C chamber to the room temperature
of 22°C. All systems functioned as expected before and after testing.

Altitude, MIL-STD-810F, Method 500.4 Procedure I, 15,000’

Altitude testing was not performed per procedure. A cooling test was performed at PNNL and
the results extrapolated to altitude conditions. Sponsor accepted results.

Rain, MIL-STD-810F, Method 506.4 Procedure I

System passed rain testing. Test was performed at a laboratory with NIST traceable
instrumentation, but laboratory did not have full Mil-Spec. accreditation. Sponsor approved test
site and results.

Humidity, MIL-STD-810F, Method 507.4 (10% to 100%, including direct condensation)

The humidity test was not performed by request of sponsor. A discussion of data that defend the
decision to wave this test is in a later section.

Vibration, MIL-STD-810F, Method 514.5 Cat 24 both general use and helicopter material for
duration of 60 minutes in each three orthogonal axes for a total test time of 3 hours.

                                             4
System passed vibration testing. Test was performed at a laboratory with NIST traceable
instrumentation, but laboratory did not have full Mil-Spec. accreditation. Sponsor approved test
site and results.
Shock, MIL-STD-810F, Method 516.5 Procedure IV, tailored for 18” drop on to compact soil.
System failed shock test original criteria, sponsor accepted results. Tests were performed at
PNNL.
Acoustic, Shall not exceed the 30 meter acoustic non-detectable limit as defined in Table 2-II –
Quietest Area Ambient Noise Level in Table 2-III of MIL-Stand-1474D when measured at a
distance of 2 meter.
System passed test performed at PNNL and was accepted by sponsor.
Magnetic Field Radiated Emissions, MIL-STD-461E RE101, Radiated Emissions, 10 KHz to
18GHz.
System passed test performed at qualified laboratory.
Electric Field Radiated Emissions, MIL-STD-461E RE102, Radiated Emissions, 10 KHz to
18GHz
System failed one portion of the test performed at qualified laboratory, sponsor accepted test
result, and waived compliance.
Electric Field Radiated Susceptibility, MIL-STD-461E RE103, Radiated Susceptibility,
Electric Field, 10 KHz to 18GHz
System failed one portion of the test, sponsor accepted test result, and waived compliance.
System Reliability, MIL-HDBK-217F, 0.999 reliability per year
System fails operation for a full year, but the system will meet the 0.999 reliability for a full
month of operation at extreme temperatures. Sponsor accepted deviation with the
expectation that the system will not actually operate any longer than a week during
deployment.
5TESTING RESULTS
Humidity, MIL-STD-810F, Method 507.4 (10% to 100%, including direct condensation)
The humidity test is designed to determine the susceptibility of components to high humidity
conditions under varying temperature. This test is inappropriate for systems that are hermetically
sealed or that have commercial subsystems that carry certifications to the same test conditions.
In this case, the commercial fan has such qualifications from the manufacturer. The custom
electronic package is sealed in a metal box and has all seams and connectors waterproofed. The
system was operated in an environmental chamber for the High Temperature test which ran the
system under power through changing temperature conditions. With the system sealed, the
internal components will only react to the temperature changes. Thus the high temperature
profile tests can take the place of the humidity tests. The program also performed the rain test
which had direct impingement of water on the control electronics box. Both tests were passed
without incident.
Environmental Chamber Test #1
30
25
Fan On
Delta Temp. C
20
15
10
Fan Off
5
0
0 5 10 15 20 25 30
Hours
Figure 3 Environmental Chamber Test
6High Temperature, MIL-STD-810F, Method 501.4 Procedure I, 50degree C
Testing was preformed at PNNL in an environmental test chamber. This chamber has NIST
traceable instrumentation. One of the completed electronic control systems was placed in the
chamber and all of the connections to the fan and the four control thermistors were made. The
two control thermistors that are mounted on the RSG were left in the chamber, the two air
temperature sensing thermistors were passed out through an instrument port in the chamber wall.
This port was used for the power lead from the battery pack and the power lead to the cooling
fan, both of which were located outside the chamber. The chamber temperature profile was
programmed into the controller for the chamber and all temperatures were logged automatically
on an external computer. When the temperature differential between the chamber and the
external thermistors was 15 Cº or greater the fan is activated. At several points, the system was
monitored to check that the fan was operating and the fan speed was logged. The data logs are in
appendix D and E. All three runs were monitored by a video system; a camera was placed so that
it could monitor the fan and see a temperature readout for the room. The video system turned on
for one minute each hour and wrote the video output with time and date stamp to a computer
hard disk. This data is archived on DVDs. Figure 3 reflects the temperature profile that was used
for all three runs.
Low Temperature, MIL-STD-810F, Method 502.4 Procedure I, -32degree C
Testing was preformed at PNNL in an environmental test chamber that could reach -18°C. This
chamber has NIST traceable instrumentation. One of the completed electronic control systems
was placed in the chamber and all of the connections to the fan and the four control thermistors
were made. All thermistors were left in the chamber; the two RSG temperature sensing
thermistors were passed out through an instrument port in the chamber wall manually to activate
the fan to confirm that the electronics were operating. The test was conducted twice a day.
The port in the chamber was used for the power lead from the battery pack and the power lead to
the cooling fan, both of which were located outside the chamber. The chamber temperature
profile was programmed into the controller for the chamber and all temperatures were logged
automatically on an external computer. At several points, the system was monitored to check
that the fan was operating and the fan speed was logged.
Temperature Shock
MIL-STD-810F, Method 503.4, Procedure I, temperature shock requirement at the extremes (-32
degrees C to 50 degrees C)
Temperature shock testing was conducted at the beginning of the Low Temperature test when the
case was placed in the -18°C chamber from 22°C room temperature. At the end of the Low
Temperature testing the case environment changed from -18°C chamber to the room temperature
of 22°C. All systems functioned as expected before and after testing.
7Altitude, MIL-STD-810F, Method 500.4 Procedure I, 15,000’
Altitude Cooling Flow Analysis from Sea Level to 15,000 feet
Bounding Conditions: The performance of the cooling system is governed by the
requirements set forth in the ’55-Watt Radioisotope Stirling Generator (RSG) System
Requirements Document (SRD)’. This document then references MIL-STD-810F for
specific requirements. Determination was made that the most extreme condition would be
cooling the RSG at sea level with an ambient temperature of 50°C.
Bounding Tests: Based on the bounding conditions discussed above, a test was conducted
in a PNNL atmospheric chamber in August 2004. In preparation for this activity, a dummy
RSG was configured with a resistance heater whose output was controlled to 0.3 kW. The
surface of the RSG was instrumented with thermocouples and the leads were passed through
an instrumentation port to calibrated readouts. Data was recorded at intervals for ~1 hour
and 45 minutes. During the test, the cooling fan for the RSG was operated at 12 VDC. The
results for these tests can be seen in the following graph.
168
166 Test Run #1-Fan @12 V
Test Run #2-Fan @ 12 V
164
Temperature, F
RSG
162
160
158
156
0:00 0:14 0:28 0:43 0:57 1:12 1:26 1:40 1:55
Time, Hr:Min
Figure 4 RSG Cooling Curves
In both of the runs shown, the RSG was placed in the environmental booth and the heater was
turned on. The ambient temperature in the booth was maintained at 50°C throughout the test.
When the RSG temperature reached the maximum allowable temperature of 75° C ((167º F), the
fan was turned on with a controlled voltage of 12 VDC. As can be seen in the graphs, the
temperature of the RSG immediately began to drop, and continued to do so over the entire test
period.
8The fan voltage had been pre-selected as the maximum voltage that could be used to maintain the
acoustic signature allowed for the system. The test clearly established the adequacy of the fan in
this bounding condition.
Figure 5 Flow Testing Apparatus
Flow Testing: A laboratory test was performed in August of 2004 to determine the flow
through the system using a dummy RSG and the prototype inner components. The inner
components were placed in the composite case in a prototypic manner with all of the
requisite foam mounting parts, and placed on a laboratory table. A clear plastic flow tube
was mounted to the inlet case. A flow indicating anemometer was placed on the flow tube,
10 pipe diameters down from the end of the tube insuring there were 5 diameters between the
anemometer and the mouth of the RSG outer case. REF: Crane Flow of Fluids Technical
Paper No. 410. This gave the flow enough time to equilibrate before the anemometer. Fan
speed was controlled by a precision DC power supply, set at 12 volts.
The test was conducted using a calibrated flow meter placed in line with the input of the
system. The chart below is a compilation of the data taken.
Flow
Fan Flow Rate
Date Voltage (ft/min) (CFM)
8/19/2004 12 177 74
8/19/2004 12 179 75
8/19/2004 12 177 74
8/19/2004 12 177 74
8/19/2004 12 204 85
8/19/2004 12 204 85
8/19/2004 12 204 85
8/20/2004 12 216 90
8/20/2004 12 216 90
Average 81
9The flow average of 81 CFM and the minimum flow recorded, 74 CFM provided a basis for
bounding the operating envelope of the cooling system.
Altitude Calculations: A further cooling requirement for the RSG cooling system is
performance at various altitudes up to 15,000 feet. Since altitude testing is very expensive
and can be done in only a few locations in the country, a computational analysis was done to
determine whether an actual test would be required. A set of calculations were made based
on data supplied by the fan vendor. These formulas were developed and applied to cooling
situations where electronics must perform under varying altitude conditions.
CFM = Cubic Feet per Minute Q = Heat transferred (kW)
Cp = Specific Heat of Air (kJ/kg٠K) ρ = Air Density (kg/m3)
Δ T = Change in Temp °C
Required CFM = Q/(Cp* ρ* Δ T) 1
Altitude temp. change 6.5 °C/km of altitude
Energy generated by RSG 300 watts, or .3kW
Air temp. at sea level 50°C
Maximum surface RSG temp. 75°C .771 1.06
Sea Level 5000’ 15000’
Q .3kW .3kW .3kW
Cp 1.021 (kJ/kg٠K) 1.021 (kJ/kg٠K) 1.021 (kJ/kg٠K)
ρ 1.19 kg/m3 1.06 kg/m3 .771 kg/m3
ΔT 25 °C 35 °C 54.72 °C
CFM 20.91 16.77 14.75
The calculations show that only 21 CFM are required to control the heat load of a system, and
this has been corroborated by the original tests in a heated chamber. As the altitude is increased,
the change in temperature dominates the calculation, and the flow required actually goes down.
Thus it is expected that the cooling configuration that is currently in place is more than adequate
for altitude conditions required by the project.
1
References: http://www.comairrotron.com/engineering_notes_17.asp
10Rain, MIL-STD-810F, Method 506.4 Procedure
The rain test will conform to MIL-STD-810F, Method 506.4 Procedure I (Rain and Blowing
Rain). The purpose of this method is to help determine the following with respect to rain, water
spray, or dripping water:
• The effectiveness of protective covers, cases, and seals in preventing the penetration of
water into the materiel.
• The capability of the materiel to satisfy its performance requirements during and after
exposure to water.
• Any physical deterioration of the materiel caused by the rain.
• The effectiveness of any water removal system.
• The effectiveness of protection offered to a packaged material.
Figure 6 Case Orientations for Rain Testing
11TEST SETUP
Test specimen setup. The case specimen will be placed on a stand or small table so that it is off
the floor of the chamber. Sufficient clearance is needed around the case so that air can circulate
in the chamber and through the test case. The case will be tested in four positions: upright wind
on back, upright wind on front, sideways wind on top and sideways wind on bottom. Each
position is illustrated in Figure 6.
Pass/Fail Criteria:
• The cooling system is operational and capable of cooling the case to within the required
temperature limits.
• The weight of the case after completion of all the tests is no more than 5% greater than
the original weight.
• There is no visible degradation of the case including the foam.
• There is no swelling of the foam that would make insertion and removal of the case
contents difficult.
Testing:
The final Rain test was conducted at Systima Technologies on August 22, 2005. Richard Davis
conducted the testing for Systima and Stan Owsley was the representative from PNNL.
The Rain tests were conducted per MIL-STD-810F Method 506.4 Procedure 1 with the
following exceptions due to set up limitations. The specifications states that the wind velocity
should be 18mps and the water drop velocity should be 9mps. The actual testing wind velocity
was 15.8mps and the water drop rate was 7mps. The sponsor was notified of the variance and
agreed the variance was acceptable.
At the beginning of each test run the surface temperature of the case and the weight of the case
were documented. Data is found in the final report that Systima delivered to PNNL, Appendix E.
Summary:
At the conclusion of all of the Rain testing the cooling system operated as expected. The weight
of the case never increased over 5% and there were no visible degradation or swelling of the case
components.
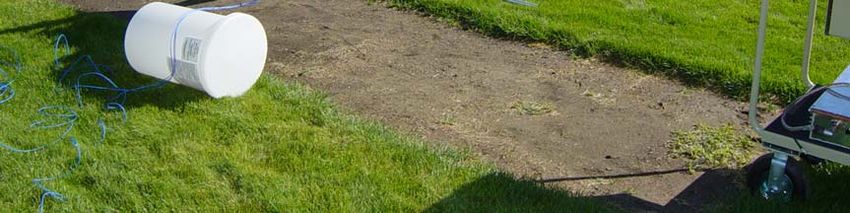
12Figure 7 Rain Test Setup. The forklift held the water chamber with all of the pipettes for
modulating water droplet size. The plywood structure guides the airflow from the six blowers.
13Vibration
MIL-STD-810F, Method 514.5 Cat 24 both general use and helicopter material for duration of
60 minutes in each three orthogonal axes for a total test time of 3 hours.
TEST RESULTS
On June 7-8, 2005 PNNL staff (Stan Owsley and Dave Alexander) along with a contractor
witness (Chris Park) met at Systima Technologies in Bothell, WA to conduct vibration testing on
the RSG Deployment Case. The vibration testing was conducted per MIL-STD-810F, Method
514.5, Category 24. The purpose of the vibration testing was to provide reasonable assurance
that the case and cooling system could withstand the vibrations associated with everyday
handling and transportation. The pass/fail criteria set forth was that: (1) maximum acceleration
measured on the RSG accelerometers is less than or equal to 20 g on every channel, (2) there is
no visible damage or degradation of the case that would result in the case not being able to fulfill
its mission, and (3) the case cooling system still operates as required at the completion of the
vibration testing.
Figure 8 Vibration Accelerometer Orientation at Systima Technologies
The maximum acceleration measured on the RSG accelerometers was 9.1 g at 51.1 Hz on the Z
axis on the fan end accelerometer (Figure 9). There was visible damage to the backpack frame
and to outlet plenum of the case at the end of the testing, but the damage would not hinder the
completion of the mission or the safety of the RSG. After each sine and random vibration test the
cooling system operated as designed. Overall, the results of the testing show that the RSG
Deployment Case meets or exceeds all required criteria.
14Figure 9
Testing Results Notes:
All vibration testing was conducted using the following components:
Case # BA4009-8, Electrical Box # 1, Cooling Housing # BA4009-8
The only components that were changed during the vibration testing were the backpack frames.
All other components completed the entire vibration test (6 hours).
15Test #1 X Axis Sine Vibration
Figure 10
The maximum g levels, as seen in Figure 10, are 6.5 g’s at 77.8 Hz on the X axis of the
controller accelerometer.
No visible damage to case after test. Electronics functioned after test. Fan speed was 1541 rpm
after test.
Test #2 X Axis Random Vibration
Electronics function and fan speed was 1575 rpm after testing concluded.
Small filings from the inlet plenum were seen on the vibration table after the test concluded. No
structural damage was detected.
16Test #3 Y Axis Sine Vibration
Figure 11
The maximum g levels, as seen in Figure 11, are 5.9 g’s at 51.3 Hz on the Y axis of the fan end
accelerometer.
Electronics functioned and fan speed was 1584 rpm after test.
Small filings from Inlet and Outlet Plenums were visible. No structural damage was apparent on
the plenums.
Test #4 Y Axis Random Vibration
Top part of unsupported backpack frame bends down ~1/2” during testing and the Outlet plenum
has several small fractures in the structure.
Tall backpack upright broke after ~20 minutes of testing. The test was completed with the
upright broken.
Test #5 Z Axis Sine Vibration
A new backpack frame replaced the broken frame used in the Y axis testing. During the first 15
minute sweep the tall upright on the backpack frame began to bend over again, but did not fail. A
resonance was hit at ~8 Hz and the RSG controller began to visibly bounce around inside the
case much more than any other test because the outlet plenum support structure began to break
apart. With the outlet plenum broke and the tie down straps loosening because the backpack
frame upright bent over, the highest g loading was recorded at 9.1 g’s (Figure 12).
17Figure 12
The test was stopped after 15 minutes to change out the backpack frame and with consultation
with Chris Park we determined that we had enough information on the Z axis sine sweep and
needed to run the Z axis random test before we damage the internals.
Electronics functioned after test and the fan speed was 1550 rpm.
After completing the Z axis random test the case ran through the rest of the sine sweeps (45
minutes, three 15 minute sweeps) with the backpack frame that had been used for the X axis
testing. The backpack frame uprights did not bend throughout this test. With the uprights
remaining in tact the g levels decreased because the hold down straps held the case tight against
the frame. Even though the controller was visibly traveling much farther than seen on any other
testing, the g levels still remained below the requirements at 7.4 g’s as seen in Figure 13.
18Figure 13
The backpack frame that completed all of the x axis testing and all but 15 minutes of the Z axis
testing did finally break through the frame tube in the last 15 minutes of the sine sweep test.
At the completion of the last three sweeps the electronics functioned and the fan speed was 1571
rpm.
Test #6 Z Axis Random Vibration
Before this test was started the outlet plenum showed substantial damage and the tall upright on
the backpack frame was already bent from previous testing.
At the completion of the test the control electronics and pendant were operating properly. The
fan speed at the end of the test was 1561 rpm.
19Shock
MIL-STD-810F, Method 516.5 Procedure IV, tailored for 18” drop on to compact soil Scope and
Objectives
Shock testing of the deployment case was accomplished per MIL-STD-810F, Method 516.5,
Procedure IV. The purpose of shock testing was to provide a degree of confidence that the
material used to construct the case and cooling system can physically and functionally withstand
the relatively infrequent, non-repetitive shocks encountered in handling, service, and
transportation environments. The procedure was tailored from MIL-STD-810F Method 516.5
Procedure IV-Transit drop by incorporating client consultation and the results of developmental
testing. This procedure is used to determine whether the test case is able to withstand the shocks
normally induced during man-packed or man-portable transit. Such shocks are accidental but
may impair the functioning or the material. The test case was dropped from a height of 18
inches onto compacted soil with eight orientations derived from a structural review of potential
case vulnerabilities. These eight drops were divided among two test items, based on a ratio of
the number of cases permitted by MIL-STD-810F Method 516.5 Procedure IV (up to five test
items for a total of 26 drops).
The case may sustain some physical damage and still remain functional, but it is critical that the
cooling system operate properly throughout the testing, that the case protects its contents from
the environment and shock, and finally that the cooling system meets the noise requirements
during deployment. Other than that, it is assumed a certain amount of physical damage to the
case could be tolerated during testing. With regard to the heater, applied shock could cause the
following failures.
Failure of outer shell causing collapse or fracture of cooling air passages and loss of cooling
efficiency, increased friction between the housing halves resulting in noisy disassembly, or
collapse of the rain cover.
Electronic circuit card malfunction.
Electronic connector damage.
Internal electrical conductor breach or break.
External electrical umbilical breach or break.
Permanent mechanical deformation rendering the deployment case unusable.
Test Set-up
Item to be tested
The test item was a frame-mounted case with approximate dimensions of 48 × 18 × 18 inches
(Figure 14). The case contains an electronic cooling system which will maintain the temperature
of a heater during deployment, however during testing the heater was replaced by a physical
mockup with the same mass and size. Three triaxial accelerometers were mounted to the mass
mockup inside the case. The case with all of its internal components weighed approximately 75
lb. An external battery was used to verify the operation of the cooling system after each drop.
20Figure 14 Composite Backpack Case
Test Facility
Shock testing was conducted near the PNNL 2400 Stevens Facility on compacted soil as shown
in Figure 15. Straps were attached to the test case to allow fine adjustments to the angular
orientation.
Instrumentation
The transit shock level experienced by the test case is dictated by the drop height and orientation
and thus requires no instrumentation. However, due to the fragility of the case heater, internal
shock levels were measured during shock testing. Instrumentation to measure heater shock
levels consisted of accelerometers, signal conditioner, data analysis software, and a laptop.
Three triaxial accelerometers (e.g. Dytran Instruments, Inc. Model 3023A1) with specifications
that meet the requirements of MIL-STD-810F, Method 516.5, were mounted to the case heater
mockup inside the transport case. The location of accelerometers and orientation of the
individual channels are shown in Figure 16. The accelerometer serial number for channels 1, 2,
and 3 (heater top) was 219, for channels 5,6, and 7 (heater base) was 218, and for channels 4 and
8 was 219 (heater controller). Note that the longitudinal shock at the controller could not be
measured because the dynamic signal analyzer was limited to 8 channels.
21Figure 15 Drop Frame with Quick Release Latch
Figure 16 Accelerometer Locations and Channel Orientations
22The signals from the accelerometers were converted to voltages by a Focus II Dynamic Signal
Analyzer (Model FCS 200, S/N 4235860 Rev. A) manufactured by LDS Dactron. AC coupling
was used to remove the DC component of the input signal. The sensors were powered using the
ICP protocol. The AC coupling high-pass filter cutoff frequency set at 0.7 Hz. The Fast Fourier
Transform analysis routine was set to the following parameters:
Lines: 1600
Span: 2000 Hz
Window: Hanning
Calibration and Tolerances
The accelerometers and signal conditioner used in conducting the tests were calibrated to
laboratory standards, traceable to the National Standards via primary standards. The calibration
date for these components is as follows:
Dytran Instruments Inc. triaxial accelerometer Model 3023A1 SN 218 6/25/2004
Dytran Instruments Inc. triaxial accelerometer Model 3023A1 SN 219 4/22/2004
Dytran Instruments Inc. triaxial accelerometer Model 3023A1 SN 298 6/17/2004
Focus II Dynamic Signal Analyzer SN 4235860 1/6/2004
The calibration dates were slightly outside the desired calibration interval of 1 year per ISO
10012-1; however, the operation and sensitivity of the accelerometers was verified by a
calibration exciter for accelerometers (Ono Sokki VX-1100) prior to testing.
The actual drop height was within 2.5% of the specified drop height per MIL-STD-810F,
paragraph 4.5.5.2. Thus, the drop height was 18 ± 0.45 inches. The corner drops required the
deployment case to be held at various angles with respect to the ground. To determine these
angles, a CAD program was used to align the center of gravity (cg) with the point of impact.
Once the orientation was established, the angles between the case surface and the ground were
calculated. Using an inclinometer, these angles were employed to orient the deployment case
prior to conducting the drop. The tolerance for the case inclination shall be ±1 degree.
Test Procedure
Pre-Test Checkout
The following pretest functional or operational data was taken prior to commencement of shock
testing.
a) Verify operation of cooling system, including a check that cooling fan comes
on/turn off at preset temperature.
b) Verify operation of the umbilical.
c) Measure weight of case attached to backpack.
2) Test Execution.
a) Install the heater in its test case as prepared for field use.
b) The drop height will be 18 inches, and a total of eight drop orientations will be
tested (see Table 2.1).
i) Drop 1 – side drop on case
ii) Drop 2 – on backpack
iii) Drop 3 – side drop on backpack
iv) Drop 4 – side drop on corner of case
v) Drop 5 – on end of backpack (case oriented 20° wrt vertical)
23vi) Drop 6 – on rain cap
vii) Drop 7- on top corner of case (case oriented 15° wrt vertical)
viii) Drop 8 - on bottom corner of case (case oriented 13° wrt vertical)
c) Perform the required drops using drop frame with quick release latch. Secure the
case to the latch using adjustable wire harness and orient the case so that, upon
impact, a line from the struck corner or edge to the center of gravity of the case
and its contents is perpendicular to the impact surface. Adjust the height of the
drop frame to achieve the desired drop height of 18 inches.
d) Ensure that the area under the drop frame is clear of objects or personnel. There
needs to be sufficient space under the drop point to allow the case to topple and
bounce without contacting the drop frame. Drop the case.
e) Visually inspect the deployment case.
f) Photograph location of impact point and any obvious damage
g) Subject the heater thermocouples to 40 °C water, apply battery power to the
control system, and verify operation of the cooling system, fan, and umbilical.
Pass/Fail Criteria
1) Maximum Shock Criteria: Based on developmental testing conducted prior to
final testing, it was expected that maximum shock levels measured by
accelerometers attached to the heater would not exceed the following limits2.
The instantaneous longitudinal shock levels from each of the triaxial
accelerometers should not exceed 35 g’s with duration of less than 50 ms.
Instantaneous outputs from the transverse channels (X and Y) from each triaxial
accelerometer were combined by taking the square root of the sum of the squares.
The resultant instantaneous transverse shock levels should not exceed 90 g’s with
a duration of less than 50 ms. The duration level is a bounding number based on
the longest duration of a triangularly shaped shock impulse measured during
developmental testing.
2) The following functionality was verified upon completion of each drop.
a) Verify operation of cooling system, including a check that cooling
fan comes on/turn off at preset temperature.
b) Verify operation of the umbilical.
3) The deployment case is essentially intact and can complete its mission.
Exceptions to this would be failure of outer shell causing collapse or fracture of
cooling air passages and loss of cooling efficiency, and increased friction between
the housing halves resulting in noisy disassembly, or collapse of the rain cover.
2
A separate shock limit was provided for the longitudinal and transverse directions based on the inherent fragility of
the heater.
24Drop 1 – Side Drop on Case Drop 2 – On Backpack
Drop 3 – Side Drop on Backpack Drop 4 – Side Drop on Corner of Case
Drop 5 – On End of Backpack Drop 6 – On Rain cap
Drop 7 – On Top Corner of Case Drop 8 – On Bottom Corner of Case
Figure 17 Drop Test Orientations
25Test Results
Test Progression
Final shock testing was initiated on June 23, 2005. After Drop 1 (see Figure 17) it was
found that the control system did not function. The controller was replaced by a spare,
and testing was resumed. After Drop 2 it was found that the control system was again
nonfunctional. Testing was suspended and the control system was redesigned. Personnel
performing or witnessing the testing on June 23, 2005 included:
Brian Hatchell – shock measurement system operator
Stan Owsley – shock test engineer
Dave Alexander – project manager
Dennis Kreid – program manager
Tim Augauer - Sponsor
Final shock testing was resumed and successfully completed on August 17, 2005. All 8
drops were completed in the desired sequence without any control system failures. It
should be noted that the same case and frame used for the two drops on June 23, 2005
were reused for the subsequent resumption of testing. Personnel performing or
witnessing the testing on August 17, 2005 included:
Brian Hatchell – shock measurement system operator
Stan Owsley – shock test engineer
Dave Alexander – project manager
Dennis Kreid – program manager
DOE Representative
Mike Evers - Sponsor
After Drop 3, it was noticed that the frame bracket was deformed (Figure 18). The case
was opened and a moderate degree of cracking was noticed in the exit plenum (Figure 19
and 20). The frame and exit plenum was replaced and the remaining drops were
completed with this configuration. The case bottom cracked during drop 8 (see Figure
21), and upon disassembly similar damage to the inlet and exit plenums was noted
(Figures 22-24). The damage was not deemed sufficient to jeopardize a mission since the
damage did not affect the functionality of the case, did not cause collapse or fracture of
cooling air passages or loss of cooling efficiency, and did not result in noisy disassembly.
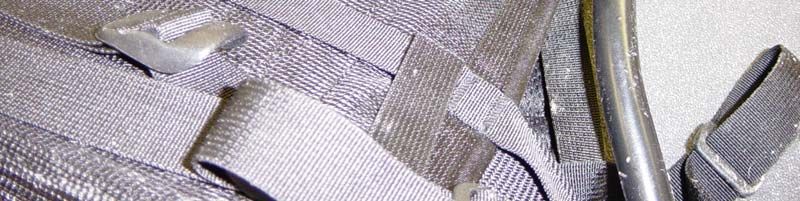
26Figure 18 Frame Bracket Deformation after Drop 3
Figure 19 Cracks in Exit Plenum noted after Drop 3 (view 1)
27Figure 20 Cracks in Exit Plenum Noted after Drop 3 (view 2)
Figure 21 Cracks in Case after Drop 8
28Figure 22 Cracks in Exit Plenum Noted after Drop 8 (view 1)
Figure 23 Cracks in Exit Plenum Noted after Drop 8 (view 2)
29Figure 24 Cracks in Inlet Plenum Noted after Drop 8
Summary of Heater Shock Levels
Photographs of the test orientation and shock levels measured during the tests are
provided in Appendix G. Peak shock levels from all the tests are summarized in Table 1.
In Table.2, peak shock levels are compared to the maximum shock criteria. As described
in Pass/Fail Criteria, a separate shock limit was specified for the longitudinal (< 35 g’s)
and transverse (< 90g’s) directions based on the inherent fragility of the heater. Several
shock levels exceeded the criteria. In Drop 1 (date 8/17/2005), the maximum
longitudinal shock was instantaneously 53 g’s, which is higher that the criteria of 35 g’s.
Note that this shock level was measured perpendicular to the direction of the drop, and so
a high shock level in this direction was not expected. However, the shock level during
Drop 1 (date 6/23/2005) was within the criteria, so the 53 g’s is probably atypical for this
orientation. Maximum longitudinal shock levels were also exceeded for Drop 6 and 7
(60 and 82 g’s respectively). Finally, in Drop 8, the maximum longitudinal shock was 41
g’s, which is higher that the criteria of 35 g’s.
Comparison with Developmental Testing Heater Shock Levels
Prior to the deployment case Critical Design Review, a preliminary sequence of drop
tests was completed using a prototype case. The relevant differences between
preliminary testing and final testing were: 1) there was no accelerometer on the
controller, 2) the fan and electronics box were not included, and 3) the corner drop onto
the rain cap (Drop 7) was excluded due to high shock levels measured during Drop 6.
The shock levels from these preliminary tests are provided in Table 3. The shock data
30from final testing (Table 2) and preliminary testing (Table 3) are fairly consistent in terms
of peak shock levels and the axis that received the highest shock, but some differences
are apparent due to the inherent variability of drop testing. In Drop 1 and Drop 8, the
maximum longitudinal shock was 18.5 g’s and 18.4 g’s respectively, which are well
below the criteria of 35 g’s. During final drop testing, these values exceeded the shock
criteria. High longitudinal shock levels were measured for the drop onto the rain cap (>
200 g’s). Design changes were implemented in the final design to improve the shock
protection afforded by the rain cap and were effective in reducing the shock level but not
to the level of the criteria. The case damage noted in preliminary testing was very similar
to the damage described above (frame deformation, plenum cracking, and case bottom
cracking).
Table 1. Peak Shock Levels Measured during Shock Testing
DROP PEAK PEAK PEAK PEAK PEAK PEAK PEAK PEAK
ORIENT ∗CH 1∗ ∗CH 2∗ ∗CH 3∗ ∗CH 4∗ ∗CH 5∗ ∗CH 6∗ ∗CH 7∗ ∗CH 8∗
& DATE G’S G’S G’S G’S G’S G’S G’S G’S
1 (6/23) 56.9 12.5 8.7 56.9 42.2 18.2 22.1 14.0
1 (8/17) 37.3 9.4 11.3 58.1 54.6 22.1 53.0 5.0
2 (6/23) 24.2 9.6 4.3 33.5 22.1 11.5 9.6 9.7
2 (8/17) 25.7 10.0 5.3 33.5 22.1 5.4 9.2 6.6
3 (8/17) 12.5 14.9 3.5 7.9 7.9 9.4 4.0 7.8
4 (8/17) 12.8 11.1 12.7 33.0 28.3 25.2 12.2 23.6
5 (8/17) 13.6 4.1 14.2 6.7 10.4 5.9 16.8 3.9
6 (8/17) 19.0 15.9 60.1 2.9 12.1 19.0 49.9 4.4
7 (8/17) 47.0 29.4 81.9 20.4 9.9 8.4 36.5 4.5
8 (8/17) 17.9 14.5 9.1 16.0 8.9 9.9 41.9 32.1
Table 2. Shock Levels during Shock Testing
HEATER TOP HEATER BOTTOM CONTROLLER
DROP Maximum Maximum Maximum Maximum Maximum
ORIENTATION Transverse Longitudinal Transverse Longitudinal Transverse
AND Shock, g’s Shock, g’s Shock, g’s Shock, g’s Shock, g’s
DATE
criteria1 < 90 g’s < 35 g’s < 90 g’s < 35 g’s < 90 g’s
1 (6/23) 58.3 8.7 46.0 22.1 58.6
1 (8/17) 38.5 11.3 58.9 53.0 58.3
2 (6/23) 26.0 4.3 24.9 9.6 34.9
2 (8/17) 27.6 5.3 22.8 9.2 34.1
3 (8/17) 19.4 3.5 12.3 4.0 11.1
4 (8/17) 16.9 12.7 37.9 12.2 40.6
5 (8/17) 14.2 14.2 12.0 16.8 7.8
6 (8/17) 24.8 60.1 22.5 49.9 5.3
7 (8/17) 55.4 81.9 13.0 36.5 20.9
8 (8/17) 23.0 9.1 13.3 41.9 35.9
31Table 3. Shock Levels during Preliminary Shock Testing
HEATER TOP HEATER BOTTOM
DROP Maximum Maximum Maximum Maximum
ORIENTATION Transverse Longitudinal Transverse Longitudinal
AND Shock, g’s Shock, g’s Shock, g’s Shock, g’s
DATE
criteria1 < 90 g’s < 35 g’s < 90 g’s < 35 g’s
1 61.2 7.6 60.6 18.5
2 26.1 5.9 16.4 4.8
3 25.0 4.7 22.0 6.8
4 56.4 14.2 60.6 16.8
5 48.3 22.5 47.7 24.5
6 89.2 238.2 79.9 208.8
7 na na na na
8 48.5 8.4 21.6 18.4
Summary
Shock testing of the deployment case was accomplished per MIL-STD-810F, Method
516.5, Procedure IV. The purpose of shock testing was to provide a degree of confidence
that the material used to construct the case and cooling system can physically and
functionally withstand the relatively infrequent, non-repetitive shocks encountered in
handling, service, and transportation environments. The procedure was tailored from
MIL-STD-810F Method 516.5 Procedure IV-Transit drop by incorporating client
consultation and the results of developmental testing. The test case was dropped from a
height of 18 inches onto compacted soil. The test case was dropped from eight
orientations derived from a structural review of potential case vulnerabilities. These
eight drops were divided among two test items, based on a ratio of the number of cases
permitted by MIL-STD-810F Method 516.5 Procedure IV (up to five test items for a total
of 26 drops).
Final shock testing was initiated on June 23, 2005. After the first drop (orientation 1) it
was found that the control system did not function. The controller was replaced by a
spare, and testing was resumed. After the second drop (orientation 2) it was found that
the control system was again nonfunctional. Testing was suspended and the control
system components were redesigned. It should be noted that the same case and frame
used for this first phase were reused for the subsequent resumption of testing.
Final shock testing was restarted and successfully completed on August 17, 2005. All 8
drops were completed in the desired sequence without any cooling system control system
failures. Damage was noted in the frame, case, and plenums but was not deemed
sufficient to jeopardize a mission since the damage did not affect functionality of the
case, did not cause collapse or fracture of cooling air passages or loss of cooling
efficiency, and did not result in noisy disassembly.
Peak shock levels were compared to the maximum shock criteria for longitudinal (< 35
g’s) and transverse (< 90g’s) directions. Several longitudinal shock levels exceeded the
32criteria of 35 g’s. In Drop 1 (8/17/2005), the maximum longitudinal shock was
instantaneously 53 g’s and in Drop 8 the maximum longitudinal shock was 41 g’s.
However, the shock levels measured in the longitudinal direction during preliminary
testing were well below the criteria. These differences are apparently due to the inherent
variability of drop testing.
Maximum longitudinal shock levels were also exceeded for Drop 6 and 7 (60 and 82 g’s
respectively). Design changes were implemented in the final design to improve the shock
protection afforded by the rain cap and were effective in reducing the shock level but not
to the level of the criteria. However, dropping on the rain cap is a fairly unlikely event.
Internal shock levels were lowest for drops onto the backpack, which is perhaps the most
probable drop scenario.
33Acoustic
Shall not exceed the 30 meter acoustic non-detectable limit as defined in Table 2-II –
Quietest Area Ambient Noise Level in Table 2-III of MIL-Stand-1474D when measured
at a distance of 2 meter.
Characterization Summary
The 55 W RSG Deployment Case prototype was characterized for its acoustic profile at
the Pacific Northwest National Laboratory (PNNL) Test Facility in Richland, WA from
September 13-15, 2004. The case was configured in its most realistic mode. The
purpose of this acoustic characterization was to accurately capture acoustic emanations at
ground level from an individual carrying the RSG in a backpack. This characterization
supplemented the acoustic testing already performed in the PNNL Test Facility and
reported in the RSG Case Design Review.
Testing in realistic conditions outdoors showed that the acoustic emissions levels
extrapolated to a distance of 30 meters in all test cases met the Table 2-II Quietest Area
Ambient Noise Level requirement from MIL-STD-1474D.
Test Participants included:
Woodrow Hawthorne TASC
Bill Jeffries TASC
Mike Evers TASC
Robert Francini, PNNL
References
RSG Acoustic Test Plan, 3 September 2004
RSG Case Design Review, 26 August 2004
MIL-STD-1474D, Table 2-II, Quietest Area Ambient Noise Level
Acoustic Test Data Sheets, RSG test, 20 September 2004
Characterization Test Configuration
Characterization Description
Characterization configurations were selected based on those configurations most likely
to be encountered in the field. Measurement equipment Included:
• Bruel and Kjaer model 2144 Dual Channel Real Time Frequency Analyzer
• Half inch microphone (model 4231)
• Acoustical calibrator for model 4231 microphone
• Sony DAT recorder
• Microphone stand
• Boom extension
Measurements were taken at a distance of 0.5 m so the low level emanations could be
recorded over the ambient. Microphones were set at a height of 1.2 m above the ground
during outdoor measurements. After an ambient was taken, the RSG was characterized
in the following outdoor configurations included:
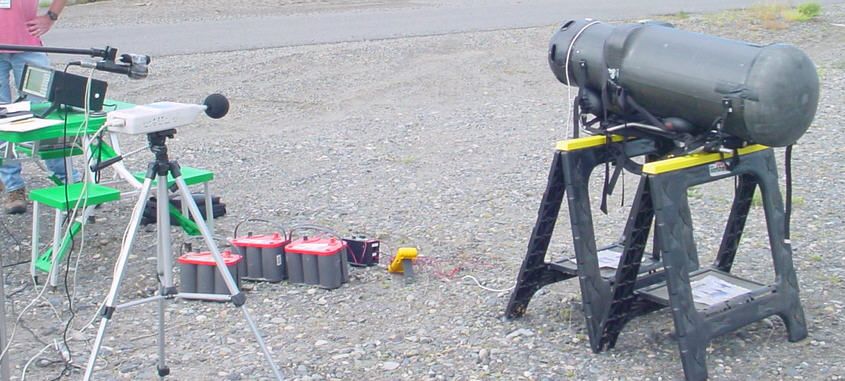
34• Packaged 55 W RSG placed in a prone position on sawhorses
• Packaged RSG worn as backpack on individual, unit closest to microphone
• Packaged RSG worn as backpack, individual between microphone and RSG
In addition, measurements were taken inside the PNNL whisper chamber with the
analyzer in both an A-weighted and linear setting. The configuration mimicked the test
configuration PNNL used when characterizing the 55 watt RSG Deployment Case (see
acoustics section in RSG Case Design Review). Microphones were placed 2 feet (0.645
m) away from the test unit in the whisper chamber. In all test cases the ambient was
found to be 10 dB or more less than the measured signal.
Acoustic analyzer run numbers correspond to data captured by the analyzer and displayed
in the accompanying reduced data sheets. In addition, test sounds were captured by a
DAT recorder and can be used along with the Acoustic Database to simulate how
detectable the RSG fan sounds are in realistic conditions.
Listed below for each test case are pictures of that test case, a list of test cases by
corresponding fan power and a graph of the case that was determined to emit the highest
emanations of the group. The fan nominally operates at 11VDC.
3.1.1 Test Unit in prone position
Place: Test area, PNNL field location
Date: 13 September 2004
Description: 13 Sep- RSG in backpack in prone position on sawhorses, mic 0.5 m away
from fan end. For completeness, measurements with fan voltage set at 13 and 24 V were
taken although these configurations are not expected to be used in the field.
As can be seen from the graph below, the emissions fail to meet the specification at 200
Hz by 0.8 dB. The emanations of the unit with fan voltage less than 13 V met the
requirement everywhere.
Figure 25 Unit in the Prone Position
35You can also read