TOWARDS NET-ZERO ENERGY SYSTEMS IN CANADA: A KEY
←
→
Page content transcription
If your browser does not render page correctly, please read the page content below
TRANSITION ACCELERATOR REPORTS
           Volume 2 • Issue 3 • September 2020
TOWARDS NET-ZERO ENERGY SYSTEMS IN CANADA: A KEY
              ROLE FOR HYDROGEN
                    David B Layzell PhD,FRSC
                   Cameron Young PEng, MSc
                         Jessica Lof MSc
                        Jonathan Leary
                       Song Sit PEng, PhD

              A Transition Accelerator ‘White Paper’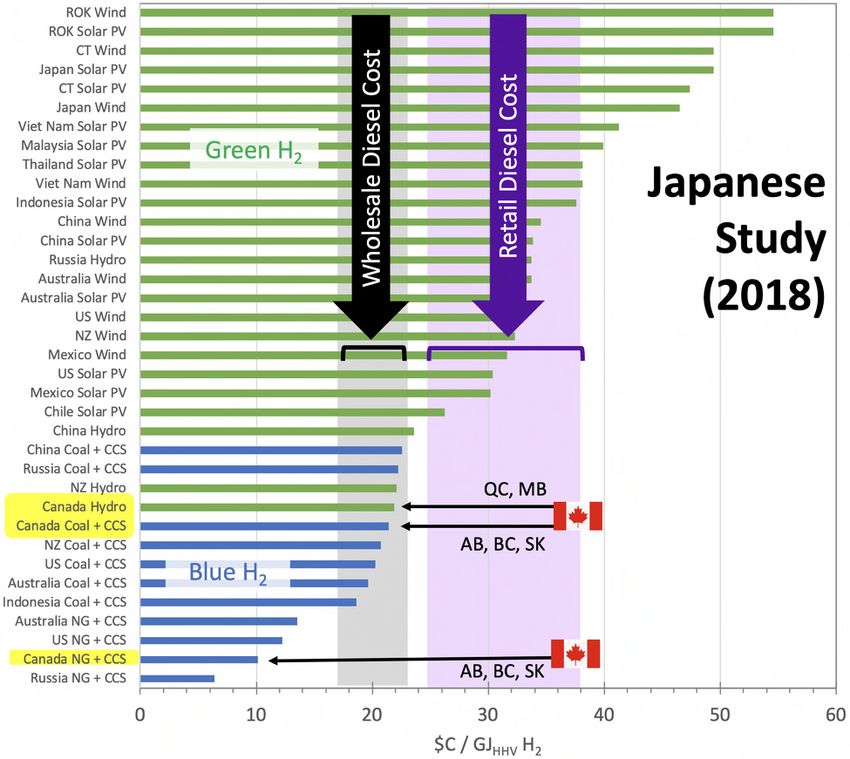
TRANSITION ACCELERATOR REPORTS
                                                                        Volume 2 • Issue 3 • September 2020

                          Towards Net-Zero Energy Systems in Canada:
                                             A Key Role for Hydrogen
                                                                                                    David B Layzell PhD, FRSC
                                                                                             Research Director, The Transition Accelerator
                                           Professor and Director, Canadian Energy Systems Analysis Research (CESAR), University of Calgary
                     Contact:
                                                                                                  Cameron Young PEng, MSc
                     Dr. David B. Layzell,                                            Energy Systems Analyst, CESAR, University of Calgary
                     Tel: 403 220-5161                                                                              Jessica Lof MSc
                     Email: dlayzell@ucalgary.ca                          Research Lead on Freight Transport, CESAR, University of Calgary
                     Web: www.transitionaccelerator.ca                                                              Jonathan Leary
                                                                                  Summer Research Assistant, CESAR, University of Calgary
                                                                                                              Song Sit PEng, PhD
                                                                                             Senior Associate, CESAR, University of Calgary

Citation:
Layzell DB, Young C, Lof J, Leary J and Sit S. 2020. Towards Net-Zero Energy Systems in Canada: A Key Role for Hydrogen. Transition
Accelerator Reports: Vol 2, Issue 3. https://transitionaccelerator.ca/towards-net-zero-energy-systems-in-canada-a-key-role-for-hydrogen
                                                                                                                                              2
Preface
This white paper was prepared by The Transition Accelerator to provide techno-economic and environmental details, as well as a pan-
Canadian perspective for the work of ‘Alberta's Industrial Heartland Hydrogen Task Force’ in assessing the ability of the Alberta
Industrial Heartland region to contribute to the transition to a net-zero energy future. The Task Force report (to be released in Fall
2020) and this study are provided to inform decision makers in industry and government regarding the nature of a future, net-zero
energy system and the important role for hydrogen in the energy transition.
The Transition Accelerator is a pan-Canadian, non-profit organization that works with groups across the country to solve business and
social challenges while building emissions reductions into solutions. The Accelerator philosophy starts with understanding that we
live in a time of disruptive change which is shaping the future. The Accelerator harnesses disruptions, shaping the future by helping
develop credible and compelling transition pathways and actively taking steps down these pathways to positive future states.
The Accelerator uses a four-stage methodology:
1. Understand the system that is being transformed, including its strengths and weaknesses, and the technology, business model,
   and social innovations that are poised to disrupt the existing system by addressing one or more of its shortcomings.
2. Codevelop transformative visions and pathways in concert with key stakeholders and innovators drawn from industry,
   government, indigenous communities, academia, and other groups. This engagement process is informed by the insights gained in
   Stage 1.
3. Analyze and model the candidate pathways from Stage 2 to assess costs, benefits, trade-offs, public acceptability, barriers and
   bottlenecks. With these insights, the process then re-engages key players to revise the vision and pathway(s) so they are more
   credible, compelling and capable of achieving societal objectives.
4. Advance the most credible, compelling and capable transition pathways by informing innovation strategies, engaging partners and
   helping to launch consortia to take tangible steps along defined transition pathways.

                                                                                                                                         3
Acknowledgements
The Transition Accelerator is highly appreciative of its funding sponsors (see logos below) and the Mayors of the five
municipalities making up the Alberta Industrial Heartland. Without their support and encouragement, this work would not
be possible. The next page identifies the names of the individuals who provided valuable data and expertise as well as
critical insights and perspectives to The Transition Accelerator’s analytical team as the work progressed. We also
appreciate the support of Dr. Lina Kattan (Professor of Civil Engineering at the University of Calgary) and the Integrated
Infrastructure for Sustainable Cities (IISC) NSERC CREATE program for the funding support for Jonathan Leary to work on
the project over the summer of 2020.

Partners in the Alberta Industrial Heartland Project                      Transition Accelerator Sponsors

                                                                                                                             4
Participants in the
             Alberta Industrial Heartland Hydrogen Task Force
Task Force Leaders                                         Task Force Advisors
                                                           • Mark Summers, Executive Director, Technology and Innovation at Emissions Reduction Alberta
•   Mayor Alanna Hnatiw, Sturgeon Country
                                                             (ERA)
•   Mayor Don Iveson, City of Edmonton
                                                           • Justin Riemer, Assistant Deputy Minister, Western Economic Diversification Canada, Alberta
•   Mayor Gale Katchur, City of Fort Saskatchewan
                                                             Region, Government of Canada
•   Mayor Rod Frank, Strathcona County
                                                           • Mark Kirby, President and CEO, Canadian Hydrogen and Fuel Cell Association
•   Reeve David Diduck, Lamont County
                                                           • Barbra Korol, Executive Director, Strategic Policy Branch, Alberta Department of Energy
Analytical Team and Report Authors                         • Chris Nash, President, Alberta Motor Transport Association
• David Layzell, Research Director, The Transition         • Sean McCoy, Assistant Professor, Department of Chemical and Petroleum Engineering,
  Accelerator                                                University of Calgary
• Cameron Young, Energy Systems Analyst, CESAR             • Jim Lothrop, Director General, Innovation Centre, Transport Canada
• Jessica Lof, Research Lead Freight, CESAR                • Michele Evans, Assistant Deputy Minister, Tourism and Economic Development, Government of
• Jonathan Leary, Research Assistant, CESAR                  Alberta
• Song Sit, Senior Associate, CESAR                        • John Zhou, Vice-President, Clean Energy, Alberta Innovates
                                                           • Helen Ryan, Assistant Deputy Minister, Environment and Climate Change Canada
Special Advisors to the Analytical Team                    • Robert Hamaliuk, Executive Director, Climate Change Policy, Government of Alberta
• Hilary Faulkner, Director, Strategic Policy and Energy
                                                           • Paul Cheliak, Vice-President, Government and Regulatory Affairs, Canadian Gas Association
  Diversification, Alberta Energy                          • Bob Koch, Professor, Faculty of Engineering, University of Alberta
• Oleg Podporin, Senior Policy Analyst, Natural Gas
                                                           • Margaret Bateman, Senior Consultant, ZGM Marketing
  Strategy and Engagement, Alberta Energy
                                                           • Mollie Johnson, Assistant Deputy Minister, Natural Resources Canada
• Wes Lu, Senior Analyst, Alberta Energy

                                                                                                                                                          5
Copyright Information

DISTRIBUTION: Transition Accelerator Reports are available online at www.transitionaccelerator.ca.
DISCLAIMER: The opinions expressed in this publication are the authors’ alone.
COPYRIGHT: Copyright © 2020 by The Transition Accelerator. All rights reserved. No part of this
publication may be reproduced in any manner whatsoever without written permission except in the case of
brief passages that may be quoted in critical articles and reviews.
ISSN: Transition Accelerator Reports (Online format): ISSN 2562-6264
MEDIA INQUIRIES AND INFORMATION: For media inquiries, please contact
dlayzell@transitionaccelerator.ca
PLACE OF PUBLICATION: The Transition Accelerator, Calgary, AB
VERSION: 2

                                                                                                          6
TOWARDS NET-ZERO ENERGY SYSTEMS IN CANADA:
              A KEY ROLE FOR HYDROGEN

                              Table of Contents
                                                                  Page
Executive Summary                                                   8
1. Introduction                                                    13
2. The Cost of Low Carbon Hydrogen Production in Canada            20
3. Emissions Intensity and Life-Cycle Implications for Hydrogen    30
4. The Magnitude of the Opportunity                                41
5. Summary and Conclusions                                         49
                                                                         7
TOWARDS NET-ZERO ENERGY SYSTEMS IN CANADA:
        A KEY ROLE FOR HYDROGEN

          Executive Summary

                                             8
Executive Summary
The Net-Zero Emissions Challenge.
Canada and 72 other nations of the world have committed to net-zero greenhouse gas (GHG) emissions by 2050. Since half of Canada’s GHG
emissions are associated with the end-use combustion of fuels like gasoline, diesel, natural gas and kerosene (jet fuel), achieving the net-zero
target will require the replacement of these carbon-based fuels with energy carriers that produce no emissions at end use.
Electricity made from very low or zero-emission sources will play a significant role, requiring a two to three-fold increase in generation and use
over the next 30 years. However, direct electrification of sectors such as heavy freight (road and rail), off-road vehicles, shipping, planes, space
heating in cold climates, and heavy industries (e.g. steelmaking) is not feasible from a logistical or economic perspective. For such markets,
zero-emission fuels are required, and hydrogen is internationally recognized as a fuel of choice for net-zero energy systems of the future.
Hydrogen and Greenhouse Gas Emissions.
Canada currently produces about 8,200 tonnes of hydrogen (H2) per day, predominantly by reforming natural gas. This ‘gray’ H2 production,
which is used as an industrial feedstock to make fertilizer nitrogen and in the petrochemical sector, results in GHG emissions of about 9 kg
CO2e/kg H2.
In moving towards a net-zero energy system, hydrogen would need to be produced with very low or no GHG emissions, and used not only as an
industrial feedstock, but as an end use fuel supporting transportation, heat for buildings and industry, and power generation. Low-carbon
hydrogen can be produced by the electrolysis of water using low-carbon electricity (from hydro, nuclear or renewables), or from fossil fuels
coupled to carbon capture and storage (CCS). Lifecycle emissions from electrolytic ’green’ hydrogen range from 0.8 (wind) to 3.4 (solar) kg
CO2e/kg H2, while lifecycle emissions from ‘blue’ hydrogen made from natural gas with 90+% CCS range from 2 to 3 kg CO2e/kg H2.
The GHG benefits of blue or green hydrogen use depends, in part, on how the fuel is used. For example, if blue hydrogen is used in a hydrogen
fuel cell electric (HFCE) vehicle that displaces a gasoline vehicle, the lifecycle GHG savings are about 89%. In a HFCE vehicle (e.g. truck) that
displaces a diesel vehicle, the GHG savings are about 83%, and if hydrogen is used to displace natural gas for heating, the GHG savings are
about 67%. Hydrogen can also be used as a dual fuel with diesel (40 H2 : 60 diesel by energy content), and in this case, the lifecycle GHG
savings are about 32% compared to a vehicle using only diesel fuel.
                                                                                                                                                       9
Executive Summary (Continued)
Magnitude of the Opportunity and Challenge.
Based on a sectoral and regional assessments, we have modeled a near net-zero energy system for Canada in 2050 where the per capita
energy demand decreases by one third due to improved energy efficient technologies (e.g. heat pumps and electric motors) and electricity
for end-use applications increases from supplying approximately 15% of Canada’s primary energy demand in 2017 to approximately 35%
in 2050. All new generation (and some existing fossil-carbon generation) would be from very low emitting sources (such as hydropower,
nuclear, wind, solar or fossil fuels with CCS). Concurrent with this change, we projected that hydrogen would be the energy carrier for
approximately 27% of Canada’s primary energy demand in 2050, equivalent to 64 kt H2/day.
To meet the additional demand for the direct use of electricity, Canada’s new, net-zero energy system requires 700 TWhe/yr of new low-
carbon electricity in addition to the 400 TWhe/yr that currently contributes to the public grid. To supply the hydrogen fuel demands of 64
kt H2/day as green hydrogen would require another 1,054 TWhe/yr where all that power is dedicated to hydrogen production. This could
be met by 66,000 large (4.8MW) wind turbines, or 30 nuclear plants the size of ‘Bruce Power’ (4,700 MW), or 195 large hydro reservoirs
the size of BC’s ‘Site C’ (1,100 MW each).
Alternatively, the 64 kt H2/day could be supplied as blue hydrogen using 4,490 PJ of natural gas per year, equivalent to 72% of Canada’s
current natural gas production. The hydrogen production would be about eight times the current production of hydrogen from natural gas
in Canada. The carbon capture and storage requirement for this magnitude of blue hydrogen production would be about 203 Mt
CO2/yr. Meeting this domestic demand for hydrogen is probably best done through a combination of ‘blue’ and ‘green’ hydrogen where
the relative importance of each would vary with different regions and sectors across the country.
There are also likely to be significant export markets for blue or green hydrogen in countries like the U.S., Japan, South Korea and
Germany. Our analysis suggest that this could easily double the demand for Canada’s zero-emission hydrogen production, generating a
wholesale market potential for hydrogen of up to $100B a year, and potentially more.

                                                                                                                                             10
Executive Summary (Continued)
The Economics and Environmental Footprint of Hydrogen.
For a net-zero energy system to be credible and compelling, it is ideal if it is priced competitively with the incumbent carbon-based fuel
option. To meet this criteria, the retail price target for low or zero-carbon hydrogen should be C$3.50 to C$5.00/kg (C$25-35/GJhhv) when
used as a transportation fuel. For thermochemical applications, the low cost of incumbent carbon-based fuels makes it more challenging,
but retail price target of $1.00 to $2.80/kg H2 ($7-20/GJhhv) should be able to compete if combined with improved energy efficiency and
policy measures.
Canada is fortunate to be among the world’s lowest cost producers of zero or low-carbon hydrogen. In provinces with ample low-carbon
electricity (e.g. from hydropower, nuclear or renewables), electrolysis of water can produce ‘green’ hydrogen for $2.50 to $5.00/kg H2 ($18
to $35/GJhhv H2). In provinces with low-cost natural gas and the geology suitable for permanently sequestering the byproduct CO2, ‘blue’
hydrogen can be produced at a price of $1.50 to $2.0/kg H2 ($10 to $14/GJhhv H2), not counting the income that can be generated by
selling CO2 for enhanced oil recovery (estimated at $20/t CO2) or from generating Emission Performance Credits (EPCs) under Alberta’s
Technology Innovation and Emission Reduction (TIER) Program ($40/t CO2 in 2021). Such initiatives can reduce the cost of blue hydrogen
production by $0.32/kg H2 or more, resulting in a wholesale cost of blue hydrogen that is about half the wholesale cost of diesel fuel in
Canada, and one third the retail cost.
However, the distribution and retail of a gas like hydrogen is associated with higher costs than for diesel. Requirements under the new
federal clean fuel standard (CFS) could help to level that playing field, by generating credits that are linked to the lifecycle benefits of using
blue or green hydrogen to displace GHG emissions from traditional uses for fossil fuels (the British-Columbia version is currently
generating credits worth over $300/t CO2e). For example, CFS credits worth $200/t CO2e would mean that displacing natural gas with blue
or green hydrogen may reduce retail costs for the fuel by up to $1/kg H2, while using blue hydrogen to displace diesel in a hydrogen-diesel
vehicle or in a HFCE vehicle could generate credits of $1.50+ or $2.40+/kg H2, respectively.
The combination of Canada’s abundant resources for blue and green hydrogen production, and a number of existing and emerging policies
and standards can make it possible to produce, distribute and retail the hydrogen at a price that is competitive with the fossil fuel
alternatives as long as there is sufficient demand for the zero-emission fuel to benefit from the economics of scale.
11Executive Summary (Continued)
Realizing the Opportunity.
A coordinated, system level effort is needed to break the vicious cycle that currently prevents the emergence of the hydrogen economy. In
this cycle, the absence of demand for fuel hydrogen is linked to the absence of cost-effective fuel supply. The lack of supply is then linked
to the lack of demand and the high cost of the vehicles and other service technologies since their production cannot benefit from the
economies of large-scale manufacturing.
This challenge can be addressed by establishing ‘hydrogen nodes’ in regions across Canada where the following criteria can be met:
q A low-cost, low-carbon source of blue, green or waste hydrogen;
q Substantial nearby markets for the hydrogen as a fuel and/or industrial feedstock;
q Ability to cost-effectively connect supply to demand (pipelines preferred to tube trailers or liquid hydrogen);
q Scale of supply and demand where the economics work without sustained public investment;
q Engaged industry, governments and academics to drive and support the initiative.
The sub-regional scale of this approach (i.e. municipalities, transportation corridors, etc.) and its deployment across Canada can focus
public and private investment towards the creation of small, but viable zero-emission energy systems that will grow over time to create
the transformative change that is needed for the energy systems of Canada. The deployment and growth of these hydrogen nodes should
be coordinated with the opportunity for Canada to provide zero-emission hydrogen to other nations wanting to decarbonize their energy
systems. In doing so, Canada can become a global leader in the transition to a net-zero emission energy future.
12TOWARDS NET-ZERO ENERGY SYSTEMS IN CANADA:
A KEY ROLE FOR HYDROGEN
1. Introduction
131. Introduction
Canada and 72 other nations of the world have committed to net-zero emissions by 2050 to address the challenges of climate change and
the desire to limit global warming to 1.5°C. In 2018, Canada’s greenhouse gas emissions were 729 Mt CO2e/yr (NIR 2020 report),
comprising:
• Combustion emissions of 541 Mt CO2e/yr, including those associated with electricity and fuel production (192 Mt CO2e/yr), and the
end use of carbon-based fuels (349 Mt CO2e/yr) for transport, buildings or industrial processes
• Fugitive emissions from fuel and electricity production (55 Mt CO2e/yr)
• Process emission from non-energy industries such as cement, etc. (56 Mt CO2e/yr)
• Agricultural emissions, primarily from nitrous oxide and methane (59 Mt CO2e/yr)
• Waste management emissions, primarily from methane (18 Mt CO2e/yr)
This study focuses on only the emissions from the combustion of fuels (541 Mt CO2e/yr or 74% of all emissions), with particular attention to
the end-use fuels and energy carriers that are consumed in the tens of millions of individual buildings, engines and industrial processes
distributed across Canada. These energy carriers include electricity, gasoline, diesel, kerosene (jet fuel) and natural gas (Figure 1.1).
Improvements in energy efficiency and conservation in these end use sectors will be critical but experience to date shows that the strong
policies in this area are only able to achieve about a 1% improvement per year, effectively balancing population and economic growth.
Clearly, fundamental changes are needed in the energy carriers that are used to move energy resources from where they are produced to
where they are used. Moreover, changes in energy carriers can sometimes be linked with improved efficiencies in delivering energy services
(e.g. electric heat pumps vs. gas furnaces; electric motors vs. internal combustion engines).
There are three options for decarbonization of energy carriers in Canada, and all three are required in most, if not all credible visions for
net-zero emission energy futures (Davis et al. 2018, Tsiropoulos et al. 2020)
• Electrification of end use demand, where the electricity is produced with little or no GHG emissions;
• Biofuels and bioenergy that can be produced without depleting biosphere carbon stocks;
• Hydrogen (or derivatives of hydrogen such as ammonia or synthetic hydrocarbons) where the hydrogen can be produced with little or
no GHG emissions. 141. Introduction (Continued)
A. Canada’s Energy System (2017) B. Possible Net-Zero Energy System (2050)
Efficiency &
Low C Conservation
Generation Fossil Fuels GHG
Biomass
GHG Hydrogen Atmos-
Electricity
pheric
Low C
GHG Biomass CO2
Other Generation
Coal GHG End Use NG (Wind, Solar, End Use
Demand Tidal, Hydro, Demand
Jet GHG Fossil Fuels
GHG Geothermal,
GHG Nuclear) GHG
Diesel Electricity C Capture
Gasoline
& Storage
The Transition GHG The Transition
Accelerator Fossil Fuels
Accelerator
Figure 1.1. Comparison of Canada’s energy system in 2017 (A), and a possible net-zero emission energy system in the future
(B). End use demand for energy is provided by energy carriers that must be zero-emission in the future. The production of
these energy carriers must also be greatly reduced or eliminated. GHG, greenhouse gas. Panel A from NRCan Comprehensive
Energy Database. There is no consensus on the relative importance of the various energy sources or end use fuels or electricity.
151. Introduction (Continued)
Negative emission technologies, such as building forest and agricultural carbon stocks, or
air capture of CO2 coupled to carbon capture and storage, will also play a role in offsetting BOX 1.1. About Hydrogen
the GHG emissions that do occur. In the case of efforts to increase biosphere carbon stocks,
this role needs to be balanced with the previously mentioned demand for biomass for Hydrogen (H) atoms
biofuels and bioenergy. account for 75% of all
the atoms in the
Changing the energy carriers that are used to fulfill end-use demand will also reduce the universe.
market for traditional fuels and the GHG-intense processes currently involved in their
production. It is clear that creating demand for credible and compelling zero-emission Two atoms connected
energy carriers is essential to Canada’s transition to net-zero emission energy systems. makes hydrogen gas (H2),
an energy rich molecule.
In this report, we are focused on the challenges and opportunities associated with the When reacted with
production, distribution and use of low or zero-carbon hydrogen as a fuel in Canada’s net- oxygen gas (O2, from air)
zero emission energy future (See Box 1.1). Hydrogen already plays a significant role in the only water (H2O) is
energy systems of Canada, primarily as an industrial feedstock. This includes the formed.
production of ammonia fertilizer, the conversion of bitumen into synthetic crude oil, and If the two gases come together in combustion,
the production of traditional fuels and other refined petroleum products from oil HEAT is formed. However, if they come
(Figure 1.2). together in a fuel cell, mostly ELECTRICITY
Across Canada, hydrogen production is estimated to be about 3 million tonnes (Mt) per (some HEAT) is created.
year or 8,200 t H2/day. Most of the hydrogen is made from natural gas through a process Electricity can also be used to create hydrogen
called steam-methane reforming (SMR) where the CO2 byproduct is released into through the electrolysis of water.
atmosphere with GHG emissions of approximately 27 Mt CO 2e/yr, equivalent to about 4%
So hydrogen and electricity can complement
of Canada’s GHG emissions.
each other as energy carriers, ultimately
It is worth noting that hydrogen is also produced as a byproduct of some chemical contributing to a more robust energy system
processes (e.g. chlor-alkalai plants), so that gas could provide another potential source of (see Dowling et al. 2020).
hydrogen for a new energy system (Figure 1.2).
161. Introduction (Continued)
A. Hydrogen Today (8.2 kt/d) B. Hydrogen in a New, Net-Zero Energy System
GRAY H2 Some Chemical Plants BYPRODUCT H2
CO2 (a GHG) BLUE H2 GREEN H2
Fossil
Fuels H2
Fossil Fuels H2 Renewables
CO2 O2 H2O
Nuclear
Biomass Sequestered
Export
The Transition
Industrial Feedstocks Industrial Feedstock H2 Fuel
Accelerator
Fertilizer for Fuels for Materials & Fertilizer for Fuels for Materials & Buildings Transport Industry Power
Agriculture Transportation Chemicals Agriculture Transportation Chemicals
Figure 1.2. Comparison of the role hydrogen currently plays in the energy systems of Canada (A), and its possible role in a
future net-zero energy system (B) as a fuel.
171. Introduction (Continued)
In a new, net-zero energy system, the emissions associated with hydrogen production must be dramatically reduced or eliminated, and hydrogen
will need to move beyond its limited role as an industrial feedstock. As shown in Figure 1.2, we envisage that the transition to a new net-zero
energy systems will involve:
a) Reducing by 90% or more, the GHG emissions associated with H2 production from fossil fuels by coupling it with carbon capture and
storage (CCS). Hydrogen could also be made from biomass and if coupled to CCS, it could have negative GHG emissions. H2 produced in
this way is referred to as ‘blue’ H2.
b) Producing ‘green’ H2 from water electrolysis with low or zero-emission power (e.g. hydro, nuclear, wind, solar).
c) Diverting byproduct H2 from certain chemical plants (e.g. chlor-alkalai plants) to new fuel markets for the fuel (Ref).
d) Expanding the use of hydrogen as an industrial feedstock, including into other sectors (e.g. steel making, glass production, etc.)
e) Creating large new markets for H2 as a fuel for sectors such as space heating, transport, heavy industry, and power generation. Recent
work has highlighted the potential role for H2 in providing seasonal storage of renewable power in regions where there are large annual
variations in energy supply and demand.
In recent years, countries around the world have been developing strategies and roadmaps for the deployment of a hydrogen economy, some of
which can be seen in Box 1.2. While these strategies respond to concerns about global climate change and the international commitment to
limit global climate change to 1.5°C, they also align with concerns about air pollution, especially from the combustion of diesel fuel for freight
movement, and with a desire to build future economic growth around infrastructure and technologies that are not at risk of being stranded by
transformative energy system change. Canada’s hydrogen strategy is currently in preparation for a fall 2020 release.
This report begins by exploring the cost of green and blue hydrogen production in Canada (Section 2), and then provides a techno-economic and
lifecycle environmental assessment of possible future energy systems in which hydrogen displaces traditional fossil fuels for transportation or
space heating (Section 3). Section 4 explores the domestic and export market potential for hydrogen before the results are discussed and a
conclusion is provided (Section 5).
18BOX 1.2 A Selection of Regional and National Hydrogen Strategies and Roadmaps
Australia
Germany
United Kingdom
Japan
United States
Norway
South Korea
New Zealand
Denmark
EU Hydrogen
Council
Portugal
International
Energy Agency
China
North Africa
Canada
19TOWARDS NET-ZERO ENERGY SYSTEMS IN CANADA:
A KEY ROLE FOR HYDROGEN
2. The Cost of Hydrogen Production
in Canada
202.1. Setting the Bar
To accelerate the transition to net-zero emission energy systems, it would be ideal if the cost for the alternative, zero-emission energy
carriers were the same or less than the cost of the GHG-emitting energy carriers that are used today. Environmental regulations (e.g.
carbon pricing) and fuel standards can help to level (or tilt) the playing field, but such policy measures can be polarizing from a political
perspective and slow progress. While cost-equivalence for alternative, zero-emission fuels is a ‘high bar’ to set and may not be
achievable in all cases, the closer one gets to meeting that metric, the more compelling the alternative, and the faster the transition.
Table 2.1 provides details on the current range of wholesale and retail prices associated with the three energy systems that currently
provide Canada’s societal needs, including transportation fuels, thermo-chemical fuels and electricity. To allow comparisons, all energy
units have been converted to 2018 Canadian dollars per gigajoule of higher heat value energy (C$/GJhhv).
In the case of transportation fuels like
gasoline and diesel, the current wholesale
price is C$14-24/GJhhv, and the retail price Table 2.1. Comparison of the existing wholesale and retail price ranges for fuels and
(including transportation costs and taxes) is electricity with targeted retail prices for hydrogen to be competitive in the
C$24-41/GJhhv. We have set a target retail marketplace. All values are in Canadian dollars (current) and existing fuel and electricity
price for blue H2 at C$25-35/GJhhv (C$3.50- prices are for the 2010-2020 period. Retail prices include distribution costs and taxes.
5.00/kg H2) for fuel cell grade, compressed
gas (Table 2.1).. Wholsale Price Retail Prices Target H2 Retail Price
Fuel or Electricity Market
Value Units $/GJhhv Value Units $/GJhhv $/GJhhv $/kg H2
Thermo-chemical fuels, such as those used
Transportation Fuels Low $0.50 $/L $14 $0.90 $/L $24 $25 $3.50
for space, water and industrial heating (Gasoline, diesel, kerosene) High $0.90 $/L $24 $1.50 $/L $41 $35 $5.00
currently sell for significantly less than
transportation fuels, ranging from C$1-10/GJ Thermo-chemical Fuels Low $1.00 $/GJ $1 $5.00 $/GJ $5 $7 $1.00
wholesale and C$5-20/GJ retail (Table 2.1). (Natural gas, coal, biomass) High $10.00 $/GJ $10 $20.00 $/GJ $20 $20 $2.80
Electricity Low $20.00 $/MWh $6 $80.00 $/MWh $22 - -
(all sources) High $150.00 $/MWh $42 $300.00 $/MWh $83 - -
212.1. Setting the Bar (Continued)
Since hydrogen being used as a thermochemical fuel is combusted, it does not need to be fuel cell grade nor at the pressures needed by
transportation fuels. Therefore, we have set a target retail price for zero-emission H2 in this sector at C$7-20/GJhhv (C$1.00-2.80/kg H2)
for pipeline-delivered gas.
The retail price for electricity tends to be highly variable in space and time compared to other energy carriers, largely dependent on the
balance between supply and demand. However, hydrogen can both be made from electricity (via electrolysis) and be converted into
electricity (via fuel cells or gas turbines, etc) so they have the potential to complement each other in net-zero energy systems of the
future.
For some end use sectors or regions either hydrogen or electricity will be more convenient, cost-competitive or environmentally
sustainable than the other and will prevail. For example, personally-owned light duty vehicles seem to be migrating to plug-in electric
and electrically powered heat pumps hold great promise for heating and cooling in the more moderate regions of Canada. However,
hydrogen is emerging as the fuel of choice for heavy-duty transport since plug-in battery electric heavy-duty vehicles are challenged by
energy storage capacity, vehicle weights, recharge times and infrastructure requirements. Also, in regions where there are large annual
variations in energy demand (e.g. space heating in colder parts of Canada), the ability to cost effectively store energy as hydrogen in salt
caverns and deliver it through new or retrofitted natural gas pipelines, could make hydrogen more viable than electrification
alternatives.
In this section, we carry out a high-level assessment of the ability of Canada to produce and retail hydrogen at the price targets
identified in Table 2.1.
222.2. An International Perspective
Canada is internationally recognized as among the
world’s lowest cost sources of ‘blue’ and ‘green’
hydrogen. Of all pacific rim countries, Canada has been
identified as the lowest cost producer of green hydrogen
(Figure 2.1), capable of making hydrogen at an energy
price equivalent to the wholesale cost of diesel.
Provinces like Quebec and Manitoba, with low-carbon,
hydro-power grids that produce surplus electricity
should be able achieve this price.
For the production of Blue H2 from natural gas, the
Western Canadian Sedimentary Basin (WCSB, includes
Northern BC, Alberta and S Saskatchewan) is the ideal
location due to the supply of low-cost natural gas, and a
geology that can safely store the CO2 byproduct safely
In this region, it should be possible to produce blue H 2
(90% capture) at a wholesale cost of C$10/GJhhv, one Canada:
half the wholesale, and one third the retail cost of diesel Among the
(Figure 2.1).
world’s lowest
Figure 2.1. A comparison of the cost of blue or green cost producers
hydrogen production from countries in the Asia-Pacific of low/zero C H2.
region. Adapted from Asia Pacific Energy Research
Centre. 2018. Perspectives on H2 in the APEC Region.
(Figure 3.). The vertical shaded regions depict ranges for
Ø Research Centre. 2018. Perspectives on
recent wholesale and retail costs of diesel use in Canada.
The Transition
Accelerator 232.3. Electrolytic Hydrogen Production
Electrolysis creates hydrogen (H2) and oxygen (O2) from water using electricity. In our analysis we focused on the costs for a Polymer
Electrolyte Membrane / Proton Exchange Membrane (PEM) electrolyzer because a number of studies (Benziger et al. 2006, Ramsden
et al. 2013) consider them better suited for use with intermittent power sources. Model parameters from the International Energy
Agency’s Future of Hydrogen (2017) report were adapted for Canadian currency to illustrate the effect of electricity price and use
factors (number of hours per year) on the cost of hydrogen production today, by 2030 and in the future when technology deployment
is mature (Figure 2.2A to C).
Using the IEA model, three case studies were explored, and the results shown on the surface plot and bar charts in Figure 2.2:
q Dedicated intermittent renewable (e.g. wind) with a capacity factor of 34% (3,000 hr/year) where the levelized cost of
electricity (LCOE) is $40/MWh now, but declines to $30/MWh by 2030;
q Low carbon grid power accessed for 6,000 hr/year (68% capacity factor for electrolyzer) at a delivered electricity price of
$80/MWh;
q Low carbon grid power accessed for 6,000 hr/year (68% capacity factor for electrolyzer) at a delivered electricity price of
$20/MWhr. This is the least likely of the three alternatives, only being possible in jurisdictions that often have excess large
hydro or nuclear power.
For electrolytic hydrogen production over the next 10 years, the wholesale cost for green hydrogen may decline to as little as C$3/kg
(C$21+/GJhhv). Given that there are substantial costs associated with transporting, compressing and delivering the hydrogen to
customers, achieving the $3.50/kg H2 target price for a retail transportation will be a challenge. However, with sufficient scale and in
the right location and policies, it may be possible to meet the C$5/kg H2 retail price target for transportation fuels.
However, with technology and manufacturing improvements that come from large scale deployment of renewable electricity
generation, and electrolysis technologies, the viability of green H2 production should dramatically improve (Figure 2.2C).
242.3. Electrolytic Hydrogen Production (Continued)
A. Today B. 2030 C. Future
CAPEX: C$1180/KWe CAPEX: C$920/KWe CAPEX: C$590/KWe
Effic. (HHV): 76% Effic. (HHV): 82% Effic. (HHV): 87%
$12 $12 $12
$10 $10 $10
LCOH ($C/kg H2)
$5.36
LCOH ($C/kg H2)
LCOH ($C/kg H2)
$8 $8 $4.73 $8 $4.12
$4.47
$6 $6 $6
$3.17 $2.38
$4 $4 $4
$2.24
$2 $80 t $2 $1.83 $80 $2 $80
$1.42
$4090 Cos $3090 Cost $30 Cost
$90
60 r$icity h) 0 $ y
$60
$0 $20 $0 $20 icity h)
0 $ $ 6 t ricit W h )
0$20 $0
$30
1 2 3 4 5 6 7 $80 $3 Elect C/MW 1 2 3 4 5 6 7 $80 $ lec /M 3 ct r W
$0
1 2 3 4 5 6 7 8
Electrolyzer use (‘000 hr/yr) ($ E $C
( E le $ C /M
Electrolyzer use (‘000 hr/yr) Electrolyzer use (‘000 hr/yr) (
The Transition The Transition The Transition
Accelerator Accelerator Accelerator
$6 $6 $6
LCOH ($ /kg H2)
LCOH ($ /kg H2)
OPEX
LCOH ($ /kg H2 )
$4 $4 $4
CAPEX OPEX
CAPEX OPEX
$2 $2 $2 CAPEX
Electricity Electricity Electricity
$0 $0 $0
Renewables Grid Low Grid High Renewables Grid Low Grid High Renewables Grid Low Grid High
Figure 2.2. The effect of electricity cost and capacity factor on the levelized cost of hydrogen (LCOH) production for a 4.2 MW PEM Electrolyzser today (A), in 2030 (B)
and in the future (C) when the market is mature. Symbols refer to the three cases described in text. Model adapted from the IEA Future of Hydrogen (2017) report. 252.4. Hydrogen Production from Methane Reforming with CCS
Reforming of natural gas (predominantly methane) dominates hydrogen production in Canada, and the process can be
modified to prevent the atmospheric release of 90% or more of the byproduct CO2. When methane reforming is
coupled to carbon capture and utilization/storage (CCUS) the product is called ‘blue’ hydrogen.
As summarized in Box 2.1, there are two major technologies for 6
blue hydrogen production: steam methane reforming (SMR) Natural Gas Prices in USA and Alberta
with CCS and auto-thermal reforming (ATR) with CCS. 5 US Nat’l Gas Price
Other technologies for production of blue hydrogen include (Henry’s Hub)
CA$/GJhhv NG
biomass or coal gasification coupled to CCS, or methane 4 Avg:
$3.33/GJhhv
pyrolysis to hydrogen and carbon black. While coal gasification
is a mature technology, the others are not yet as mature or 3
Avg:
economically viable as SMR-CCS and ATR-CCS. $1.79/GJhhv
2
Canada is currently one of the lowest cost places to produce
hydrogen with minimal greenhouse gas emissions (Figure 1 Alberta Nat’l
2.1). Reasons include (a) inexpensive natural gas in Western The Transition Gas Price
Accelerator
Canada (Figure 2.3), (b) Alberta-owned pore space for 0
permanent CO2 storage, (c) technical and industry expertise, 2015 2016 2017 2018 2019 2020
and (d) carbon pricing regimes.
Figure 2.4 provides a breakdown of the estimated costs for Figure 2.3. Comparative prices for natural gas (in $CA/GJ NG)
blue hydrogen production (including CCS) from natural gas in the U.S. (Henry’s Hub) and Alberta over the period of
today (Figure 2.4A), by 2030 (Figure 2.4B), and in a future, January 2015 to April 2020.
mature hydrogen economy (Figure 2.4C). 262.4. Hydrogen Production from Methane Reforming with CCS (Continued)
Box 2.1. A. Steam Methane Stack Gas
Natural Gas Reforming with CCS B
Carbon
Reforming with Steam
(export) HRSG Capture
CO2
captured
(Amine)
Carbon Capture Steam Flue Gas
and Storage (CCS) A
Steam- Carbon Pressure
Natural Natural Gas Water Gas
methane Capture Swing H2
Gas (Feed) Purification Shift Reactors
Reformer (Amine) Adsorption
PSA Tail
Air
Gas
Steam
B. Auto-thermal N2 (export)
Air
reforming with Air
Separation
O2 CO2
CCS Steam Captured
Stack Gas
CO2
Natural Natural Gas Pre- Auto-
Water Gas Removal
Gas (Feed) Purification heating thermal H2
Shift Reactors Unit and
Reforming
PSA
H2/Tail Gas
272.4. Hydrogen Production from Methane Reforming with CCS (Continued)
A. Today B. 2030 C. Future
CAPEX: C$2199/KW H2 CAPEX: C$1780/KW H2 CAPEX: C$1675/KW H2
Effic. (HHV): 74% Effic. (HHV): 74% Effic. (HHV): 74%
$3.23
$2.95 $2.87
$4 $4 $4
LCOH (C$/kg H2)
LCOH (C$/kg H2)
LCOH (C$/kg H2)
$3 Reference $3 $3
Reference Reference
$1.63 $1.52 $1.38
$2 $2 $1.30 $2 $1.32 $1.25
$1 $9 $1 $9 $9
$6 $10 e $1
$6
$4 $8$10 e
ric ) $4 $8 Pric ) $6 $10
$4 $8 Pric )
e
$0 $2 P
$6NG J hhv $0 $2 $6 NG J hhv $2 $6 G hv
100 200 300 400 500 600$2
$4 /G 100 200 300 400 500 600$2
$4 ($ /
G $0 $4 N ($/GJ h
($ 100 200 300 400 500 600 $2
$0 $0 $0
Scale of Production (t H2/day) The Transition SMR +CCS Scale (t H2/day) The Transition SMR +CCS Scale (t H2/day) The Transition
Accelerator Accelerator Accelerator
$4 $4 $4
LCOH (C$/kg H2)
LCOH (C$/kg H2)
LCOH (C$/kg H2)
$3 $3 $3
$2 $2 $2
OPEX OPEX
$1 OPEX $1 NG
$1
CAPEX NG CAPEX NG CAPEX
$0 $0 $0
Grey --------- Blue
J ---------
GJ
Grey --------- BlueJ ---------- --------- Blue Grey
J --------- J y e
y J y e e G
e l G ue G r e l u /G /G r
Ref (215 l u
tpd, / /
- Gr (215f-Btpd,
Ref $
/
2AB $9/NS Ref (215-Btpd, 2 AB
- G$1.79/GJf NG) d, $ , $9 NS f - G$1.79/GJef-B NG) d, $2 AB d, $9 NS
e , , f e d R
f
Re $1.79/GJR NG)tpd tp
d Re R tp tp Re 0t
p
0t
p
0 0 0 0 0 0
Figure 2.4. The effect 40of natural
10 gas cost and scale of production (tH2.4/d) on 40the levelized
10 cost of hydrogen (LCOH) from a steam methane 4 1
reformer coupled to carbon
28
capture and storage today (A), in 2030 (B) and in the future (C) when the market is mature. Model adapted from the IEA Future of Hydrogen (2017) report.2.4. Hydrogen Production from Methane Reforming with CCS (Continued)
The calculations were based on the International Energy Agency’s ‘Future of Hydrogen’ model assuming a Canada-US dollar exchange rate
of $C0.76 per $US1 (average of the last 5 years) and an 8% return on capital cost investment. The upper plots in Figure 2.4 show the effect
of natural gas price ($0 to $10/GJhhv) and the scale of hydrogen production (100 to 600 t H2/d) on the levelized cost of H2
production. On each surface plot, three case studies are highlighted:
Ø A reference case based on a 215 t H2/day reformer (based on IEA model) and a NG feedstock price of $1.79/GJhhv NG (average of
Alberta prices over the last 5 years, Figure 2.3);
Ø An Alberta (AB) scenario assuming a 400 t H2/day reformer and a NG feedstock price of C$2/GJhhv ;
Ø A Nova Scotia (NS) scenario which takes into account a C$9/GJhhv price for natural gas and a smaller (100 t H2/day) reformer.
With proven technologies today, the levelized cost of hydrogen (LCOH) for the reference scenario is C$1.63/kg H2 (Figure 2.4A). With
improvements in larger scale deployment of technologies linking H2 production to carbon capture and storage, the LCOH is projected to
decrease to C$1.38/kg H2 by 2030 (Figure 2.4B) and eventually to C$1.32/kg H2 (Figure 2.4C).
Note that even in markets like Nova Scotia with high prices for natural gas, the LCOH for blue hydrogen is similar to, or lower than, the cost
of green hydrogen (Figure 2.2). However, the cost reductions for green hydrogen production over the next 10-20 years are projected to
be steeper than that for blue hydrogen, so green hydrogen could easily out-compete blue hydrogen production costs in such markets by
2030 and beyond.
The bar charts in Figure 2.4A compare today’s LCOH for gray and blue hydrogen production, showing a differential cost of C$0.65/kg. This
translates to a CCS cost of C$74.37/t CO2. While this CCS cost is low compared to many estimates for post combustion CCS costs from coal
etc., it does not take into consideration the other income that could be generated from selling the CO2 into markets that could use it, or in
generating CO2 credits from government programs. These will be considered later in this report, following an assessment of the life cycle
footprint associated with hydrogen production.
29TOWARDS NET-ZERO ENERGY SYSTEMS IN CANADA:
A KEY ROLE FOR HYDROGEN
3. Emissions Intensity and Life Cycle
Implications for Hydrogen
303.1. Emissions Intensity
Like electricity, hydrogen is an energy carrier that produces no greenhouse gas (GHG) emissions when consumed to provide
energy services. However, there can be substantive GHG emissions associated with the production of these energy carriers,
as shown in Figure 3.1.
If ‘gray’ hydrogen is produced by steam methane reforming of natural gas, for every kg of H2 produced, 9 kg CO2 are
associated with the H2 production and another 1.72 kg CO2e/kg H2 is associated with the upstream (NG recovery) and
infrastructure emissions (Figure 3.1). While there are various ways to capture and store the byproduct CO2 to make blue
hydrogen from natural gas, in this study we define blue H2 as 90% CCS from steam methane reforming resulting in net
production emissions of 0.97 kg CO2/kg H2. When combined with upstream and infrastructure emissions of 1.84 kg CO2e/kg
H2, the total emissions are 2.8 kg CO2/kg H2 (Figure 3.1A).
This is a similar GHG emission intensity to hydrogen production from biomass (2.7 kg CO2/kg H2; Mehmeti et al 2018)(Figure
3.1A), and less than green hydrogen produced from solar PV if the lifecycle emissions include those associated with making
the solar panels (3.4 kg CO2/kg H2; IPCC SR15)(Figure 3.1B). In comparison, life cycle emissions associated with green
hydrogen from wind, large hydro and nuclear are about 1 kg CO2/kg H2 and the carbon footprint of hydrogen made from
electricity produced by fossil fuels ranges from 23 to 53 kg CO2e/kg H2.
If the goal is to encourage the production and use of energy carriers that have very low or zero GHG emissions, classifying
the ‘colours’ of hydrogen should be replaced by a classification system that is based on the life cycle carbon
intensity. However, since there is no consensus to date on the how to measure and rank the GHG intensity of hydrogen, we
will continue to use the ‘blue’ and ‘green’ hydrogen designations in this report.
313.1. Emissions Intensity (Continued)
25 60
A. H2 From C-Based Feedstocks B. H2 from Electrolysis
Lifecycle Emission Intensity
20 40
(kg CO2e/kg H2)
15 20
15
Gray
H2 Blue H2
Power Gen’n
10 10
Production
'Blue’ in Green H2
this study
H2
5 5
Upstream and Infrastructure Upstream and Infrastructure
0 0
SMR SMR SMR ATR Biomass NG- NG- AB
Wind Nuclear Hydro Solar Coal
w/o W/ TG W/ FG W/ w/o CCS CCGT SCGT Grid
CCS 50% CCS 90% CCS 95% CCS 15 18 19 66 370 550 659 1008
The Transition
Accelerator
Kg CO2/MWh (Values from IEA & AESO)
Figure 3.1. The greenhouse gas (GHG) emissions intensity for Hydrogen (H2) production from C-based feedstocks (A)
and water electrolysis (B). Values calculated from data extracted from from IEA Future of Hydrogen, IPCC SR15 and
AESO. Biomass life cycle assessment from Mehmeti et al 2018.
323.2. Drivetrain Efficiency Comparison 0.6
A. Drivetrain Efficiency
Drivetrain Efficiency
(GJ ke/GJhhv Fuel)
When H2 is used as a transportation fuel to replace diesel or 0.4
gasoline, the drivetrain may also change from an internal
combustion engine (ICE) to a hydrogen fuel cell electric (HFCE) 0.2
hybrid drivetrain.
As shown in Figure 3.2 A, the HFCE drivetrain tends to be more 0.0
efficient than an ICE in converting a gigajoule of fuel energy into a Diesel-ICE Gasoline-ICE H2-FCE H ybrid
gigajoule of kinetic energy. This is especially true for gasoline ICEs B. Drivetrain Efficiency Ratio
which are typically not as efficient as diesel engines. 1.2
(GJ H2/ GJ diesel or gasoline)
The drive cycle of the vehicles is also important since stop and go
Drivetrain Efficiency Ratio
traffic gives the HFCE vehicles an energy advantage through 0.86
0.8
regenerative breaking.
In this study, we used the average of the possible range of drive 0.56
train efficiency ratios (i.e. ICE:HFCE) to assign a value of 0.86 GJ 0.4
H2/GJ diesel for diesel vehicles and a value of 0.56 GJ H2/ GJ
The Transition
gasoline for gasoline vehicles (Figure 3.2B). Accelerator
0.0
These numbers were combined with the carbon intensity data in H2-FCE vs. Diesel-ICE H2-FCE vs. Gasoline-ICE
Figure 3.1 to calculate the lifecycle GHG emissions reductions
associated with blue hydrogen (90% CCS) displacing diesel fuel in Figure 3.2. Range of drive train efficiencies (GJ of
either a H2-diesel ICE dual-fuel vehicle or a HFCE vehicle (Figure kinetic energy to wheels per GJ of fuel) (A) and the
3.3). ratio of ICE to HFCE vehicles was used to calculate
33
the drivetrain efficiency ratio (B).3.3. Lifecyle Emission Reductions with Blue Hydrogen
If blue H2 is used with a HFCE vehicle to replace a gasoline internal combustion engine (ICE) vehicle, the low drivetrain efficiency ratio (Figure
3.3B) and the low life cycle emission intensity (Figure 3.1A) result in an estimated 89% reduction in per km emissions. The higher drivetrain
efficiency of diesel means that proportional GHG benefits of HFCE in diesel vehicles amount to an 83% reduction in per km emissions compared
to a diesel vehicle (Figure 3.3A). Alternatively, retrofitting a diesel engine to accept 40% of the fuel energy as blue H2 (balance of fuel is diesel)
there is an overall 32% reduction in per kilometre emissions compared to a 100% diesel vehicle (Figure 3.3A). Replacing natural gas with blue H2
for space and water heating reduces lifecycle GHG emissions by 67% compared to natural gas (Figure 3.3C).
A. Diesel Alternative B. Gasoline Alternative C. Nat Gas Alternative
1.2 0.4
1.0 60
Lifecycle GHG emissions
Lifecycle GHG Emissions
(kg CO2e/GJhhv Thermal)
GHG Reduction
Lifecycle GHG Emissions
32% 0.3
Combustion
(kg CO2e/km)
(kg CO2e/km)
0.8
Combustion
GHG GHG
Combustion
Reduction: GHG 40 Reduction:
0.6 83% 0.2 Reduction: 67%
89%
0.4
0.1 20
Fuel Production
The Transition
0.2 Fuel Production Fuel Production
Accelerator
Recovery Recovery Recovery
0.0 0.0 0
Gasoline- H2-FCE NG stion H2
Diesel-H2-FCE
Diesel-ICE H22-Diesel ICE HH22-FCE
-FCE
NG combu H2-combustion
ICE (40:60 by energy) ICE Combustion Combustion
Figure 3.3. Emission reduction potential associated with using 'blue’ hydrogen (90% CCS) as an alternative fuel for diesel in a heavy-duty vehicle (A), gasoline in a light duty vehicle (B)
or natural gas for thermo-chemical energy demands (C). Details of calculations are provided in Appendix A1. 343.2. Lifecyle Emission Reductions with Blue Hydrogen (Continued)
With blue hydrogen, the significant proportion of the lifecycle emissions are associated with methane losses to the atmosphere in the natural
gas recovery processes. Reducing these emissions would play a major role in reducing the lifecycle emissions associated with blue hydrogen
production.
Drawing on the results of Figure 3.1 A and Figure 3.3, it is possible to compare the magnitude of carbon captured and utilized/stored (CCUS, 9
kg CO2/kg H2) with the net lifecycle GHG benefits gained by using that carbon to displace fossil fuel energy carriers in various markets. For
example, using blue hydrogen to replace natural gas in building space and water heating returns a lifecycle GHG reduction benefit of 5.7 kg
CO2/ kg H2. However, with the elimination of tailpipe emissions, using the hydrogen to displace diesel in a H2 diesel dual-fuel vehicle, or in a
HFCE vehicle would return a GHG benefit of 11.1 or 13.4 kg CO2e/kg H2, respectively (Figure 3.4). Replacing a gasoline-ICE vehicle with a HFCE
vehicle could result in a 22.3 kg CO2 benefit per kg H2 (Figure 3.4).
Therefore, it is possible to use CCUS to achieve 1.2 to 2.5 times more than the magnitude of the carbon sequestered. This is because hydrogen
made from natural gas is displacing a more carbon intense fuel and potentially achieving greater drivetrain efficiency.
NG to H2 for buildings Magnitude of CCUS: 9 kg CO2/kg H2
Diesel to H2-Diesel bifuel
Diesel to HFCE truck
Gasoline to HFCE car
The Transition 0 5 10 15 20 25
Accelerator Life Cycle GHG Reduction Benefit (kg CO2e/kg blue H2)
Figure 3.4. The lifecycle greenhouse gas (GHG) reduction benefit associated with using blue hydrogen (90% CCUS) to displace
conventional fossil-fuel-based energy carriers. Details of calculations are provided in Appendix A1.
353.3. Blue Hydrogen and the Value of Managing Carbon
The greenhouse gas benefits of blue hydrogen production and use Box 3.1. Putting Value on Carbon Dioxide
have significant economic implications for a new hydrogen energy system
based on existing and emerging government programs. For example, the Programs that put a coston CO2 to encourage actions that
Alberta government’s Technology Innovation and Emission Reduction (TIER) prevent its release to the atmosphere have been
program has the potential to generate Emission Performance Credits (EPC) implemented provincially and federally. Two of these
from the production of low carbon hydrogen, and the proposed federal clean programs include:
fuel standard (CFS) could provide credits associated with a reduction in the Technology Innovation and Emission Reduction (TIER)
lifecycle emissions associated with the traditional uses of liquid, solid or program: sets benchmark emission standards for Alberta
gaseous fuels (see Box 3.1 for details). In addition, the CO2 byproduct of blue with increasing annual stringency. Compliance flexibility is
hydrogen production could generate economic return if it is used for provided with a carbon price of $30/t CO2e in 2020, and
enhanced oil recovery (EOR). $40/t CO2e in 2021. Consistent with the federal Greenhouse
While the EOR or the TIER-EPC benefits would ultimately accrue to the fuel Gas Pollution Pricing Act, our analysis assumes a price of
producer, the CFS credit, if-and-when deployed, would depend on how the $50/t CO2e in 2022 and beyond, even though this is not
H2 is used and would accrue to the company selling the H2 as an alternative Alberta policy.
to a fossil fuel under the CFS regulation. Clean Fuel Standard: In British Columbia, a low carbon fuel
To assess the potential impact of these carbon values on the net cost of blue standard requires liquid and gaseous fuels to meet lifecycle
hydrogen as a fuel, two analyses were carried out. emission reductions targets. This program is currently
generating credits that sell for over $300/t CO2e. A similar
A. H2 as a thermo-chemical fuel - The first considers the cost of producing,
federal regulation is now under development and beginning
compressing and pipelining hydrogen to nearby markets where it is used
in 2022, with the objective of achieving a 30Mt reduction in
as a thermochemical fuel or industrial feedstock. Assuming a 400 t
GHG emissions by 2030. Credits can be earned with the
H2/day blue hydrogen production facility at a natural gas price of $2/GJ,
supply of low carbon intensity fuels, actions in projects that
the H2 production cost today would be about $1.52/kg (Figure 2.4A).
reduce life cycle emissions, and end-use fuel switching.
Added to that would be compression costs of about $0.20/kg and
These credits can then be traded and sold.
pipelining costs to nearby markets of about $0.60/kg.
363.3. Blue Hydrogen and the Value of Managing Carbon (Continued)
The resulting cost of delivered H2 at reasonable scale (say 5 t H2/day) before considering the economic benefits of managing carbon would
be about $2.32/kg H2, equivalent to $16.43/GJhhv. Figure 3.5 shows how this cost could be reduced with improvements in the capital and
operating costs associated with carbon management in the blue hydrogen production, selling the byproduct CO2 into markets such as
enhanced oil recovery (EOR, Figure 3.5A), collecting Emission Performance Credits under the Alberta TIER program (TIER-EPC, Figure 3.5B)
or generating credits under the federal clean fuel standard that is expected to be deployed in the next few years (CFS, Figure 3.5C).
Improvements in blue hydrogen technologies should reduce costs by $0.31/kg H2, while EOR, TIER-EPC and CFS credits are projected to
reduce the levelized cost of hydrogen (LCOH) by $0.17, $0.32 or $0.96/kg H2, respectively. With today’s technology, and the CFS credits
(estimated as $200/t CO2, based on BC experience with this kind of fuel standard), the net cost of H2 should be about $1.36/kg, equivalent
to about $9.62/GJhhv H2. Compared with the price of natural gas in regions where blue hydrogen production is possible (typically $1.50 to
$3.00 /GJ NG), zero-emission hydrogen is more expensive. However, cost reductions with large scale deployment of blue hydrogen and the
potential to ‘stack’ some of the economic benefits of CO2 management could further reduce the cost of blue hydrogen to $1.05/kg H2
($7.43/GJhhv, Figure 3.5C) or lower. Perhaps most important from the perspective of the new clean fuel standard is that compared to other
fuel changes (e.g. renewable natural gas), the use of blue or green hydrogen promises to be among the most cost effective.
B. H2 as a Transportation Fuel - As a transportation fuel for fuel cell vehicles, hydrogen must be upgraded to fuel cell quality (i.e. high purity,
lacking any contaminants that might damage the fuel cell) and compressed to 450 or 900 bars in order to be available, on demand, to
vehicles coming to the fueling station. This significantly adds to the cost of the fuel, especially if low volumes are delivered each day. In our
scenarios, focused on serving fleets of heavy trucks and buses, we assume larger fueling stations that deliver many tonnes of H2/day
supplying both hydrogen fuel cell electric vehicles and H2-diesel dual fuel vehicles.
Few such stations of this size exist in the world today but current estimates place the cost at about $2.20/kg H2. As these large fueling
stations are deployed, the capital and operating costs are expected to decline 22% by 2030 and 43% by the time the technology
deployment is mature (2040?). These costs are on top of the costs for hydrogen production, pipeline compression and distribution that
would be shared with thermo-chemical demands using the same infrastructure (Figure 3.5). Therefore, the resulting cost for hydrogen as a
transportation fuel would be about C$4.52 assuming a 400 t/day facility is producing hydrogen when natural gas is $2/GJhhv (Figure 2.4),
before considering the value of keeping the CO2 from entering the atmosphere.
373.3. Blue Hydrogen and the Value of Managing Carbon (Continued)
$2.50
$2.14
$2.00 $1.99 Pipeline
$1.91 $1.83 Pipeline
$1.76 $1.68
$1.50 Compression Compression
$1.36
equivalent today
OPEX OPEX $1.12
Natural gas
$1.00 $1.05
LCOH (C$/kg H2)
CAPEX CAPEX
$0.50
Natural Gas Natural Gas
$0.00
EOR
TIER-EPC TIER-EPC
-$0.50 CFS
-$1.00
-$1.50
Today 2030 Future Today 2030 Future Today 2030 Future
A. CO2 sold for Enhanced Oil B. TIER-Emission Performance C. Clean Fuel Standard (CFS)
Recovery (EOR) @$20/t CO2 Credits (EPC) at 80% of @$50/t CO2 credits at @$200/t CO2
Figure 3.5. The effect of technology maturation (today, 2030 and future) and various values for byproduct CO2 associated with the production, compression
and pipeline distribution of blue hydrogen (assumes 400 t H2/day, $2/GJhhv natural gas and 90% of CO2 emissions captured and stored) for use as a thermo-
chemical fuel. The values for CO2 include it being sold for Enhanced Oil Recovery (A), it being used to generate emission performance credits (EPC) under the
Alberta Technology Innovation and Emission Reduction (TIER) program (B), and potential credits generated under the clean fuel standard (CFS, assuming
$200/t CO2) (C). While shown separately here, some of these credits may be stackable. The cost associated with each triangle show the effect of the CFS on
the net retail cost of hydrogen. The costs associated with each triangle show the effect of the carbon value on the net delivered cost of hydrogen. 38You can also read