Strategic Energy Management Plan - Joe Ciarniello - Vancouver Island Health Authority 2018
←
→
Page content transcription
If your browser does not render page correctly, please read the page content below

Strategic Energy Management Plan
Vancouver Island Health Authority
2018

Joe Ciarniello
Executive Summary
Island Health is one of six health authorities in British Columbia, Canada. Through a network of hospitals, clinics,
centres, health units, and residential facilities, Island Health provides health care to more than 794,000 people on
Vancouver Island, on the islands of the Georgia Strait, and in mainland communities north of Powell River, and
South of Rivers Inlet. Our health care services include hospital, community and home care. Island Health also
provides environmental and public health services, including education and prevention.

        Facts & Figures:
  Description                                                       Figures
  Annual Operating Budget                                           $2.5 Billion
  Client Population                                                 794,000 (5.1% of which are Indigenous)
  Employees                                                         21,233
  Staff Unions                                                      14
  Physicians and Volunteers                                         1,900 and 6,000 respectively
  Facilities                                                        150+
  Acute Care & Rehabilitation Beds                                  1,555
  Residential Care Beds & Assisted Living Units                     6,426
  Mental Health & Substance Use Beds                                1,110

Island Health is governed by a board of directors, appointed by the provincial government. An executive team
leads the delivery of health service within the Island Health region. We are publicly funded and accountable to
the provincial government and the public for resources used in delivering health care and services. We are also
focused on reducing greenhouse gas (GHG) emissions in an effort to meet the Provincially legislated GHG
reduction target of 40% below 2007 levels by 2030. In fact, this year’s Annual Priorities Plan for Island Health
explicitly states through Objective 4.6 of Goal 4 “Optimizing Health System Value” that we are to reduce Island
Health’s climate impact by implementing projects to reduce our carbon footprint. Inclusion of this objective
ensures and reaffirms our Strategic Energy Management Plan (SEMP) aligns with the organization’s goals.

Island Health’s SEMP for 2018 provides our updated road map for current and future years to ensure we meet our
goals and targets for reduced energy consumption and GHG emissions. Since the last SEMP was issued in 2017,
BC Hydro’s energy conservation focus has altered course to include electrification and FortisBC’s conservation
program has expanded to double incentives available for gas reduction projects, in part as a result of changes in
Provincial and Federal government policy. As our utility companies grapple with these changes, Island Health is
working to capitalize on the new opportunities that arise while remaining focused on the goals of reducing energy
use, utility costs, and greenhouse gas emissions.

Within Island Health challenges to energy management goals include organizational growth, increasing reliance
on energy intensive technology, decreasing incentives from BC Hydro, shrinking capital funds for projects, and
escalating electrical energy rates. In spite of these pressures, Island Health is committed to meeting legislated
carbon emissions reduction targets and reducing operating costs. Progress since the start of the energy
management program in F2008 is illustrated by a 23% reduction in overall energy use intensity (kWh/m2 /year).
Natural gas rates have also dropped 28% over the same period. However, the organization’s size grew by 27.5%
and electricity rates increased 72%. The reduction in energy use intensity and gas prices have significantly
tempered the impact these negative pressures are having on our business.

One of the tools used to enhance our energy management practices is BC Hydro’s Energy Management
Assessment (EMA). The EMA is used to identify weaknesses in the program and guide us to specific action plans

                                                                                                       2| Page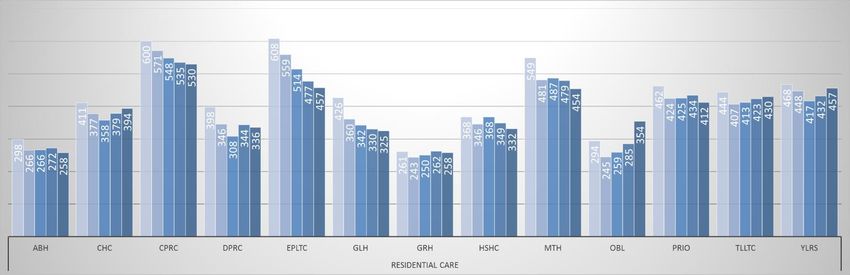
that will help us address those weaknesses over time. The EMA process helps us ensure we are taking a fulsome
approach to energy management. The five areas of focus identified in the 2018 EMA are: vision and strategy,
organizational integration, target-setting, performance tracking and reporting, and planning discipline. The
specific action items in each of these areas of focus are currently being identified and reviewed with facilities
management to ensure consensus, buy-in, and that they are ultimately achievable over the next two years.

Our key energy targets for this year (short term) remain the same as last year. For electricity, our target is to
implement projects that save at least 1,200,000 kWh/year of electrical energy. For natural gas, our target is to
implement projects that save at least 12,000 GJ/year. We are on track for exceeding both these targets. The
total approved capital budget for the energy conservation projects that will deliver these savings is approximately
$3.0MM.

We are currently working to establish realistic long term organization-wide energy use intensity (EUI) targets as
well as site specific EUI targets. To date, our long term targets have really been driven by and reflected in our
GHG emissions reduction target which is to meet or exceed those set in Provincial legislation. The Carbon Neutral
Action Report provides the overview of how this is being achieved.

In terms of progress to date, Island Health’s energy management program has implemented retrofit projects and
other initiatives since F2008 that have resulted in a cumulative impact of $2,639,128 in avoided annual costs1,
62% of which comes from electrical energy.

In addition to the obvious benefits of avoided costs and mitigating the impact on our budgets of an expanding
organization and increasing electricity rates, the energy management program strives to achieve additional
benefits from its projects. These include improved occupant comfort, reduced maintenance costs, and improved
infrastructure reliability. Examples include improved light quality and substantially reduced maintenance
associated with new LED lights, and new heat recovery systems that harvest waste heat from building exhaust to
offset natural gas, and provide improved cooling for occupants during those hotter than normal summer days.

This strategic plan shows what we are committed to delivering this year in terms of savings and what we hope to
achieve in future years, depending on funding availability. We have already completed numerous energy audits
and compiled a list of potential energy conservation project ideas to draw from. Based on the measures identified
in our studies, we have prepared more than 60 capital requests for funding.

Also inherent in this document is the value received from our partnerships with BC Hydro and FortisBC as they
continue to support Island Health through funding for energy managers, specialists, studies, and most importantly
incentives for project implementation. It’s through these partnerships that we are able to maximize the benefits
of our energy management program. This year, we received the largest ever capital project incentives from BC
Hydro for two new hospitals; a total of $1.7MM. This money will be used to fund the next highest capital project
priority.

    1.   $2,639,128 total = $1,004,087 for natural gas at $8.94/GJ (Table 5) and 112,314 GJ/year (Table 3), plus $1,635,312 for electricity at $0.0843/kWh
         (Table 4) and 19,395,500 kWh/year (Table 4).

                                                                                                                                         3| Page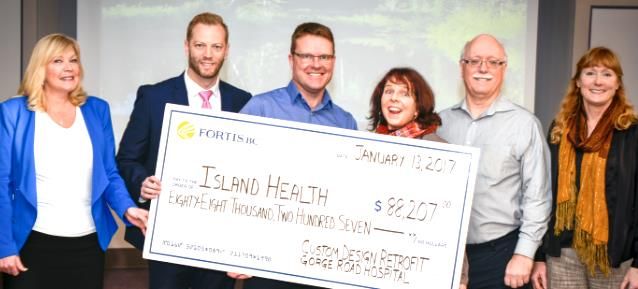
Table of Contents
Executive Summary ............................................................................................................................... 2

Table of Contents .................................................................................................................................. 4

      1. Purpose ..................................................................................................................................... 6

             Key Performance Indicators...................................................................................................... 6

             Organizational Chart................................................................................................................ 8

      2. Multi-Year Plan........................................................................................................................... 9

      3. How Are We Doing? ...................................................................................................................12

             Electrical Energy Savings Booked ............................................................................................. 12

             Natural Gas Energy Savings..................................................................................................... 13

             GHG Emissions and Reduction ................................................................................................ 14

             Electrical Cost Savings............................................................................................................ 15

             Fossil Fuel Cost Savings .......................................................................................................... 17

             Island Health Roll-Up ............................................................................................................. 18

      4. Facility Benchmarks....................................................................................................................20

             Large Acute Care................................................................................................................... 21

             Residential Care.................................................................................................................... 22

             Office/Outpatient Facilities..................................................................................................... 24

             Mental Health ...................................................................................................................... 25

             Health Centre....................................................................................................................... 26

             Laundry Facilities .................................................................................................................. 27

             P3 Performance .................................................................................................................... 28

             Future Island Health Facilities ................................................................................................. 28

             Sites We are Focusing On ....................................................................................................... 29

      5. Energy Studies ...........................................................................................................................30

      6. Awareness and Behaviour Change Program ...................................................................................32

                                                                                                                                       4| Page
7. Risks ........................................................................................................................................34

      8. Opportunities ............................................................................................................................35

             Operations ........................................................................................................................... 35

             Capital Projects..................................................................................................................... 37

Senior Management Approval................................................................................................................39

Acknowledgements ..............................................................................................................................40

Appendix A – Policy – Vision, Purpose and Values Statement ......................................................................42

Appendix B - Site Acronyms and Definitions .............................................................................................47

Appendix C - 2018 Energy Management Assessment (EMA) Goals ...............................................................49

                                                                                                                                        5| Page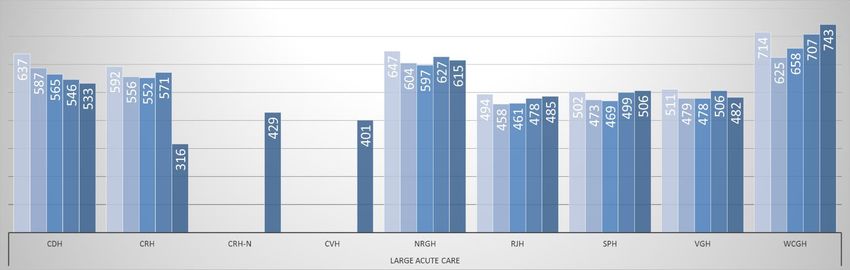
1. Purpose

The Strategic Energy Management Plan (SEMP1 ) is our business plan for reducing energy consumption, utility costs
and greenhouse gas (GHG) emissions. The SEMP sets our objectives and targets for this fiscal year and provides a
realistic plan for achieving them. We can meet our objectives by implementing energy efficiency and conservation
measures in existing and new buildings. The SEMP shows where we are today, where we want to be in the future,
and how we intend to get there. Quarterly reviews of the SEMP will reveal if we are meeting our targets or not. If
not, the Energy Department will work with our stakeholders to adjust the plan.

By looking at actual consumption and cost in Table 6a we can see the net effect on Island Health’s utility budget.
Annual consumption varies depending on energy conservation projects completed in previous years, varying
weather conditions, load creep and costs from changing energy rates and taxes. In F2018 Island Health consumed
104,349,120 kWh of electricity, a 24% increase from the previous year, and 558,202 GJ of Natural Gas, a 2%
increase from the previous year at a total cost increase of 12.2%. The increase in consumption is primarily
attributed to the opening of the new hospitals in Campbell River and Comox.

Though water use has not been a focus of the SEMP, it will be going forward. Consumption was 691,606 m3 in
F2018, a 19.7% decrease from the previous year, at a cost of $1,675,652 (18.2% decrease) so it’s a substantial
piece of our operating budget and needs attention. Plans are evolving and will be reported on in next year’s SEMP.

                                                    Key Performance Indicators

Each year, Island Health’s Energy Department meets with BC Hydro and FortisBC to establish energy reduction
targets. Overarching these targets are the BC Government’s legislated GHG reduction targets for the Province,
enacted through the Greenhouse Gas Reduction Targets Act and the Carbon Neutral Government Regulation.
Savings in electricity and natural gas consumption ultimately reduce GHG emissions, therefore, the SEMP is a key
planning tool used to meet our carbon reduction objectives too.

Our approach to reduced consumption starts with energy studies that identify potential efficiency and
conservation measures and develops the business case for them. The return on investment for these projects is
improved considerably when BC Hydro and FortisBC agree to provide incentives and has typically varied between
14% and 18% in recent years. Energy conservation projects are made up of one or more energy conservation
measures (ECM). After implementation, the calculated ECM savings are “booked” by BC Hydro and FortisBC in
order to measure progress towards meeting targets. Since we have no control over the impacts of weather,
changes in how facilities are used, or increases in service levels, we also measure our success based on avoided
energy use and costs – meaning the difference between the actual consumption and cost and that which we would
have experienced had the measures not been implemented.

1
    The SEMP includes the Energy Department’s EEC Master Project List Excel file.

                                                                                                     6| Page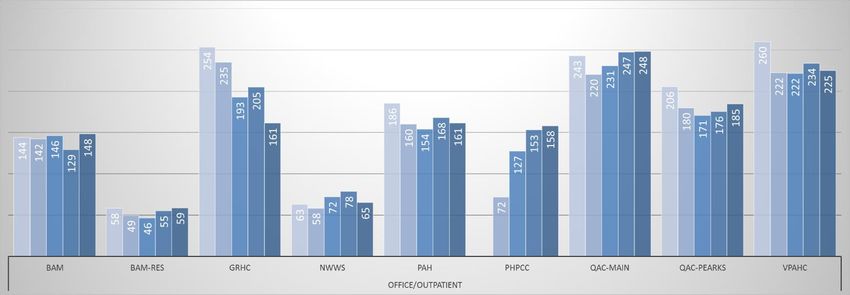
There are four key performance indicators we track in order to develop and assess the success of our Strategic
Energy Management Plan, as follows:

          Electricity Savings           These savings are recognized and “booked” by BC Hydro
          Measured in kWh/yr            through one of their energy conservation programs.

          Natural Gas Savings           These are savings that are recognized by FortisBC through
          Measured in GJ/yr             their Energy Specialist and conservation programs.

          Offsettable GHG Emissions     GHG emissions are based on electricity and fossil fuel
          Measured in tCO2 e/yr         consumed at owned & operated facilities, converted into
                                        tonnes of carbon dioxide equivalents (tCO2 e). Emissions from
                                        equipment such as back-up generators and other internal
                                        combustion engines for activities such as landscaping and
                                        fleet vehicles are not included in this SEMP but are included
                                        in the Carbon Neutral Action Report.

          Energy Use Index (EUI)        EUI is the generally accepted measurement of building energy
          Measured in kWh/m2 /year      performance. EUI results are used to help focus efforts on the
                                        worst performing sites and to monitor progress over time.

                                                                                                    7| Page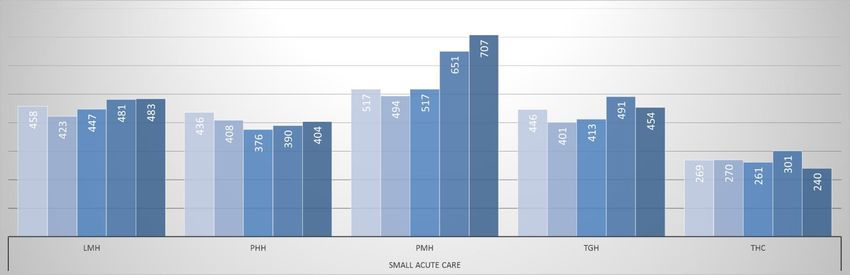
Organizational Chart

                       8| Page
2. Multi-Year Plan
Each year, Island Health’s energy team updates the Multi-Year Plan, an integral part of the SEMP, through focused strategic
planning sessions. The Multi-Year Plan identifies electrical and fossil fuel energy savings and resultant carbon reductions
from currently approved capital projects and projects proposed in future years (see Table 1). The Multi-Year Plan evolves
as new and potentially better opportunities are uncovered through energy studies and advances in technology. The Multi-
Year Plan is a component within the Master Project List (MPL), the Excel file at the heart of our program.

  i.    The MPL allows the energy team to keep track of the status of all active and potential projects, and in particular,
        the expected and actual return on investment. This enables the team to identify whether there are sufficient
        projects underway to meet the objectives and targets as discussed in this SEMP. If not, the team uses the MPL to
        revise the plan in order to ensure the stated objectives are met.

  ii.   The MPL is used to capture any and all ideas. Only those that make sense to do at this time make it into the Multi-
        Year Plan. All ideas are retained on the MPL to be evaluated each year should the business case change. This
        ensures we do not lose sight of opportunities and that we have a healthy source of new ones to draw from as
        funding is made available.

 iii.   Budgets shown in Table 1 for the current year have, of course, already been approved. Capital requests have been
        submitted for projects in future years but approval is uncertain at this time. Projects that are approved will be
        identified and funds released at the start of each fiscal year.

 iv.    Projects highlighted in yellow fall into the “low carbon electrification” category and may qualify for current
        Provincial incentives.

        Table 1 Multi-Year Plan

                                                                                                               9| Page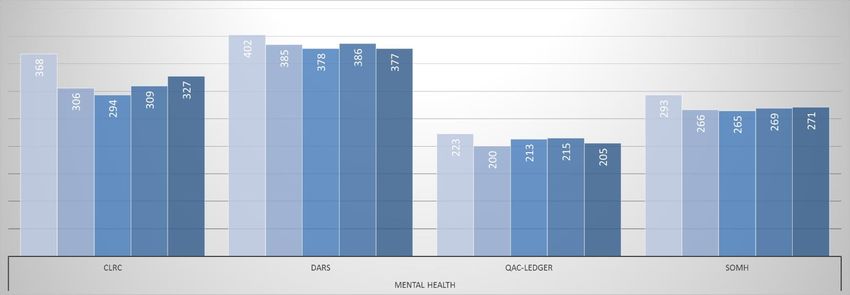
Fiscal       Program Type                                Project Name                           Booked
Year                                                                                                          Booked       Greenhouse
                                                                                               Electrical
                                                                                                            Natural Gas    Gas Savings   Project Costs [$]
                                                                                                Savings
                                                                                                            Savings [GJ]     [tCO2e]
                                                                                                [GWh]
                BOILER         QAC Main - Upgrade to Near Condensing Boiler                     0.000           298            15        $       325,000
           CON-OPS (BCH+FBC)   NRGH - Phase III Continuous Optimization                         0.492          4,267          218        $       400,000
           CUSTOM (BC Hydro)   VGH - D&T Lighting - BCH$                                        0.231            0             2         $       110,000
           CUSTOM (BCH+FBC)    VGH - Zoning -Phase 2 - LDR - CNCP (FBC$ & BCH$ application)     0.101          1,870           94        $       307,500
                               RJH - B3 Replacement - Feedwater Economizer                      0.000          1,538           77        $        86,250
           CUSTOM (FortisBC)   RJH - Royal/ West Block RB.A1 Targeted Ventilation Scheduling    0.033          1,037           52        $        18,000
                               RJH - Royal/ West Block WB.A1 Targeted Ventilation
 2018/19

                               Scheduling                                                       0.017           613            31        $          5,000
           NEW CONSTRUCTION    NIHP - Additional Electrical Savings "tag-on"                    0.133            0             1         $               -
                               RJH - EMP Cooling Tower Replacement + Pumps                      0.014            0             0         $       320,000
           PROGRAM ENABLED
                               VGH - OR Zoning -Phase 1 - CNCP - FBC$                           0.084          1,299           66        $       307,500
                               GRH - Parking Lot Lighting                                       0.001                          0         $       295,000
                 PSPX
                               QAC Parking Lot Lighting                                         0.001                          0         $        90,000
                               NRGH - Phase 3 Zoning & Scheduling - CNCP                        0.406          3,513          180        $       499,000
             VIHA FUNDED       RJH - Steam Trap Repair                                          0.000          1,187           59        $          9,210
                               DPRC - Electronic Zone Control Upgrade - FBC$ - CNCP             0.047           790            40        $       120,000
                                     2018/19 Total                                              1.561         16,412          835        $     2,892,460
                               CDH - Continuous Optimization - BCH$                             0.068           454            23        $        98,200
                               EPLTC_TLLTC - Continuous Optimization - BCH$                     0.090           109            6         $        75,200
             CON-OPS (BCH)
                               WCGH - Continuous Optimization - BCH$                            0.090           243            13        $        93,000
                               CPRC - Continuous Optimization - BCH$                            0.040           110            6         $        34,000
           CON-OPS (BCH+FBC)   RJH - Phase III Continuous Optimization - Implementation         0.423          4,000          204        $       400,000
                               PRIO - Lighting Upgrade - BCH$                                   0.200                          2         $       170,000
           CUSTOM (BC Hydro)
                               DPRC - Lighting Replacement - BCH$                               0.129            0             1         $        84,000
                               RJH - EMP Return Air Conversion - FBC$ - CNCP                    0.000          3,276          163        $       381,000
           CUSTOM (FortisBC)
                               NRGH - Thermal plant upgrade                                     0.000          7,701          384
                               The Summit @ Quadra Village - Model Savings vs Model
           NEW CONSTRUCTION
                               Baseline                                                         0.633          9,684          490        $       716,900
                               CPRC - Boiler & Domestic Hot Water Systems Upgrade - FBC$
 2019/20

                                                                                                0.000           874            44        $       687,000
                               TLLTC - Electric Boiler Replacement                              1.210            0            -247       $       350,000
                               RJH - D&T Dedicated Heat Recovery Chiller - Option 2             0.000         44,477         2,178       $       996,194
                               RJH - Chiller Plant Eliminate Quasi-Teriary Pumping              0.126                          1         $       175,000
                               CICHC - Heat Pump DHW System - CNCP                              0.000            0             33        $       300,000
                               NRGH - Chiller Systems Optimization Phase 1                      0.760          3,397          178        $     2,284,156
             VIHA FUNDED       TLLTC - Pipe Insulation                                          0.035                          0         $        12,000
                               TGH - Pipe Insulation                                            0.000            0             2         $          7,000
                               WCGH - Pipe Insulation                                           0.000            0             27        $        35,000
                               EPLTC - Pipe Insulation                                          0.000           78             4         $          7,000
                               NRGH - Pipe Insulation                                           0.000          1,430           71        $        70,000
                               WCGH - DHW Preheat System                                        0.000            0             25        $        99,000
                               CPRC - Pipe Insulation                                           0.000           128            6         $          6,000
                                     2019/20 Total                                              3.804         75,961         3,615       $     7,080,650

                                                                                                                                     10 | P a g e
Fiscal Program Type Project Name Booked
Year Booked Greenhouse
Electrical
Natural Gas Gas Savings Project Costs [$]
Savings
Savings [GJ] [tCO2e]
[GWh]
DARS ECM4.1.1Condensing Boiler Upgrade 0.000 18 $ 420,250
BOILER
ABH - Boiler Replacement - FBC$ 0.000 380 19 $ 600,000
CUSTOM (BC TLLTC - Lighting Upgrade - BCH$ 0.114 0 1 $ 87,691
Hydro) GLH - Lighting Upgrade - BCH$ 0.200 0 2 $ 150,000
CUSTOM (BCH+FBC) NRGH - Exhaust Air Heat Recovery in Ambulatory Care 0.003 263 13 $ 95,000
GOAL Continuous Optimization Round 2 - South Island 0.154 2,542 128 $ 100,000
LMH - Control System Modifications 0.022 0 9 $ 99,000
2020/21
OHC - Control Systems Optimzation 0.050 80 5 $ 50,000
NRGH - Replace Rehab Chiller with HR and HE Models - CNCP 0.000 14,319 709 $ 1,500,000
RJH - EMP AHU Replacement 0.046 2,630 132 $ 2,255,000
VIHA FUNDED CLRC - Replace RTUs with HRV and Heat Pumps - CNCP 0.000 1,410 70 $ 275,000
GLH - Heating Hot Water Upgrade 0.015 0 0 $ 101,475
RJH - Chiller Plant Chilled Water Optimization Phase 2 0.081 0 1 $ 128,767
WCGH - Heat Pumps for Backup Generator Heating 0.042 0 0 $ 35,000
NRGH - Heat Pumps for Backup Generator Heating 0.105 0 1 $ 75,000
2020/21 Total 0.832 21,624 1,110 $ 5,972,183
CUSTOM (BC PHH - Lighting Upgrade - BCH$ 0.124 0 1 $ 99,000
Hydro) ABH - Lighting Upgrade - BCH$ 0.100 0 1 $ 70,000
CUSTOM (FortisBC) CPRC - Ventilation Upgrades - CNCP 0.003 697 35 $ 70,000
YLRS - Perimeter Heating Controls Integration 0.000 0 3 $ 40,000
DPRC - Energy Efficiency Upgrades 0.051 350 18 $ 99,000
PHH - Energy Efficiency Upgrades 0.000 0 10 $ 99,000
NRGH - Lighting Upgrade in Rehab - BCH$ 0.150 0 2 $ 99,000
2021/22
DPRC - Heat Recovery Chiller - CNCP 0.000 1,350 66 $ 490,000
CHCC - Replace Main Heating Boilers - FBC$ - CNCP 0.000 563 28 $ 637,000
VIHA FUNDED
DPRC - Boiler Room Upgrade - FBC$ - CNCP 0.000 1,340 67 $ 575,000
RJH - Royal/ West RB.A1 & WB.A1 Replacement 0.000 0 0 $ 710,496
RJH - D&T Cooling Towers Replacement 0.645 7 $ 1,916,185
RJH - Chiller Plant Chilled Water Optimization Phase 3 0.264 0 3 $ 380,582
RJH - Chiller Plant - AFD for 1000 Ton Chiller Add 24/7 Loads 0.247 0 3 $ 212,832
NIAB – HVAC System Renewal 0.000 50 3 $ 78,000
2021/22 Total 1.584 4,350 245 $ 5,576,095
11 | P a g e3. How Are We Doing?
Electrical Energy Savings Booked
Table 2 shows electrical savings booked with BC Hydro for the past twelve years as well as the projected savings
in the next four years. Energy savings accumulated over time is more indicative of the energy management
program performance, rather than savings achieved in any one year. A graphical representation of our
performance against the target is shown in Figure 1 (below) and demonstrates that Island Health continues to
exceed targeted savings over the long term.
Table 2 Booked Electrical and Projected Savings Based on Mulit-Year Plan
BC Hydro BC Hydro
Cumulative Savings Cumulative Savings Cumulative
Fiscal Booked Target
Booked Achieved/Projected Achieved/Projected Target Savings
Year Savings Savings
Savings [GWh] [GWh] [GWh] [GWh]
[GWh] [GWh]
F2007 1.722 1.722 1.722 1.722 1.000 1.000
F2008 0.886 2.608 0.886 2.608 1.000 2.000
F2009 0.767 3.375 0.767 3.375 1.000 3.000
F2010 3.798 7.173 3.798 7.173 2.000 5.000
F2011 0.581 7.754 0.581 7.754 2.000 7.000
F2012 1.890 9.644 1.890 9.644 2.000 9.000
F2013 2.750 12.394 2.750 12.394 1.600 10.600
F2014 1.613 14.007 1.613 14.007 1.200 11.800
F2015 1.602 15.609 1.602 15.609 1.600 13.400
F2016 2.280 17.889 2.280 17.889 1.600 15.000
F2017 1.506 19.395 1.506 19.395 1.300 16.300
F2018 5.098 24.494 5.098 24.494 1.200 17.500
F2019 1.561 26.055 1.200 18.700
F2020 3.804 29.858 1.200 19.900
F2021 0.832 30.690 1.200 21.100
F2022 1.584 32.274 1.200 22.300
Figure 1 Booked Electrical Savings vs Target F2007 – F2018 [GWh]
35
30 Impact of making new hospitals more efficient
25
20
15
10
5
0
F2007 F2008 F2009 F2010 F2011 F2012 F2013 F2014 F2015 F2016 F2017 F2018 F2019 F2020 F2021 F2022
Savings Projected [GWh] BC Hydro Booked Savings [GWh] Cumulative Base Target Savings [GWh]
12 | P a g eNatural Gas Energy Savings
Natural gas savings are accounted for by FortisBC through a variety of their conservation programs. Table 3 and
Figure 2 below show savings since F2011 and illustrate performance remains above target.
Table 3 Natural Gas Savings Claimed and Projected Based on Mulit-Year Plan
Cumulative
Total Savings
FortisBC Gas Cumulative Savings FortisBC Target Cumulative
Fiscal Year Achieved/
Savings [GJ] Savings [GJ] Achieved/ [GJ] Target [GJ]
Projected [GJ]
Projected [GJ]
F2007
F2008
F2009
F2010
F2011 2,206 2,206 2,206 2,206 2,206
F2012 10,171 12,377 10,171 12,377 12,377
F2013 14,221 26,598 14,221 26,598 26,598
F2014 11,226 37,824 11,226 37,824 37,824
F2015 13,048 50,872 13,048 50,872 12,000 49,824
F2016 18,149 69,021 18,149 69,021 12,000 61,824
F2017 31,988 101,009 31,988 101,009 12,000 73,824
F2018 11,305 112,314 11,305 112,314 12,000 85,824
F2019 16,412 128,726 12,000 97,824
F2020 75,961 204,687 12,000 109,824
F2021 21,624 226,311 12,000 121,824
F2022 4,350 230,661 12,000 133,824
Figure 2 Tracked Natural Gas Savings F2011 – F2018 [GJ]
250,000
200,000
150,000
100,000
50,000
0
F2011 F2012 F2013 F2014 F2015 F2016 F2017 F2018 F2019 F2020 F2021 F2022
Projected Savings [GJ] Cumulative Target Savings [GJ] Cumulative Savings Tracked [GJ]
13 | P a g eGHG Emissions and Reduction
Since 2007, the majority of Island Health’s GHG emission reduction has been achieved from capital investment in
energy conservation measures at our owned and operated sites. The heating plants in our buildings provide the
heat to keep occupants warm, produce the hot water for hand washing and steam for sterilization and
humidification. While these are essential, our heating plants consume fossil fuels and produce the lion’s share of
our GHG emissions which contribute to climate change.
As shown below in the graph of Island Health Offsettable GHG Emissions, our conservation efforts have had a
positive impact as emissions have declined since 2009, even as the organization has grown. The red line indicates
the Provincial Emissions Reduction Target and the green line predicts where we will be with our current
aspirational investment level beyond 2017, detailed in the Multi-Year-Plan. As we project into the future, we can
see that it will be a challenge to meet legislated reduction targets.
Figure 3 Island Health Offsettable GHG Emissions [tCO 2e]
Actual Emissions from Buildings Actual and Projected Provincial Emissions Target
35,000
32,960
32,376
30,000
31,421
30,207
29,697
29,325
28,623
28,333
27,388
25,000
25,609
24,811
20,000
15,000
10,000
5,000
2007 2008 2009 2010 2011 2012 2013 2014 2015 2016 2017 2018 2019 2020 2021 2022 2023
(Calendar Year)
14 | P a g eElectrical Cost Savings
Electrical energy savings “booked” with BC Hydro each fiscal year since the current energy management program
started is shown in Table 4 below. For the purpose of determining electrical cost savings, it is assumed that the
impacts of energy projects are not realized until the following year and remain in effect in future years.
To show the value of the energy management program, the table adds the energy savings from all prior years,
shown as Cumulative Savings in Effect. The unit cost of energy is shown in the Blended Cost column and is based
on the total cost of electricity for that year divided by the total energy consumed, inclusive of all charges except
tax. These rates are then used to determine the annual avoided costs in each year as shown in the last two
columns.
Table 4 Avoided Electrical Energy Costs from Capital Projects
Savings Cumulative Annual Cumulative
Booked Savings in Savings in Blended Cost Avoided Avoided
Fiscal Year (kWh) Effect (kWh) Effect (kWh) ($/kWh) Costs Costs
F2007 1,722,000 $0
F2008 886,000 1,722,000 1,722,000 0.0491 $84,613 $84,613
F2009 767,000 886,000 2,608,000 0.0524 $136,650 $221,264
F2010 3,798,000 767,000 3,375,000 0.0568 $191,779 $413,042
F2011 581,000 3,798,000 7,173,000 0.0574 $412,078 $825,121
F2012 1,890,000 581,000 7,754,000 0.0611 $473,831 $1,298,952
F2013 2,750,000 1,890,000 9,644,000 0.0679 $655,262 $1,954,215
F2014 1,613,000 2,750,000 12,394,000 0.0732 $907,368 $2,861,583
F2015 1,602,000 1,613,000 14,007,000 0.0763 $1,069,798 $3,931,380
F2016 2,280,500 1,602,000 15,609,000 0.0800 $1,250,108 $5,181,489
F2017 1,506,000 2,280,500 17,889,500 0.0833 $1,490,465 $6,671,953
F2018 5,098,195 1,506,000 19,395,500 0.0843 $1,635,312 $8,307,265
This table shows that the cost of electricity in F2018 would have been $1,635,312 higher if we had no energy
management program in place. It also shows that the cumulative electrical savings of the program since F2008
has reached $8,307,265 in avoided cost. Also, note that the actual rate for electricity has risen from $0.0491/kWh
in F2008 to $0.0843/kWh in F2018 for a substantial 72% increase.
Our electricity bills do not show a year over year reduction in costs reflective of the level of savings shown in Table
4, despite energy management, because of increased rates and total consumption across the organization from
four main factors: increased floor area, increased level of clinical services, increased plug loads, and electrification
(i.e. heat recovery systems). That said, Figure 4 below illustrates where we are today (green line) and where we
would be if we had no energy management program (purple line). The figure also projects where we could be if
we had no increasing demand (load growth) for electricity and still realized all the savings from energy
management (red line).
15 | P a g eFigure 4 Impact of Island Health’s Energy Management Program
we would be here
without energy
management
avoided energy use
we are
here
this is where we could be if
there was no load growth
The difference between the purple line and green line shows the true impact of the energy management program
and represents energy use avoided. The gap between the green and gray lines is the actual increase observed on
our utility bills. The growth in our electrical load is represented by the gap between the purple line and grey line.
The sudden rise in usage experienced in F2018 was due to two new large hospitals coming on-line while the old
hospitals they replaced were required to remain in operation during the nearly year-long transition period.
16 | P a g eFossil Fuel Cost Savings
Fossil fuel cost savings can be attributed to two main actions: savings resulting from energy efficiency projects
and lower natural gas prices. In general, there are two main factors that drive fossil fuel consumption: weather
patterns and changing floor area. It has been observed that, compared to Environment Canada Climate Normals,
the annual heating degree days (a measure of heat demand due to cold weather) over the past decade can vary
by as much as 10% each year. We can remove the effect of heating degree days (HDD) on our fossil fuel
consumption by normalizing with respect to HDD to determine the real savings on a year-over-year basis (see
“Normalized” columns in Table 5). We can also remove the impact of floor area by dividing consumption and cost
by the floor area (see Normalized GJ/m2 and $/m2 ).
Table 5 Actual and Normalized* Fossil Fuel Consumption and Cost
Weather
Actual Normalized Actual Weather Normalized
Fiscal Floor
Year Area m² GJ GJ/m2 GJ GJ/m2 $ $/m2 $ $/m2
F2008 424,479 548,963 1.29 536,648 1.26 6,810,391 16.04 6,657,365 15.68
F2009 427,525 560,928 1.31 532,296 1.25 7,579,436 17.73 7,199,892 16.84
F2010 430,014 518,986 1.21 529,563 1.23 7,279,093 16.93 7,424,205 17.26
F2011 440,562 561,189 1.27 548,744 1.25 7,597,690 17.25 7,430,486 16.87
F2012 470,811 608,650 1.29 580,781 1.23 8,311,276 17.65 7,928,659 16.84
F2013 470,333 592,632 1.26 575,578 1.22 8,228,505 17.50 7,971,355 16.95
F2014 474,414 581,966 1.23 557,882 1.18 8,510,104 17.94 8,157,128 17.19
F2015 474,679 517,862 1.09 541,237 1.14 6,643,362 14.00 6,938,698 14.62
F2016 474,928 512,552 1.08 512,454 1.08 5,333,512 11.23 5,452,872 11.48
F2017 475,047 545,197 1.15 526,797 1.11 5,296,625 11.15 5,246,130 11.04
F2018 541,259 558,202 1.03 502,446 0.93 4,990,901 9.22 4,630,709 8.56
Overall
%change 27.5↑ 1.7↑ 20.3↓ 6.4↓ 26.6↓ 26.7↓ 42.5↓ 30.4↓ 45.4↓
This table illustrates total fuel costs, normalized fuel costs, fuel costs per square meter, and weather normalized
fuel costs per square meter trends over the last 11 years. The data illustrates that while Island Health has
increased its floor area by 27.5%, we’ve experienced substantially reduced costs as a result of rates being cut
nearly in half and by keeping overall consumption in check at 2008 levels.
*Normalized figures are adjusted for fluctuations in weather by using a 30 year average of weather data.
17 | P a g eIsland Health Roll-Up
Tables 6a and 6b show electrical, fossil fuel and total energy consumption and cost for all owned and operated
sites since F2008. Table 6b shows weather adjusted figures which are more indicative of the impact of energy
management since weather effects have been removed. The tables include the organizational-wide Total Energy
Use Index (EUI) based on total energy consumed divided by the total building area of all sites. Since F2008 Island
Health has experienced a drop in EUI from 532kWh/m2 to 409kWh/m2 for a 23% reduction when adjusted for
weather.
Table 6a Floor Area, Energy Consumption, Energy Use Index, Cost and Cost Index
Total
Energy Cost
Fiscal Floor Area Electricity Fossil Total Energy Use Index Total Energy Index
Year [m²] [kWh] Fuel [GJ] [kWh] [kWh/m²] Cost $ [$/m2 ]
F2008 424,479 76,800,572 548,963 229,290,177 540 10,584,120 $24.93
F2009 427,525 76,676,733 560,928 232,490,038 544 11,597,039 $27.13
F2010 430,014 75,124,016 518,986 219,286,918 510 11,547,887 $26.85
F2011 440,562 77,030,702 561,189 232,916,540 529 12,022,992 $27.29
F2012 470,811 80,160,999 608,650 249,230,323 529 13,209,753 $28.06
F2013 470,333 83,969,434 592,632 248,589,559 529 13,933,815 $29.63
F2014 474,414 84,997,725 581,966 246,654,995 520 14,732,811 $31.05
F2015 474,679 84,604,701 517,862 228,455,175 481 13,105,125 $27.61
F2016 474,928 84,706,087 512,552 227,081,757 478 12,117,532 $25.51
F2017 475,047 83,909,232 545,197 235,352,889 495 12,287,528 $25.87
F2018 541,259 104,349,120 558,241 259,416,127 479 13,790,753 $25.48
Table 6b Weather Adjusted Energy Consumption and Total Energy Use Index
Total Energy Use
Fiscal Year Electricity [kWh] Fossil Fuel [GJ] Total Energy [kWh] Index [kWh/m²]
F2008 76,923,726 536,616 225,984,794 532
F2009 76,720,424 532,263 224,572,500 525
F2010 74,955,008 529,527 222,047,028 516
F2011 77,039,459 548,705 229,458,868 521
F2012 80,360,415 580,756 241,682,718 513
F2013 83,994,219 575,548 243,870,017 519
F2014 84,814,260 557,851 239,774,040 505
F2015 84,043,894 541,206 234,380,064 494
F2016 84,000,214 512,424 226,341,364 477
F2017 83,250,335 526,765 229,575,207 483
F2018 81,749,516 502,468 221,324,998 409
18 | P a g eFigure 5 graphically shows the trend of total energy cost compared to EUI (not adjusted for weather). Reduced
natural gas costs yielded significant reductions in overall cost in recent years but the addition of the two new
North Island hospitals in F2018 reversed that trend. Energy use intensity is back on a downward trend.
As Island Health continues to improve and expand service delivery and quality, it’s appetite for energy grows
which just highlights the need to maintain and enhance the energy management program in order to keep costs
in check.
Energy Total - Cost - $ EUI
$15,000,000 550
$14,500,000 540
$14,000,000
530
EUI (kWh/m2/yr)
$13,500,000
$13,000,000 520
$12,500,000 510
$12,000,000 500
$11,500,000
490
$11,000,000
$10,500,000 480
$10,000,000 470
Figure 5 Trend of Total Energy Cost and Total Energy Use Index
19 | P a g e4. Facility Benchmarks
It is important to evaluate building energy performance over time, comparing how each facility performs now
with past performance and how it’s performing relative to other similar facility types within the organization. At
Island Health we prefer to focus on using these internal benchmarks. In other words, we compare ourselves to
our own past performance and strive for year over year reductions at every site.
We have arranged our buildings by facility type, based on their health care purpose, and presented them in terms
of EUI. For each facility type we can see how the EUI has either improved or worsened over the last five years and
compared them to other similar facilities.
The total energy use represents electricity and fossil fuel consumed to meet building needs for heating, cooling,
lighting, ventilation, domestic hot water, clinical functions and process loads. Clinical functions include medical
imaging and laboratories. Process loads include elevators, space humidification, sterilization and food service
kitchens. Backup boiler and generator fuels are not included. (These figures have not been weather corrected.)
20 | P a g eLarge Acute Care
Large Acute Care have unique requirements and provide the most services. Our Large Acute Care facilities
consume the most energy of all our buildings, accounting for 82% of all consumption, 80% of cost and 65% of all
GHG emissions in F2018.
Table 7 Large Acute Care for F2018
Fossil Fuel Total Energy EUI %
Floor Area Electricity Energy Use Index Difference Total Cost Emissions
Site [m²] [kWh] [kWh] [kWh/m²] vs F2008 Index [$/m²] [tCO₂e]
CDH 16,498 3,168,461 5,621,913 533 -15.34% $27 1,043
CRH 16,335 9,512,700 1,869,985 697 -48.15% $17 354
CBR* 32,316 9,512,700 4,342,618 429 n/a $28 881
CVH* 39,826 11,420,700 4,547,392 401 n/a $27 938
NRGH 54,441 13,771,933 19,685,241 615 -9.79% $32 3,410
RJH 155,304 26,852,359 48,544,580 485 -5.65% $23 8,459
SPH 14,302 3,246,031 3,990,714 506 -5.82% $28 751
VGH 49,554 9,164,376 14,729,340 482 -1.82% $24 2,742
WCGH 14,117 3,721,455 6,761,860 743 -2.24% $37 1,254
*New Campbell River and Comox Valley hospitals.
Figure 6 Large Acute Care F2014 to F2018 EUI Performance (kWh/m2 )
21 | P a g eResidential Care
Residential Care facilities are the second highest consumer of energy. These facilities are not as energy intense as
hospitals, focusing instead on providing a home-like environment for residents. Residential Care facilities
represent 12% of our energy consumption, 11% of cost and 13% of our GHG emissions in F2018.
Table 8 Residential Care for F2018
Fossil Fuel Total Energy EUI %
Floor Area Electricity Energy Index Difference Total Cost Emissions
Site [m²] [kWh] [kWh] [kWh/m²] vs F2008 Index [$/m²] [tCO₂e]
ABH 9,726 1,123,384 1,381,511 258 -30.74% $15 260
CHC 5,328 814,030 1,283,788 394 -22.13% $22 239
CPRC 3,662 592,979 1,346,455 530 -16.48% $28 248
DPRC 6,928 740,659 1,584,263 336 -12.26% $16 292
EPLTC 4,000 524,378 1,303,733 457 -16.99% $22 240
GLH 7,609 795,442 1,674,125 325 -26.16% $16 309
GRH 17,517 999,210 3,518,223 258 -28.51% $12 642
HSHC 1,600 266,630 264,113 332 -11.50% $24 50
MTH 2,629 209,255 983,813 454 -15.80% $21 179
OBL 14,381 1,316,074 3,771,829 354 $15 691
PRIO 7,149 839,860 2,105,572 412 0.00% $21 387
TLLTC 4,651 1,885,205 115,511 430 -15.63% $25 41
YLRS 5,467 818,562 1,677,625 457 -31.33% $23 310
Figure 7 Residential Care F2014 to F2018 EUI Performance (kWh/m2 )
22 | P a g eSmall Acute Care
Small Acute facilities are mostly located in and serve rural communities. They represent 2% of our energy
consumption, 4% of cost and 2% of our GHG emissions in F2018.
Table 9 Small Acute Care for F2018
Fossil Fuel Total Energy EUI %
Floor Area Electricity Energy Index Difference Total Cost Emissions
Site [m²] [kWh] [kWh] [kWh/m²] vs F2008 Index [$/m²] [tCO₂e]
LMH 3,981 734,403 1,189,912 483 -16.18% $58 270
PHH 4,463 1,684,761 118,954 404 -27.03% $27 47
PMH 1,176 361,568 470,272 707 20.82% $92 107
TGH 1,700 285,597 485,651 454 -6.47% $49 122
Figure 8 Small Acute F2014 to F2018 EUI Performance (kWh/m2 )
23 | P a g eOffice/Outpatient Facilities
These facilities have been grouped together due to their similar usage profiles. Operating typically during weekday
office hours, these facilities consume the least amount of energy within our portfolio. Office/Outpatient facilities
represent 2% of our energy consumption, 2% of cost and 1% of our emissions in F2018.
Table 10 Office/ Outpatient F2018
Fossil Fuel Total Energy EUI %
Floor Area Electricity Energy Index Difference Total Cost Emissions
Site [m²] [kWh] [kWh] [kWh/m²] vs F2008 Index [$/m²] [tCO₂e]
BAM 700 85,089 18,683 148 -6.52% $20 5
BAM-Res 279 16,368 0 59 -37.38% $7 0
GRHC 799 128,936 0 161 -44.17% $20 1
NWWS 1,858 88,906 31,899 65 34.97% $7 7
PAH 468 75,499 0 161 -22.78% $21 1
PHPCC 475 75,083 0 158 0.00% $21 1
QAC-Main 8,909 803,118 1,406,956 248 -1.21% $14 261
QAC-Pearks 3,905 185,807 534,810 185 -20.18% $10 98
VPAHC 1,181 148,011 117,768 225 0.00% $18 23
Figure 9 Office/ Outpatient F2014 to F2018 EUI Performance (kWh/m2 )
24 | P a g eMental Health
These facilities serve a variety of patients who require mental health and substance use services. These facilities
represent 2% of our energy consumption, 2% of cost and 2% of our emissions in F2018.
Table 7 Mental Health F2018
Fossil Fuel Total Energy EUI %
Floor Area Electricity Energy Index Difference Total Cost Emissions
Site [m²] [kWh] [kWh] [kWh/m²] vs F2008 Index [$/m²] [tCO₂e]
CLRC 5,440 622,420 1,157,787 327 -27.59% $17 214
DARS 1,733 170,554 483,575 377 -14.67% $21 89
QAC-Ledger 2,772 208,747 360,656 205 -24.86% $13 67
SOMH 3,497 337,929 610,942 271 -22.21% $17 113
Figure 10 Mental Health F2014 to F2018 EUI Performance (kWh/m2 )
25 | P a g eHealth Centre
These facilities serve patients on a short term, primary care or urgent care basis. Health Centres represent 2% of
our energy consumption, 3% of cost and 2% of our emissions in F2018.
Table 8 Health Centre F2018
Fossil Fuel Total Energy EUI %
Floor Area Electricity Energy Index Difference Total Cost Emissions
Site [m²] [kWh] [kWh] [kWh/m²] vs F2008 Index [$/m²] [tCO₂e]
CHCC 5,116 864,224 1,824,209 525 -11.18% $27 337
CICHC 2,129 473,987 625,947 517 1.72% $65 143
LCHC 3,348 442,218 622,005 318 -43.19% $21 116
OHC 3,638 597,228 252,466 234 0.00% $17 52
Figure 11 Health Centre F2014 to F2018 EUI Performance (kWh/m2 )
26 | P a g eLaundry Facilities
Laundry facilities are unique because energy use is driven by the amount of laundry processed at these facilities.
There is a small amount of energy used to maintain space comfort. They represent 7.4% of our energy
consumption, 5.8% of cost and 7% of our emissions in F2018.
Table 9 Laundry Facilities F2018
Fossil Fuel Total Energy EUI %
Electricity Energy Index Difference Total Cost Emissions
Site Laundry [kg] [kWh] [kWh] [kWh/kg] vs F2008 Index [$/kg] [tCO₂e]
CRL 3,180,458 604,894 4,733,343 1.68 -26.54% $0.06 856
VGHL 5,975,538 1,851,559 8,817,209 1.79 -8.53% $0.07 1,603
Figure 12 Laundry Facilities F2014 to F2018 EUI Performance (kWh/kg)
2.09
1.98
1.88
1.85
1.79
1.78
1.74
1.71
1.68
1.34
CRL VGHL
27 | P a g eP3 Performance
The energy performance of the Patient Care Centre at the Royal Jubilee Hospital is monitored and reported
monthly. The chart below shows that the EUI of the Patient Care Centre has continued to be steady over past
several years. However, in F2018 there was an increase in the building’s energy use due to more occupied floor
area.
Figure 13 RJH Patient Care Centre EUI (kWh/m2 )
554
452 453 455 463
F2014 F2015 F2016 F2017 F2018
Two new public-private-partnership (P3) hospitals were completed and commissioned in F2018 to replace aging
existing hospitals, one in Campbell River and one in Comox, BC. Both facilities were enrolled in BC Hydro’s New
Construction Program and were designed to meet the LEED Gold standard. As a result, these facilities are
expected to perform substantially better than facilities designed to meet the building code minimum. Actual
performance results and more details of these new hospitals will be reported on in the 2019 SEMP.
Future Island Health Facilities
A major new building will be completed in F2020. The Summit @ Quadra Village is a new 320-bed residential care
facility being constructed by the Capital Region Hospital District. Though Island Health will not own the facility,
we will operate and maintain it and pay all utility costs. Having The Summit enrolled in BC Hydro’s New
Construction Whole Building Design Program enabled the energy team to influence design in order to achieve a
high performance building that will use substantially less energy that it otherwise would have.
28 | P a g eSites We are Focusing On
We mainly focus our efforts on our large acute care centres which, in F2018, accounted for 82% of Island Health’s
total energy bill.
Figure 14 Pie Chart of Total Energy Use by Building Type
29 | P a g e5. Energy Studies
Table 14 lists energy studies Island Health has completed in F2018 and has underway or in planning stages for
F2019 and F2020. Many of the studies are honing in on specific opportunities or more specialized initiatives. Other
criteria for completing an energy study includes sites that have not had an energy study in the last three to four
years and have a high EUI and/or high total energy use.
On average Island Health invests over $200,000 per year on studies. Historically BC Hydro covered 100% of the
cost of studies that met a broad range of criteria. However, BC Hydro has reduced their funding and scope of
interest down to just funding a maximum of 50% of the cost and limiting scope to lighting and HVAC controls.
Their criteria may change in the next year depending on the direction taken with electrification programs. FortisBC
currently funds 50% of a study that meets specific natural gas reduction criteria. The remaining 50% is paid out
should sufficient measures assessed in the study be implemented. Completion of energy studies is the life blood
of an energy management program and the basis for sound decision making for projects and energy reduction
strategies. Energy studies are also required to apply for Carbon Neutral Capital Program funding from the Ministry
of Health.
Table 14 Studies Recently Completed and Planned
Site and Title Cost
Completed in F2018
CICHC DHW Heat Pump System Study $13,500
TLLTC Eplus Boiler Replacement Options $13,600
NRGH PIEVC Study $80,000
NRGH Chiller Systems Study $61,000
RJH Final Look at D&T Airside Heat Recovery $25,500
DPRC HVAC controls $3,000
DARS, SOMH, Pandora BC Hydro Energy Study $28,700
VGH Water Study $7,500
SPH Optimize DHW System $6,000
Yucalta Heat Pumps Study $17,000
RJH Royal West $13,000
RJH C-Op $104,000
NRGH ICU Climate Change Impact Study $7,500
VGH Biomed Envelop Study $14,500
EMP Return Air & Heat Recovery Penthouse $12,500
Total $407,300
30 | P a g eProposed or Underway in F2019 and F2020
NRGH Thermal Plant ECM Assessment $35,000
NRGH Rehab AHU Renewal and ECM Assessment $60,000
C-Op Round II: EPLTC, TLLTC, CDH, CPRC $15,000
C-Op Round II: WCGH $20,000
VGH AHU Renewal & Optimization $20,000
Cumberland Laundry Comprehensive Study $25,000
RJH C-Op (balance of project) $50,000
VGH DHW System Renewal & Optimization $25,000
SPH BC Hydro Custom Study $15,000
VGH Zoning Phase 3 $25,000
RJH Water Study $20,000
RJH PCC Comprehensive Study $45,000
Total $355,000
31 | P a g e6. Awareness and Behaviour Change
Island Health recognizes the role and impact employees have on reducing energy consumption and GHG
emissions. The Energy Department leads the Energy Wise Network Program (EWN) which supports facilities
maintenance and operations staff (FMO) at all owned sites.
Energy Wise Network Program
Building on the success of last year’s EWN campaigns, the year-long Building Energy Challenge Campaign focuses
on FMO staff and includes a series of activities targeting different continuous optimization opportunities. The
intent is to encourage new habits of looking for energy saving opportunities as part of daily rounds.
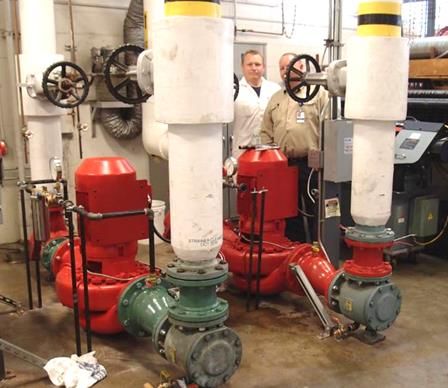
As a result of the 2017 “fans and pumps” campaign for example, the Victoria General Hospital FMO team identified
substantial energy savings associated with a pair of old heating hot water pumps. New pumps were installed
along with variable speed drives resulting in measureable energy savings along with increased system reliability.
Figure 15 - Victoria General Hospital’s new heating hot water pumps.
This year’s training focuses on direct digital controls (DDC) opportunities and promotes best practices and provides
low cost/no cost paths to energy savings. Examples include schedules to turn off equipment when not needed,
reduced heating or increased cooling temperature setpoints after-hours, improved sequences of operations, and
enhanced maintenance procedures.
In an effort to make it easier for FMO staff to implement the concepts promoted in the webinars, checklists have
been developed to help crews identify energy savings opportunities.
FortisBC provided funding in the amount of $10,375 in F2018 to cover the cost of developing and hosting three
webinars. These training webinars encouraged dialogue amoung FMO staff from various locations and were so
well received that the energy team is hosting similar webinars in F2019 with support from both FortisBC and BC
32 | P a g eHydro.
Figure 16 Island Health F2018 Building Energy Challenge – Webinar slide
33 | P a g e7. Risks
There are several risks that need to be considered in planning and executing our SEMP, including:
Persistence – particularly with respect to initiatives such as building re-commissioning and behavioral
programs; taking steps to ensure energy savings are maintained will be very important to the overall success
of the energy management program.
Limits to energy efficiency and conservation – despite the progress made to date upgrading and optimizing
existing facilities, in order to achieve the longer term GHG reduction targets, Island Health will need to
implement alternative low/no GHG emissions strategies.
Capital funding is becoming more difficult to secure. Island Health has explored various options to address
this including partnering with third parties on construction of low carbon energy plants. This does not appear
to be an option without Island Health incurring capital debt so alternatives are being explored.
Reduction in program funding from BC Hydro - energy managers are currently only funded for 50% of their
salary. Energy studies are only funded to a limit of 50% and Continuous Optimization program funding has
been reduced to about 15% of what it was. To make matters even more challenging, incentive agreements
now have an expiry date of under one year. This adds constraints to project planning and further limits the
type of projects that can be considered.
Risks are being addressed in part by setting aggressive energy and greenhouse gas emission targets for all new
construction projects. Setting targets for existing sites is also being used to mitigate the risks, in particular at sites
that have had extensive energy retrofits. The key going forward will be to ensure that infrastructure renewal,
renovations, and additions to facilities include energy reduction features as part of design.
Behavior change and training of staff will help ensure energy becomes a priority for everyone in Island Health.
Training is helping facility operators monitor energy use performance as well as ensure we only purchase the most
energy efficient products and equipment and capitalize on all available incentive programs.
34 | P a g e8. Opportunities
Fortunately, there are opportunities for saving energy and reducing GHG emissions. Below, we provide an
overview of those we’ve been actively employing or are considering.
Operations
Recommissioning and Continuous Optimization (C-Op)
Island Health has enrolled 23 facilities in BC Hydro’s Continuous Optimization program (C-Op). Phase I and Phase
II sites have completed implementation and post-implementation verification sessions. For the Phase III sites, VGH
has completed implementation and is now in the coaching phase. NRGH has completed the investigation phase
and is currently implementing measures. RJH is in the investigating phase and will be moving to implementation
in the latter part of F2019. Five sites have been identified and enrolled in the Round 2 program. CDH, CPRC,
EPLTC, and TLLTC will be undergoing a Refresh (i.e. check-in) investigation while WCGH will go through a full
recomissioning.
Recommissioning and continuous optimization are the best strategies to arm operators with because benefits are
achieved without incurring major capital expense. These strategies help ensure we get the most out of our existing
assets and that should always be our first step. It takes diligence, patience, and consistent support to achieve
success. However, once a site has gone through the program, savings often exceed expectations.
Table 15 C-Ops Sites within Island Health
Phase I Queen Alexandra Centre for Children
Saanich Peninsula Hospital
Aberdeen Hospital
Priory Hospital
Ladysmith Community Health Centre
Trillium Lodge1
Eagle Park1
Cowichan District Hospital1
Chemainus Health Care Centre
Cairnsmore Place1
West Coast General Hospital2
Phase II Cowichan Lodge
Lady Minto
Gorge Road Hospital
Glengarry Hospital
Yucalta Lodge
Dufferin Place
Cumberland Health Centre
Port Hardy Hospital
Campbell River Hospital
Phase III Victoria General Hospital
Nanaimo Regional General Hospital
Royal Jubilee Hospital
35 | P a g eEnergy Management Information System (EMIS)
Island Health and BC Hydro have invested in the implementation of an EMIS. To date we have 23 sites where
remote monitoring of the main electrical and natural gas utilities is in place.
We have provided training to facilities staff so they can use the tool for regular monitoring and troubleshooting
of energy use anomalies and have developed routine reports and e-mail alerts so facility operators can extract
more useful and timely information from the system. This system is also being used for the implementation of site
specific targets as shown below for WCGH, for example. All sites that have the EMIS system installed have site
specific targets in place.
Unfortunately, BC Hydro has abruptly terminated it’s funding of this EMIS program effective July 1st, 2018. Island
Health is now considering its options.
Figure 17 Sample Trend from WCGH Showing Baseline, Actual, and Target Elecrtrical Demand
Optimizing Purchasing Decisions
Significant opportunity lies within the purchase of equipment and supplies for Island Health. Deployment of a
policy for smarter purchasing of building equipment that is, for example ENERGY STAR rated, or for furniture and
materials that are healthier will improve indoor air quality and reduce energy use.
36 | P a g eCapital Projects
New Buildings
All new Island Health facilities strive for the highest levels of patient care and lowest energy use. It is our intent
that all new construction and major renovations participate in the BC Hydro New Construction Whole Building
Design Program to model and evaluate building performance before it is built.
Evidence of using a collaborative, integrated design process, like the one fostered by the new construction
program, can be seen in the design of the new North Island hospitals in Comox and Campbell River as well as The
Summit building. Island Health, along with all public sector organizations, has been mandated by the government
to take action on new construction to reduce greenhouse gas emissions; this is indicated in the government’s
2008 Climate Action Plan and the 2016 Climate Leadership Plan. Island Health is required to build all new
construction to the LEED Gold standard. The Province’s 2016 Climate Leadership Plan further mandates a 10 year
emissions reduction plan and a 10 year climate change adaptation plan. To meet those requirements the new
facilities will have to have very low greenhouse gas emissions (i.e. Net Zero) and be adapted for future climate.
Heat Recovery
Heat recovery will continue to be a valuable opportunity in retrofit and new construction projects. By utilizing
heat from building exhaust and other sources and harvesting it with heat pumps for example, we can substantially
lower natural gas consumption and GHG emissions.
Alternative Energy
Solar thermal and solar electric panels have been installed at several Island Health sites. Though costly, these
systems do offset natural gas and purchased electricity and have the potential to provide some level of self
sufficiency.
Figure 18 Solar Electric Panels at WCGH
Island Health has spent several years reviewing the costs and benefits of installing biomass boilers at a handful of
sites. The most favourable economics seems to be at larger facilities due to the economies of scale and boilers
that are more forgiving of variability in fuel quality. In spite of a good business case, it has not been possible yet
to secure funding for a biomas boiler plant in part due to capital funding constraints, as well as, increased risk
associated with quality and reliability of biomass fuel supply.
37 | P a g eYou can also read