Grid-interactive Efficient Buildings - Overview April 2019 - Energy.gov
←
→
Page content transcription
If your browser does not render page correctly, please read the page content below
Grid-interactive Efficient Buildings
Overview

April 2019
(This page intentionally left blank)
GRID-INTERACTIVE EFFICIENT BUILDINGS: OVERVIEW

Disclaimer
This report was prepared as an account of work sponsored by an agency of the United States Government.
Neither the United States Government, nor any agency thereof, nor any of their employees, nor any of their
contractors, subcontractors, or their employees, makes any warranty, express or implied, or assumes any legal
liability or responsibility for the accuracy, completeness, or usefulness of any information, apparatus, product,
or process disclosed, or represents that its use would not infringe privately owned rights. Reference herein to
any specific commercial product, process, or service by trade name, trademark, manufacturer, or otherwise,
does not necessarily constitute or imply its endorsement, recommendation, or favoring by the United States
Government or any agency, contractor, or subcontractor thereof. The views and opinions of authors expressed
herein do not necessarily state or reflect those of the United States Government or any agency thereof.

Comments
The Energy Department is interested in feedback or comments on the materials presented in this document.
Please write to:

        Monica Neukomm

        Senior Advisor

        U.S. Department of Energy

        1000 Independence Avenue SW

        Washington, DC 20585-0121
Authors
The authors of this report are:

                          Monica Neukomm, U.S. DOE

                          Valerie Nubbe, Navigant Consulting, Inc.

                          Robert Fares, U.S. DOE

Acknowledgments
The authors would like to acknowledge the valuable guidance and input provided during the preparation of this
report. The authors are also grateful to the follow list of contributors. Their feedback, guidance, and review
proved invaluable in preparing this report.

        Contributors:

                          David Nemtzow, U.S. DOE

                          Karma Sawyer, U.S. DOE

                          Amir Roth, U.S. DOE

                          Michael Specian, U.S. DOE

                          Marina Sofos, U.S. DOE

                          Nelson James, U.S. DOE

                          Sarah Zaleski, U.S. DOE

                          Jared Langevin, Lawrence Berkeley National Laboratory

                          John Mayernik, National Renewable Energy Laboratory

                          Chioke Harris, National Renewable Energy Laboratory

                          Rebecca Ciraulo, Navigant Consulting, Inc.

                          Warren Wang, Navigant Consulting, Inc.
GRID-INTERACTIVE EFFICIENT BUILDINGS: OVERVIEW

List of Acronyms and Abbreviations
 BAS        building automation system

 BTO        DOE Building Technologies Office

 CAISO      California Independent System Operator

 CHP        combined heat and power

 DER        distributed energy resource

 DOE        U.S. Department of Energy

 DR         demand response

 EE         energy efficiency

 EIA        Energy Information Administration

 ERCOT      Electric Reliability Council of Texas

 EPRI       Electric Power Research Institute

 EV         electric vehicle

 FERC       Federal Energy Regulatory Commission

 GEB        grid-interactive efficient building

 GW         gigawatt

 HEMS       home energy management system

 HVAC       heating, ventilation, and air conditioning

 ISO        independent system operator

 ISO-NE     New England Independent System Operator

 kVAR       kilovolt-ampere reactive power

 kW         kilowatt

 LBNL       Lawrence Berkeley National Laboratory

 MISO       Midcontinent Independent System Operator

 MW         megawatt

 MWh        megawatt hour

 NYISO      New York Independent System Operator
ORNL   Oak Ridge National Lab

PCM    phase change material

PJM    Pennsylvania New Jersey Maryland Interconnection

PLMA   Peak Load Management Alliance

PV     photovoltaic

R&D    research and development

RTO    Regional Transmission Organization

SEPA   Smart Electric Power Alliance

SPP    Southwest Power Pool

T&D    transmission and distribution
GRID-INTERACTIVE EFFICIENT BUILDINGS: OVERVIEW

Glossary
Note: These definitions are for the purposes of Grid-interactive Efficient Buildings. They may be defined
differently or more generally in other contexts.

  Energy Efficiency (EE)       Ongoing reduction in energy use to provide the same or improved
                               function

  Demand Response (DR)         Change in the rate of electricity consumption in response to price signals
                               or specific requests of a grid operator

  Distributed Energy           A resource sited close to customers that can provide all or some of their
  Resource (DER)               immediate electric and power needs and can also be used by the system to
                               either reduce demand (such as energy efficiency) or provide supply to
                               satisfy the energy, capacity, or ancillary service needs of the distribution
                               grid. The resources, if providing electricity or thermal energy, are small
                               in scale, connected to the distribution system, and close to load.
                               Examples of different types of DERs include solar photovoltaic (PV),
                               wind, combined heat and power (CHP), energy storage, demand response
                               (DR), electric vehicles (EVs), microgrids, and energy efficiency (EE) [1].

  Demand Flexibility           Capability provided by DERs to reduce, shed, shift, modulate or generate
                               electricity; energy flexibility and load flexibility are often used
                               interchangeably with demand flexibility

  Smart Technologies for       Advanced controls, sensors, models and analytics used to manage a range
  Energy Management            of energy assets, while responding to changing ambient and grid
                               conditions, saving energy, and meeting occupants requirements

  Grid-interactive Efficient   An energy efficient building with smart technologies characterized by the
  Building (GEB)               active use of DERs to optimize energy use for grid services, occupant
                               needs and preferences, and cost reductions in a continuous and integrated
                               way

  Grid Services                Services that support the generation, transmission, and distribution of
                               electricity from the utility to the consumer and provide value through
                               avoided electricity system costs (reduced generation costs and/or reduced
                               delivery costs); this report focuses on grid services that can be provided
                               by grid-interactive efficient buildings

vii   Glossary
Table of Contents
Glossary ....................................................................................................................................................................... vii
I Background ......................................................................................................................................................... 10
I.1 Strategy and Vision .................................................................................................................................... 10
II Building Demand Flexibility and Associated Grid Services .............................................................................. 12
II.1 Building Demand Flexibility ....................................................................................................................... 12
II.2 Grid Services .............................................................................................................................................. 16
III Grid-interactive Efficient Buildings .................................................................................................................... 20
III.1 Characteristics of a Grid-interactive Efficient Building ............................................................................ 20
III.2 Strategies for Optimization ........................................................................................................................ 21
III.3 Knowledge Gaps and Future Research Opportunities ............................................................................ 24
IV References .......................................................................................................................................................... 26
V Appendix ............................................................................................................................................................. 30
V.1 Grid Services .............................................................................................................................................. 30
V.2 Demand Response .................................................................................................................................... 32
Table of Contents viiiGRID-INTERACTIVE EFFICIENT BUILDINGS: OVERVIEW List of Figures Figure I.1 Example Commercial Grid-interactive Efficient Building ........................................................................ 11 Figure II.1. Building Flexibility Load Curves .............................................................................................................. 13 Figure II.2. Grid-interactive Efficient Building Load Curves ..................................................................................... 14 Figure II.3. Demand Response Classifications ........................................................................................................ 16 Figure III.1 Characteristics of Grid-interactive Efficient Buildings........................................................................... 20 Figure III.2. Energy Sharing in a High-Efficiency District .......................................................................................... 23 Figure V.1. Demand Response Evolution ................................................................................................................. 32 Figure V.2. Demand Response Classifications ........................................................................................................ 33 Figure V.3. Demand Response Participation ........................................................................................................... 34 Figure V.4. Regional Utility DR Snapshot ................................................................................................................. 35 List of Tables Table II.1 Demand Flexibility Modes in Buildings to Grid Services ......................................................................... 14 Table II.2. Demand Flexibility Benefits ..................................................................................................................... 17 Table II.3. Potential Grid Services Provided by Demand Flexibility in Buildings .................................................... 18 Table II.4. Mapping Flexibility Modes to Grid Services ............................................................................................ 19 Table III.1. Strategies for Demand Flexibility ........................................................................................................... 22 Table V.1. Grid Services Avoided Cost, Buildings Market Size, and Example Building Technologies................... 30 ix List of Figures
I        Background
To help inform the greater building research community and advance U.S. Department of Energy Building
Technologies Office’s (BTO) research and development (R&D) portfolio, BTO is publishing a series of
technical reports evaluating the opportunities for grid-interactive efficient buildings (GEB). Following this
GEB Overview report, four technology reports will be published in summer 2019 covering major relevant
building technology areas implicated in demand flexibility:

    • Heating, ventilation, and air conditioning (HVAC); water heating; and appliances

    • Lighting

    • Building envelope and windows

    • Sensors and controls, data analytics, and modeling

These reports will include evaluations of state-of-the-art and emerging building technologies that have the
potential to provide grid services. Reports will also identify major research challenges and gaps facing the
technologies, as well as opportunities for technology-specific R&D. The GEB Technical Report Series will
help inform and guide BTO’s R&D portfolio and serve as a foundational resource for the larger building
research community. Onsite behind-the-meter generation, battery storage and electric vehicles (EVs) are also
an important part of the distributed energy resource (DER) optimization strategy for buildings. In general, the
component technology reports do not focus on distributed generation or battery storage, but the GEB Sensors
and Controls, Data Analytics, and Modeling report will discuss how a building can optimize across all DERs.

This GEB Overview report serves as an introduction to these technical reports and provides background on
core concepts of GEB. This report addresses how flexible building loads can be integrated and controlled to
benefit consumers, the electric grid, and society more broadly. When all technical reports are published, an
addendum to this report will cover the synergies and interactions among technology areas.

I.1     Strategy and Vision
BTO has a mission to support the R&D, validation, and integration of affordable, energy-saving technologies,
techniques, tools, and services for buildings (existing and new, residential and commercial). In support of this
mission, BTO is developing a GEB strategy which aims to optimize across DERs to advance the role buildings
can play in energy system operations and planning. The GEB strategy will drive towards greater affordability,
resiliency, environmental performance, reliability and broader goals, recognizing that:

    • Building end uses can be dynamically managed to help meet grid needs and minimize electricity system
      costs, while meeting occupants’ comfort and productivity requirements;

    • Technologies like rooftop photovoltaics (PV), electrochemical and thermal energy storage, combined
      heat and power (CHP), and other DERs can be co-optimized with buildings to provide greater value and
      resiliency to both utility customers and the electricity system; and

    • The value of energy efficiency, demand response, and other services provided by behind-the-meter
      DERs can vary by location, hour, season, and year.

A key part of this strategy will include utilizing smart technologies (sensors, actuators, controllers, etc.) for
building energy management. This is one of the core areas of technological investment for BTO. It is estimated
that using state-of-the-art sensors and controls across the commercial building stock could lead to annual
energy savings of 29% through use of high-performance sequence of operations and optimizing programmable
settings based on occupancy patterns, as well as detecting and diagnosing equipment operation/installation
problems [2]. In addition, studies have shown that 10-20% of commercial building peak load can be

                                                                                                I Background 10
GRID-INTERACTIVE EFFICIENT BUILDINGS: OVERVIEW
temporarily managed or curtailed to provide grid services with the use of state-of-the-art sensors and controls
[3] [4]. Accordingly, these strategies are available and necessary for implementing flexible, grid-interactive
strategies to optimize building loads within productivity or comfort requirements.
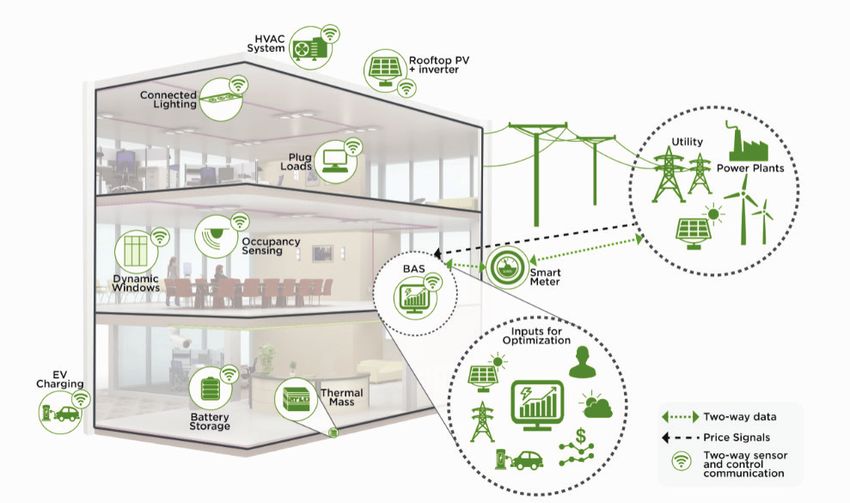
The vision of GEB is the integration and continuous optimization of DERs for the benefit of the buildings’
owners, occupants, and the electric grid. As shown in Figure I.1, the example GEB utilizes analytics supported
by sensors and controls to optimize energy use for occupant patterns and preferences, utility price signals,
weather forecasts, and available on-site generation and storage. In the building depicted in Figure I.1, a suite of
advanced building technologies— including the HVAC system, connected lighting, dynamic windows,
occupancy sensing, thermal mass, and distributed generation and battery storage— are optimized to meet
occupant and grid needs. In many buildings, smaller sets of existing technologies could be integrated and
controlled.
© Navigant Consulting Inc.
Figure I.1 Example Commercial Grid-interactive Efficient Building
The Building Automation System (BAS) utilizes analytics supported by sensors and controls to optimize energy use for
occupant patterns and preferences, utility price signals, weather forecasts, and available on-site generation and storage.
11 I BackgroundII Building Demand Flexibility and Associated Grid
Services
II.1 Building Demand Flexibility
Building demand flexibility is the capability provided by on-site DERs to reduce, shed, shift, modulate or
generate electricity. Building demand flexibility can be used, typically in response to price changes or direct
signals, to provide benefits to buildings’ owners, occupants, and to the grid.
Growing peak electricity demand [5], transmission and distribution (T&D) infrastructure constraints, and an
increasing share of variable renewable electricity generation are stressing the electrical grid. Flexible,
dispatchable electricity loads can be used to reduce grid stress, creating a more resilient and reliable grid, while
simultaneously lowering costs for consumers.
Operating an electricity grid is tantamount to balancing supply and demand for different time scales under the
constraints of limited supply resources. Demand is traditionally viewed as a given, and matching services are
largely provided by supply-side entities: integrated utilities, grid operators, and generators. Demand-side
entities such as buildings and electric vehicles have traditionally contributed to balancing supply and demand
in limited ways; however, demand-side contributions can be just as viable as supply-side counterparts. For
instance, avoided energy use through energy efficiency is often the least-cost system resource. Energy
efficiency is approximately one-half to one-third the levelized cost of generated electricity because it alleviates
transmission and distribution congestion rather than exacerbating it, and it often leads to deferred or avoided
infrastructure build-out and upgrades [6] [7]. Beyond using less total energy, an energy-efficient building
benefits the grid by maintaining low energy use even during typical periods of high demand.
Buildings are an ideal source of cost-effective demand flexibility for the grid as they are the nation’s primary
users of electricity: 74% of all U.S. electricity [8] is consumed within buildings, and building energy use drives
a comparable share of peak power demand. The electricity demand from buildings results from a variety of
electrical loads that are primarily operated to serve the needs of occupants. However, many of these loads are
flexible to some degree and can be managed to draw electricity at specific times and at different levels, while
still meeting productivity and comfort requirements for occupants. With proper communications and controls,
buildings can manipulate energy assets within their domain— traditional demand assets like lighting and
HVAC, along with on-site DERs like rooftop PV, EV charging, and battery storage. This provides benefit to
the grid while providing value to owners.
Grid needs can vary by location, time of day, day of week, and season. Accordingly, a building may need to
manage its electricity load in different ways during these times by reducing load through year-round energy
efficiency, shifting load to different times of the day, or even increasing load to store for later use. In total,
there are five modes with which buildings can provide demand flexibility: efficiency, shedding load, shifting
load, modulating load, and generating electricity. These are defined below.
1. Efficiency: the ongoing reduction in energy use while providing the same or improved level of
building function. 1
1
Note: This would have the greatest impact for the gird during high-cost periods and minimize utilization of costly generation resources.
II Building Demand Flexibility and Associated Grid Services 12GRID-INTERACTIVE EFFICIENT BUILDINGS: OVERVIEW
At a given level of energy efficiency and a given baseline load, a building can provide additional value by
changing its load in various ways in response to grid signals. These are commonly referred to as shed, shift,
and modulate.
2. Load Shed: the ability to reduce electricity use for a short time period and typically on short notice.
Shedding is typically dispatched during peak demand periods and during emergencies.
3. Load Shift: the ability to change the timing of electricity use to minimize demand during peak
periods or to take advantage of the cheapest electricity prices. A shift may lead to using more
electricity during the cheapest time period and using thermal or battery storage at another time period
when electricity prices increase.
4. Modulate: the ability to balance power supply/demand or reactive power draw/supply autonomously
(within seconds to sub-seconds) in response to a signal from the grid operator during the dispatch
period.
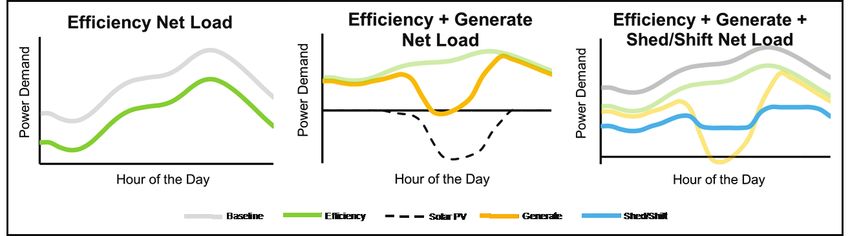
Figure II.1 shows the changes in building load profiles as a result of each these four flexibility modes.
Figure II.1. Building Flexibility Load Curves
In these graphs, the gray curve represents an example baseline building load and the colored curves (green, blue, purple
and orange) show the resulting building load.
The ability to reduce overall load and shed, shift, and modulate load comes from various electrical loads and
other energy assets that are inherently flexible, including batteries. Buildings may also have onsite distributed
generation such as rooftop PV; in this case a building can also:
5. Generate: the ability to generate electricity for onsite consumption and even dispatch electricity to the
grid in response to a signal from the grid. Batteries can increase the ability of distributed generation to
be dispatched as needed.
13 II Building Demand Flexibility and Associated Grid ServicesFigure II.2 depicts the daily average load profiles for a building employing various forms of energy efficiency
and demand flexibility. While energy efficiency and distributed generation (in this case, rooftop PV) achieve
reductions in overall energy use, the building load peaks coincident with utility peaks. With the addition of
demand flexibility (load shedding/shifting) to efficiency and distributed generation strategies, the resulting
flattened and reduced building load profile provides the greatest support to the grid.
Figure II.2. Grid-interactive Efficient Building Load Curves
These five demand flexibility modes can provide benefits to the grid, though demand flexibility provided by
most commercial and residential buildings must be aggregated across a number of buildings to be a meaningful
resource. In some situations, the building owner/operator may not even be aware how the building’s flexibility
is being aggregated or for which market product. The most important inputs needed for building
owners/operators to make building level energy management decisions include: how the end use operations
need to change and the duration and amount of change needed, along with the compensation for that change.
Table II.1 provides examples of potential measures and grid services associated with each flexibility mode.
Table II.1 Demand Flexibility Modes in Buildings to Grid Services
Flexibility Load Change Example Requirements for Grid
Example Measure
Mode Characteristics Services
Building technologies are Building has insulated, The building must sustain reduced energy
installed that provide tight envelope and use, as verified by metered energy use
persistent reduction in the efficient HVAC system to data.
Efficiency annual energy use to provide reduce heating/cooling
the same or improved energy needs.
function. 2
Building dims lighting
Building reduces demand for system by a preset To provide contingency reserves, the
Shed a short time period during amount in response to building must reduce a load within minutes
Load peak demand or emergency grid signals while of receiving a signal and may need to
events. maintaining occupant sustain load reduction for up to 1 hour.
visual comfort levels.
Building changes the timing
(and sometimes the amount) Connected water heaters
To reduce peak capacity, the building must
Shift of energy use to minimize pre-heat water during off-
reduce load within minutes of receiving a
Load peak demand or to take peak periods in response
signal and sustain for 2-4 hours.
advantage of renewable to grid signals.
resources.
2
Note: This would have the greatest impact for the gird during high-cost periods and minimize utilization of costly generation resources.
II Building Demand Flexibility and Associated Grid Services 14GRID-INTERACTIVE EFFICIENT BUILDINGS: OVERVIEW
Building automatically Batteries and inverters
autonomously modulate To provide frequency regulation, the
increases /decreases power
Modulate power draw to help building must modulate power within
demand or reactive power
Load draw/supply in response to maintain grid frequency or seconds/ sub-seconds and receive
automatic control signals.
grid operator signals. control system voltage. 3
To reduce peak, the building must reduce
Building generates electricity Rooftop solar PV
load through generation and/or dispatch
Generate to use onsite or to dispatch to dispatches electricity to
excess electricity with minutes of receiving
the grid. the grid.
a signal and sustain for 2-4 hours.
Below are additional examples of building technologies and strategies that provide energy flexibility. Further
details of flexible building assets, along with R&D opportunities, will be provided in the individual GEB
Technical Reports discussing component building technologies.
• Thermal mass. The thermally massive parts of a building’s physical structure—parts made of steel,
concrete and masonry—have thermal inertia and allow a building to deploy pre-cooling or pre-heating
strategies to shift HVAC energy loads to off-peak periods while maintaining comfortable temperature
ranges for occupants. New materials such as phase change materials (PCMs) significantly increase
thermal mass and load shifting capacity.
• Thermal storage. Heat can also be stored in water. Ice or chilled water tanks can be actively controlled
to shift HVAC loads. Electric water heaters—resistance or heat-pump--can also shift load [9] or
modulate electricity use [10].
• Thermostat setpoints. Occupants have preferred thermal comfort ranges but may be willing to expand
those ranges for short periods or under certain conditions. There are different strategies to curtail load
within acceptable setpoints ranges including adjusting HVAC equipment speed, turning the equipment
off for a short period, or reducing equipment run time if optimizing across a set of equipment.
• Refrigeration setpoints. Refrigerated goods also have ideal thermal ranges that can be expanded for
short periods or under certain conditions to shed or shift load.
• Multi-speed and variable-speed motors. Multi-speed motors in fans, compressors, and pumps allow
HVAC, refrigeration, and other equipment to shed load more flexibly by adjusting motor speeds with
minimal impact on occupants and goods; (continuous) variable speed motors can also modulate load
[11].
• Lighting. Lighting can be dimmed to shed load. Connected lighting technologies can also be used to
modulate load, though in limited capacities to avoid impacting occupant comfort.
• Smart appliances. Smart appliances including dishwashers, clothes washers, and clothes dryers can be
scheduled to shift load [12].
• Electronics and other plug loads. PCs, laptops, and other electronics—themselves solid-state devices—
can run at various frequency and voltage settings to shed and modulate load.
• Battery Storage. Batteries can shift and modulate loads by dispatching stored electricity and/or utilizing
stored electricity to power building loads.
3
Note: Few other building equipment technologies can provide frequency regulation and voltage support.
15 II Building Demand Flexibility and Associated Grid ServicesII.2 Grid Services
Grid services refer to the services that support the delivery of electricity from the utility to the consumer and
provide value through avoided electricity system costs. Buildings can provide grid services through changes
in generation and/or load. Note, grid services that buildings cannot feasibly provide (e.g., transmission
reactive power) or are still emerging (e.g., synthetic inertia) are not discussed here.
Grid services that demand-side resources can participate in today vary based on how markets are operated in
retail and wholesale markets. Demand flexibility itself is not a grid service today, but it is reflected in markets
such as energy efficiency, demand response, and distributed generation/storage. It is also important to note that
grid services are not directly realized through markets alone. Figure II.3 shows two demand response
categories that lead to a short-term energy reduction: dispatchable (i.e., a direct approach that usually involves
a contract or transaction to procure a change in energy consumption), and non-dispatchable (i.e., an indirect
way to change energy consumption through pricing).
Figure II.3. Demand Response Classifications
Adapted from the Smart Electric Power Alliance (SEPA) [13] [14].
Building owners or occupants that can reduce their energy use or shed, shift, or modulate loads through
dispatchable or non-dispatchable programs can be compensated through lower utility bills, lower rates, or pre-
negotiated payments while the grid also sees an immediate benefit. Demand flexibility has the potential to
provide grid services that benefit the grid across the three major dispatchable categories: ancillary services,
energy, and capacity. In addition, some of these grid services provide indirect benefits to the grid by avoiding
or deferring T&D upgrades and associated capital expenditures which can increase utility customer rates.
Table II.2 summarizes a number of demand flexibility benefits that building owners/occupants, the grid, and
society can realize.
II Building Demand Flexibility and Associated Grid Services 16GRID-INTERACTIVE EFFICIENT BUILDINGS: OVERVIEW
Table II.2. Demand Flexibility Benefits
Adapted from the Benefit-Cost Analysis for Utility-Facing Grid Modernization Investments Report, forthcoming [15].
Building
Benefit Utility System Externalities
Owners/Occupants
Reduced operation &
maintenance costs
- -
Reduced generation capacity
costs
- -
Reduced energy costs - -
Reduced T&D costs - -
Reduced T&D losses - -
Reduced ancillary services
costs
- -
Increased resilience
Increased DER integration -
Improved power quality - -
Reduced owner/occupant
- -
utility bills
Increased owner/occupant
satisfaction
- -
Increased owner/occupant
flexibility and choice
- -
Environmental benefits - -
Table II.3. summarizes generation, ancillary, and delivery services provided by buildings and the potential
market size based on today’s markets and building technologies. Table II.4. then provides additional detail on
how buildings provide these services. In the future, if more renewables are added to the grid, market sizes
and services offered could significantly change (e.g., frequency regulation and ramping services may have a
higher demand and new products may emerge that support renewable curtailment). The market sizes in
Table II.3. are based on two factors: the typical wholesale generation market size (see Appendix Table V.1)
and the potential for buildings to provide the service relative to other supply side resources.4
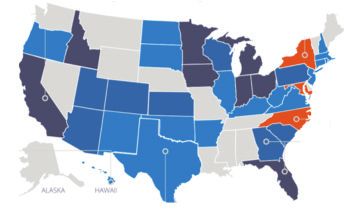
4Note: The data used to generate these potential market sizes were derived from available data from RTO/ISOs. Today, ISO/RTO electricity markets serve
two thirds of electricity consumers in the United States [20]. The map given in [62] illustrates the footprint of each ISO/RTO region. ISO/RTO electricity
markets are being used as proxy for overall market size.
17 II Building Demand Flexibility and Associated Grid ServicesTable II.3. Potential Grid Services Provided by Demand Flexibility in Buildings
Grid Potential Avoided Potential Market Size 5
Services Cost Addressable by Demand Flexibility in Buildings
Generation Services
Large. The market potential for reducing generation operations is large as it is
Power plant fuel,
a service in every RTO/ISO. Reducing generation operations involves optimizing
operation,
Generation: operation conditions and utilizing lowest cost generation. For buildings, energy
maintenance, and
Energy efficiency has the greatest potential to reduce generation operations. Demand
startup and shutdown
response also has moderate potential though the market size is limited by
costs
peak/off-peak price spread and hourly.
Large. Deferred generation capacity investment results primarily from peak
demand reduction and is a service procured in every RTO/ISO. The size of the
market varies by region based on the marginal generation costs and system
Capital costs for new
load profiles. Buildings can play a large role in reducing the peak demand since
generating facilities
they are responsible for approximately 80% of peak electricity demand in some
Generation: and associated fixed
regions. Buildings can contribute to this service by both lowering the overall
Capacity operation and
need for generation through energy efficiency and therefore reducing peak
maintenance costs
demand overall, as well as providing short-term load reduction to address
system peaks. Demand response has greater potential for deferring generation
capacity than energy efficiency.
Ancillary Services
Power plant fuel, Moderate. The market for contingency reserves is significantly smaller than
Contingency operation, those for generation capacity or generation operations, making up less than 3%
maintenance, and of U.S. peak demand [16], [17]. Despite the small market, buildings are well
Reserves 6
associated opportunity positioned to provide contingency reserve products by reducing demand for
costs short periods of time.
Power plant fuel, Small. Each ISO/RTO requires less than 1,000 MW of frequency regulation,
operation, which is less than 1% of total U.S. generation capacity [17], [18]. In addition to
maintenance, and the market being small, demand-side resources must compete against cost-
Frequency effective distributed supply-side resources that provide frequency regulation. In
opportunity costs 7
Regulation some RTO/ISOs generators are required to provide frequency regulation, but
associated with rules are changing to allow distributed resources to participate. Multiple
providing frequency technologies including variable frequency drive and water heaters, and battery
regulation and solar inverters can provide frequency regulation.
Small. Ramping services are an emerging market that is currently not offered in
Power plant fuel, most RTO/ISOs. Ramping services include resources that offset rapid changes
operation, in generation output. It is expected to grow as more variable renewable
Ramping maintenance, and generation is added to the grid. Buildings can provide quick response ramping
startup and shutdown services from technologies such as batteries that can dispatch/store electricity
costs and HVAC that can be cycled to offset shortfalls in generation.
Delivery Services
Moderate. Opportunities to defer or avoid the need for investments in
Capital costs for transmission & distribution infrastructure are highly location-dependent.
Non-Wires transmission & Further, the resource must be located electrically downstream from the
Solutions 8 distribution equipment transmission or distribution equipment to provide this service. Buildings can
upgrades provide non-wires solutions in a variety of ways including: energy efficiency,
demand response, distributed generation, voltage support, and energy storage.
Capital costs for Small. Payments available for voltage support, or reactive power compensation,
voltage control from demand-side resources vary significantly depending on the utility context
Voltage equipment (e.g., and the size of utility customer. Multiple building technologies can provide
Support capacitor banks, limited voltage support including rooftop solar inverters and battery inverters,
transformers, smart though they must compete against cost-effective supply side resources
inverters) including transformers, fixed capacitor banks, and line regulators.
5 See Table 6 in appendix for citations and basis for sizing potential markets.
6 Note: This includes reserves products with various timescales, including spinning reserves, non-spinning reserves, and other particular reserves products
that exist in some regions.
7
E.g., not selling power in order to be ready for up-regulation
8
Note: Also referred to as deferred transmission and distribution upgrades or non-wires alternatives (NWA)
II Building Demand Flexibility and Associated Grid Services 18GRID-INTERACTIVE EFFICIENT BUILDINGS: OVERVIEW
Table II.4 below shows how the five flexibility modes discussed in the previous section map to the grid services
in Table II.3. In order for building technologies, equipment, and DERs to provide grid services, they must meet
the duration and response times, load change, event frequency, and other requirements outlined in Table II.4.
Table II.4. Mapping Flexibility Modes to Grid Services
Note: ‘Response time’ is defined as the amount of time between receiving a signal from the utility/operator and the
building asset responding to change the load. ‘Duration’ is the length of time that the load change occurs. A ‘negative load’
in a building occurs when electricity is fed from a building to the electric grid
Flexibility Key Characteristics
Grid Services Description of Building Change
Mode
Generation: Energy Duration Continuous
Persistent reduction in load. Interval data Load Change Long term decrease
Efficiency Generation: Capacity may be needed for M&V purposes. This is
Response Time N/A
T&D: Non-Wires Solutions not a dispatchable service.
Event Frequency Lifetime of equipment
Duration Up to 1 hr
Load reduction for a short time to make up Load Change Short term decrease
Contingency Reserves
for a shortfall in generation. Response TimeIII Grid-interactive Efficient Buildings
III.1 Characteristics of a Grid-interactive Efficient Building
A Grid-interactive Efficient Building (GEB) is an energy efficient building with smart technologies
characterized by the active use of DERs to optimize energy use for grid services, occupant needs and
preferences, and cost reductions in a continuous and integrated way. The key characteristics and strategies
of grid-interactive efficient buildings are discussed in this section.
Today, behind-the-meter DERs— including energy efficiency, demand response, distributed generation, EVs, and
storage— are typically valued, scheduled, implemented, and managed separately. The GEB vision is the integration
and continuous optimization of these resources for the benefit of the buildings’ owners, occupants, and the grid.
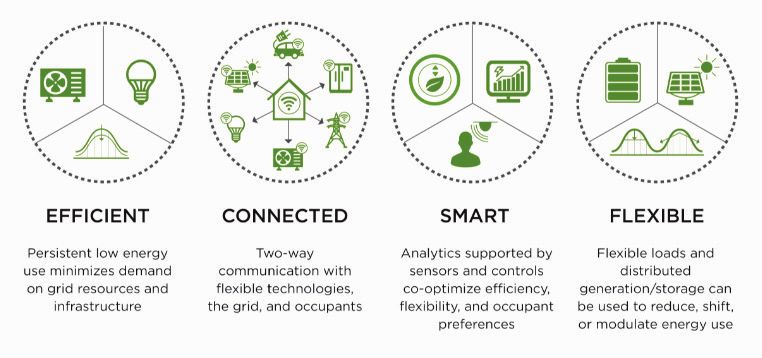
Grid-interactive efficient buildings are characterized by several features as outlined in Figure III.1. They are
energy-efficient— high-quality walls and windows, high-performance appliances and equipment, and
optimized building designs are used to reduce both net energy consumption and peak demand. Second, they
are connected— the ability to send and receive signals is required to respond to grid needs that are time
dependent. They are also smart— analytics supported ubiquitous sensing and optimized controls are necessary
to manage multiple behind-the-meter DERs in ways that are beneficial to the grid, building owners, and
occupants. And finally, they are flexible— the building energy loads can be dynamically shaped and optimized
across behind the meter generation, EV, and energy storage.
Figure III.1 Characteristics of Grid-interactive Efficient Buildings
These key characteristics are enabled by capabilities at both the individual equipment-level and centralized
system-level. First, individual devices, appliances, and equipment within the building must monitor and
communicate their operating conditions and respond to control commands to provide demand flexibility.
Second, the building must have the ability to manage these actions across loads in a coordinated way and have
the following attributes:
• Equipment and control systems support two-way connectivity and communications with devices,
equipment, and appliances within the building, as well as the grid.
III Grid-interactive Efficient Buildings 20GRID-INTERACTIVE EFFICIENT BUILDINGS: OVERVIEW
• Equipment is designed to monitor, report, and provide flexibility to shed, shift, or modulate load by
responding to control commands.
• Control system can monitor, incorporate, predict, and learn from building-level conditions (occupant
needs and preferences) and outdoor conditions (weather and grid needs).
• Control system can coordinate and execute complex control strategies that adapt based on changing
conditions over multiple time scales.
• Control system can quantitatively estimate and verify the energy and demand savings of different
strategies and impacts from stochastic building conditions (e.g., occupancy behavior).
• Control system optimization techniques can choose among multiple strategies and balance efficiency
with flexibility and occupancy comfort.
• The system is interoperable, having the ability to effectively and securely exchange data and control
signals among connected devices/equipment/appliances and control systems
• The system is cybersecure, having the ability to perform the services described above while maintaining
end-to-end data security and protection against unauthorized access
Continual adjustment to interior and exterior needs and optimization of operations must occur at both the
equipment and system levels. Optimization strategies and the associated technical requirements, discussed
briefly in the following section, will be covered in depth in the Sensors and Controls, Data Analytics and
Modeling GEB technical report.
III.2 Strategies for Optimization
Grid-interactive efficient buildings optimize loads through a coordinated approach to achieve demand
flexibility. For example, an integrated lighting and thermal comfort system must balance the benefits of
daylighting with unwanted solar heat gain. A GEB will be able to gather data from grid/weather signals and
daylighting and occupancy sensors, process them through an intelligent energy management system responsive
to learned occupant preferences, and execute a control strategy that optimizes the benefit to occupants and the
grid. Building demand flexibility could be further optimized if other DER assets, such as solar PV or
thermal/electrochemical storage are available.
Table III.1 provides examples that illustrate the differences between traditional energy efficiency and demand
response alone versus integrated demand flexibility approaches utilized in GEB. Because GEB emphasizes
integration and optimization, demand flexibility strategies integrate the larger context of the building,
optimizing its operation in conjunction with and relative to occupant patterns and other building systems. The
forthcoming GEB technology reports will present additional examples of technologies (both on the market and
in development) and associated use cases in greater detail.
21 III Grid-interactive Efficient BuildingsTable III.1. Strategies for Demand Flexibility
Building
Energy Efficiency Demand Response Demand Flexibility in a GEB 11
System
• Building dynamically adjusts R-value of envelope
• Building has to efficiently modulate internal temperature.
insulated, tight
• Building has significant amount of thermal mass,
envelope, and
potentially using phase change materials (PCMs),
efficient HVAC • Building changes
to support pre-cooling/coasting for long periods.
system to provide temperature setpoint
Thermal • Building is aware of occupancy and occupant
occupant thermal in response to grid
Comfort preferences and can raise cooling setpoints by
comfort with low signal.
varying amounts depending on electricity prices
Systems energy use. • Building can cycle
and grid signals.
• Building has HVAC systems in
• Building integrates owner and occupant priorities
moderate amount response to external
for thermal comfort and other services and sheds
of thermal mass to grid signals.
load in priority order.
reduce
heating/cooling • Buildings can adjust solar heat gain to reduce
needs. heating/cooling needs through dynamic windows
with automatic shading
• Building leverages
• Building incorporates occupants lighting
daylighting.
preferences and can dim lighting by varying
• Building uses SSL • Building dims lighting amounts in response to changing prices.
Lighting along with by a preset amount in • Building can prioritize lighting vis-à-vis thermal
daylighting and response to grid comfort and other building services.
occupancy sensors signals. • Building can modulate lighting levels and power
to dynamically
features to provide frequency regulation with
adjust lighting
integrated batteries.
levels.
• Building has high-
• Where appropriate and economic, appliances are
efficiency
co-optimized to efficiently switch between fuel
• Building has high- programmable
Appliances types.
efficiency connected appliances
appliances. that can be scheduled • Building prioritizes appliances vis-à-vis one
in response to grid another and other building services such as
signals. lighting and thermal comfort.
• Building has high efficiency and connected/
• Building has controlled water heaters used to shift loads in
connected water response to external grid signals or to store excess
Water • Building has high
heaters that shift energy from on-site generation.
efficiency heat
Heating loads by pre-heating • Building has connected and controlled pumped-
pump or electric
water during off-peak heat electrical storage using a heat pump to store
water heaters.
periods in response to thermal energy (in response to external grid
grid signals. signals) that can be recovered as electricity
through reversing the heat pump cycle.
11
Note: GEB is meant to be additive of EE and DR columns- GEB is the sum of efficiency, demand response, and the additional capabilities listed in the
GEB column.
III Grid-interactive Efficient Buildings 22GRID-INTERACTIVE EFFICIENT BUILDINGS: OVERVIEW
It is important to note that while Table III.1 only focuses on a single
building, there are also opportunities for optimization across a set of
buildings. Building owners, designers, and managers should consider
the increased resiliency, sustainability, and energy savings gained
through demand flexibility in microgrids, campuses, districts, and
neighborhoods.
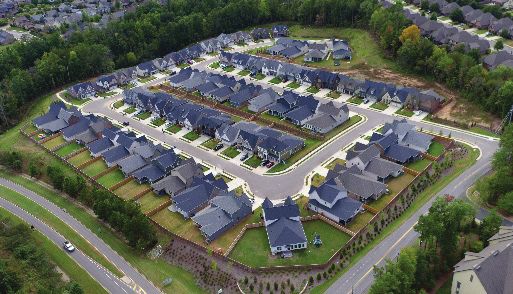
An example of optimizing across buildings is Alabama Power’s
Smart Neighborhood. The homes built in this community include
important GEB characteristics. They are all high-performance
homes, approximately 50-60% more efficient than a standard new
home and are connected as a neighborhood-level microgrid, which Smart Neighborhood
includes PV, a battery storage system, and natural gas-fired power
generation. Further, the Smart Neighborhood homes employ state-of- This Smart Neighborhood in
the-art HVAC and water heating systems, including variable capacity Birmingham, Alabama integrates
heat pump HVAC, hybrid electric/heat pump water heaters, and high-performance homes, energy
Internet-connected controls for both. This allows for the ability to efficient systems and
optimize across building loads. Novel control strategies are being appliances, connected devices,
tested to achieve grid-interactive control of the loads while
and a microgrid on a community-
homeowner comfort requirements are maintained. This is the first
wide scale for the first time in
microgrid in the Southeast to support an entire residential
community, while also helping to support community-scale power the Southeast.
resilience.
With 62 homes, it supports the
Alternatively, in a district thermal system example servicing offices, community’s energy needs by
retail buildings, and multi-family housing, one set of buildings may using microgrid technology with
be operating in heating mode, while another set of neighboring PV panels, battery storage, and a
buildings may be operating in cooling mode, creating an opportunity backup natural gas generator.
to share waste heat among buildings. Figure III.2 illustrates a similar These features help maximize
example of energy sharing in a district in Georgia. the efficiency of the grid, while
providing cost savings. The
microgrid can operate both
independently or together with
the wider grid and can also
control individual end-use
equipment such as appliances
and HVAC equipment in the
home. This adds to community
resilience.
Figure III.2. Energy Sharing in a High-Efficiency District Alabama Power partnered with
Example plots of estimated heating and cooling loads of live-work-play
district in Atlanta, GA for example days in fall/spring and summer. Shaded homebuilder Signature Homes,
(green) area represents overlapping load that indicates potential for energy researchers at Southern
sharing through a district thermal system. Sample analysis and graphs
Company, U.S. Department of
provided by the NREL URBANopt team.
Energy’s Oak Ridge National
Laboratory, the Electric Power
Research Institute, and others
on this project.
23 III Grid-interactive Efficient BuildingsIII.3 Knowledge Gaps and Future Research Opportunities
Little research has been done on technologies and strategies that optimize the interplay of energy efficiency
and demand response, much less fully explore an optimized approach to demand flexibility. Experimental
studies thus far have focused on commercial HVAC systems, even though residential buildings are the largest
contributors to peak demand. Some of these studies suggest that demand response may conflict with energy
efficiency by increasing overall energy use [19]. In addition, energy efficiency has also been shown to limit the
overall peak reduction potential of a building, known as ‘shed erosion’ [19]. As integrated energy efficiency
and demand flexibility is a nascent and rapidly developing area of research, no consensus has been reached on
the co-impacts. There are no known tools that perform such quantification or analysis for a large-scale study of
buildings and grid interactions. Many researchers also note a lack of available data to study the combined
effects of energy efficiency and demand flexibility.
There are opportunities for improving building load management strategies, but additional work is needed to
better understand the interactions and capacity of energy efficiency and demand flexibility to provide grid
services. Major research needs include:
• Characterizing the type and amount of demand flexibility in different types of energy assets (traditional
loads, on-site generation, and storage) and matching assets and grid services
• Determining which technologies (both emerging and on the market) have the greatest potential to
provide demand flexibility of different modes
• Quantifying the impacts of different modes of demand flexibility on energy efficiency
• Quantifying the impacts of different modes of demand flexibility on one another
• Quantifying the impact of different modes of demand flexibility on occupant preferences as well as the
value of those impacts
• Determining modes and mechanisms for engaging occupants in valuing and activating demand
• Identifying the trade-offs between functionality and security
• Determining how to incorporate and update state-of-the-art security features into the design process of
control architectures
• Determining the impacts of demand flexibility on equipment lifetime
• Quantify how different modes of demand flexibility impact building envelope durability (e.g., missing
latent cooling with "shut down" sensible cooling)
• Determining the right implementation level (device, end-use, zone or building) for different modes of
demand flexibility and different grid services
• Determining the role of demand flexibility in different energy market contexts
• Quantifying the potential of demand flexibility in groups and districts of buildings
• Understanding regulatory constraints for aggregation to exercise inter-building demand flexibility and
energy exchange
• Identifying business models that allow for aggregation to exercise inter-building demand flexibility and
energy exchange
III Grid-interactive Efficient Buildings 24GRID-INTERACTIVE EFFICIENT BUILDINGS: OVERVIEW BTO intends to conduct further research to address these technical challenges and knowledge gaps. The GEB Technical Reports series will serve as the next step in the process. These reports will identify major challenges and gaps facing the technologies and opportunities for additional technology-specific research and development. This will help inform and guide BTO’s R&D portfolio and serve as a foundational resource for the larger building research community. For more information, visit: energy.gov/eere/buildings/geb 25 III Grid-interactive Efficient Buildings
IV      References
[1]    N. A. of R. U. C. (NARUC), “Distributed Energy Resources Rate Design and Compensation,” 2016.

[2]    F. N., S. Katipamula, W. Wang, Y. Xie, M. Zhao, and C. D. Corbin, “Impacts of Commercial Building
       Controls on Energy Savings and Peak Load Reduction,” Pacific Northwest Natl. Lab., vol. 25985, 2017.

[3]    S. Kiliccote, D. Olsen, M. D. Sohn, and M. A. Piette, “Characterization of Demand Response in
       Commercial, Industrial, and Residential Sectors in the U.S.,” WIREs Energy Environ., vol. 5, pp. 288–304,
       2016.

[4]    M. A. Piette, D. S. Watson, N. Motegi, and S. Kiliccote, “Automated Critical Peak Pricing Field Tests: 2006
       Pilot Program Description and Results,” Lawrence Berkeley Natl. Lab., vol. LBNL-59351, 2007.

[5]    U.S. Energy Information Administration, “Peak-to-average electricity demand ratio rising in New England
       and many other U.S. regions,” 2014.

[6]    M. Molina, “The Best Value for America’s Energy Dollar: A National Review of the Cost of Utility Energy
       Efficiency Programs,” Am. Counc. an Energy-Efficient Econ., 2014.

[7]    I. M. Hoffman, C. A. Goldman, S. Murphy, N. M. Frick, G. Leventis, and L. C. Schwartz, “The Cost of
       Saving Electricity Through Energy Efficiency Porgrams Funded by Utility Customers: 2009-2015,”
       Lawrence Berkeley Natl. Lab., 2018.

[8]    U.S. Energy Information Administration, “Annual Energy Outlook 2018,” 2018.

[9]    L. Schwartz et al., “Electricity end uses , energy efficiency , and distributed energy resources baseline :
       Commercial Sector Chapter,” no. January, p. 77, 2017 [Online]. Available:
       https://www.energy.gov/sites/prod/files/2017/01/f34/Electricity End Uses, Energy Efficiency, and
       Distributed Energy Resources.pdf

[10]   R. Edge, N. Esch, and E. H. Myers, “Beyond the Meter: Distributed Energy Resource Capabilities Guide,”
       SEPA, 2016.

[11]   W. Goetzler, T. Sutherland, and C. Reis, “Energy Savings Potential and Opportunities for High - Efficiency
       Electric Motors in Residential and Commercial Equipment,” no. December, p. 103, 2013 [Online].
       Available: http://energy.gov/sites/prod/files/2014/02/f8/Motor Energy Savings Potential Report 2013-12-
       4.pdf

[12]   K. S. Cetin, “Characterizing large residential appliance peak load reduction potential utilizing a probabilistic
       approach,” Sci. Technol. Built Environ., vol. 22, no. 6, pp. 720–732, 2016 [Online]. Available:
       http://www.ccee.iastate.edu/kcetin/files/2016/01/Characterizing-large-residential-appliance-peak-load-
       reduction-potential-utilizing-a-probabilistic-approach.pdf

[13]   R. Walawalkar, R. Tongia, and B. Colburn, “Web Enabled Metering and Controls for Demand Response,”
       in Web Based Enterprise Energy and Building Automation Systems, Fairmont Press Inc., 2007.

[14]   Smart Electric Power Alliance, “2017 Utility Demand Response Market Snapshot,” 2017.

[15]   T. Woolf, B. Havumaki, D. Bhandari, M. Whited, and L. Schwartz, “Benefit-Cost Analysis for Utility-
       Facing Grid Modernization Investments,” Lawrence Berkeley Natl. Lab., 2019.

[16]   E. Ela, M. Milligan, and B. Kirby, “Operating Reserves and Variable Generation,” no. August, 2011.

[17]   P. Denholm, J. Eichman, T. Markel, and O. Ma, “Summary of Market Opportunities for Electric Vehicles
       and Dispatchable Load in Electrolyzers,” no. May 2015, 2015.

                                                                                                     IV References 26
You can also read