MAY 2019 INVESTOR PRESENTATION - NEXTERA ENERGY
←
→
Page content transcription
If your browser does not render page correctly, please read the page content below
May 2019 Investor Presentation
Cautionary Statements And Risk Factors That May Affect
Future Results
This presentation includes forward-looking statements within the meaning of the federal securities laws.
Actual results could differ materially from such forward-looking statements. The factors that could cause
actual results to differ are discussed in the Appendix herein and in NextEra Energy’s and NextEra Energy
Partners’ SEC filings.

Non-GAAP Financial Information
This presentation refers to certain financial measures that were not prepared in accordance with U.S.
generally accepted accounting principles. Reconciliations of historical non-GAAP financial measures to the
most directly comparable GAAP financial measures can be found in the Appendix herein.

2
NextEra Energy is comprised of strong businesses
supported by a common platform

                                                                   • ~$92 B market capitalization(1)
                                                                   • ~51 GW in operation(2)
                                                                   • ~$109 B in total assets(3)

                                  • The largest electric utility
                                    in the United States by
                                    retail MWh sales

                                  • Provides electric service                                • The world leader in
                                    to over 460,000 customers                                  electricity generated
                                    in northwest Florida                                       from the wind and sun

                                      Engineering & Construction
                                             Supply Chain
                                   Wind, Solar, and Fossil Generation
                                          Nuclear Generation
    1) As of April 29, 2019; Source: FactSet
    2) Megawatts shown includes assets operated by Energy Resources owned by NextEra Energy Partners as of
       March 31, 2019
    3) As of March 31, 2019
3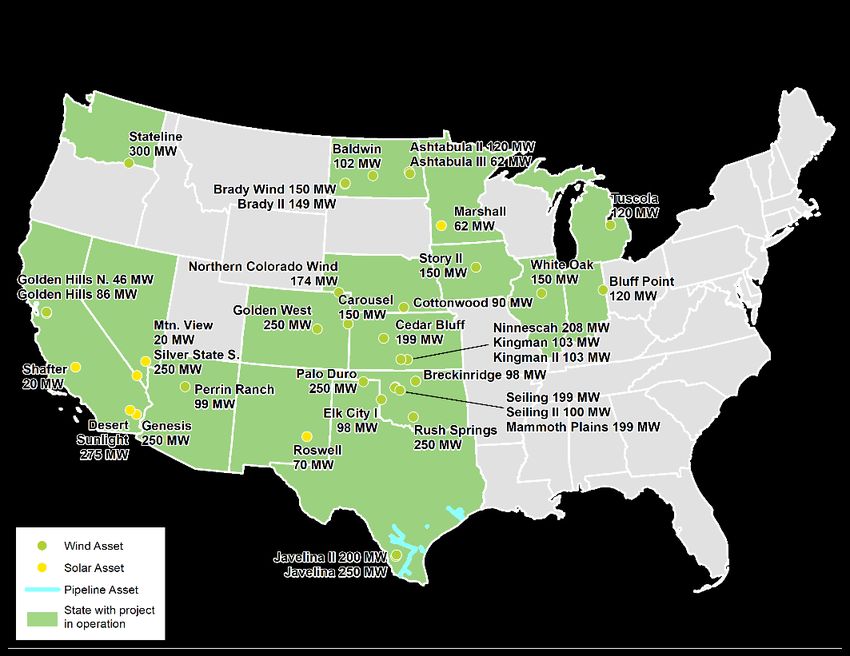
NextEra Energy delivered strong first quarter results

                                 First Quarter 2019 Highlights
    • NEE grew adjusted EPS by ~12%(1) year-over-year
    • FPL:
        – Regulatory capital employed growth of ~8% versus prior-year
          comparable quarter
        – ~1,750 MW Okeechobee Clean Energy Center completed on budget
          and ahead of schedule
        – Commissioned ~300 MW of solar under 2019 SoBRA
    • Gulf Power:
          – Integration continues to progress well
          – Base retail O&M costs already down nearly 5% year-over-year
    • Energy Resources:
          – Nearly 1,000 MW of renewables added to backlog
               Includes first co-located combined wind, solar and storage project

    1) See Appendix for reconciliation of GAAP amounts to adjusted amounts
4
Our long-term success is the result of a balanced approach to
     our business practices, our people, our communities and the
     environment
               Creating a Sustainable Energy Future for America
                                                                                               Investing in our Team
              Respecting the Environment                                                    & Sustaining Communities(2)
    2,500                   CO2 Emissions Rate(1)
    2,000
                                                                                          1.1 MM Hours of employee training
Lbs
                                                                   NextEra
                                                                                             61% Improved safety performance since 2008
Per 1,500
MWh                                                                Energy                ~$100 B Capital invested since 2001
    1,000
                                                                                        $600 MM Property taxes paid to support local communities
      500                                                                                  88,000 Employee volunteer hours
                        Top 50 Power Producers in U.S.
          0
               Outstanding Customer Value                                                   Commitment to Excellence
     $1,200                                                                     $12
                                        $1,009
     $1,000                                                                     $10
                                   $786                    $813
      $800                                                                      $8 Cum.
Annual                      $672 $666             $655                   $638
                                               $644     $635        $631           Fuel
 Fuel
Savings
        $600                                $486
                                                     $515     $528
                                                                  $541          $6Savings
($ MM)                                                                             ($ B)
      $400               $357                                                   $4
                     $243
      $200                                                                      $2
                  $88

          $-                                                                    $-
                 2002       2005        2008     2011      2014      2017
               1) MJ Bradley & Associates report released June 2018: “Benchmarking the Largest 100 Electric Power Producers in
                  the U.S.”
      5        2) As of year-end 2017
We have a long-term track record of delivering value to
          shareholders

         Adjusted Earnings Per Share(1)                                                                       Total Shareholder Return(2)
                                                                                                      $7.70
                                                                                              $6.70           20%                             90%        82%
                                                                                      $6.18                          14%                      80%
                                                                              $5.71
                                                                      $5.30                                                                   70%
                                                              $4.97
                                      $4.30 $4.39 $4.57                                                       10%                             60%
                        $3.84 $4.05                                                                                                           50%
                $3.49                                                                                                       4%                                 37%
        $3.04                                                                                                                                 40%
$2.63                                                                                                                                                                 30%
                                                                                                               0%                             30%
                                                                                                                                              20%
                                                                                                                                  -4%         10%
                                                                                                              -10%                             0%
                                                                                                                         One Year                         Three Year
'05     '06     '07     '08   '09     '10     '11     '12     '13     '14     '15     '16     '17     '18

                   Dividends Per Share
                                                                                                   $4.44
                                                                                                              160%                            420%       380%
                                                                                              $3.93                  134%
                                                                                      $3.48                   140%                            360%
                                                                              $3.08                           120%
                                                                      $2.90                                                                   300%
                                                              $2.64                                           100%                                                    243%
                                                      $2.40                                                                                   240%
                                              $2.20
                                      $2.00                                                                   80%           66%
            $1.64       $1.78 $1.89                                                                                                           180%
                                                                                                                                                               170%
$1.42 $1.50                                                                                                   60%                 50%
                                                                                                              40%                             120%
                                                                                                              20%                              60%
                                                                                                               0%                                   0%
                                                                                                                         Five Year                         Ten Year
'05     '06     '07     '08   '09     '10     '11     '12     '13     '14     '15     '16     '17     '18
                                                                                                                     ■      NEE
                 1) See Appendix for reconciliation of adjusted amounts to GAAP amounts                              ■      S&P 500 Utility Index

         6
                 2) Source: FactSet; includes dividend reinvestment as of 12/31/2018                                 ■      S&P 500
Over a sustained period of time, our growth strategy has led
to real change in relative position

    Top 20 Global Utility Equity Market Capitalization(1)
                   As of 6/1/2001 ($ MM)                      As of 4/29/2019 ($ MM)
         Rank            Market Cap                    Rank      Market Cap
           1              $38,574                        1         $91,845     NextEra Energy
           2              $38,185                        2         $65,183
           3              $34,476                        3         $63,038
           4              $34,111                        4         $60,890
           5              $30,955                        5         $57,765
           6              $23,906                        6         $54,815
           7              $21,537                        7         $54,394
           8              $20,093                        8         $48,327
           9              $17,297                        9         $42,335
          10              $16,873                       10         $41,468
          11              $16,279                       11         $37,075
          12              $15,884                       12         $36,755
          13              $15,785                       13         $35,418
          14              $14,601                       14         $34,489
          15              $14,461                       15         $31,740
          16              $14,223                       16         $29,644
          17              $13,773                       17         $28,957
          18              $13,550                       18         $28,538
          19              $13,136                       19         $27,620
          20              $12,934                       20         $26,162

          30              $10,206     NextEra Energy

    1) Source: Factset
7
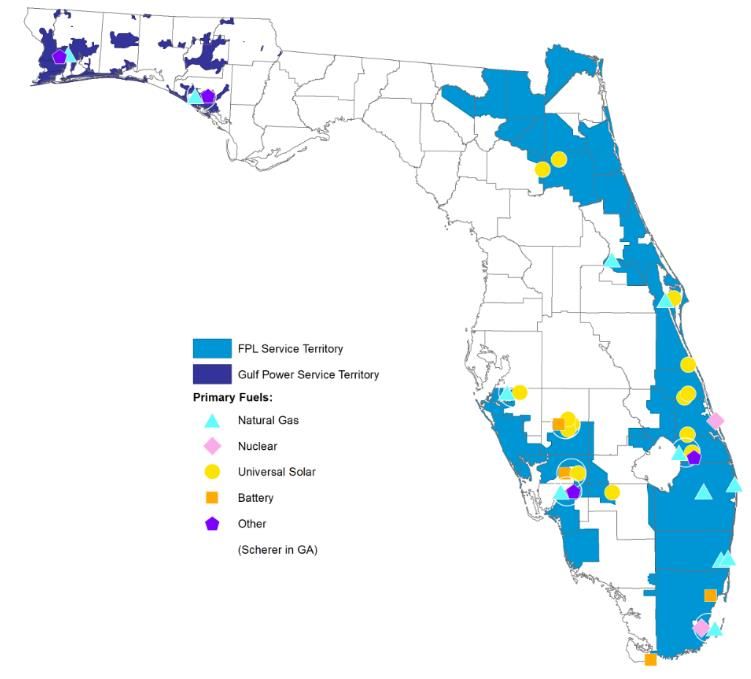
Florida Power & Light is one of the best utility franchises in
  the U.S. and we recently added Gulf Power to the portfolio

                                            Florida Regulated Utilities
• FPL
      – 5+ MM customer accounts
      – ~27 GW in operation
      – ~$12 B in operating revenues(1)
      – ~$54 B in total assets

• Gulf Power
      – ~0.5 MM customer accounts
      – ~2 GW in operation
      – ~$1.5 B in operating revenues(2)
      – ~$5 B in total assets

      1) As of December 31, 2018
      2) Source: Gulf Power December 2018 ESR
      Note: All other data is as of March 31, 2019; NEE completed the acquisition of Gulf Power on January 1, 2019
  8
We expect to execute the same long-term strategy at Gulf
Power that has been our core focus at FPL for many years
Virtuous Circle
• Unyielding commitment to
customer value proposition
Customer
– Low bills Satisfaction
– High reliability
– Excellent customer service
Superior
• Focus on efficiency and best-in- Customer Virtuous Constructive
Regulatory
class cost performance Value Circle Environment
– FPL’s O&M costs among the lowest Delivery
of all major regulated utilities
• Invest capital in ways that benefit Strong
Financial
customers Position
– FPL operates one of the most
modern, fuel-efficient and low-carbon
generation fleets in the nation
9Our focus is on providing customers low bills, high reliability
and outstanding customer service
Areas of Focus
1,000-kWh Residential Bill Service Reliability (“SAIDI”)(4)
$160
$140 ~$139
~$129 ~101 minutes
$120 ~$120 ~93 minutes
~$101
$100
$80 ~55 minutes
Good
$60
$40
$20
$-
FPL Gulf Power FL IOUs (2) National (3) FPL Gulf Power FL Avg
2019 (1) 2019(1) Average Average
Operational Cost Effectiveness(5) Regulatory Capital Employed(6)
$100.00 Adjusted Regressed FPL Gulf Power
Top Quartile
Gulf Power 2017 $B $B
Top Decile
= $30.38/MWh 40.0 4.0
35.0 $33.6 3.5
$3.0
30.0 3.0 $2.7
$/Retail 25.0 $22.7 2.5
MWh 20.0 2.0
15.0 1.5
10.0 1.0
FPL 2017 =
Log/Log $12.44/MWh 5.0 0.5
$10.00 0.0 0.0
1,000,000 10,000,000 100,000,000 1,000,000,000 2013 2018 2013 2018
1)
Based on a typical 1,000 kWh residential bill for April 2019
2)
FL IOUs Avg consists of data from FPL, TECO, Duke Energy Florida, FPUC and Gulf Power; as of April 2019
3)
Source: EEI; National Average as of January 2019 based on reporting utilities
4)
System Avg. Interruption Duration Index for 2018; FL Avg. data from FPL, TECO, DEF and Gulf for 2018
5)
FERC Form 1, 2017; excludes pensions and other employee benefits; FPL costs exclude expense related to Hurricane Irma
write-off; holding companies with >100,000 customers; excludes companies with no utility owned generation
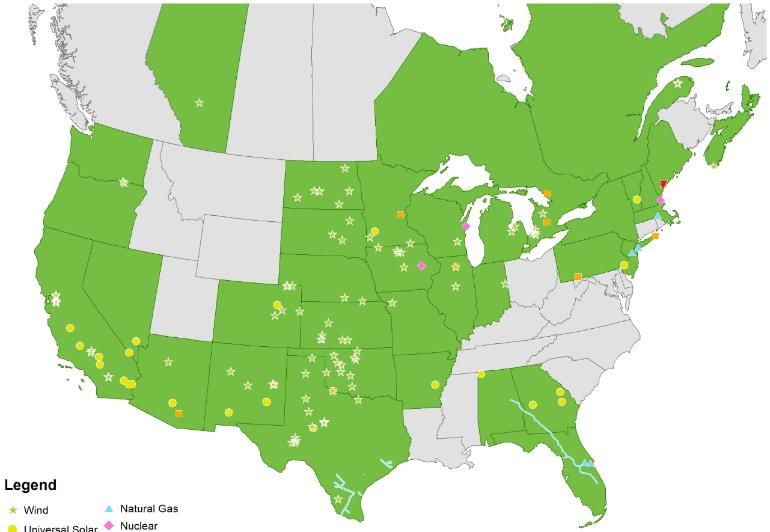
10 6) 13 month average; includes retail rate base, wholesale rate base, clause-related investments and AFUDC projectsEnergy Resources is the leading North American clean
energy company
Energy Resources
• World leader in electricity
generated from the wind and sun
• ~22 GW(1) of generation in
operation
– ~15 GW wind
– ~2 GW solar Wind Natural Gas
Solar Nuclear
– ~3 GW nuclear Storage Other
–
Pipeline
~2 GW natural gas/oil
• ~8 BCF of natural gas pipeline
Wind
capacity operating or under 67%
development(2)
• ~$4.9 B in operating revenues(3)
• ~$44.5 B in total assets Nuclear
Natural Gas Solar 12%
7% Oil 11%
3%
1) Generation mix is based on MW capacity owned by Energy Resources and NextEra Energy Partners’ assets
2) Includes 4 BCF Texas Pipelines operated by Energy Resources for NextEra Energy Partners
3) As of December 31, 2018
11 Note: All other data as of March 31, 2019With continued technology improvements and cost
declines, wind and solar are expected to be competitive into
the next decade
Wind and Solar Technology
Levelized Cost of Levelized Cost of
Electricity from Wind Electricity from Solar
(Including Production Tax Credits) (Including Investment Tax Credits)
$/MWh $/MWh
$70 $160
$140-$150
$55-$65 $140
$60
$120
$50
$100 $95-$105
$40 $36-$42
$80 $73-$83
$30
$21-$27 $60
$16-$22 $39-$47
$20 $12-$18 $40 $25-$35
$10 $20
$0 (1) (1) (1) (1)
$0
(2)
2010 2012 2014 2016 2020 2010(3) 2012(3) 2014 (3) 2016(3) 2020(2)
1) Source: U.S. Department of Energy, 2015 Wind Technologies Market Report – August 2016
2) Energy Resources’ estimate
3) Source: IHS Markit; the use of this content was authorized in advance; any further use or redistribution of this
content is strictly prohibited without written permission by IHS Markit; all rights reserved
12Battery efficiency improvements and cost declines are
expected to expand the storage market and enable even
greater renewables expansion
Storage Technology
Lithium-ion 4-Hour
Battery Pack Cost(1) Battery Storage Adder(2)
$/kWh $/MWh
$1,200 $80 $71-$81
$1,000 $70
$1,000
$60
$800 $45-$55
$50
$642 $38- $48
$600 $540 $40
$30
$400 $19-$29
$273 $20 $12-$22
$200 $172
$10
$0 $0
2010 2012 2014 2016 2020 2010 2012 2014 2016 2020
1) Source: Bloomberg New Energy Finance
2) Energy Resources’ Estimate; assumes: 4 hour battery storage at 40% of nameplate solar capacity; total battery
system costs calculated as two times Bloomberg New Energy Finance battery pack cost
13Energy Resources’ competitive advantages position us well for
continued renewables development success
Energy Resources – Key Competitive Advantages
2018 Top 10 U.S. Capital Investors(1) Wind O&M(2)
$/MWh
$20 ~$19 ~$19
~$17 ~25%
Reduction
$15
~$13 ~$12
$B ~$11 ~$10
$10 ~$9 ~$9 ~$9
$5
$0
A B C D NEE E F G H I 2014 2016 2018
NextEra (3) Average Site (3)(3)
Top Quartile Site Top Decile Site
Renewable Development
Credit Ratings Longer-Term Pipeline
NextEra Energy, Inc.
Wind: 450-600 MW
Solar:1,600-1,700 MW
Wind: 4,500-4,800 MW
Standard & Poor’s A- Solar: 600-700 MW
Moody’s Baa1 Wind: 2,800-2,900 MW
Wind: 300-450 MW
Solar: 600-700 MW
Solar: 3,400-3,500 MW
Fitch Ratings A-
Wind: 7,950-8,100MW Solar: 3,500-3,600 MW
Solar: 1,900-2,000 MW
1) NEE internal estimates based on publicly available information
2) Wind O&M costs are reported herein on a per-gross-generation basis and include all expenses related to the
operations and maintenance of each wind project owned and operated by NextEra Energy Resources. These
costs include planned and unplanned maintenance of the wind turbines as well as electrical balance of plant -
including labor, parts, materials and consumables and exclude all G&A costs
3) Top quartile and average O&M costs based on average of two independent studies. Top decile performance based on one
14 independent studyEnergy Resources continues to capitalize on the best
renewables development period in our history
Energy Resources Development Program(1)
(Signed contracts as of April 23, 2019)
2019 – 2020 2017 – 2020
2017 – 2018 2017 – 2020
Signed Current
In Service Total
Contracts Expectations
U.S. Wind 1,757 4,236 5,993 5,400 – 7,800
Canadian Wind 0 0 0 0 – 600
U.S. Solar(2) 525 1,591 2,116 1,400 – 3,800
Wind Repowering 2,491 1,302 3,793 3,300 – 4,300
Total 4,773 7,129 11,902 10,100 – 16,500
Energy Storage(2) 67 50 117
1) See Appendix for detail of Energy Resources’ development projects included in backlog; excludes development
project sales of 628 MW in 2017-2018, 600 MW in 2019-2020, and 110 MW for post-2020 delivery
15 2) Excludes 2,188 MW of solar and 465 MW of storage signed for post-2020 deliveryEnergy Resources backlog of future renewables projects
has never been stronger
Energy Resources Renewables Backlog(1)
(MW)
~9,800
~8,900
~5,000
~3,700
~2,900
~2,400 ~2,100
Q4 2013 Q4 2014 Q4 2015 Q4 2016 Q4 2017 Q4 2018 Q1 2019
Wind Solar Repowering Energy Storage
1) Energy Resources reported backlog as of April 23, 2019
16We are well positioned to capitalize on and respond to
potentially disruptive changes to our industry in the next
decade
Disruptive Industry Changes
Potential Cost per kWh Post-2023(1)
(¢/kWh)
Shale 3 - 4¢ w/ 4 - 5¢
Gas storage 3.5 - 5¢
2 - 3¢ w/ adder 3 - 4¢
storage
Renewables adder
Big Data
/Storage
Wind Solar Gas Coal Nuclear
Generation
Smart Cost
Restructuring
U.S. Electricity Production by Fuel Type(2)
Grid Restructuring 2017 2030E
Natural Natural Coal &
Generation Gas Coal & Gas Nuclear
Shareholder Nuclear
Activism Restructuring
Wind & Wind
Solar & Solar
Other
Other
1) Represents potential projected cost per kWh for new build wind, solar, and natural gas, excluding PTC and ITC;
projected per kWh operating cost including fuel for existing nuclear and coal; based on NextEra Energy internal
estimates
2) 2017 Source: U.S. EIA; 2030 estimate Source: IHS Inc; the use of this content was authorized in advance by
IHS; any further use or redistribution of this content is strictly prohibited without written permission by IHS; all
17 rights reservedWe have leveraged our skills and capabilities to expand into
the natural gas pipeline business
Natural Gas Pipeline Assets
Sabal Trail and Florida Mountain Texas
Southeast Connection (FSC) Valley Pipeline (MVP) Pipelines
• ~$1.5 B investment in Sabal • NextEra is a 31% owner of • NEP completed the $2.2 B
Trail MVP acquisition in October 2015
– JV with Enbridge – JV with EQT, Con Edison – Seven natural gas pipelines in
• ~$0.5 B investment in FSC Midstream, WGL Midstream, Texas
and RGC Midstream – ~3 Bcf/day of ship-or-pay
– Subsidiary of Energy Resources – ~300-mile natural gas pipeline contracts
• Florida pipelines achieved – ~2 Bcf/day of 20-year firm – Continue to focus on growth and
commercial operation in June capacity commitments expansion projects
2017 • Announced MVP Southgate
expansion project
We continue to look for new long-term contracted natural
gas pipeline opportunities
18NextEra Energy continued its focus on growing regulated
and long-term contracted businesses during 2018
NextEra Energy – Strong Credit Quality
• We remain committed to maintaining one of the strongest
balance sheets in the industry
• Rating agencies recognized continued improvement in
NextEra Energy’s credit quality
– S&P revised assessment of NEE’s business risk profile upward
from “strong” to “excellent” and reduced FFO-to-Debt downgrade
trigger from 23% to 21%
– Moody’s recognized expected expansion of regulated operations
to ~70% and reduced CFO pre-working capital-to-debt threshold
from 20% to 18%
– Fitch announced that it is widening its sustained FFO adjusted
leverage threshold from 3.5x – 3.75x to 4.0x – 4.25x
19We expect to grow adjusted EPS at a 6% - 8% CAGR through
2021, plus accretion from the Florida acquisitions in 2020 and
2021
NextEra Energy’s
Adjusted Earnings Per Share Expectations(1)
$9.40 -
• The Florida acquisitions are
$8.70 -
$9.95 expected to be $0.15 and $0.20
$8.00 -
$9.20 accretive in 2020 and 2021,
$8.50 respectively
$7.70
• Expected growth in DPS of
12% to 14% per year through
at least 2020, off a 2017 base
of $3.93 per share
• Expect operating cash flow to
grow roughly in line with our
adjusted EPS CAGR range
from 2018 through 2021
2018 2019E 2020E 2021E
Expected accretion from FL acquisitions(2)
1) See Appendix for definition of Adjusted Earnings expectations
2) Includes Gulf Power, Florida City Gas, and the Stanton and Oleander natural gas power plants
20NextEra Energy’s businesses deliver strong earnings,
dividend and cash flow growth and a low beta
NextEra Energy Investment Proposition
Track record of delivering value to shareholders
High visibility into earnings growth to support 11% - 12%
total return potential
Low payout ratio and above average dividend growth of
12% - 14% through at least 2020
Low beta provides attractive risk adjusted returns relative
to other sectors
Disciplined capital allocation strategy with ongoing ability
to recycle capital through sales to NEP or 3rd parties
Strong cash flow generation of underlying assets
One of the strongest balance sheets in the sector
2122
NextEra Energy Partners is a best-in-class diversified clean
  energy growth company

                          NextEra Energy Partners’ Portfolio(1)
• Stable cash flows supported by:
     – Long-term contracts with credit-
       worthy counterparties
     – Geographic and asset diversity
• ~5,330 MW of renewables
     – ~4,575 MW wind
     – ~750 MW solar
• ~4 Bcf total natural gas pipeline
  capacity
     – Seven natural gas pipelines
     – ~542 miles                                                                                                Wind assets
                                                                                                                 Solar assets
     – ~3 Bcf of contracted capacity                                                                             Pipeline assets

           Solid distribution per unit growth through accretive acquisitions

     1) Portfolio as of March 31, 2019; excludes non-economic ownership interest in equity method investments;
  23    includes announced acquisition of 611 MW that is expected to close in the second quarter of 2019
Since the IPO, NEP has grown distributions by ~160% and
delivered total unitholder return of 118%
Annualized Total Unitholder Return
LP Distributions(1) NEP vs. Indices
140%
$1.93 118%
120%
100%
80%
66%
60% 56%
40%
25%
$0.75 20%
0%
Q3 2014
Q4 2014
Q1 2015
Q2 2015
Q3 2015
Q4 2015
Q1 2016
Q3 2016
Q4 2016
Q1 2017
Q2 2017
Q3 2017
Q1 2018
Q2 2018
Q3 2018
Q4 2018
Q1 2019
Q2 2016
Q4 2017
NEP (2) S&P 500 S&P 500 YieldCo
Utilities Average(3)
Index
1) Annualized basis; refer to distributions payable on the NextEra Energy Partners Investor Relations website
2) Reflects total unitholder return, assuming dividend reinvestment, as of April 29, 2019 since the IPO dated June
26, 2014 based on the IPO price of $25
3) Reflects average total shareholder return, assuming dividend reinvestment, for TERP, AY, PEGI, CWEN.A as
of April 29, 2019 since the IPO date assuming IPO price
Note: All other data is total shareholder return, assuming dividend reinvestment, as of April 29, 2019 since June
26, 2014; Source: Bloomberg
24NEP’s value proposition is built upon four core strengths
NextEra Energy Partners’ Core Strengths
High-Quality Portfolio(1) Financial Strength and Flexibility
Issuer Credit
Diversified ~5.3 GW Rating(3) Year-end 2018
17-Yr Portfolio with Renewables >90% Ba1/BB/BB+
Capacity of Project Debt & ~1.2x
Remaining 48 Tax Equity supports 4x-5x Coverage
Contract Life(2)
counterparties ~4 Bcf Is Amortizing
Holdco debt / project Ratio(4)
Pipeline Capacity CAFD
Tax-Advantaged Structure(5) Opportunities For Growth
≥8 years Treated as C-Corp Clean energy
assets at
≥15 years Potential return of for U.S federal tax
Energy Organic
Not expected to
capital treatment purposes with
prospects for 3rd Party
pay significant
for distributions to
the extent of
Form 1099 Resources, Texas Pipelines acquisitions
U.S. federal taxes for investors including future and Repowerings
investor’s tax development
basis (vs K1)
1) Includes announced acquisition of 611 MW that is expected to close in the second quarter of 2019
2) Weighted on calendar year 2020 Cash Available for Distribution (CAFD) expectations for current portfolio plus 2019 announced
acquisitions; See Appendix for definition of CAFD
3) Moody’s, Standard & Poor’s, and Fitch ratings, respectively
4) Assumes calendar year 2019 expectations for portfolio as of 12/31/18, divided by the product of annualized
LP distributions of $1.86 and 157 MM outstanding units, plus distributions made to the Series A Preferred Units
25 5) As of December 31, 2018; should not be construed as tax adviceWe announced an agreement with KKR to invest $900 MM in
our second convertible equity portfolio financing
transaction
Convertible Equity Portfolio Financing 2.0(1)
2018 2019
Proceeds $750 MM from BlackRock $900 MM from KKR
Less than 1%
Annual “Coupon” ~2.5% for three years over a six year period(3)
Pre-Tax
Buyout IRR(2) 7.75% over three years ~8.3% over six years
Buyout Right Periodically, and for
Timing One time in year 4 partial interests between
years 3.5 and 6(4)
Buyout Right At least 70% in NEP units At least 70% in NEP units
Payment at no discount at no discount
Version 2.0 offers lower cash costs and the ability to issue equity without
a discount over a longer period of time, enhancing NEP’s flexibility
1) Refer to Appendix and SEC filings for additional detail of KKR financing
2) Inclusive of all prior distributions
3) Following the initial six-year period, if NEP has not exercised its entire buyout right, or following year 4.5 if certain
minimum buyouts have not occurred, KKR’s allocation of cash flow from the portfolio for the portion of the
partnership it still owns increases to 99%
4) Buyout right is subject to certain limitations, including NEP being able to purchase a maximum of 10%, 25%,
26 50%, and 75% of the Class B units by the 4, 4.5, 5, and 5.5-year anniversaries of the agreement, respectivelyThe acquired assets and four existing NEP projects will be
combined into a new portfolio with KKR, where existing
project debt will be recapitalized
Transaction Overview
• After closing, NEP to contribute
1,192 MW into a new portfolio Sources
– 611 MW of acquired projects KKR investment $900 MM
– 581 MW of existing wind projects(1) Existing NEP debt capacity $340 MM
• $220 MM of existing project debt
to be paid down Total sources ~$1,240 MM
• Recapitalization produces
significant benefits Uses
Cost CAFD
– Bridges potential CAFD impact of
the PG&E bankruptcy Asset acquisition $1,020 MM $97-$107 MM
– NPV, DPU, and credit accretive Payoff project debt $220 MM $25 MM
– Cash savings reduce future asset Total uses ~$1,240 MM $122-$132 MM
and financing needs
Existing assets $17-$23 MM
– Assets remain de-risked, allowing
for potential re-levering in the future Total Second Portfolio $142-$152 MM
With this transaction, CAFD is expected to increase by ~$125 MM, enabling
NEP to meet its 2019 CAFD growth objectives without PG&E related CAFD
1) 99 MW Perrin Ranch, 120 MW Tuscola Bay, 62 MW Ashtabula III, 300 MW Stateline projects; see Appendix for
27 additional portfolio detailsNEP continues to focus on investing in clean energy assets
with stable cash flows
Asset Suitability
Long-Term Contract
Clean Energy Technology
Creditworthy Counterparty “NEP-Able”
Asset
Stable Regulatory Environment
Limited or Monetized Tax Credits
Strong Operations
Any clean energy asset that fits these criteria may be suitable for
acquisition by NEP
28One possible path to continued growth at NEP is acquisitions
from Energy Resources
Energy Resources’ Renewable
Portfolio Since NEP’s IPO(1)
25
~9 GW ~21 GW
20
~7 GW ~5 GW
15
GW
~10 GW
10
5
0
Renewables MW Placed in MW Sold to NEP Current Backlog Current Portfolio
Portfolio after IPO Service since IPO (ex. Repowering) (2) including Backlog
1) As of March 31, 2019; includes announced acquisition of 611 MW
2) Includes renewables backlog of 9,832 MW less 1,302 MW of repowering backlog
29NEP’s credit ratings increase financing flexibility and debt
capacity due to greater market access
Corporate Credit Rating and Debt Capacity
• NEP corporate credit ratings:
Convertible Term Loan B High-Yield
Equity Debt
Moody’s S&P Fitch Portfolio
Convertible Financing Revolving
Preferred Credit
Ba1 BB BB+ Facility
Stable Stable Stable Convertible
Preferred Optimal Capital Structure
for Distribution Growth
• Credit profile should support
Bank
Term
HoldCo debt of 4.0x to 5.0x Convertible
Loans
project distributions Debt
Project
PAYGO
Tax
Equity Financing/
Equity
• Interest rate exposure is well Refinancing
hedged through interest rate New Opportunities Utilized Products
swaps
NEP continues to analyze and evaluate new opportunities for financing its
long-term growth
30NEP’s long-term outlook for distribution growth through 2023
is best-in-class
NextEra Energy Partners Financial Expectations
Annualized LP Distributions(1) Adjusted EBITDA and CAFD(3)
$1,200 MM-
Annual $1,375 MM
12% - 15%
Growth(2)
$2.14 $485 MM -
$1.86
$555 MM $410 MM -
$480 MM
Q4 2018 Q4 2019E Q4 2023E 12/31/2019 12/31/2019 12/31/2019
Run Rate Run Rate Run Rate
Adj. EBITDA CAFD w/ PG&E CAFD w/o PG&E
1) Represents expected fourth quarter annualized distributions payable in February of the following year
2) From a base of our fourth quarter 2018 distribution per common unit at an annualized rate of $1.86
3) Run Rate reflects calendar year 2020 expectations for forecasted portfolio as of 12/31/19; includes current
portfolio, plus announced acquisition; Adjusted EBITDA expectations include full contributions from projects
related to PG&E as revenue is expected to continue to be recognized
31We believe NEP offers a superior value proposition and is
well positioned to deliver upon its long-term expectations
Investor Total Return Potential
~4% 16% - 19% • Opportunity to earn a total return of
roughly 16% - 19% per year through
at least 2023
12% - 15%
• Diversified portfolio with stable cash
flows
• High visibility into available growth
options to support DPU growth
• Disciplined approach to capital
allocation
• Flexible capital structure to finance
future growth
Distribution Distribution Annual Total • Strong corporate governance
Growth Yield (1) Return
Through At Potential • A proven and experienced
Least 2023 management team that has a long
track record of delivering results
1) Based on NextEra Energy Partners‘ distribution yield as of April 29, 2019
32Appendix 33
34
NextEra Energy’s credit metrics remain on track

                                Credit Metrics
                         A-        Downgrade   Actual   Target
     S&P                Range      Threshold    2018     2019
     FFO/Debt          13%-23%       21%        27%     >21%

     Debt/EBITDA       3.5x-4.5x                 3.1x   18%
     CFO-Div/Debt      9%-17%                   16%     >12%

                          A        Downgrade   Actual   Target
     Fitch             Midpoint    Threshold    2018     2019
     Debt/FFO            3.5x        4.25x       3.8x   5.0x

35
Contracted Wind and Solar Development Program(1)
Wind Location MW Solar Location MW
2017: 2017:
Oliver III ND 99 Whitney Point CA 20
Golden Hills North CA 46 Marshall MN 62
Bluff Point IN 120 Westside CA 20
Cottonwood NE 90 Distributed Generation Various 97
Total 2017 Wind: 355 Total 2017 Solar: 199
2018: 2018:
Lorenzo TX 80 Stuttgart AR 81
Wildcat Ranch TX 150 Pinal Central AZ 20
Pratt KS 243 Bluebell TX 30
Heartland Divide IA 103 Titan CO 50
Minco IV OK 130 Coolidge VT 20
Casa Mesa NM 50 Distributed Generation Various 125
Torrecillas TX 300 Total 2018 Solar: 326
Armadillo Flats OK 247 2019 – 2020:
Blue Summit II TX 99 Blythe III CA 125
Total 2018 Wind: 1,402 New England Various 160
2019 – 2020: Wilmot AZ 100
Burke ND 200 Blythe IV CA 62
Emmons-Logan ND 300 Quitman GA 150
Waymart II PA 68 Shaw Creek SC 75
Crowned Ridge I SD 300 Chicot AR 100
Eight Point NY 102 Dougherty GA 120
Sky River CA 62 Bluebell II TX 100
Dodge County MN 170 Grazing Yak CO 35
Borderlands AZ 100 Florida FL 224
Roundhouse WY 150 Saint AZ 100
Soldier Creek KS 300 Two Creeks (BOT) WI 150
Blue Summit III TX 201 Distributed Generation Various 90
Pretty Prairie KS 160 Total 2019 – 2020 Solar: 1,591
White Hills AZ 50 Post – 2020:
Buffalo Ridge MN 109 Point Beach WI 100
Pegasus MI 121 Route 66 NM 50
Sholes NE 160 Dodge Flat NV 200
Cerro Gordo CA 40 Fish Springs Ranch NV 100
Skeleton Creek OK 250 Arlington CA 131
Fort McKavett TX 50 High River NY 90
Jordan Creek IN 400 East Point NY 50
Bronco Plains CO 300 Proxima CA 50
Cedar Springs WY 200 Bellefonte TN 150
Wheatridge OR 200 Elora TN 150
Wheatridge (BOT) OR 100 Wheatridge OR 50
Pretty Prairie KS 23 New England Various 207
Contracted, not yet announced 120 Contracted, not yet announced 860
Total 2019 – 2020 Wind: 4,236 Total Post – 2020 Solar: 2,188
1) 2017+ COD and current backlog of projects with signed long-term contracts, all projects are subject to
development and construction risk
36Energy Storage Development Program(1)
Project Location MW Duration Project Location MW Duration
2017: 2019 – 2020:
Blue Summit TX 30 0.5 Montauk NY 5 8.0
Total: 30 Wilmot AZ 30 4.0
Rush Springs OK 10 2.0
2018: Minuteman MA 5 2.0
Pinal AZ 10 4.0 Total: 50
Parry ON 2 4.0 Post – 2020:
Elmira ON 2 4.0 Dodge Flat NV 50 4.0
East Hampton NY 5 8.0 Fish Springs Ranch NV 25 4.0
Gopher MN 15 2.0
Arlington CA 110 4.0
Casa Mesa NM 1 1.0
Proxima CA 5 4.0
Distributed Generation 2
Wheatridge OR 30 4.0
Total: 37
Contracted, not yet announced 245
Total: 465
1) 2017+ COD and current backlog of projects with signed long-term contracts, all projects are subject to
37 development and construction risksOver the last 30 years we have experienced both positive
and negative variability in wind resource
Energy Resources Wind Resource
Variability vs. Long-Term Average(1)
1.5
1.4
1.3
1.2
1.1
1.0
0.9
0.8
0.7
0.6
0.5
Long-Term Average Monthly Wind Energy Index
1) Historical values represent wind energy index for all of NextEra Energy Resources’ current portfolio and will not
agree with historically reported values; NEER’s current portfolio includes new wind investments one year after
project COD/acquisition date
38U.S. Federal tax incentives for completed renewables projects
have been extended into the next decade
Extended U.S. Federal Tax Credits
Wind Production Solar Investment
Tax Credit (PTC) Tax Credit (ITC)
Start of Start of
Construction COD Wind Construction COD Solar
Date Deadline PTC Date Deadline ITC
During 2016 12/31/2020 100% During 2019 12/31/2023 30%
During 2017 12/31/2021 80% During 2020 12/31/2023 26%
During 2018 12/31/2022 60% During 2021 12/31/2023 22%
During 2019 12/31/2023 40% Before 2022 1/1/2024 or After 10%
• Solar ITC guidance published by IRS in 2018 is consistent with
previous wind PTC guidance
– Safe harbor is deemed satisfied if taxpayer incurs 5% of the construction
costs and property is placed in service within four calendar years
– ITC guidance covers storage that is at least 75% charged by the solar
ITC facility
39Reconciliation of GAAP Net Income to Adjusted Earnings
Attributable to NextEra Energy, Inc.
(Three Months Ended March 31, 2019)
Florida Pow er Gulf Energy Corporate & NextEra
(m illions, except per share am ounts) & Light Pow er Resources Other Energy, Inc.
Net Incom e (Loss) Attributable to NextEra Energy, Inc. $ 588 $ 37 $ 301 $ (246) $ 680
Adjustments - pretax:
Net losses (gains) associated w ith non-qualifying hedges 224 259 483
Change in unrealized losses (gains) on equity securities held in
NEER's nuclear decommissioning funds and OTTI - net (120) (120)
Impact of income tax rate change on differential membership
interests 30 30
NEP investment gains - net 48 48
Operating loss (income) of Spain solar projects (1) (1)
Acquisition-related 16 16
Less related income tax expense (benefit) (34) (42) (76)
Adjusted Earnings (Loss) $ 588 $ 37 $ 448 $ (13) $ 1,060
Earnings (Loss) Per Share
Attributable to NextEra Energy, Inc. (assum ing dilution) $ 1.22 $ 0.08 $ 0.63 $ (0.52) $ 1.41
Adjustments - pretax:
Net losses (gains) associated w ith non-qualifying hedges 0.46 0.54 1.00
Change in unrealized losses (gains) on equity securities held in
NEER's nuclear decommissioning funds and OTTI - net (0.25) (0.25)
Impact of income tax rate change on differential membership
interests 0.06 0.06
NEP investment gains - net 0.10 0.10
Operating loss (income) of Spain solar projects - -
Acquisition-related 0.03 0.03
Less related income tax expense (benefit) (0.07) (0.08) (0.15)
Adjusted Earnings (Loss) Per Share $ 1.22 $ 0.08 $ 0.93 $ (0.03) $ 2.20
•40Reconciliation of GAAP Net Income to Adjusted Earnings
Attributable to NextEra Energy, Inc.
(Three Months Ended March 31, 2018)
Florida Power Energy Corporate &
(millions, except per share amounts) & Light Resources Other NextEra Energy, Inc.
Net Income (Loss) Attributable to NextEra Energy, Inc. $ 484 $ 3,929 $ 18 $ 4,431
Adjustments - pretax:
Net losses (gains) associated with non-qualifying hedges (125) 1 (124)
Change in unrealized losses (gains) on equity securities held in NEER's
nuclear decommissioning funds and OTTI - net 18 18
Tax reform-related (624) 5 (619)
NEP investment gains - net (3,893) (3,893)
Operating loss (income) of Spain solar projects 6 6
Less related income tax expense (benefit) 1,084 26 1,110
Adjusted Earnings (Loss) $ 484 $ 395 $ 50 $ 929
Earnings (Loss) Per Share
Attributable to NextEra Energy, Inc. (assuming dilution) $ 1.02 $ 8.26 $ 0.04 $ 9.32
Adjustments - pretax:
Net losses (gains) associated with non-qualifying hedges (0.26) - (0.26)
Change in unrealized losses (gains) on equity securities held in NEER's
nuclear decommissioning funds and OTTI - net 0.04 0.04
Tax reform-related (1.30) 0.01 (1.29)
NEP investment gains - net (8.21) (8.21)
Operating loss (income) of Spain solar projects 0.01 0.01
Less related income tax expense (benefit) 2.29 0.06 2.35
Adjusted Earnings (Loss) Per Share $ 1.02 $ 0.83 $ 0.11 $ 1.96
•41Reconciliation of Earnings Per Share Attributable to
NextEra Energy, Inc. to Adjusted Earnings Per Share
2005 2006 2007 2008 2009 2010 2011 2012 2013 2014 2015 2016(1) 2017(1) 2018
Earnings Per Share Attributable to NextEra Energy, Inc.
(assuming dilution) $ 2.34 $ 3.23 $ 3.27 $ 4.07 $ 3.97 $ 4.74 $ 4.59 $ 4.56 $ 4.47 $ 5.60 $ 6.06 $ 6.24 $ 11.39 $ 13.88
Adjustments:
Net losses (gains) associated with non-qualifying
hedges 0.47 (0.38) 0.36 (0.70) 0.07 (0.69) (0.75) 0.15 0.27 (0.70) (0.64) 0.23 0.46 0.50
Change in unrealized losses (gains) on equity
securities held in NEER's nuclear decommissioning
funds and OTTI - net(2) 0.01 0.02 0.34 0.05 (0.02) 0.03 (0.13) (0.01) - 0.05 - (0.05) 0.38
Merger-related expenses 0.06 0.06 0.29 0.20 0.07
Loss on sale of natural gas-fired generating assets 0.36
Gain from discontinued operations (Hydro) (0.87)
Loss (gain) associated with Maine fossil 0.16 (0.05)
Impairment charge 0.70 0.89
Resolution of contingencies related to a previous
asset sale (0.02)
Gain on sale of natural gas generation facilities (0.95)
Tax reform-related (3) (3.97) (1.17)
Gain on disposal of fiber-optic telecommunications
business (2.32)
NEP invesrment gains - net (7.91)
Operating loss (income) of Spain solar projects 0.03 0.09 (0.01) 0.03 (0.01)
Less related income tax expense (benefit) (0.18) 0.12 (0.16) 0.13 (0.04) 0.27 0.16 (0.01) 0.22 0.36 0.19 0.36 0.11 1.95
Adjusted Earnings Per Share $ 2.63 $ 3.04 $ 3.49 $ 3.84 $ 4.05 $ 4.30 $ 4.39 $ 4.57 $ 4.97 $ 5.30 $ 5.71 $ 6.18 $ 6.70 $ 7.70
1) Amounts have been retrospectively adjusted for accounting standard update related to leases
2) Beginning in 2018, reflects the implementation of an accounting standards update related to financial instruments
3) Net of approximately $40 MM of income tax benefit at FPL in 2017
42Definitional information NextEra Energy, Inc. Adjusted Earnings Expectations This presentation refers to adjusted earnings per share expectations. Adjusted earnings expectations exclude the cumulative effect of adopting new accounting standards, the effects of non-qualifying hedges and unrealized gains and losses on equity securities held in NextEra Energy Resources’ nuclear decommissioning funds and OTTI, none of which can be determined at this time. Adjusted earnings expectations also exclude the effects of transitional impacts of tax reform, including the impact on differential membership interests, NextEra Energy Partners, LP net investment gains, the operating results from the Spain solar project, and acquisition related expenses. In addition, adjusted earnings expectations assume, among other things: normal weather and operating conditions; continued recovery of the national and the Florida economy; supportive commodity markets; current forward curves; public policy support for wind and solar development and construction; market demand and transmission expansion to support wind and solar development; market demand for pipeline capacity; access to capital at reasonable cost and terms; no divestitures, other than to NextEra Energy Partners, LP, or acquisitions; no adverse litigation decisions; and no changes to governmental tax policy or incentives. Expected adjusted earnings amounts cannot be reconciled to expected net income because net income includes the effect of certain items which cannot be determined at this time. NextEra Energy Resources, LLC. Adjusted EBITDA Adjusted EBITDA includes NextEra Energy Resources consolidated investments, excluding Spain, its share of NEP and forecasted investments, as well as its share of equity method investments. Adjusted EBITDA represents projected (a) revenue less (b) fuel expense, less (c) project operating expenses, less (d) corporate G&A, plus (e) other income, less (f) other deductions. Adjusted EBITDA excludes the impact of non-qualifying hedges, other than temporary impairments, certain differential membership costs, and net gains associated with NEP’s deconsolidation beginning in 2018. Projected revenue as used in the calculations of Adjusted EBITDA represents the sum of projected (a) operating revenue plus a pre-tax allocation of (b) production tax credits, plus (c) investment tax credits and plus (d) earnings impact from convertible investment tax credits. NextEra Energy Resources, LLC. Adjusted EBITDA by Asset Category Adjusted EBITDA by Asset Category includes NextEra Energy Resources consolidated investments, excluding Spain, its share of NEP and forecasted investments, as well as its share of equity method investments. Adjusted EBITDA by Asset Category represents projected (a) revenue less (b) fuel expense, less (c) project operating expenses, less (d) a portion of corporate G&A deemed to be associated with project operations, plus (e) other income, less (f) other deductions. Adjusted EBITDA by Asset Category excludes the impact of non-qualifying hedges, other than temporary impairments, corporate G&A not allocated to project operations, and certain differential membership costs. Projected revenue as used in the calculations of Adjusted EBITDA by Asset Category represents the sum of projected (a) operating revenue plus a pre-tax allocation of (b) production tax credits, plus (c) investment tax credits and plus (d) earnings impact from convertible investment tax credits. 43
Cautionary Statement And Risk Factors That May Affect
Future Results
This presentation contains “forward-looking statements” within the meaning of the safe harbor provisions of the Private Securities
Litigation Reform Act of 1995. Forward-looking statements are not statements of historical facts, but instead represent the current
expectations of NextEra Energy, Inc. (together with its subsidiaries, NextEra Energy) regarding future operating results and other future
events, many of which, by their nature, are inherently uncertain and outside of NextEra Energy's control. Forward-looking statements in
this presentation include, among others, statements concerning adjusted earnings per share expectations and future operating
performance, statements concerning future dividends, and results of acquisitions. In some cases, you can identify the forward-looking
statements by words or phrases such as “will,” “may result,” “expect,” “anticipate,” “believe,” “intend,” “plan,” “seek,” “potential,”
“projection,” “forecast,” “predict,” “goals,” “target,” “outlook,” “should,” “would” or similar words or expressions. You should not place
undue reliance on these forward-looking statements, which are not a guarantee of future performance. The future results of NextEra
Energy and its business and financial condition are subject to risks and uncertainties that could cause actual results to differ materially
from those expressed or implied in the forward-looking statements, or may require it to limit or eliminate certain operations. These risks
and uncertainties include, but are not limited to, the following: effects of extensive regulation of NextEra Energy's business operations;
inability of NextEra Energy to recover in a timely manner any significant amount of costs, a return on certain assets or a reasonable
return on invested capital through base rates, cost recovery clauses, other regulatory mechanisms or otherwise; impact of political,
regulatory and economic factors on regulatory decisions important to NextEra Energy; disallowance of cost recovery based on a finding
of imprudent use of derivative instruments; effect of any reductions or modifications to, or elimination of, governmental incentives or
policies that support utility scale renewable energy projects or the imposition of additional tax laws, policies or assessments on
renewable energy; impact of new or revised laws, regulations, interpretations or ballot or regulatory initiatives on NextEra Energy; capital
expenditures, increased operating costs and various liabilities attributable to environmental laws, regulations and other standards
applicable to NextEra Energy; effects on NextEra Energy of federal or state laws or regulations mandating new or additional limits on the
production of greenhouse gas emissions; exposure of NextEra Energy to significant and increasing compliance costs and substantial
monetary penalties and other sanctions as a result of extensive federal regulation of its operations and businesses; effect on NextEra
Energy of changes in tax laws, guidance or policies as well as in judgments and estimates used to determine tax-related asset and
liability amounts; impact on NextEra Energy of adverse results of litigation; effect on NextEra Energy of failure to proceed with projects
under development or inability to complete the construction of (or capital improvements to) electric generation, transmission and
distribution facilities, gas infrastructure facilities or other facilities on schedule or within budget; impact on development and operating
activities of NextEra Energy resulting from risks related to project siting, financing, construction, permitting, governmental approvals and
the negotiation of project development agreements; risks involved in the operation and maintenance of electric generation, transmission
and distribution facilities, gas infrastructure facilities, retail gas distribution system in Florida and other facilities; effect on NextEra Energy
of a lack of growth or slower growth in the number of customers or in customer usage; impact on NextEra Energy of severe weather and
other weather conditions; threats of terrorism and catastrophic events that could result from terrorism, cyber attacks or other attempts to
disrupt NextEra Energy's business or the businesses of third parties; inability to obtain adequate insurance coverage for protection of
NextEra Energy against significant losses and risk that insurance coverage does not provide protection against all significant losses; a
prolonged period of low gas and oil prices could impact NextEra Energy’s gas infrastructure business and cause NextEra Energy to delay
or cancel certain gas infrastructure projects and could result in certain projects becoming impaired; risk of increased operating costs
resulting from unfavorable supply costs necessary to provide full energy and capacity requirement services; inability or failure to manage
properly or hedge effectively the commodity risk within its portfolio; effect of reductions in the liquidity of energy markets on NextEra
Energy's ability to manage operational risks;

 44
Cautionary Statement And Risk Factors That May Affect
Future Results (cont.)
effectiveness of NextEra Energy's risk management tools associated with its hedging and trading procedures to protect against
significant losses, including the effect of unforeseen price variances from historical behavior; impact of unavailability or disruption of
power transmission or commodity transportation facilities on sale and delivery of power or natural gas; exposure of NextEra Energy to
credit and performance risk from customers, hedging counterparties and vendors; failure of counterparties to perform under derivative
contracts or of requirement for NextEra Energy to post margin cash collateral under derivative contracts; failure or breach of NextEra
Energy's information technology systems; risks to NextEra Energy's retail businesses from compromise of sensitive customer data;
losses from volatility in the market values of derivative instruments and limited liquidity in OTC markets; impact of negative publicity;
inability to maintain, negotiate or renegotiate acceptable franchise agreements; occurrence of work strikes or stoppages and
increasing personnel costs; NextEra Energy's ability to successfully identify, complete and integrate acquisitions, including the effect
of increased competition for acquisitions; the inability to realize the anticipated benefits of the Gulf Power Company acquisition;
environmental, health and financial risks associated with ownership and operation of nuclear generation facilities; liability of NextEra
Energy for significant retrospective assessments and/or retrospective insurance premiums in the event of an incident at certain
nuclear generation facilities; increased operating and capital expenditures and/or reduced revenues at nuclear generation facilities
resulting from orders or new regulations of the Nuclear Regulatory Commission; inability to operate any of NextEra Energy’s owned
nuclear generation units through the end of their respective operating licenses or through expected shutdown; effect of disruptions,
uncertainty or volatility in the credit and capital markets or actions by third parties in connection with project-specific or other financing
arrangements on NextEra Energy's ability to fund its liquidity and capital needs and meet its growth objectives; inability to maintain
current credit ratings; impairment of liquidity from inability of credit providers to fund their credit commitments or to maintain their
current credit ratings; poor market performance and other economic factors that could affect NextEra Energy's defined benefit pension
plan's funded status; poor market performance and other risks to the asset values of nuclear decommissioning funds; changes in
market value and other risks to certain of NextEra Energy's investments; effect of inability of NextEra Energy subsidiaries to pay
upstream dividends or repay funds to NextEra Energy or of NextEra Energy's performance under guarantees of subsidiary obligations
on NextEra Energy's ability to meet its financial obligations and to pay dividends on its common stock; the fact that the amount and
timing of dividends payable on NextEra Energy's common stock, as well as the dividend policy approved by NextEra Energy's board
of directors from time to time, and changes to that policy, are within the sole discretion of NextEra Energy's board of directors and, if
declared and paid, dividends may be in amounts that are less than might be expected by shareholders; NEP’s inability to access
sources of capital on commercially reasonable terms could have an effect on its ability to consummate future acquisitions and on the
value of NextEra Energy’s limited partner interest in NextEra Energy Operating Partners, LP; and effects of disruptions, uncertainty or
volatility in the credit and capital markets on the market price of NextEra Energy's common stock. NextEra Energy discusses these
and other risks and uncertainties in its annual report on Form 10-K for the year ended December 31, 2018 and other SEC filings, and
this presentation should be read in conjunction with such SEC filings made through the date of this presentation. The forward-looking
statements made in this presentation are made only as of the date of this presentation and NextEra Energy undertakes no obligation
to update any forward-looking statements.

  45
46
Second Convertible Equity Portfolio Overview(1)
 Asset                                  MW     Technology   COD    Remaining PPA Term
 Announced Acquisition

 Story II                                150      Wind      2010           11

 Silver State                            125      Solar     2016           17

 Ashtabula II                            120      Wind      2010           21

 White Oak                               150      Wind      2012           13

 Roswell                                  35      Solar     2016           22

 Marshall                                 31      Solar     2017           23

 Total Acquisition                       611

 Existing NEP Assets Included in Portfolio

 Perrin Ranch                             99      Wind      2012           19

 Tuscola bay                             120      Wind      2012           14

 Ashtabula III                            62      Wind      2010           20

 Stateline                               300      Wind      2002           8

 Recapitalized Projects                  581

47 1) Acquisition announced on March 6, 2019
Second Convertible Equity
                           Portfolio Financing Summary Terms(1)
Key Terms                                                                         Summary
                        KKR commitment of $900 MM; expected net proceeds prior to offering expenses of approximately $893 MM; NEP to fund the
Funding Amount:         balance of the $1,020 MM Energy Resources portfolio purchase price and approximately $220 MM pay down of existing project
                        debt
Issuer:                 Newly-formed private HoldCo managed and operated by affiliates of NEP
Units:                  KKR to purchase Class B Common Equity Units from Issuer, representing an approximately 62% investment in HoldCo
Draw Timing:            Funds to be drawn no later than 7/31/2019
                        Cash distributions to occur on a monthly basis; for the first six years KKR will receive 5% of all distributions and NEP
                        will receive 95% subject to certain minimum buyout thresholds as described below, which is expected to result in an
                        implied coupon of less than 1% per annum. Thereafter, KKR will receive 99% of all distributions on all remaining
Cash
                        Class B units that NEP has not exercised its buyout right for
Distributions:
                        Initial cash distribution allocations are subject to NEP having met minimum buyout threshold of 15% and 30% of the Class B
                        units by the four and a half and five-year anniversaries of the agreement, respectively; cash distributions revert to original
                        allocations if NEP subsequently achieves minimum buyout thresholds
                        Between the three and a half and seven-year anniversaries of the agreement, NEP will have the option to purchase some or
                        all of the Class B Units once per quarter and up to three times per year at NEP’s discretion for a purchase price equal to $900
                        MM, plus a fixed pre-tax annual return of 8.32% on each unit inclusive of all prior distributions (the “Buyout Amount”). Units
                        purchased during the seventh year will accrue at a higher 9.32% return from the third anniversary of the agreement
Buyout Right:           NEP has the right to pay at least 70% of the Buyout Amounts in non-voting NEP common units at an issuance price based
                        on the lower of the then-current 10-day VWAP or market price of NEP common units (without discount), with the balance paid
                        in cash. NEP will enter into a registration rights agreement for the units issued in consideration for the Buyout Amount
                        substantially similar to those executed for the Convertible Equity Portfolio Financing completed with BlackRock
                        Buyout right is subject to certain limitations, including NEP being able to purchase a maximum of 10%, 25%, 50%, and 75%
                        of the Class B units by the four, four and a half, five, and five and a half-year anniversaries of the agreement, respectively
Change of               Upon a change of control of NEP, KKR may elect to force a repurchase of the Class B units for cash, NEP common units, or
Control:                a substantially equivalent (or a combination thereof) at NEP’s election at a pre-tax annual return of 9.32%
Transfer                Prior to the third anniversary of the agreement, KKR can not transfer its Class B units without the consent of NEP; afterward,
Provisions:             KKR may transfer without consent to anyone not defined as a competitor. NEP may not transfer its Class A units without the
                        consent of KKR
Governance:             KKR will have limited governance rights. In the event that NEP has not purchased more than 65% of the Class B units by the
                        seventh anniversary of the agreement, KKR will have the right to pursue a sale of the portfolio

         1) Summary of terms; please refer to the NextEra Energy Partners 8-K dated March 4, 2019 for additional details
  48
NEP has agreed to purchase a 611 MW portfolio of unlevered
renewable projects from Energy Resources for $1.02 B(1)
Portfolio Additions
Remaining Counterparty
Asset MW Technology Counterparty COD PPA Term(2) Credit Rating
Story II 150 Wind City of Ames, IA; 2010 11 NR / NR;
Google AA+ / Aa2
Silver State(3) 125 Solar Southern 2016 17 BBB / A3
California Edison
Ashtabula II 120 Wind Great River; 2009 21 A- / Baa1;
Minnkota Power A- / Baa2
White Oak 150 Wind Tennessee Valley 2011 13 AA+ / Aaa
Authority
Roswell(3) 35 Solar Southwestern 2016 22 A- / Baa2
Public Service Co.
Marshall(3) 31 Solar Northern States 2017 23 A- / A2
Power Co.
Total Acquisition 611 15
The acquisition is expected to close in Q2 2019 and contribute $100 – $115 MM
of adjusted EBITDA and $97 – $107 MM of CAFD on a run rate basis
1) Subject to working capital adjustments
2) Story II and Ashtabula II have multiple off-takers with various PPA terms; remaining PPA term reflects CAFD
weighted average
3) NEP acquiring 49.99% interest; MW reflects NEP net ownership
49The second convertible equity portfolio financing transaction
is expected to provide a cash flow bridge for LP unitholders
while the PG&E bankruptcy process is resolved
Cash Flow Uplift from 2.0 Transaction
$25 $25-$35 $485 - $555 ($95 - $105)
($8 - $12) ($7 - $9)
$97 - $107
$410 - $480
$360 - $400
(2)
2018 Year 2019 Existing Interest 2.0 Partner Other(3) CAFD PG&E CAFD w/o
(4)
End CAFD Acquisition Project Share with 2.0 CAFD PG&E
Recap(1)
CAFD $360 - $400 $485 - $555 $410 - $480
Preferred ($25) ($25) ($25)
Units 157.5 157.5 157.5
DPU $1.86 $2.14 $2.14
1) Removal of debt service resulting from project finance pay off at Perrin Ranch, Tuscola Bay, Ashtabula III, and
Stateline
2) Interest on remaining $340 MM of financing
3) Includes portfolio growth driven by Texas Pipelines expansion projects, contract and PTC rate escalation,
offset by IDR growth
50 4) CAFD from Genesis, Desert Sunlight 250/300, and ShafterThe low cost of the second convertible equity portfolio
financing transaction allows NEP to retain significantly more
cash flow relative to alternative financings
Net Cash Flow of the Second Transaction vs Equity/Debt
2.0 Transaction 50/50 Equity/Debt(1)
$165-$195 ($35-$41)
Additional
Acquisition ($25-$33)
$25 ($7-$9)
($8-$12)
$105-$115 ($2-$4) $105-$115
$97-$107
Announced
Acquisition
(4)
Acquisition Existing 2.0 Partner Interest(3) Net Increase Acquisition Interest Additional Additional Net Increase
CAFD Project Share Cash Flow CAFD LP IDRs Cash Flow
Recap (2) Distributions
Without this transaction, NEP would potentially have to acquire nearly
twice as many assets in 2019 to achieve the same cash flow growth
1) Assets purchased at 10% CAFD yield; funded with 50% equity with shares issued at 5% discount to $43/unit
trading price
2) Removal of debt service resulting from project finance pay off at Perrin Ranch, Tuscola Bay, Ashtabula III,
Stateline
3) Interest on remaining $340 MM of financing
51 4) Interest on $340 MM of financing plus 5% interest on the remaining debt raised to fund acquisitionNEP’s tax shield creates the need to employ tax equity
financing for projects that generate a large portion of their
economics from tax credits
PAYGO Tax Equity Financing
• Tax equity financing is used Project Cash Flow Split(1)
to monetize tax attributes
• Under tax equity, an investor
makes an up-front payment 8%-12%
– Pre-payment for tax 30%-35%
depreciation, 70% - 75% of
expected PTCs, and a small
portion of project cash Reported
NEP
• Additionally, the investor 55%-60% CAFD
makes PAYGO payments
– 25% - 30% of annual PTCs that
enhance asset cash flow profile
• Project cash not paid to the
investor and PAYGO Tax Equity Share of Project Cash
payments make up total NEP's Cash From PAYGO Payments
CAFD NEP's Share of Project Cash
1) Cash flow splits are shown on a pre-tax basis
52You can also read