VALUATION OF TARGET CORP - END-OF-DEGREE PROJECT Trabajo Fin de Grado - TAUJA
←
→
Page content transcription
If your browser does not render page correctly, please read the page content below

Trabajo Fin de Grado

VALUATION OF TARGET CORP.
 END-OF-DEGREE PROJECT

 KYLE HAUGSTAD
 SEPTIEMBRE 2017
DECLARACIÓN JURADA DE AUTORÍA

Yo, D/Dª Kyle Haugstad, con DNI nº: X6593703V y domicilio en C/ La Cascada, Nº 13,
Bloque 3, Apartamento 58, Torremolinos, Málaga, C.P. 29620, declaro que el presente Trabajo
Fin de Grado (TFG) es obra exclusiva y original de mi autoría, sin que haya existido plagio
alguno en su elaboración.

Y para que conste y surta los efectos oportunos donde proceda, firmo la presente declaración
jurada de originalidad de mi obra, así como también la debida cita bibliográfica de las fuentes
utilizadas.

 HAUGSTAD KYLE - Firmado digitalmente por
 HAUGSTAD KYLE - X6593703V
 X6593703V Fecha: 2017.09.17 12:42:41 +02'00'

 En Jaén, a de 17 de septiembre, 2017.
Table of Contents
1. Introduction ......................................................................................................................................... 1
2. Description of Target Corporation ...................................................................................................... 2
 2.1 History of the Firm........................................................................................................................ 2
 2.2 Description of the Sector............................................................................................................... 4
 2.3 SWOT Analysis ............................................................................................................................ 6
3 Economical/Financial Analysis............................................................................................................ 8
 3.1 Income Statement.......................................................................................................................... 8
 3.2 Cash flows................................................................................................................................... 11
 3.3 Balance sheet .............................................................................................................................. 12
4. Valuation ........................................................................................................................................... 15
 4.1 Discounted Cash Flows............................................................................................................... 15
 4.2 Equity Risk Premium .................................................................................................................. 17
 4.3 Cost of Debt ................................................................................................................................ 18
 4.4 Operating Lease Adjustments ..................................................................................................... 19
 4.4 Systematic Risk - Unlevered Beta (β) ......................................................................................... 20
 4.6 Levered β for Equity ................................................................................................................... 22
 4.7 WACC ........................................................................................................................................ 23
 4.8 Estimating Growth ...................................................................................................................... 23
 4.9 Terminal Value ........................................................................................................................... 26
5. FCFF Results .................................................................................................................................... 28
6. FCFE Results .................................................................................................................................... 30
7. Conclusions ....................................................................................................................................... 32
8. Glossary ............................................................................................................................................ 33
9. Bibliography ..................................................................................................................................... 34
1. Introduction
The aim of the report is to carry out a business valuation of the firm Target Corp. from an
investors vantage point. The data will be compiled from the latest 10-K which covers the
fiscal year of 27-01-2016 to 27-01-2017. Through analysing the most up-to-date data of Target
in addition to points of views from analysts who contribute to reputable financial websites, we
will proceed to identify how financially and economically sound the firm is by analysing its
financial statements. This will be followed by a valuation of the firm based on the method of
Discounted Free Cash Flows to Firm and Equity by following the steps given by the esteemed
professor Damodaran of Stern University in New York.

Resumen

El objetivo de este informe es llevar a cabo una valuación de la empresa “Target Corp.”
enfocado desde el punto de vista del inversor. Los datos serán recopilados del último informe
10-K, que cubre el año fiscal de 28-01-2016 a 27-01-2017. Para poder analizar los datos más
actualizados de Target, además de las opiniones de analistas que contribuyen a página webs
venerables, comenzaremos a identificar la estructura financiero-económica de la empresa por
medio del análisis de su estado financiero. Seguidamente, realizaremos una evaluación de la
empresa basada en el método del “descuento de flujos de cajas libres” para la empresa y para
el accionista, adhiriéndonos a las pautas recomendadas por el estimado profesor Damodaran
de la Universidad Stern de Nueva York.

Disclaimer

This report is based solely on my own research and should only be regarded for informational
purposes and not investment advice. As I have no knowledge of individual investor
circumstances, goals, and/or portfolio concentration or diversification, therefore readers are
expected to complete their own due diligence before purchasing any stocks mentioned or
recommended. The price I call fair valued is not a prediction of future price but only the price
at which I consider the stock to be of value for its discounted cash flows.

 1
2. Description of Target Corporation

2.1 History of the Firm

Target Corp., formally known as Dayton Dry Goods, was founded by George Draper Dayton
1902 in Minneapolis, Minnesota owing to the fact that the Midwest region of the United States
of America was growing at a rapid rate and would therefore offer the strongest opportunities
of business growth. This firm went on to become Daton’s Corp. and it wasn’t until the 1960’s
that the company decided to dabble in discount retailing.

On May 1st, 1962, the first official Target store was opened in St. Paul, Minnesota. This move
was seen as risky and the first three years proved that notion to be true as Target would not see
its first gain until 1965. Despite the presumable rocky start, Target began to expand by opening
new stores in Minnesota and across the Midwest in 1967. By the 1980’s, Target was a
nationwide, booming retail store in the USA.

Expansion into Canada and its soon-to-be exit

In 2011, Target set out to expand into Canada by acquiring 189 failing Zellers retail stores
across the country for $1.8 billion. However, it wasn’t until 2013 when they officially opened
124 stores in USA’s northern neighbour. (Target Corp, 2017) This one of two unfortunate
events that tarnished the brick and mortar’s long-earned reputation.

Although Canadian consumers were expecting USA style stores with the promising name of
Target, they claim to have received the same, failing Zeller’s chain with a different Logo due
to various setbacks. To begin with, the leased buildings were far smaller in size than their US
siblings were. Apart from the dimensional let down, the Canadian chain simply wasn’t able to
stock what they advertised, creating an “over-promised and under-delivered” reputation.
(Tayor, Ho, & Hopkins, 2014).

In an effort to improve their image, Target increased capital spending to $11 million in the year
2013 to renovate the dilapidated stores and improve efficiency by means of investing in new
technology. For as good as their intention may have been, they weren’t enough.
Underqualified workers and a lack of training programs proved their struggle was in vain.
Target simply couldn’t keep up with the promises made and expectations of their customers.

 2
Much to their dismay, Target stores in Target simply weren’t appealing to the Canadian
consumers. The board of directors decided to cease all operations in Canada just two years
later owing to the fact that assessments claimed their endeavour would not be profitable until
the year 2021. As a result, Target suffered a 5.1 billion pre-tax exit cost in discontinued
operations. (Target Corp, 2015, p. 32)

To add insult to injury, on December 19th, 2013, Target made publically confirmed a
devastating data breach of 40 million credit cards that had been hacked starting on Black Friday
in November. As of January, 28, 2017, the net expenses occurred from the breach have added
up to $202 million. It is worthy pointing out that fines and legal costs of this hack are just part
of the detrimental scope as it is virtually impossible to tally up how the breach affected
consumer confidence in Target and whether it is a deciding factor to shop at an alternative
discount chain.

 3
2.2 Description of the Sector

In terms of employment, without a doubt, retail plays a vital role in the USA. It is the final
step in distributing merchandise and services to consumers. According to a report conducted
by The National Retail Federation in conjunction with PricewaterhouseCoopers LLP, retail is
unsurprisingly the largest private sector job creator across the 50 states of the US, counting for
one in every four jobs. (National Retail Federation, 2017)

Retail directly impacts the economy and households by providing 29 million American jobs,
which is 16 percent of total US employment. Furthermore, retail works hand in hand with over
13 million other non-retail jobs. In all, the total national impact is 43 million workers which
make up 23% of the US workforce.

According to the NRF retail is comprised of the following 13 subsectors:

Subsector Jobs Income GDP Establishments
Motor vehicle and parts dealers 1,936,800 $107,985.00 $ 131,985.00 278,779
Furniture and home furnishings stores 502,000 $ 19,173.00 $ 25,783.00 90,692
Electronics and appliances stores 554,000 $ 28,139.00 $ 43,984.00 80,813
Building materials/ garden equipment 1,231,100 $ 47,047.00 $ 69,562.00 110,630
Food and beverage sotres 3,078,500 $ 92,991.00 $ 123,759.00 251,296
Health and personal care stores 1,176,900 $ 47,142.00 $ 58,965.00 246,272
Gasoline stations 885,400 $ 31,320.00 $ 46,994.00 113,575
Clothing and accessories stores 1,614,200 $ 39,019.00 $ 72,536.00 286,225
Sporting goods, hobby, book and music stores 739,500 $ 16,698.00 $ 26,237.00 132,138
General merchandise stores 3,145,800 $ 85,939.00 $ 140,656.00 92,064
Miscellaneous stores 1,590,700 $ 33,930.00 $ 59,157.00 391,678
Non-store retailers 1,729,900 $ 36,703.00 $ 128,927.00 859,299
Food services and drinking places 10,799,300 $236,440.00 $ 314,572.00 860,161
Total Retail Industry 28,984,100 $822,526.00 $ 1,243,117.00 3,793,622
Table 1 NRF US Retail (2017)

Analysing the data in the subsector points out a few interesting figures. Though Food services
and drinking places are the source of the highest number of jobs across the board, the number
of establishments is rather low, which would imply more workers to an establishment
compared to the rest of the subsectors. Perhaps this is due to a high number of part-time jobs
in bars and food establishments.

Regarding the highest GDP to Jobs ratio, Electronics and appliances stores comes in first with
ratio of .08. As for Income to Jobs, motor vehicle and parts dealers have the highest income,
with a ratio of .055, while Food Services and Miscellaneous stores have the lowest salaries.

 4
Occupation Direct Jobs Indirect Jobs Total Jobs Total Job Impact
Food preperation and serving 10,611,782 305,444 10,917,226 26%
Sales 10,090,048 781,808 10,871,856 26%
Logsitics and freight transportation 3,278,290 1,692,601 4,970,892 12%
Management, business operations, administrative 1,827,137 2,537,975 4,365,111 10%
Building, cleaning, maintenance and repair 1,104,722 1,497,287 2,602,008 6%
Health care and service 748,013 1,628,967 2,376,981 6%
Finance, insurance and real estate 564,616 1,248,175 1,812,791 4%
Technology and IT 202,654 606,892 809,546 2%
All other occutpations 556,838 3,006,816 3,563,654 8%
Total Job Impact- All occupations 28,984,100 13,305,965 42,290,065 100%
Table 2 NRF US retail (2017)

In the year 2016, there were nearly 3.8 million retail establishments in the USA which directly
and indirectly reached close to $2.6 trillion in revenue or 16% of the GDP.

Regarding the demographics of retail in the USA, we can observe how retail makes up for
around 1/4th of the share of each state. Clearly retail is a strong component of the US economy
and given the affect it has, directly or indirectly on it.

Figure 1 NRF US States and Retail (2017)

 5
2.3 SWOT Analysis

Strengths

Long history

Target is one of the oldest and largest well-known discount retail stores in the USA which, in
turn, leaves a considerable store foot print. Referring their customers as “guests” implies they
strive to make the shopping experience a memorable and delightful experience. In juxtaposing
the two terms for consumers, the former is simple a person who purchases a commodity or
service, whereas the latter is the same but with the extension of hospitality and an air of being
“welcomed to a home”. In other words, their guests are not only receiving what they purchase,
but an additional valued resource of affection, attention to detail, and belonging.

In addition to company policy when dealing with guests, Target also has a wide gamut of
popular owned and exclusive brands, such as Knox Rose, or DENIZEN from Levi’s Jeans;
brands which are often perceived by consumers as high quality at a discounted price.

Latest technology and special deals.

Target offers an interactive, user-friendly and “fun” App called Cartwheel which allows its
consumers to find special deals and discounts by actively scanning product barcodes while
shopping. In addition to this new way of interactive shopping, it also offers personalized
recommendations to its customer via notifications. Target stores also offer a 5% direct discount
to products purchased online or with a Target Red Card, an approach to rewarding customer
fidelity with incentives that encourage them to return. In addition to these, TGT had expanded
their online store by offering non-perishable goods such as groceries in an effort to remain
competitive with the industry leaders, Amazon and Walmart.

Accessible, brick and mortar stores.

Target is easily accessible as it has 1,802 stores and employs over 323,000 people in most
major cities throughout the USA.

Name Brands

Despite being a discount retail store, Target presents itself as a middle-class brand and is seen
as higher-quality than Walmart as it has its own clothing line which appeals to younger
customers in addition to more attractive food alternatives such as organic products.

 6
Weaknesses

Data breach

The 2013 credit card data breach not only had a detrimental impact on consumer confidence in
the image of Target but also set them back $202 million in expenses. Whether TGT likes it or
not, this tarnishes their reputation while the other two leading competitors have an immaculate
image when it comes to data protection.

Canada Exit

As mentioned before, TGT took a $5.4 billion loss due to the exit, which cannot be beneficial
for their image and morale.

Threats

Online competition

Amazon’s acquisition of Wholesale foods plus Walmart allowing purchases via Google
Express increase online competition.

Opportunities

Potential market segment absorption

Middle class retails stores such as Macy’s and Sears are going out of business or closing stores.
Given the higher perceived quality these stores had plus the brick and mortar “touch before
you buy” atmosphere may help allow Target to focus on said stores market segment that are
out of Walmart and Amazon ‘s reach.

Expanding e-commerce

Online shopping proclaims a large part of the retail market. Target capital expenditure shows
a strong investment in information technology.

 7
3 Economical/Financial Analysis

3.1 Income Statement
Many investors are interested in solely two figures: revenues and margins. Also known as
“Top Line Growth”, these will be the determinant figures that will ultimately either raise or
lower the stock price. Given that TGT is a publicly traded company this notion forms the basis
for the following income statement analysis.

 2016 2015 2014 2013 2012
Sales $ 69,495.00 $ 73,785.00 $ 72,618.00 $ 71,279.00 $ 73,301.00
Cost of sales $ 48,872.00 $ 51,997.00 $ 51,278.00 $ 50,039.00 $ 50,568.00
Gross margin $ 20,623.00 $ 21,788.00 $ 21,340.00 $ 21,240.00 $ 22,733.00
Operating expenses
Sales, General and administrative $ 13,356.00 $ 14,665.00 $ 14,676.00 $ 14,465.00 $ 14,643.00
Depreciation and amortization $ 2,298.00 $ 2,213.00 $ 2,129.00 $ 1,996.00 $ 2,511.00
Gain on sale $ -620.00 $ -391.00 $ -161.00
Total operating expenses $ 15,654.00 $ 16,258.00 $ 16,805.00 $ 16,070.00 $ 16,993.00
Operating income (EBIT) $ 4,969.00 $ 5,530.00 $ 4,535.00 $ 5,170.00 $ 5,740.00
Interest Expense $ 1,004.00 $ 607.00 $ 882.00 $ 1,049.00 $ 684.00
Income before income taxes $ 3,965.00 $ 4,923.00 $ 3,653.00 $ 4,121.00 $ 5,056.00
Provision for income taxes $ 1,296.00 $ 1,602.00 $ 1,204.00 $ 1,427.00 $ 1,741.00
Net income from continuing operations $ 2,669.00 $ 3,321.00 $ 2,449.00 $ 2,694.00 $ 3,315.00
Net income from discontinuing operations 68 42 -4085 -723 -316
Net income $ 2,737.00 $ 3,363.00 $ -1,636.00 $ 1,971.00 $ 2,999.00
Net income available to common shareholders $ 2,737.00 $ 3,363.00 $ -1,636.00 $ 1,971.00 $ 2,999.00
Earnings per share
Basic $ 4.74 $ 5.35 $ -2.58 $ 3.10 $ 4.57
Diluted $ 4.70 $ 5.31 $ -2.56 $ 3.07 $ 4.52
Weighted average shares outstanding
Basic $ 577.60 $ 627.70 $ 634.70 $ 635.10 $ 656.70
Diluted $ 582.50 $ 632.90 $ 640.10 $ 641.80 $ 663.30
EBITDA $ 7,267.00 $ 7,743.00 $ 6,664.00 $ 7,166.00 $ 7,784.00
Table 3 TGT Income Statement (2017)

To begin with, though revenues have been rather stable over that past five years, they dropped
by 5.8% in 2016 – considerably worse than the rest of department store sales, which slumped
3.9% that year (Zacks.com, 2017). This figure is rather alarming on account of the US GDP
growth rate is three time bigger, unemployment rate is at an all-time low, and consumer
confidence is solid. (McNeil, 2017) TGT claims the loss in sales is due to the sale of their
pharmacies to CSV, although we also feel it could be is on account of woes TGT has faced
over the past years, namely the credit card breach, Canada exit, the transgender bathroom
boycott as well as their pharmaceutical transaction.

 8
This definitely raises the question of “If TGT is struggling during a booming economy, what will happen when the US is hit by a recession?” Table 4: Sales and Cost of Sales TGT (2017) Another point that should be taking into account are the online sales. In general, online retail has grown 2 fold over the past year. (US Census Bureau, 2017) This leads us to believe that consumers are turning to the internet to purchase goods as opposed to brick-and-mortar stores to meet their needs. Target boasted a 27% increase on digital sales, which is indeed quite impressive at its face value. That said, online sales only make up for 4.4% of total revenue in 2016 and 3.4% in 2015, and need to improve to actually keep the firm in line with the competition. As far as bottom line growth is concerned, if we turn our gaze to the EBIT leading up to net income, we can conclude it moves in parallel with top line growth, except for a loss in 2015 due to the Canadian exit. With reference to the EBIT for the past five years, we feel only 2016 and 2014 truly reflect the business earnings. Our reasoning behind this assumption is based on the fact that the other years had gains on sale, which was basically TGT liquidating assets, as we explain below. In December of 2015, TGT sold its pharmacy business to CVS for $1.9 billion, recognizing a gain of $620 billion and deferring income of $690 billion over the next 23 years. 9
On March 2013, TGT sold its entire US consumer credit card portfolio to realise a gain of $319 million. $In 2012, TGT had a gain on sale of 161 million which was the difference between bad debt expense and net write-offs. Moving down the sheet to Net Income, we find some rather volatile figures with TGT. This is mainly due to the failing Canadian business venture and its ultimate shut down in 2015. TGT decided to exit the prospect in Canada resulting in a pre-tax impairment loss of $5.1 billion. This came out to be a net loss of $4058 million after in discontinued operations. As a result, net income and EPS were greatly reduced in that fiscal year. Target’s 2016 dividend pay-out ratio was 49% – a 9% increase from 2015. The firm manages to increase this rate owing to their $10 billion stock repurchase plan passed by the board in 2012. Despite raising the ESP though becoming more efficient, we wonder if this is sustainable in the coming years, given a firm can only become so efficient. (Damodaran, Growth Rates and Terminal Value, 2017) $25.000,00 $20.000,00 $15.000,00 $ Millions $10.000,00 $5.000,00 $- $-5.000,00 2017-01 2016-01 2015-01 2014-01 2013-01 Gross margin $20.623,00 $21.788,00 $21.340,00 $21.240,00 $22.733,00 Operating income (EBIT) $4.969,00 $5.530,00 $4.535,00 $5.170,00 $5.740,00 Net income $2.737,00 $3.363,00 $-1.636,00 $1.971,00 $2.999,00 Table 5: TGT Revenue, EBIT and Net Income (2017) 10
3.2 Cash flows

$ millions 2016 2015 2014 2013 2012
Free Cash Flow
Operating cash flow $ 5,436.00 $5,958.00 $4,465.00 $ 6,520.00 $5,325.00
Capital expenditure $ 1,547.00 $1,438.00 $1,786.00 $ 1,886.00 $2,346.00
Free cash flow $ 3,889.00 $4,520.00 $2,679.00 $ 4,634.00 $2,979.00

Table 6: TGT Cash Flows (2017)

TGT generates positive free cash flow to provide for debt and dividend payments. We can also
see that capital expenditures increased in 2016 from the prior year because they increased
investments in existing stores, including remodels and guest experience enhancements. In
addition to that, these cash flows, combined with period year-end cash position, allowed TGT
to invest in the business, fund early debt retirement and maturities, pay dividends, and
repurchase shares under their share repurchase program. (Target Corp, 2017)

These increases were partially offset by continued efficiency gains in technology. Capital
expenditures decreased in 2015 from the prior year as TGT opened fewer large-format stores
and realized efficiency gains in technology, partially offset by increased guest experience and
supply chain investments. (Target Corp, 2017)

Table 7: TGT CapEx (2017)

 11
3.3 Balance sheet

With a few key ratios, we will carry out an analysis of the past five years on the balance sheet.

(TGT) BALANCE SHEET in millions 2016 2015 2014 2013 2012
Assets
Cash and cash equivalents $ 2,512.00 $ 4,046.00 $ 2,210.00 $ 670.00 $ 784.00
Credit card receivable, held for sale — — — — $ 5,841.00
Inventory $ 8,309.00 $ 8,601.00 $ 8,282.00 $ 8,278.00 $ 7,903.00
Assets of dicontinued operations $ 69.00 $ 322.00 $ 1,058.00 $ 793.00 —
Other current assets $ 1,100.00 $ 1,161.00 $ 2,074.00 $ 1,832.00 $ 1,860.00
Total current assets $ 11,990.00 $ 14,130.00 $ 13,624.00 $ 11,573.00 $ 16,388.00
Property and equipment
Land $ 6,106.00 $ 6,125.00 $ 6,127.00 $ 6,143.00 $ 6,206.00
Buildings and improvements $ 27,611.00 $ 27,059.00 $ 26,613.00 $ 25,984.00 $ 28,653.00

Fixtures and equipment $ 5,503.00 $ 5,347.00 $ 5,329.00 $ 5,199.00 $ 5,362.00
Computer hardware and software $ 2,651.00 $ 2,617.00 $ 2,552.00 $ 2,395.00 $ 2,567.00
Construction-in-progress $ 200.00 $ 315.00 $ 424.00 $ 757.00 $ 1,176.00
Accumulated depreciation $ -17,413.00 $ -16,246.00 $ -15,093.00 $ -14,066.00 $ -13,311.00
Property and equipment, net $ 24,658.00 $ 25,217.00 $ 25,952.00 $ 26,412.00 $ 30,653.00
Noncurrent assets of discontinued opererations $ 12.00 $ 75.00 $ 717.00 $ 5,461.00 —
Other nonurrent assets $ 771.00 $ 840.00 $ 879.00 $ 1,107.00 $ 1,122.00
Total assets $ 37,431.00 $ 40,262.00 $ 41,172.00 $ 44,553.00 $ 48,163.00
Liabilities and shareholders' investment
Accounts payable $ 7,252.00 $ 7,418.00 $ 7,759.00 $ 7,335.00 $ 7,056.00
Accrued and other current liabilities $ 3,737.00 $ 4,236.00 $ 3,783.00 $ 3,610.00 $ 3,981.00
Current portion of long-term debt and other borrowings $ 1,718.00 $ 815.00 $ 91.00 $ 1,143.00 $ 2,994.00
Liabilities of dicontinued operations $ 1.00 $ 153.00 $ 103.00 $ 689.00 —
Total current liabilities $ 12,708.00 $ 12,622.00 $ 11,736.00 $ 12,777.00 $ 14,031.00
Long-term debt and other borrowings $ 11,031.00 $ 11,945.00 $ 12,634.00 $ 11,429.00 $ 14,654.00
Deferred income taxes $ 861.00 $ 823.00 $ 1,160.00 $ 1,349.00 $ 1,311.00
Noncurrent liabilities of discontinued operations $ 18.00 $ 18.00 $ 193.00 $ 1,296.00 —
Other noncurrent liabilities $ 1,860.00 $ 1,897.00 $ 1,452.00 $ 1,471.00 $ 1,609.00
Total noncurrent liabilities $ 13,770.00 $ 14,683.00 $ 15,439.00 $ 15,545.00 $ 17,574.00
Shareholders' investment
Common stock $ 46.00 $ 50.00 $ 53.00 $ 53.00 $ 54.00
Additional paid-in capital $ 5,661.00 $ 5,348.00 $ 4,899.00 $ 4,470.00 $ 3,925.00
Retained earnings $ 5,884.00 $ 8,188.00 $ 9,644.00 $ 12,599.00 $ 13,155.00
Accumulated other comprehenis loss
Pension and other benefit liabilities $ -601.00 $ -588.00 $ -561.00 $ -422.00 $ -532.00
Currency translation adjustment and cash flow hedges $ -37.00 $ -41.00 $ -38.00 $ -469.00 $ -44.00
Total shareholders' investment $ 10,953.00 $ 12,957.00 $ 13,997.00 $ 16,231.00 $ 16,558.00
Total liabilities and shareholders' investment $ 37,431.00 $ 40,262.00 $ 41,172.00 $ 44,553.00 $ 48,163.00
Table 8: TGT Balance Sheet (2017)

At first glance, TGT is shrinking a palpable rate of 20% in the past 5 years. This is on account
of the liquidation of Canadian assets, the pharmaceutical transaction as well as falling revenues
in 2016.

 12
Liquidity Ratios Formula 2017 2016 2015 2014 2013
 Current Ratio 0.94 1.12 1.16 0.91 1.17

 Quick Ratio − 0.20 0.32 0.19 0.05 0.47

Table 9: Liquidity Ratios (2017)

The 2017 current ratio is less than 1 which implies TGT may have difficulties meeting its
short-term obligations with its current assets. This, however, is not the tantamount of a critical
problem. According to Gurufocus (2017)TGT may be able to borrow against its long-term
prospects to meet said current obligations.

If investors wish to take a more conservative approach towards assessing the firm’s liquidity,
the quick ratio excludes inventories from the calculation, which in turn relies solely on assets
that are cash or can be quickly converted to cash. TGT’s quick ratio has been quite volatile
over the past five years ending on a decline from .32 to 20. This could suggest it is over-
leveraged, struggling to maintain or grow sales, paying bills too quickly or collecting
receivables too slowly. (Gurufocus, 2017)

 Debt and Solvency Ratios Formula 2017 2016 2015 2014 2013
 Debt to Equity
 ℎ ℎ ′ 1.16 0.98 0.91 0.77 1.07
 Debt to Capital
 + 0.54 0.50 0.48 0.44 0.52
 Interest Coverage Ratio
 4.95 9.11 5.14 4.93 8.39
Table 10: Solvency Ratios (2017)

TGT’s debt to equity ratio is significantly higher that its preceding years which might indicate
it has been aggressive in financing its growth with debt. This could result in volatile earnings
as a result of the additional interest expense.

 13
Conclusions

Though TGT’s debt to capital ratio similar to its 2013 figure, it raises a few eyebrows as it has
increased 10% in the past four years to over 54%. This is quite high for any industry and, in
the hypothetical scenario that TGT continuous such an elevated rate as opposed to a cyclical
life that declines in the following years could mean trouble for the firm. As stated in
Damodaran’s online Corporate Finance course, we can usually understand how a company is
performing based on the financial decisions they take (Session 17: Optimal Financing Mix I -
The Trade Off, 2014). By looking at the following chart, we can draw a few conclusions:

Table 11: Financing Choices for Firms, Damodaran (2017)

In 2017, TGT had substantial declining revenues and earnings for a mature and stable company,
more than the past five years. In regards to its BV D/E ratio and BV D/C ratio are quite high
for a company that isn’t aggressively investing in a project. Furthermore, Damodaran claims
that the US Marginal Tax Rate will come down from 40% to 30%, which raises the question
as to what can they benefit from such a high debt ratio. Finally, TGT is repurchasing $10
billion in stock, but not as fast as they pay off debt, considering their increasing D/E ratio. All
these factors point to a Stage 5 Decline on the chart above.

 14
4. Valuation In the following sections, we will look at an in-depth approach towards analysing the intrinsic value of the firm Target Corp by means of Discounted Cash Flows. In doing so, we will also compute the necessary variables for risk and growth. 4.1 Discounted Cash Flows In the following section, we will apply the discounted cash flow method so as to analyse the intrinsic value of Target Corp. based upon its fundamentals. As regards Discounted Cash Flow (DCF) models, there are two we will have in consideration: Levered cash flows, also known as Free Cash Flows to Firm (FCFF) or unlevered free cash flows, or Free Cash Flow to Equity (FCFE) When it comes to computing discounted cash flows (DCF), analysts have the option of measuring them for two different entities of interest, this first one being for all claim holders of the firm by means of levered cash flows, also known as Free Cash Flows to Firm (FCFF). The second one, Free Cash Flow to Equity (FCFE) is simply for the equity investors. Theoretically, FCFE is potential dividends – cash left over after every conceivable need, such as non-equity claimholders, (debt and preferred stock) have been paid as well as any reinvestment required to sustain the firm’s assets and growth. (Damodaran, Session 23: FCFE, Dividends and Cash Balances, 2017)ç Advantages to DCF As mentioned before, DCF its intrinsic values of the firm into account which forces on to think of the underlying characteristics of a firm. DCF rely on cash flows, which are not subject to accountant or analyst bias, giving a more honest estimation. Non-economic factors and short-term market conditions have little influence over a DCF results; it is less exposed to market moods. Disadvantages DCF rely heavily on a growth rate and discount rate that are ultimately decided by the analyst. 15
Calculations of the firm value via DCF may be challenging if the firm in question doesn’t operate with 100% transparency. DCF are time consuming on account of the need of more inputs, as opposed to simple valuation approaches. There are tree variables that need to be addressed before one can venture off to calculating DCFs: risk, growth rate and capacity to generate cash flows. A few steps must be taken to calculate the variables with the aim of getting a more honest valuation. Implied Equity Risk Premium (IERP) Cost of debt ( ) Operating leases adjustments Risk (β) Weighted Average Cost of Capital (WACC) When using Target’s earnings, there are a few things that should be bore in mind. The firm’s historical earnings have been rather erratic over the past five years and this makes “plugging and chugging” the numbers a bit of a hassle, given that its non-linear. In addition, their operating incomes have been subject to volatility due to their pharmaceutical transaction as well as credit card sale and tax write-off. Although cases like these are grounds for normalising the past five years, the irregular movements have been a result of asset reductions and failed endeavours. Only the EBIT 2016 is the fruit of retail alone, which truly reflects Target’s ability to generate earnings. Therefore, I feel normalising the EBIT would not give an honest figure. With that in mind, we will only use the firm’s past 2 years to carry out the valuation. Another essential point that should be made before continuing is the adjustments that should be made. The firm’s leases should be taken into account owing to the fact that accountants tend to compute capital leases as debt and regard operating leases as an operating expense when computing operating income. Nevertheless, unlike dividends, which come from equity and are paid if the firm is willing or can, operating leases are contractual long-term obligations with tax-deductible interest payments, and therefore should be converted to debt. (Damodaran, Session 6: Measuring Relative Risk (Equity) & Cost of Debt, 2017) 16
4.2 Equity Risk Premium

Implied Equity Risk Premium (IERP): Based on how equity market is priced today and a simple
valuation model: the geography our firm is in. In TGT’s case, solely the US market.

IERP are updated and reflect was going on the market, as opposed to historical data, which
reflects just that, the past. Damodaran makes a point on how the IERP is a far better indicator
than an arithmetic or geometric calculation of historical data as it uses updated information
which reflects what is going on in the market as opposed to historical data which only looks
backwards. (Session 5: Implied Equity Risk Premiums, 2017) Taking this into consideration,
we will therefore follow his sound advice and use IERP to calculate our discounted cash flow.

Damodaran goes on to state that historical values can be misleading. For instance, if the risk
premium is too low, the value obtained will be lower than it should and the stock would be
undervalued. (2017)

Expected growth of S&P 500 in the next five years:

Top-down analysts estimate the five-year growth of earnings for S&P 500 to be 5.54%.
(Damodaran, Session 5: Implied Equity Risk Premiums, 2017) We are working with data from
January 2017 and Damodaran recommends using data from the beginning of the month in
question to calculate the implied risk premium. Therefore, we will proceed to do the same.
Fortunately for us, the Rf rate on the 1st of January coincides with the date of the valuation, 28th
of January– the closing day of Target’s fiscal year at 2.45%. (Damodaran, 2017)

Cash to investors S&P 500 with most recent data

Base year cash flow S&P 500 (most recent data)
Dividends TTM (Average TTM from 01/01/2017) $45.39
Buybacks TTM (01/01/2017) $63.28
Cash to investors $108.67

We assume that the pay-out ratio will remain stable until 2022, in other words, $108.67
growing at 5.54% a year. (Damodaran, Session 5: Implied Equity Risk Premiums, 2017)

 TTM 2018 2019 2020 2021 2022
Dividends and buybacks 108.67 114.69 121.75 127.75 134.82 142.28

 17
We calculate the Implied Expected Return on Stock (the discount rate) is found by applying the
latest S&P 500 closing value (2238.83 as of 01/01/2016) along with the pay-out ratios for the
next five years with the following discount formula:

 114.69 121.75 127.75 134.82 142.28 142.28 ∗ (1.0245)
2238.83 = + 2
 + 3
 + 4
 + 5
 +
 (1 + ) (1 + ) (1 + ) (1 + ) (1 + ) ( − .0245)(1 + )5

By using the Solver function on Microsoft Excel, we come up with the discount rate of 8.14%,
which is used in turn to calculate the Implied Equity Risk Premium as seen below.

r = Implied Expected Return on Stock = 8.14%

Risk Free Rate = T. Bond rate on 28/01/2016 = 2.45%

Implied Equity Risk Premium (IERP) = 8.14% - 2.45 % = 5.69%

4.3 Cost of Debt
In order to calculate the levered beta through this method proposed by Damodaran we derive
the cost of debt via the calculation of the firm’s Coverage Ratio and performing a synthetic
rating test with the spreadsheet provided on Damodaran’s website, as seen below. (Ratings,
Interest Coverage Ratios and Default Spread, 2017)

TGT $(millions) 2016
Adj. Operating income $5,019.77
Interest Expense $1,004.07
Coverage Ratio 4.55
 Interest coverage
 ratio
 > ≤ to Rating Spread
 3 4.249999 A3/A- 1.75%
Interest Coverage Ratio 4.55 → 4.25 5.499999 A2/A 1.25%
 5.5 6.499999 A1/A+ 1.10%
 6.5 8.499999 Aa2/AA 1.00%

The interest cover ratio of Target Corp, taking in consideration that leases have been added as
capital, is 4.55 which would place TGT in the A2/A rating with a spread of 1.25%.

 ( ) = + → 2.45 + 1.25 = .

 18
4.4 Operating Lease Adjustments

Operating lease expense in current year = $186.00 (Target Corp, 2016, p. 53)

Operating lease commitments for the following years below: (Target Corp, 2017, p. 47)

 Year Commitment
 1 $ 198.00
 2 $ 204.00
 3 $ 194.00
 4 $ 184.00
 5 $ 180.00
6 and beyond $2,916.00

 6
Number of years embedded in 6-year estimate: 1−5

Operating leases tend to be treated as operating expenses in calculating operating income.
However, as Damodaran points out, we can observe that in the 10-K they are contractual long-
term obligations. In turn, this directly affects our evaluation when calculating debt as it
increases the firm’s EBIT, interest expense, and book value of debt and equity. (Session 7: Cost
of Capital Closure and First Steps on Cash Flows, 2017)

Ignore tax savings from interest expenses. Why? We are discounting the Cost of Capital, which
is composed of Cost of Equity and After Tax Cost of Debt. In other words, our tax benefits
from debt are already in our Cost of Capital. Otherwise, we’d be double counting. Damodaran
claims that one out of every four evaluations he grades from his students has the mistake of
double counting tax benefits.

As Damodaran states: Operating Lease Expenses are treated as operating expenses in
computing operational income. In reality, operating lease expenses should be treated as
financial expenses, with the following adjustments to earnings and capital (Ratings, Interest
Coverage Ratios and Default Spread, 2017):

Debt value of Operating Leases = Operating lease commitments for the following years
discounted at the Pre-tax cost of Debt, which was calculated above to be the Rf of 2.45% +
Spread of 1.1 giving us the sum of 3.55%. With this discount rate, we can then proceed to
convert the firm’s operating leases into debt:

 19
Converting Operating Leases into debt
 Year Commitment Present Value
 1 $ 198.00 $ 190.94
 2 $ 204.00 $ 189.70
 3 $ 194.00 $ 173.97
 4 $ 184.00 $ 159.11
 5 $ 180.00 $ 150.10
6 and beyond $ 194.40 $ 1,840.78
Debt Value of leases = $ 2,704.59

Years 1-4 are calculated with the following equation.

(1 + − )

However, year 5 requires a slightly different equation:

 6
 (−)
 1 − (1 + − ) 1−5
 −
 5 ∗
 (1 + − )5

As the cost of debt has risen due to said addition to the book value cost of debt, there also must
be a counter-balancing asset with the same value. Taking this into account, the operating
income used in all the firm’s valuation calculations will be the adjusted operating income.

Our ERP reflects the geography of our business.

4.4 Systematic Risk - Unlevered Beta (β)
Beta reflects the business we are in; it measures the firm’s relative risk. Unfortunately,
calculating it isn’t as straightforward the Rf rate or Implied Equity Risk Premium. Firstly, there
are multifarious ways of deriving the beta of a firm, Regression Betas being the most popular.
However, regression figures can vary depending on the time taken into consideration. For
instance, retrieving β from Yahoo Finance for the 27th of January, 2017 will give you a figure
of .27, whereas Google Finance give a number closer to .6, given the former uses a base of
three years while the former opts for a five-year span. Nevertheless, regression betas can be
subject to too much noise as well as the fact that they are based on historical data. (Damodaran,
Session 6: Measuring Relative Risk (Equity) & Cost of Debt, 2017) We, on the other hand,
are looking towards the future and should therefore use the most up-to-date data available to
calculate β for our firm.

In lieu of calculating the covariance of historical stock prices with the S&P 500, Damodaran
considers the “Bottom Up Beta”, or “Levered Beta” as the best alternative for enterprise

 20
valuation. Basically, it is based on the average beta of a large number of firms in a given sector.
Target Corp. mainly operates in retail, though more specifically in five different sectors, as
seen in the chart below

One advantage to this method is that it allows us to use the law of large numbers to avoid a
skewed number if the standard deviation is too high. Furthermore, if the debt to equity ratio is
volatile, such as the case of Target over the last five years, a regression beta would be
negatively affected by those ups and downs, whereas the bottom up beta will be more accurate
due to the fact that Levered betas are affected by how much the firm borrows. In other words,
they reflect the firm’s financial leverage, while regression betas only reflect the past.
(Damodaran, Ten Questions about Bottom-up Betas, n.d.)

In order to calculate the levered beta of Target Corp, we must break down total sales for the
fiscal year of 2017, which were marked at 69,495 million dollars, into their respective field of
business so as to assign each one a weighted value. These weighted revenues are then
multiplied by the Sector Enterprise Value to Sales ratio (Damodaran, Revenue Multiples by
Sector (US), 2017) to give us the Estimated Value of each sector. The sum of said product is
used in calculating the weighted Beta of Firm (unlevered β), as shown in the chart below.

Business Revenues EV/Sales Estimated Value Unlevered Beta
Household Products $ 15,288.90 2.8041 $ 42,872.04 0.9150
Retail (Grocery and Food) $ 15,288.90 0.5907 $ 9,031.87 0.7742
Furn/Home Furnishings $ 13,204.05 1.2574 $ 16,602.53 1.0035
Apparel $ 13,899.00 1.9739 $ 27,434.81 0.8818
Retail (Special Lines) $ 11,814.15 1.1216 $ 13,250.20 0.8095
Company $ 69,495.00 $ 109,191.45 0.8956

The sum of the categorized unlevered betas and the respective weighted average of the
estimated value of each sector derives Target’s weighted unlevered beta of the firm (.8956).

In order to derive the Beta of Equity (levered β) of TGT, we use the following formula:

Levered bottom-up beta = ∗ ( + ( − ) ∗ ( )

As we mentioned earlier, operating expenses are considered debt and will be taken into account
when computing it. Considering that, the Market Value of Debt is the sum of the estimated
market value of straight debt and the value of debt in operating leases.

 21
Market Value of Debt

Despite having book value of debt for TGT, Damodaran points out that the market decides how
much one must pay for a transaction of stock and we therefore use the Market Value of Debt
to calculate the cost of capital with the formula given below ($ millions):

 1
 1−( )
 1 +
= ∗ [ ]

 ℎ
 +( ) +
 1 +

 = $ , .

Market Value of Equity

On January 27, 2017, Target Corp. had 556.16 million outstanding shares publically trading at
$63.70. The product of these two figures gives us Target’s Market Capitalization, which is the
tantamount of Market Value of Equity ($ millions).

 556.16 × $63.70 = $ , .

4.6 Levered β for Equity
By plugging in the following figures, in addition to the marginal tax rate of 30% for the USA
(KPMG, 2017), to the formula for levered betas, we come up with the following product:

 $21,276.78
 β = .90 ∗ (1 + (1 − .3) ∗ ( ) → =. .
 $35,427.39

Levered beta has a negative correlation with the tax rate, in other words, if taxes go down, betas
go up due to the fact that the government

Cost of Equity ( )

 = + ∗
 = 2.45% + 1.27 ∗ 5.69%
 = . %

 22
4.7 WACC With the following information above, we can now proceed to calculate our Weighted average cost of capital, or from here on out, WACC, we use the following formula: = ( ) + ( ) ∗ (1 − ) + + = = = = = $35,427.39 $21,276.78 = ∗ 9.69% + ∗ 3.7% ∗ (1 − 30%) $56,704.17 $56,704.17 = . % We have to use market value as opposed to weighted book value simply owing to the fact that share transactions are sold on the market. 4.8 Estimating Growth According to Damodaran, there are three ways to estimate growth: Historic growth Analyst Forecasts Fundamental growth: New investment growth and efficiency growth Historic growth can be measured by using revenues, EBITs or EPAs. At first glance, this method may seem like the best as uses old data of the firm’s history. That said, one must point out that it can be sensitive to different factors that punch holes in its credibility. To begin with, historic growth can be computed by finding the simple or compounded average. Of whatever it is you are computing. Damodaran points out in his 2017 Valuation course that the results can be rather skewed, especially the higher up the income statement the analyst goes and especially by the arithmetic averages as opposed to the geometric ones. (Growth Rates and Terminal Value, 2017) 23
Besides the dubious calculations these methods can give us, the estimation period is also a key factor when it comes to calculating historical averages. If we were to start our base year estimation on a bad one, the computed growth rates would come out far higher than they in fact are. Damodaran goes on with words of caution explaining if earnings shift from negative to positive values, growth rates become a meaningless indicator as well as the fact that said rates will go down as firms become larger. As far as manager/analyst forecasts are concerned, Damodaran claims they cannot be objective due to the fact that they work for the same 15-18 firms throughout their entire career. In other words, it’s in their best interest to say positive things about the firm even though it might be in dire financial straits. Fundamental/sustainable/Intrinsic growth comes from one of two places: The firm’s investment base, making new investments and earning a return on them. In order to use this method to predict our firm’s growth, one must consider how much they are investing and how well its being carried out. For a firm to grow overtime, it must reinvest its earnings back into the business in an efficient manner. One important thing that should be pointed out is the fact that we use market values debt ratios for WACC and market value debt to equity ratios for Levered Betas which tend to be quite accurate. However, when it comes to computing intrinsic growth, we use the firm’s ROC and ROE. Damodaran claims we are at accountant’s mercy as we must use the book value of debt and equity. The reason behind using the book values is we want to find how much as actually invested and how well it’s invested. Unfortunately, accountants can make discretionary calls that can skew the date we in fact need. The adjustments to Operating Lease Expenses made gives an illustration the differences that can arise. New investment growth As far as computing new investment growth are concerned, there are multiple ways of calculating it: Earnings per Share: Retention ratio * Return on Equity Net income from non-cash assets: Equity reinvestment rate * non-cash ROE Operating income: Reinvestment Rate * Return on Capital 24
Though all of these estimates are valid for a valuation, Damodaran claims computing the
growth rate via the operating income is the most consistent way of calculating it. After adjusting
the values with the changes from operating leases, we come up with the following products:
(Growth Rates and Terminal Value, 2017)

 ∗ (1 − )
 =

 $5,017.93 ∗ (1 − 32.69%)
 . % =
 $23,895

 . − . & + ∆
 =
 . ∗ (1 − )

 $1,733 − $2,435.07 + $199.39
 − . % =
 $5,017.93 ∗ (1 − 32.69%)

 ℎ = ∗

 − . % = 14.14% ∗ −14.88%

After trying both the EPS as well as the operating income method, we feel the latter gave a far
more realistic growth rate with our adjusted values (-2% as opposed to 14% via EPS) and
decided to use that in our valuation of Target.

Efficiency growth

To gage how well a firm is doing with its reinvesting, one can use the firm’s ROC by taking
the reinvestment rate and multiplying it by the ROC to get the Operating Income Expected
growth

Using efficiency growth as an estimate is ideal for relatively young firms with low ROC with
plenty of room for becoming more efficient. However, over time, this method of estimating
growth is finite, in other words, the likelihood of growth via efficiency peters out as the firm
matures. Moreover, Damodaran claims it is only adequate for businesses with a low ROC,

 25
e.g. 5%. Target is a firm that has been a publicly traded for a long time and, with this in mind, we can therefore assume it’s a mature company. Coupled with that notion, its ROC is hovering around 14.14%, which is rather high and makes the firm a highly inauspicious candidate for this estimation. Reinvestment rate Target has been remodelling their stores as well as investing in new technologies for e- commerce. As a result, we estimate their reinvestment rate will likely stay the same or increase in the years to come if they want to maintain their market share. 4.9 Terminal Value Target has been a publicly traded company since 1967 and in all likelihood, will be around for a long time. In order to calculate the value of a business such as Target, we are faced with the fact that it potentially has an infinite lifespan. The present value of the firm would be the present value of a never-ending life of cash flows and would use the following formula. =∞ = ∑ (1 + ) =1 Given that an infinite calculation is virtually impossible, we establish a growth period – five years in Target’s case – and estimate a terminal value so as to capture the value at the end of the period. = = ∑ + (1 + ) (1 + ) =1 Apropos of deriving the Terminal Value, Damodaran lists three distinct ways to do it (Damodaran, Growth Rates and Terminal Value, 2017): Liquid Value o At year 10, we shut down the business and liquidate all the assets, which would give us our terminal value. Multiple Approach o At year 10, we take EBIT/EBITDA/Net Income and apply a multiple other companies in the sector are trading at. A relative valuation that is common 26
practice of investment banks when evaluating companies. Damodaran feels this is a terrible way to value a company as it is being compared to a pricing. Stable Growth Model o Assume our cash flows were grow forever. Professor Damodaran claims the Stable Growth Model is by far the best for calculating the terminal value. This made our decision of which model to choose rather easy. When calculating our future cash flows and terminal value, the growth rate has to be capped and cannot be higher than the growth of the economy; despite having a booming company, it will eventually grow slower than the economy. Damodaran has his own theory that the Rf rate is ideal for this cap, owing to the fact that a mature company shouldn’t grow faster than the economy. Taking into account Target’s recent decline in revenues along with a more competitive market, we felt 2% would be ideal for a stable growth rate. For the growth to create value, the return on capital has to be greater than the cost of capital which is the case of TGT as the figures are 14.14% and 7.03%, respectively. This implies that Target has a competitive advantage to its rivals. Over time, the ROC should decrease to the Cost of Capital once it loses its competitive advantage, though we considered it will only decrease to 13% after year 10. As we mentioned in our SWOT analysis, these pros that are holding the ROC so high could be a result of the appeal Target has towards the US middle class as well as its name brands for clothing and accessories. 27
5. FCFF Results
 TGT (Jan 2017)
 The Story
Target is an mature retail company undergoing changes due to demand of e-commerce. Its primary competitive advantages lies in middle-class dicount retail and brand loyalty with a
secondary advantage in name brand items. In terms of investment needs and risk, it is mainly a brick and mortar retail company with intentions to expand in e-commerce while
remodeling its stores
 The Assumptions
 Base year Years 1-5 Years 6-10 After year 10 Link to story
Revenues $ 69,495 -2.10% 2.23% 2.00% Return to low growth after consolidation
Operating margin 7.22% 7.22% 6.45% 6.45% Margins will decline despite growth due to more competitive prices
Tax rate 32.69% 32.69% 30.00% 30.00% US marginal tax rate average
Reinvestment Sales to capital ratio = 2.10 RIR = 15.38% Invest like the weighted average of sectors
Return on capital 14.14% Marginal ROIC = 32.64% 13.00% In maturity,ROC will be Cost of Capital + 6%
Cost of capital 7.03% 7.03% 7.03% WACC won't change given it's at industry average
 FCFF TGT Base year 1 2 3 4 5 6 7 8 9 10 Terminal year
Revenue growth rate -2.10% -2.10% -2.10% -2.10% -2.10% -1.28% -0.46% 0.36% 1.18% 2.00% 2.00%
Revenues $ 69,495.00 $ 68,032.67 $ 66,601.11 $ 65,199.67 $ 63,827.72 $ 62,484.64 $ 61,682.72 $ 61,397.42 $ 61,617.41 $ 62,343.97 $ 63,590.85 $ 64,862.67
EBIT (Operating) margin 7.22% 7.15% 7.07% 6.99% 6.91% 6.84% 6.76% 6.68% 6.60% 6.53% 6.45% 6.45%
EBIT (Operating income) $ 5,019.77 $ 4,861.54 $ 4,707.74 $ 4,558.27 $ 4,413.00 $ 4,271.83 $ 4,169.31 $ 4,102.55 $ 4,069.61 $ 4,069.39 $ 4,101.61 $ 4,183.64
Tax rate 32.69% 32.69% 32.69% 32.69% 32.69% 32.69% 32.15% 31.61% 31.07% 30.54% 30.00% 30.00%
EBIT(1-t) $ 3,379.01 $ 3,272.50 $ 3,168.97 $ 3,068.35 $ 2,970.57 $ 2,875.54 $ 2,828.93 $ 2,805.67 $ 2,805.00 $ 2,826.71 $ 2,871.13 $ 2,928.55
 - Reinvestment $ (696.70) $ (682.04) $ (667.69) $ (653.64) $ (639.89) $ (382.06) $ (135.93) $ 104.81 $ 346.16 $ 594.05 $ 450.55
FCFF $ 3,969.20 $ 3,851.01 $ 3,736.04 $ 3,624.21 $ 3,515.42 $ 3,210.99 $ 2,941.60 $ 2,700.19 $ 2,480.55 $ 2,277.07 $ 2,478.00
Cost of capital 7.03% 7.03% 7.03% 7.03% 7.03% 7.03% 7.03% 7.03% 7.03% 7.03% 7.03%
Cumulated discount factor 0.9344 0.8730 0.8157 0.7622 0.7122 0.6654 0.6217 0.5809 0.5428 0.5072
PV(FCFF) $ 3,708.66 $ 3,362.05 $ 3,047.58 $ 2,762.30 $ 2,503.51 $ 2,136.61 $ 1,828.88 $ 1,568.59 $ 1,346.41 $ 1,154.84
Implied variables After year 10
Sales to capital ratio 2.10 2.10 2.10 2.10 2.10 2.10 2.10 2.10 2.10 2.10
Invested capital $ 23,895 $ 23,198 $ 22,516 $ 21,848 $ 21,195 $ 20,555 $ 20,173 $ 20,037 $ 20,141 $ 20,488 $ 21,082
ROIC 14.14% 14.11% 14.07% 14.04% 14.02% 13.99% 14.02% 14.00% 13.93% 13.80% 13.62% 13.00%
 Table 13: FCFF with Damodaran Ginzu Excel Spreadsheet (2017)

 28
Terminal cash flow $ 2,478.00
Terminal cost of capital 7.03%
Terminal value $ 49,312.65 Terminal cash flow / (Terminal WACC - Terminal growth rate)
PV(Terminal value) $ 25,009.35 Terninal value * Cumulated discount factor of year 10
PV (CF over next 10 years) $ 23,419.43 SUM PV (FCFF)
Value of operating assets = $ 48,428.78
- Debt $ 15,453.59
+ Cash $ 2,512.00
Value of equity $ 35,487.19
- Value of options $207.97
Value of equity in common stock $ 35,279.22
Number of shares 556.16
Estimated value /share $ 63.43
Price $ 63.70
Price as % of value 100.42%

Table 14: FFCF Results from Damodaran Ginzu Spreadsheet (2017)

According to our calculations, TGT stock as of 28th of January is ever so slightly overvalued
by a meagre $0.27. Despite TGT’s decline in growth, we estimate it will rise to 2.0%, bringing
it closer to the Rf rate of 2.45 in the future. Owing to a reduction in prices so as to remain
afloat in the market, we suspect its Return of Capital should come down to 13% after a 10-year
period. (Thomas, 2017)

 29
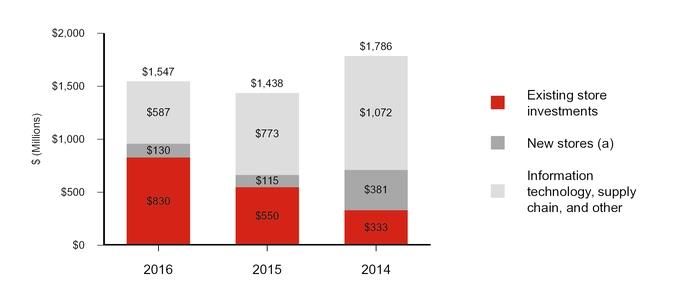
6. FCFE Results

Regarding the derivation of the FCFE, Damodaran offers a few simplifications to the original
formula on the left by consolidating a few items: (Session 23: FCFE, Dividends and Cash
Balances, 2017)

Table 15: FCFE Calculations, Damodaran (2017)

As this cash flow is for equity investors, we start with net income and add back depreciation
and amortization as they are a non-cash expense, followed by subtracting out preferred
dividends, cap ex and change in working capital, which will give us, as Warren Buffet refers
to as Owner’s Earnings. Basically it is what is left over after reinvestment. After we take debt
into account, we come up with our FCFE

An equity valuation is idea for firms that have stable leverage, regardless whether it is high or
not. A noteworthy observation of Target’s debt ratio has increased from 46% in 2013 to 54%
in 2016. As debt payments and issues are not factored in the cash flows to equity. Damodaran
heeds caution when using FCFE and unstable debt ratios. (2017) Therefore, we consider an
equity valuation might not be the proper method to value Target.

Nonetheless, we computed the following valuation with Damodaran’s FCFE Ginzu Valuation
excel sheet:

 30
You can also read