2020 Department of Neighborhood Development - Boston.gov
←
→
Page content transcription
If your browser does not render page correctly, please read the page content below
City of Boston - Department of
                   Neighborhood
                   Development

2020
                                   Zero Emission Buildings (ZEBs)
 OPTION 2

                   guidebook for

                               elton+hampton
City of Boston - DND           architects      Thornton Tomasetti   Bensonwood
OPTION 2

                             acknowledgments
                             City of Boston
                             Mayor Martin J. Walsh

                             Department of Neighborhood Development (DND)
                             Sheila Dillon - Chief of Housing and Director of Neighborhood Development
                             Jessica Boatright - Deputy Director, Neighborhood Housing Development
                             Jay Lee, AIA, NOMA - Assistant Director of Design Construction Openspace
                             John Feuerbach - Senior Development Officer
                             Carl Hedman - Fellow

                             Boston Planning and Development Agency (BPDA)
                             John Dalzell, AIA, LEED Fellow - Senior Architect for Sustainable Development

                             Boston Environment Department
                             Alison Brizius - Director of Climate and Environmental Planning

                             Placetailor - Integrated Development / Design / Build
                                     elton+hampton
                             Travis Anderson,  CPHC - Director of Design Studio, Project Lead
                             Colin Booth - Strategic Director
                                     architects
                             Michelangelo  Latona, AIA - Architect
                             Evan Smith - Director of Operations
           elton+hampton     Jesse Ware - Construction Project Manager
           architects    Elton Hampton Architects - Affordable Housing
                             Nick Elton, AIA - Principal

                             Thornton Tomasetti - Energy Modeling / Data Analysis
                             Colin Schless, CPHC, LEED AP BD+C - Vice President

                             Bensonwood - Prefabricated Building Systems
                             Chris Carbone, PE - Company Steward / Engineer

                               Thank you to the stakeholders who attended
                               workshops and provided feedback and insights
                               for this study.

                                                                                                   acknowledgments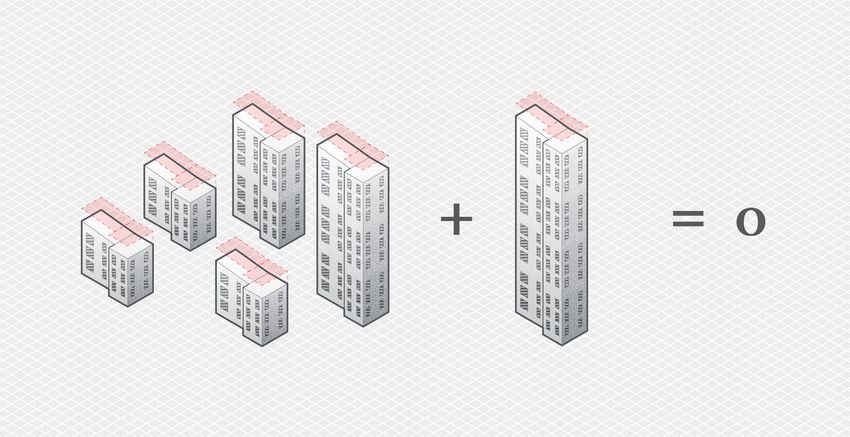
contents
1 | introduction               2 | best practices            3 | typologies                 4 | appendices

a | executive summary 5        a | what is a ZEB?      24    a | introduction		        36   a | sources
                                                                                                and resources          74
b | how to                     b | key strategies       25   b | small multifamily     37
   use this guidebook 6           massing                       case study                  b | variations		           75
                                  orientation                   recommendations
c | carbon 101		         7        impacts of unit density                                   c | tools for
    glossary                      glazing percentages        c | 3 story multifamily   46       embodied carbon        76
    introduction to carbon        thermal bridging               case study
    emissions                       and r-value                  recommendations            d| about this guide        78
    carbon reduction path         air tightness
                                  ventilation                d | 4 - 5 story
d | methodology           13      assembly summary              multifamily		          55
   context                                                      case study
   building elements                                            recommendations
     analyzed
   typologies                                                e | 6 story multifamily 64
   materials                                                     case study
   parametric energy                                             recommendations
     modeling
   building v portfolio
   cost per category
   modeled results

                                                                                                                  table of contents   3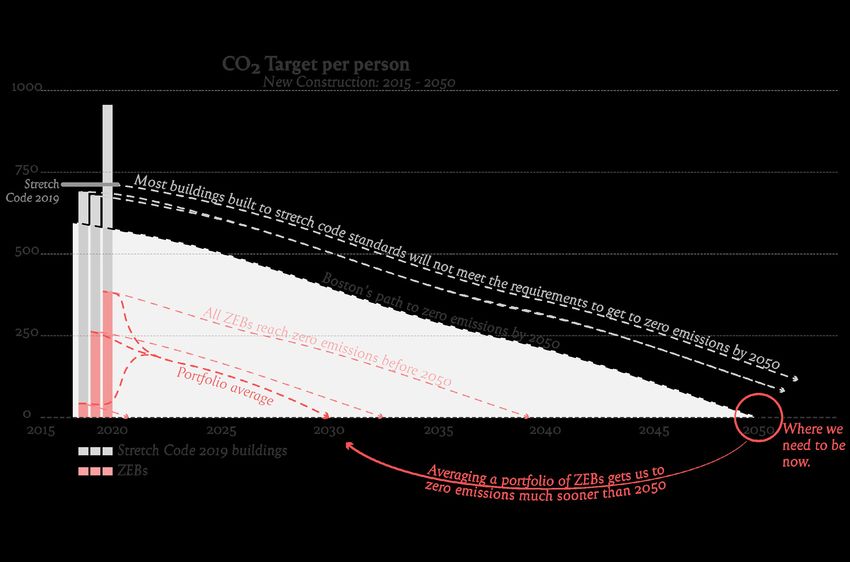
1|                introduction
a | executive summary

b | how to use this guidebook

c | carbon 101

d | methodology

                                 introduction   4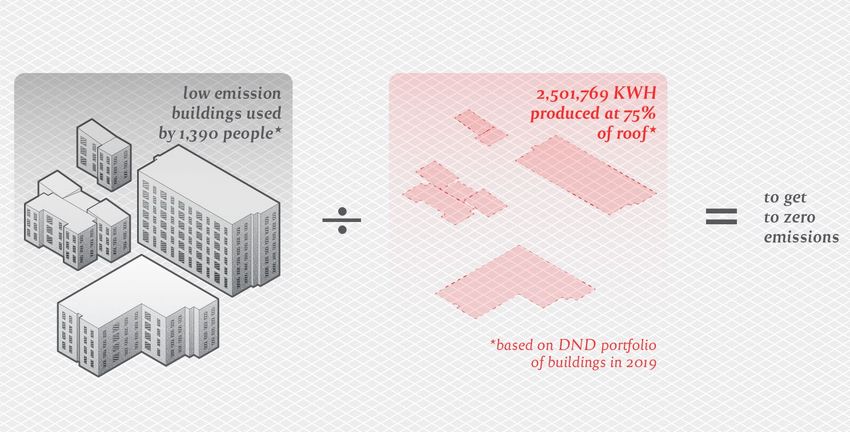
executive summary

     In 2017 Mayor Martin J. Walsh set      cutting edge parametric energy
     a goal of Carbon Neutrality in the     modeling techniques, and incorpo-     This guidebook aims to provide
     City of Boston by 2050. The 2019       rate cost data from numerous Zero     developers, designers, and builders
     Carbon Free Boston Summary             Net Energy and Passive House          with a resource to set them on a
     Report outlined the reasoning,         projects in Boston.                   path to Zero Emission Buildings.
     framework, and broad strategies
     for how the City must lead the         The team discovered that there        While performed completely
     way to reduce carbon emissions         is little-to-no cost increase         independently, this study produced
     as soon as possible to do its part     for building to Zero Emission         results that align with similar
     in avoiding the worst effects of       Building (ZEB) standards. Total       studies performed by the United
     climate change.                        construction cost increases range     Nations Intergovernmental Panel
                                            from 2.5% or less before rebates      on Climate Change (UN IPCC),
     This study is the result of Boston’s   and incentives are considered.        The Rocky Mountain Institute           “The GHG emissions from the use of
                                                                                                                         electricity, heating oil, natural gas, and
     Department of Neighborhood             The rebates and incentives cur-       (RMI), and the Massachusetts
                                                                                                                         steam in Boston’s buildings account for
     Development (DND) taking               rently available have the potential   chapter of the United States           more than two-thirds of the City’s total
     up Mayor Walsh’s challenge to          to make these buildings less ex-      Green Building Council (USGBC).        emissions...
     answer the question, “can we make      pensive to build, with additional     Specifically, window performance,
                                                                                                                         Boston is in the midst of a major building
     DND’s portfolio of new construc-       long-term operational savings.        window-to-wall ratio, and air tight-
                                                                                                                         boom, adding 4 million to 6 million square
     tion affordable housing carbon                                               ness are key items for extra care.     feet per year of new building space since
     neutral?”                             Many of the criteria for these                                                2014. Advancing new buildings to high
                                           guidelines align with the devel-                                              energy performance standards, including
                                                                                                                         net-zero or net-positive, will result in fewer
     The answer is a resounding YES, we opment of stretch energy codes
                                                                                                                         emissions and prevent the need for future
     can and we can NOW.                   and standard best building prac-                                              retrofits in these buildings…
                                           tices. The study highlighted that
     In this study the team identified     careful consideration to just a                                               Timing is a key driver of the magnitude of
                                                                                                                         emission reductions in new buildings. For
     performance criteria - tailored to    few areas (some at low-to-zero
                                                                                                                         example, the implementation of a net-zero
     Boston’s specific climate, portfolio, cost) provided the most import-                                               policy for all new buildings in 2030 reduces
     density, and resiliency goals - based ant impact on the performance of                                              cumulative emissions by 17 percent. Earlier
     upon proven, cost-effective design ZEBs. Specifically, window per-                                                  implementation of the same policy reduces
                                                                                                                         emissions by an additional 25 percent. This
     and construction strategies for       formance, window-to-wall ratio,
                                                                                                                         is a consistent theme that emerges from
     buildings that are zero carbon,       and air tightness are key items for                                           our analysis in every sector: early action
     healthier for occupants, and cost     extra care.

1a
                                                                                                                         builds on itself and makes it easier to reach
     less to operate. The resulting                                                                                      the carbon-neutral target.”
     recommendations vary between
                                                                                                                         - Carbon Free Boston Summary Report
     building typologies, are based upon                                                                                 2019 p.34, 39

                                                                                                                                                                          5
     executive summary

 introduction
how to use this guidebook

     This guidebook is designed to be
     accessible to all parties involved in
     the planning, design, & construc-
     tion of affordable housing in the
     City of Boston and a comprehen-
     sive companion to the forthcoming
     DND ZEB design and construction
     requirements.

     The guidebook is intended to
     bridge the gaps between building
     scientists, engineers, energy
     consultants, architects and
     builders. It captures decades of
     collective experience into a how-to
     instruction manual of process,
     standards, considerations, means
     and methods for realizing a new
     generation of “Future Housing”.
     With this, Boston continues on its
     path to carbon neutrality.

     Developers, designers, and
     builders can use this guidebook to
     reference the specific ZEB require-
     ments for each typology, check for
     allowable variations and trade-offs
     of those requirements, and utilize
     the case studies as a reference
     for how real ZEB projects have
     achieved this standard at no net or

1b
     minimal cost increase.

                                             6
     how to use this guidebook

 introduction
carbon 101

       glossary of terms and abbreviations

                    TYPOLOGIES                                              manager or financier
                     Small Multifamily - approximately 1 - 9 units          (DND) - Department of Neighborhood
                     3 Story Multifamily - approximately 9 - 30 units       Development (Boston)
                     4-5 Story Multifamily - approximately 30 - 50 units    (DOER) - Department Of Energy Resources
                     6 Story Multifamily - more than 50 units               (Massachusetts)
                                                                            E+ - A City of Boston program developing energy
                                                                            positive LEED Platinum residential buildings
                    (ACH50) - Air Changes per Hour at 50 pascals of         (EER) - Energy Efficiency Ratio
                    net volume                                              (EF) - Energy Factor
                    (ASHRAE) - American Society of Heating and Air-         Embodied Carbon - the amount of carbon emissions
                    Conditioning Engineers                                  produced in the manufacture of a material, appliance,
                    (BPDA) - Boston Planning and Development Agency         or assembly
                    (BTU) - British Thermal Unit                            (ERV) - Energy Recovery Ventilator
                    Builder - A member of the build-team for a project,     (EUI) - Energy Use Intensity
                    whether general contractor or sub-contractor            (GC) - General Contractor
                    Carbon Footprint - The total amount of Green House      (GHG) - Green House Gas
                    Gases to directly and indirectly support human          (HDD) - Heating Degree Day
                    activity. Equivalent tons of Caron Dioxide              (HERS) - Home Energy Rating System
                    (CDD) - Cooling Degree Day                              (HRV) - Heat Recovery Ventilator
                    (CFA) - Conditioned Floor Area                          (HVAC) - Heating Ventilation and Air-conditioning
                    (CFM50)- Cubic Feet per Minute at 50 pascals of         (IAQ) - Indoor Air Quality
                    gross surface area                                      (IBC) - International Building Code
                    (CO2e) - Carbon Dioxide Equivalent or metric tons       (IEA) - International Energy Agency
                    of greenhouse gases in a common unit which have a       (IECC) - International Energy Conservation Code
                    global warming impact.                                  (IPCC) - Intergovernmental Panel on Climate Change
                    Climate Change - An increase in the earth’s surface     Mass CEC - Massachusetts Clean Energy Center
                    temperature over time that is attributed to increased   Mass Save - Coalition of Massachusetts utility pro-
                    levels of carbon dioxide in the atmosphere.             viders with the goal of aiding consumers with energy
                    (CMR) - Code of Massachusetts Regulations               efficient goals
                    (COP) - Coefficient Of Performance                      Net-positive - A building that produces more energy
                    Designer - A member of the design-team for a            than it consumes, either on-site or otherwise

1c
                    project, whether architect or consultant/engineer       Net-zero - A building that produces or offsets as
                    Developer - A member of the development-team            much energy as it consumes
                    for a project, whether the owner or owner’s project

                                                                                                                                    7
     carbon 101

 introduction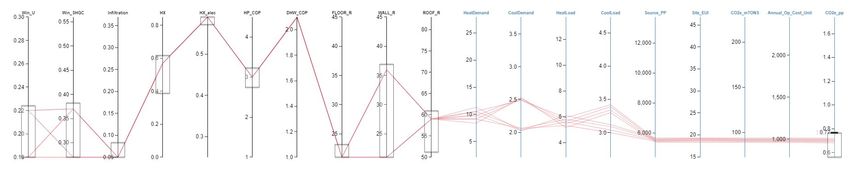
carbon 101

       glossary of terms and abbreviations continued

                    Parametric Energy Modeling - Computer program-
                    ming script that allows the designer to subject
                    uncertain situations to the rigors of a predefined and
                    proven mathematical model.
                    Passive House - A building standard that is truly
                    energy efficient, comfortable, affordable and ecologi-
                    cal at the same time.
                    (PHPP) - Passive House Planning Package - building
                    performance modeling tool
                    (PV) - Photovoltaic
                    (QA) - Quality Assurance
                    (QC) - Quality Control
                    R-value - The capacity of an insulating material to
                    resist heat flow. The higher the R-value, the greater
                    the insulating power.
                    Resiliency - The ability [of Buildings] to withstand or
                    adapt to disruptive events.
                    (RH) Relative Humidity
                    (SEER) - Seasonal Energy Efficiency Ratio
                    (SHGC) - Solar Heat Gain Coefficient
                    Stretch Code - Emphasizes energy performance, as
                    opposed to prescriptive requirements, is designed
                    to result in cost-effective construction that is more
                    energy efficient than that built to the “base” energy
                    code
                    (USGBC) - United States Green Building Council
                    U-value - measure of heat transmission through a
                    building part (e.g. window u-value) higher = more
                    heat transmission
                    WUFI-Plus - Energy modeling software, heat and
                    moisture simulation tool

1c
                    (ZEB) - Zero Emission Building
                    (ZNE) - Zero Net Energy

                                                                              8
     carbon 101

 introduction
introduction to carbon
dioxide
A colorless, odorless gas produced
by burning carbon and organic
compounds and by respiration. It
is naturally present in air (about
0.03 percent) and is absorbed by
plants in photosynthesis. When
the amount of CO2e that is
emitted can no longer be absorbed
naturally by the biological cycle
it is trapped in the atmosphere.
This trapped CO2 (also known
as GHGs) is contributing to an
increase in temperatures across the
planet.
As of 2017 CO2 accounted for
81% of the Green House Gas
(GHG) emissions and was driven
in large part by the burning of
fossil fuels attributed to human
activity. In Boston, energy use in
the building sector dominates,
accounting for 71% of total emis-
sions (4.5 MtCO2e). Within
the building sector commercial, We are now at an imbalance. 1. Increase efficiency.
industrial, and large residential 2. Convert nearly everything that
buildings generated 52% of emis- As a result the City of Boston has runs on fossil fuels to run on
sions (3.3 MtCO2e), while small outlined three broad strategies to electricity.
residential buildings account for reduce demand for energy in the 3. Buy 100% clean energy.
19% of building emissions (1.2 housing sector.
MtCO2e).* (source: Boston GHG
inventory 2005-2016)
1c carbon 101
introduction
9emissions
The City of Boston anticipates
a population increase of 75,000
within the next ten years reaching
a total population of 760,000
by 2030, according to a recent
study by the Boston Planning and
Development Agency. This growth
corresponds to an average of 400
sf per person or an additional
30,000,000 sf of residential floor
area within the next ten years.
DND recognizes as the city grows
and there is a need to produce
more housing, it is very important
to take a closer look at reducing
carbon emissions across the
building sector and more specifi-
cally in residential construction.
According to a 2015 report by the
Passive House Institute US and
the US Department of Energy
titled Climate Specific Passive
reducing carbon emissions to zero total emissions per person per year,
House Building Standards in
in 2050. In both studies, a budget or approximately 2.85/tons/person
order to limit a 2°C global tem-
of 2.2-3.8 tons/year would repre- annually. Significant reductions
perature rise set forth by the IPCC
sent the total emissions assigned in the tons of Co2/person used
(International Panel on Climate
to each person. annually in buildings is required to
Change) and the Kyoto Protocol,
meet the 2050 carbon reduction
an annual energy or carbon per
As of 2018, the City of Boston goals in the building sector.
person budget is needed.
stands at a total emissions of
9.5 tons/person/year, still well Therefore the City of Boston
This idea of equally allocating
1c
above the 2050 target. The has set a series of objectives to
emissions to each living person
building sector in Boston currently put buildings on a path to zero
globally assumes a linear path in
accounts for 28%–33% of the emissions.
10
carbon 101
introductioncarbon reduction path - 2050 objectives
- Meet 2050 Zero Emission Building Standards today.
Avoid the need to retrofit buildings to meet 2050
guidelines later, saving money and resources long
term.
- All new construction buildings to be net zero by
2030 or sooner.
- Develop a simple and cost effective performance
measure for residential buildings to reach this goal.
- Outline a performance standard amongst four DND
specified typologies.
1. Small Multifamily
2. 3 Story Multifamily
3. 4 - 5 Story Multifamily
4. 6 Story Multifamily
1c carbon 101
introduction
11The following study determined that buildings designed to a target In cases where the building is limited due to site constraints this target
budget of 0.7-1.1 tons/person/year, or 1800kWh person annually, will can be further augmented with off-site carbon reductions. It is also
achieve the zero emissions goals ahead of 2050. This budget target estimated that by 2050 future clean grid technology will further help the
aligns with 2050 goals set forth by IEA and DOE/PHIUS for carbon carbon budget per person on an annual basis.
reduction in the residential sector.
0.77 tons /
CO2e /person
1c carbon 101
introduction
12methodology
context, building elements analyzed, typologies, and materials
context typologies materials
The City of Boston’s Climate Working in conjunction with Though the study team’s area of
Action Plan calls for the con- Department of Neighborhood focus was on the major assemblies
struction of new buildings to be Development, the team analyzed and elements of construction,
zero carbon by 2030. Leading 4 typologies based on current and trends in wood construction and
by example, the Department of projected projects in the DND the use of prefabricated systems,
Neighborhood Development portfolio. they were very aware of the life
seeks to establish zero emission cycle analysis of materials and
standards starting in 2020 - greatly The following were used to the research surrounding the
reducing the amount of emissions develop the prescriptive path: embodied carbon in materials .
in the small residential to medium This guidebook delves into best
residential building sector. Small multifamily (6+ units) practice assemblies with embodied
Massachusetts Stretch Code - 3 story multifamily (14+ units) carbon of the materials in mind,
2015 IECC acts as the baseline 4 - 5 story multifamily (40+ units) and understands its growing
criteria for this study. Other 6 story multifamily (50+ units) traction within the building
metrics considered are Passive industry, but does not specifically
House United States standards Note: This study focuses on residential study embodied carbon.
units only - commercial space has been
and ASHRAE 90.1. excluded at this time.
Toxicity and health impacts of
building elements analyzed materials is also a critically import-
The assembly components below were selected ant issue. Therefore the team
because they have the greatest impact on a building’s recommended avoiding the use
EUI - Energy Use Intensity - the building’s annual of foams - XPS, EPS and Poly-Iso
energy use relative to its gross square footage. in all major assemblies, and
- Window U-value wherever possible.
- Window Solar Heat Gain Coefficient
- Air Tightness (ach50/sf) Note: The study team found that there
- Heat recovery ventilation efficiency was a role for ZEB in creating local jobs and
training opportunities through workforce
- Domestic Hot Water System Efficiency (COP) initiatives. Advanced construction tech-
- Heating + Cooling System Efficiency (COP) niques with emerging technologies, such as
- Roof R-Value heavy timber and panelized systems, will
- Wall R- Value contribute to job growth and education.
1d
Labor commuting is also a highly signif-
- Floor R- Value icant factor in total carbon footprint of
- Photovoltaics - Percentage of Roof Area construction. Therefore, local labor can
play a huge role in carbon reductions.
13
methodology
introductionparametric energy modeling
To perform the analysis the team utilized parametric energy modeling, cooling systems, and domestic hot water systems. The large-batch
where many combinations of building approaches and features are optimization studies used WUFI-Plus from Fraunhoffer IBP, with the
rapidly and automatically tested by computer programs in order to help results post-processed and analyzed using Thornton Tomasetti’s Design
find the most energy-efficient and cost-effective combined strategies. Explorer, an interactive and multi-dimensional data visualization tool
Each typology was simulated with approximately 38,000 combinations that allowed the team to filter iterations for specific outcomes such as
of variables including envelope air-tightness, opaque envelope R-Values, C02e footprint per person and operational utility cost.
window and glazing properties, ventilation system alternatives, heating/
Each vertical line on the left in the image above represents a building characteristic Each vertical line on the right in the image above represents building energy use and
(i.e. window u-value, air-tightness, heat pump C.O.P., wall R-value etc.) CO2 emission based on each building characteristic (i.e. heat demand, cooling de-
mand, site EUI, and CO2e per person)
1d
In the image above the CO2 emission for the building has been set to the 0.77 Co2e per person target. The matrix above is generated and a series of building characteristics
are selected based on cost and performance. The end result is the optimimal combination of building charaterisics to produce a Zero Emission Building.
14
methodology
introductionbuilding v portfolio
building by building approach
The first batch of simulations
looked at each building individu-
on-site renewables off-site
ally and modeled assuming that
the total energy demand of the
building was offset by on-site
renewable energy sources. Prior to
modeling the assemblies, it was
assumed that the larger building
would perform better and the
density of units would contribute
to better performance overall.
high-performance pretty high - a bit high-performance a dash high-
on-site energy performance on-site energy performance on-site
However, the modeled assemblies
production on-site energy production covers 75% energy production
heavily favored the smaller typol-
exceeds energy production meets of energy demand does not meet energy
ogies. The larger typologies (5+
demand energy demand demand, requires
stories) simply had a larger energy
off-site energy
demand due in part to the number
production
of units (occupants). The roof
areas are also not large enough to
accommodate a significant enough The building by building approach Therefore, as shown in the diagram The team found that the need to
photo voltaic (PV) array to produce also supported the common notion above, the building by building have significant variation in the as-
the overall energy needs of the that increasing the insulating approach favored the smaller semblies between small and mid-
building. values of the assemblies, especially typologies which did not require sized buildings was also a major
in the 5+ story buildings, would the building envelope criteria to be weakness of this approach.
The first batch of simulations eventually produce a building that as strict as the building envelope
found that as the energy demand would meet the zero emission goal. criteria of the 5+ story building.
of the building exceeds the roof/ Modeling proved that this was not
PV array area and thus PV energy the case. Performance would be
production capacity, the building slightly better overall but the slight
1d
tips into not being able to offset all improvement did not justify the
its energy needs on-site. increased costs.
15
methodology
introductionthe portfolio approach
led to this outcome:
1,800 kWh
per person
buildings can which can be provided
building v portfolio or
consume by rooftop renewables
0.77 tons/CO2e
portfolio approach per person
The second batch optimization
rethought the building by building
approach. A particular goal of this
approach was to try to normalize
the building criteria across typolo-
gies. Instead of one building,this
batch analyzed a group of buildings
or “a portfolio” of projects.
DND provided a list of projects
expected to start construction by
2019. The portfolio consisted of
approximately 4-6 projects from
each typology. After estimating
the total number of occupants,
roof area, and the total energy pro-
duction which could be generated,
the optimization was used to see if
the per person energy production
could form the basis of zero emis- This aligned directly with the 2050 Of particular interest is to encour- The DND portfolio allows for
sions design criteria. goals set forth by IEA and DOE/ age local developers and property a 0.77 Co2e per person budget
PHIUS for carbon reduction. owners to apply the “portfolio” which equals 1800 kWh per
As you see in the diagram to the approach to a zero-emissions port- person of on-site energy use.
right, smaller buildings that can The same approach could also be folio of their own, including new
reach zero emissions and produce applied to an entire neighborhood, and existing buildings.
excess energy support larger city or region. From an urban
buildings that use more energy. perspective, this could assist city As seen in section 3, the portfolio
The portfolio approach budgeted planners in determining zero emis- approach allows both the smaller
Carbon per Person as an allowance sions districts. typologies and larger typologies to
1d
of 0.77 Co2e. follow an analogous path to reach
zero emissions through a carbon
per person budget.
16
methodology
introductionbuilding v portfolio
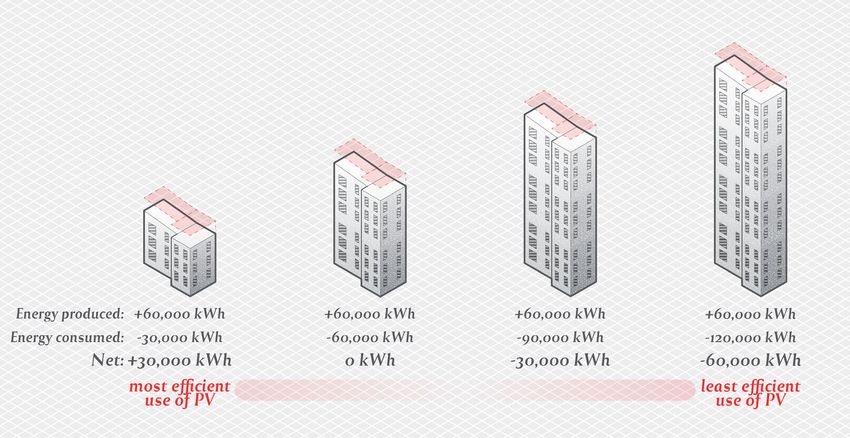
Further supporting the portfolio
approach to reaching zero emis-
sions, the top diagram shows
how important it is for smaller
buildings to actually be net energy
positive. They generate excess
power that larger buildings can
not. The lower diagram illustrates
the portfolio concept. Not all
the buildings need to be Zero
Emissions, but as a community of
buildings are measured together
the same outcome is reached.
Applying this approach of a carbon
budget per person to existing
buildings would be the first step in
generating a Zero Emissions plan
for the City as a whole.
In cities like Boston with dense
housing, there is more opportu-
nity for increasing efficiency when
accounting for the entire urban
fabric. Zero Emission Buildings are
a key component to implementing
a clean energy future.
1d methodology
introduction
17building elements - cost analysis
Overall performance was considered in direct relation - Rebates and Incentives - Current incentives
to costs. The recommended assemblies and systems and rebates were excluded from the cost analysis.
found in the case studies are modeled to be the most Additional rebates are available through Mass Save
cost efficient for each typology. and Mass CEC.
Note: Alternative approaches can be found in the appendix. - Windows - Cost per unit, U- value, SHGC
Typologies referenced there typically result in a higher building
Note: Cost is driven by economies of scale on a product basis.
performance, often with a higher overall project cost.
- Building Element Pricing - includes material and - Air tightness - Cost per Project (includes labor +
labor costs. materials) Airtightness plays an essential role in terms
of overall building and insulation performance - see table
- Materials - Boston metro area 2019 pricing. below.
Material pricing is set either as Square Foot cost or
Per Unit cost
- Labor - labor rates where applied were set to a flat Note: Current MA CMR requires all new construction to have
burden rate per category air barriers and weather resistant barriers. As such the
associated costs in achieving Zero Emission Building targets are
- Systems - system costs are per living unit / per based upon additional QA/QC at the Project Management
square foot (ie - a six unit building would include 6 level. A “leaky” R-30 wall WILL NOT perform the same as an air
systems). The team established this criteria to enable tight R30 wall.
direct comparative analysis amongst typologies.
Stretch code systems account for efficient gas boilers/
furnaces, duct work, and a chiller for cooling. ZEB
systems account for high efficiency air source heat
pump systems with electric resistance aux. heat. The
ZEB system cost is limited to a ductless system. The
project team acknowledges future technology will
Wall Framing Continuous Airtightness Heat Demand
impact performance criteria, increasing overall system
Insulation Insulation (ACH 050) (kBTU/sf*yr)
performance.
2x6 w/ R-21 R-8 10 increased 35 reduced
- Renewable - Photovoltaic Costs: Turnkey
2x6 w/ R-21 R-8 3 (code) air 24 heat
Photovoltaic system costs do not the consider state tightness demand
2x6 w/ R-21 R-8 1 18
and federal incentives available in Massachusetts.
Renewable cost burdens can range from 0-100% de-
pending upon the financial approach. Please refer to The table above highlights a study done by 475 Performance Supply.
the Solar Massachusetts Renewable Target Program Using the Passive House energy model, PHPP, the study displayed an
1d
overall reduction in heating demand by increasing air tightness overall.
offered through DOER or similar programs offered by
Mass CEC and Mass Save for more guidance.
18
methodology
introductionbuilding elements - cost analysis
- Heat Recovery Ventilation - - Heating Systems - Per project - Walls R-Value - per Square Foot - Education and Labor -
Per project System design is specific to each Pricing includes material cost and QA/QC and commissioning requires
The study indicated that whole individual project. Case studies labor cost. Case studies indicated that training for Construction and Project
system efficiency increases had very little indicated that through a confluence of when estimating a double stud wall vs. Managers.
impact in terms of overall project costs. avoided costs (eliminating natural gas continuous exterior insulation the labor Provide ZEB building operation training
Case studies indicated that the added service and distribution) there was a was equal or less. for facility managers and occupants.
overall cost could be avoided elsewhere. decrease in overall project by shifting to - Floor R-Value - per Square Foot Explore opportunities to integrate Zero
an all electric building. Pricing includes material cost and Emission Building training into the City
- Domestic Hot Water Systems - of Boston’s workforce development
Per unit - Roof R-Value - per Square Foot labor cost.
Pricing includes material cost and programs.
Pricing includes material cost and labor
labor cost.
cost.
1d methodology
introduction
19building elements and operation - cost analysis
Small 3 Story 4 - 5 Story 6 Story
Multifamily Multifamily Multifamily Multifamily
6 unit bldg 14 unit bldg 50 unit bldg 51 unit bldg
Stretch Code Baseline Building
Stretch Code EUI (kBtu/sf/yr) 24 34.2 25.5 26.8
CO2e / per person baseline Stretch Code (mTons/kwh) 0.86 1.19 0.8 0.82
Annual Utility Cost per living unit - 1.52 (dollar / therm)** $1,820 $1,211 $1,368 $1,481
Stretch Code Baseline Build cost ($)* $358,766 $387,988 $1,298,574 $1,464,522
Zero Emission Building
ZEB EUI (kBtu/sf/yr) 18 26 21 18
CO2e / per person ZEB (mTons/kwh) 0.77 0.77 0.77 0.77
Annual Operational Cost per Unit ZEB - 22.61 (cents/kWh) $1,450 $1,200 $1,100 $1,100
ZEB Baseline build cost ($)* $361,913 $390,312 $1,310,419 $1,496,920
Stretch Code vs ZEB
Incremental Cost difference to ZEB ($) Total project cost $3,148 $2,324 $11,845 $32,398
Incremental Cost to ZEB (% increase) 0.88% 0.60% 0.91% 2.21%
Incremental change per person CO2e ZEB (% decrease) -25% -24% -18% -33%
Incremental Cost difference to ZEB (% decrease) operational cost -20% -1% -20% -26%
Renewables - Rebates and Incentives are not included
Solar PV size (kW) - 75% of Roof Areas 37 KW 40 KW 156 KW 104 KW
PV cost installed (Average $3.16 / watt) $117,000 $126,000 $492,000 $328,000
* Baseline cost is per modeled building component only (U-value, SHGC, Air-Tightness, Heat Recovery efficiency, Domestic Hot Water, Heating, Roof R, Walls R, Floor R)
** Stretch code operating cost - Operating costs based on 2018/2019 and 2019/2020 Mass DOER heating cost data
Plug loads were normalized based on DND occupant criteria (2 people per bedroom) for both Stretch code and ZEB operating costs
1d
How to use this table:
Modeled categories are compared across each typology using stretch code as a baseline standard for energy use, carbon emissions and construction cost. The
table highlights the benefits associated with Zero Emissions Buildings, energy and carbon reductions. The table also displays the incremental change associated
with operational cost, construction cost and carbon reduction for the modeled building elements.
20
methodology
introductionmodeled results
note: See section 3 for building element recommendations per typology.
small multifamily 3 story multifamily
Components Stretch Code 2019 Zero Emission Building Components Stretch Code 2019 Zero Emission Building
Window Window
0.3 0.22 min. 0.3 0.22 min.
U-value U-value
Window Window
no requirement 0.3 min. no requirement 0.27 min.
SHGC SHGC
Window/ Window/
no requirement 11% no requirement 18%
Wall ratio Wall ratio
Airtightness Airtightness
0.27 (3ACH) 0.06 min. 0.27 (3ACH) 0.06 min.
(CFM50) (CFM50)
Heat Heat
no requirement 57% min. no requirement 57% min.
Recovery % Recovery %
DHW electric DHW
gas hot water gas electric heat pump
Systems resistance Systems
Heat heat pump w/ heat pump Heating heat pump w/ heat pump
Systems boiler no fossil fuels Systems boiler no fossil fuels
Roof Roof
R-49 R-60 min. R-49 R-60 min.
R-value R-value
Walls Walls
R-20 R-36 min. R-20 R-36 min.
R-value R-value
Floor Floor
R-10 R-21 min. R-10 R-21 min.
R- value R-value
PV PV
no requirement 25 Kw no requirement 40 Kw
75% roof area 75% roof area
0.88% 0.60%
1d
Construction Construction
0% 0%
cost increase cost increase
Operational Operational
0% 20% decrease 0% 1% decrease
cost cost
21
methodology
introductionmodeled results
note: See section 3 for building element recommendations per typology.
4 - 5 story multifamily 6 story multifamily
Components Stretch Code 2019 Zero Emission Building Components Stretch Code 2019 Zero Emission Building
Window Window
0.3 0.22 min. 0.3 0.22 min.
U-value U-value
Window Window
no requirement 0.3 min. no requirement 0.27 min.
SHGC SHGC
Window/ Window/
no requirement 20% no requirement 17%
Wall ratio Wall ratio
Airtightness Airtightness
0.27 (3ACH) 0.06 min. 0.27 (3ACH) 0.13 min.
(CFM50) (CFM50)
Heat Heat
no requirement 85% min. no requirement 65% min.
Recovery % Recovery %
DHW DHW
gas electric heat pump gas electric heat pump
Systems Systems
Heating heat pump w/ heat pump Heating heat pump w/ heat pump
Systems boiler no fossil fuels Systems boiler no fossil fuels
Roof Roof
R-49 R-60 min. R-49 R-60 min.
R-value R-value
Walls Walls
R-26 R-36 min. R-26 R-36 min.
R-value R-value
Floor Floor
R-10 R-21 min. R-10 R-21 min.
R-value R-value
PV PV
no requirement 157 Kw no requirement 104 Kw
75% roof area 75% roof area
0.91% 2.21%
1d
Construction Construction
0% 0%
cost increase cost increase
Operational Operational
0% 20% decrease 0% 26% decrease
cost cost
22
methodology
introduction2| best practices
for ZEBs
a | what is a ZEB?
b | key strategies
best practices for ZEBs 23what is a ZEB?
A Zero Emission Building (ZEB) is designed so that the total amount DND’s secondary approach is a Zero Emission Ready /Building.
of energy required for operation, and the energy used for the materi- ZERBs are designed the same as a ZEBs but are considered “solar
als, are in line with a total CO2e budget. For this study, the budget is ready.” A key paramter for a ZERB is to maintain a clear roof area free
based upon a portfolio of buildings, and a well-established per-person of any obstructions that would hinder PV installation. For example,
GHG footprint. (see section 1d for more explanation) a ZERB may only have 50-60% of the required photovoltaics to
reach zero emissions and has the ability increase on site renewables
Prioritizes thermal bridge free / air tight construction overtime.
Prioritizes all electric systems and heat exchange ventilation
Prioritizes on-site renewable energy generation
Evaluates embodied of all materials
Includes off-site renewable energy / carbon offsets as necessary
2a what is a ZEB?
best practices for ZEBs
24key strategies
massing
During the early stages of the
design process, massing should
be prioritized. Massing can be
thought of as a building’s overall
form, shape, and size in three
dimensions. Simplified massing
can help reduce heat loss from a
building.
simplify form
The form of a building can have
a tremendous effect on its per-
formance. The more complex the
building’s shape, the harder it is
to minimize heat loss through the
envelope. A simple rectangle or
cube with relatively few complex
joints will retain far more heat.
maximize volume to surface
Massing can also be thought of
in terms of the ratio of volume
enclosed by the envelope to the
surface area of that envelope. The
more volume encloses by less
surface area the better perfor-
mance the building will achieve.
enlarge floor plate
In general, smaller or narrower
floor plates make performance
targets harder to hit. By increasing
2b
a building’s footprint and simplify-
ing the shape, performance targets
become easier to reach.
25
key strategies
best practices for ZEBsorientation
Orientation refers to how a
building situates itself on-site
in plan-view. By orienting their
buildings carefully, professionals
can reduce heating demands by as
much as 30 - 40%. This strategy
does not necessarily minimize heat
loss, but it is a strategy to take
advantage of passive heat gains.
take advantage of natural light
Thoughtful orientation can also
reduce lighting loads through the
use of natural light. Living spaces
oriented toward the southwest
enable inhabitants to use natural
rather than artificial light.
maximize solar gains
Designers should orient the
longest facade as close to due
south as possible. The south-facing
facade should be within 30° of due
south. Many sites do not allow for
this on all levels, but opportunities
may exist to orient the upper floors
due south.
avoid overheating DND understands that many infill sites
When using solar gain, care must may not have the opportunity to align with
be taken during summer months this best practice due to neighborhood
to avoid overheating. Designers context or the orientation of the site itself.
2b
can specify horizontal shading
on the south side to mitigate
overheating.
26
key strategies
best practices for ZEBsimpacts of unit density
The denser the ZEB the better.
Maximizing the number of resi-
dences in a ZEB is a good approach
for reducing energy consumption
at an urban scale. The more people
who live in energy efficient build-
ings like ZEBs, the fewer people
who live in low performance build-
ings. At the scale of the city, the
faster we move people from low
performance buildings into high
performance buildings the better.
An important note is that as unit
density increases, the energy
demand of the building also
increases. This is OK because the
energy use per resident decreases
proportionally.
2b key strategies
best practices for ZEBs
27glazing percentages
Glazing percentages are import-
ant when minimizing heat loss,
and controlling solar gains. It is
important to optimize the glazing
percentage based on the orienta-
tion of the window.
For south facades, aim for approx-
imately 20% window area to wall
area. 10 - 12% for east and west
facades and 6 - 8% for north-facing
facades.
Optimized Glazing strategies help
to reduce cost, heat loss and excess
solar gains. More windows require
that the windows be higher-perfor-
mance windows due to the amount
of heat loss during the winter.
more than 25% 15% -18% glazing
glazing to wall area of total wall area
2b key strategies
best practices for ZEBs
28thermal bridging and r-value
R-values are a measure of a
building envelope’s thermal resis-
tance (its ability to prevent heat
from moving from one side to the
other). The higher the r-value, the
more effective its insulation.
Opting for higher r-valued building
components makes it easier to
reach efficiency targets.
A higher r-value also translates
to improved occupant comfort
because interiors are warmer in the
winter and cooler in the summer.
2b key strategies
best practices for ZEBs
29thermal bridging and r-value
least concrete used,
but poor thermal
performance
least concrete used,
with ok thermal
performance
most concrete used,
but great thermal
performance
best use of concrete,
and great thermal
performance
2b key strategies
best practices for ZEBs
30airtightness
Reaching an airtightness of 0.06
CFM50 (passive house standard)
is paramount to reducing a build-
ing’s heating and cooling demands.
A simplified massing can help to achieve 0.06 CFM50
mitigate cost increases. More
complex forms require more man-
agement and careful labor.
2b
helpful to show air barrier in red
31
key strategies
best practices for ZEBsventilation
Balanced systems HRV or ERV
help channel tempered fresh air
throughout the residence, increas-
ing indoor air quality and moisture
control. ERVs are recommended in
Boston’s climate zone.
It is advised that balanced ventilation
systems are compartmentalized per
dwelling unit
Increased indoor air quality
(IAQ)
When used with a MERV filter,
the system reduces allergens and
common air pollutants. Excessive
moisture is continuously removed
from indoor spaces greatly
reducing mold risks
Increased energy efficiency
(heat/ recovery - over heat loss
typically found with exhaust only
systems)
The more efficient the system
the greater the savings in overall
energy costs
Improved Health - stale, moist air
is removed from the dwelling unit
2b key strategies
best practices for ZEBs
32assembly summary
meets stretch code minimums meets ZEB minimums
barebones standard more efficient
assembly assembly standard assembly
small
multifamily
only R-49 R-60
min min
R-40 R-9 R-28
min
R-40 R-38
U-0.3 U-0.3 U-0.3
SHGC-n/a SHGC-n/a SHGC-n/a
0.3 0.3 0.3
cfm/ cfm/ cfm/
gsf gsf gsf
R-21 R-5 R-21 R-15 R-21
min
R-10 R-10 R-21
R-26 R-36
min min
2b key strategies
best practices for ZEBs
33assembly summary
meet or exceed ZEB minimums
double-stud pre-fab panel
assembly assembly
stick-built and improves schedule
cost-effective and performance
R-60 R-60
min min
U-0.22 U-0.22
SHGC-0.3 SHGC-0.3
0.06 0.06
cfm/ cfm/
gsf gsf
R-46 R-36
min
R-21 R-21
2b key strategies
best practices for ZEBs
343| typologies
a | introduction
b | small multifamily
c | 3 story multifamily
d | 4 - 5 story multifamily
e | 6 story multifamily
typologies 35introduction
The case study results of each building typology are illustrated in section 3. This section
provides a comparison of performance criteria, building components, and modeled
assemblies for both a 2019 Stretch Code building and a Zero Emission Building.
Located at the end of each typology section are both the recommended assemblies and
the target ZEB design requirements for that typology.
Typologies:
small multifamily, 3 story multifamily, 4 - 5 story multifamily, 6 story multifamily
note: see page 10 for how these typologies were selected
3a introduction
typologies
36small multifamily
3b small multifamily
typologies
37case study - results
Stretch Code Zero Emission
Components
2019 Building
Window U-value 0.3 0.22 min.
Window SHGC no requirement 0.3 min.
Window/Wall ratio no requirement 11%
Air-tightness
0.27 (3ACH) 0.06 min.
(CFM50)
Heat Recovery % no requirement 57% min.
DHW systems gas hot water electric resistance
heat pump
Heating Systems heat pump w/ boiler
no fossil fuels
Roof R-value R-49 R-60 min.
Walls R-value R-26 R-36 min.
Floor R- value R-10 R-21 min.
PV
no requirement 25 Kw
75% roof area
Incremental
0% 0.88% increase
Construction Cost
Incremental
0% 20% decrease
Operational Cost
3b small multifamily
typologies
38case study - assemblies
Stretch Code Building - Modeled Assemblies:
• Windows: Low E2 - 0.30 U-value
• Glazing: Clear Galzing SGHC 0.27
• Air Tightness: ACH o.27 CFM/ SF (code 3.0 ACH)
• Heat Recovery: no requirement
• Domestic HW: 80 gal. Hot Water Tank
• Heating System: Heat pump condenser + Boiler 2.8 COP
• Roof: 10” Joist w Sheathing with R-30 Cavity Insulation + R-24.5 Continuous Board - R50
• Wall: 2x6 wood framed wall + R-21 Cavity Insulation + R-5 Continuous Board
• Floor: Slab on grade w/ R-10 continuous insulation
• Photovoltaics: no requirement
Zero Emission Building - Modeled Assemblies:
• Windows: Triple pane - o.22 U-value
• Glazing: Clear 0.30 SHGC
• Air Tightness: ACH 0.06 CFM /SF
• Heat Recovery: HRV 57% efficiency - 0.77
• Domestic HW Heat pump hot water - 2.1 COP
• Heating System: Heat pump 1 ton system - ductless - 3.0 COP
• Roof: 12” Joist w/ Sheathing with R-38 Cavity Insulation + R-28 Continuous Board - R60
• Wall: 2x6 wood frame wall + R-21 Cavity Insulation + R-15 Continuous Board
• Floor (Basement): Slab on grade w/ R-21 continuous insulation
3b
• Photovoltaics: 25 Kw array
Note: For the sake of this study the project team modeled building products currently
available on the market. Manufacturer names have been withheld.
39
small multifamily
typologiescase study - assemblies
3b small multifamily
typologies
40case study - massing
3b small multifamily
typologies
41case study - orientation
3b small multifamily
typologies
42case study - glazing
Window to Wall Ratio
11% of total surface
Window Specification
70 mm Upvc Tilt / Turn
U-value = 0.22
SHGC = 0.3
3b small multifamily
typologies
43case study - airtightness
3b small multifamily
typologies
44recommendations
Thermal bridge free shell
Window to wall ratio =3 story multifamily
3c 3 story multifamily
typologies
46case study - results
Stretch Code Zero Emission
Components
2019 Building
Window U-value 0.3 0.22 min.
Window SHGC no requirement 0.27 min.
Window/Wall ratio no requirement 18%
Air-tightness
0.27 (3ACH) 0.06 min.
(CFM50)
Heat Recovery % no requirement 57% min.
electric heat pump
DHW systems gas
hot water
heat pump
Heating Systems heat pump w/ boiler
no fossil fuels
Roof R-value R-49 R-60 min.
Walls R-value R-26 R-36 min.
Floor R- value R-10 R-21 min.
PV
no requirement 40 Kw
75% roof area
Incremental
0% 0.60% increase
Construction Cost
3c
Incremental
0% 1% decrease
Operational Cost
47
3 story multifamily
typologiescase study - assemblies
Stretch Code Building - Modeled Assemblies:
• Windows: Low E - 0.30 U-value
• Glazing: Clear SGHC 0.27
• Air Tightness: ACH o.27 CFM/ SF (code 3.0 ACH)
• Heat Recovery: no requirement
• Domestic HW: 80 gal. Hot water tank
• Heating System: Heat pump condenser + Boiler 2.8 COP
• Roof: 10” Joist w Sheathing with R-30 Cavity Insulation + R-24.5 Continuous Board - R50
• Wall: 2x6 wood framed wall + R-21 Cavity Insulation + R-5 Continuous Board
• Floor: Slab on grade w/ R-10 continuous insulation
• Photovoltaics: no requirement
Zero Emisson Building - Modeled Assemblies:
• Windows: Triple pane uPVC- o.22 U-value
• Glazing: Clear 0.35 SHGC
• Air Tightness: ACH 0.o6 CFM /SF
• Heat Recovery: ERV 57% Efficiency - 0.77 watts /cfm
• Domestic HW Heat pump hot water 2.7 COP
• Heating System: Heat pump 1 ton system - ductless - 3.0 COP
• Roof: 12” Joist w Sheathing with R-38 Cavity Insulation + R-28 Continuous Board - R60
• Wall: 2x6 wood framed wall + R-21 Cavity Insulation + R-15 Continuous Board
• Floor (Basement): Slab on grade w/ R-21 continuous insulation
3c
• Photovoltaics: 40 Kw array
Note: For the sake of this study the project team modeled building products currently
available on the market. Manufacturer names have been withheld.
48
3 story multifamily
typologiescase study - assemblies
3c 3 story multifamily
typologies
49case study - massing
3c 3 story multifamily
typologies
50case study - orientation
3c 3 story multifamily
typologies
51case study - glazing
Window to Wall Ratio
18% of total surface
Window Specification
70 mm Upvc Tilt / Turn
U-value = 0.22
SHGC = 0.27
3c 3 story multifamily
typologies
52case study - airtightness
3c 3 story multifamily
typologies
53recommendations
Thermal bridge free shell
Window to wall ratio =4 - 5 story
multifamily
3d 4 - 5 story multifamily
typologies
55case study - results
Stretch Code Zero Emission
Components
2019 Building
Window U-value 0.3 0.22 min.
Window SHGC no requirement 0.3 min.
Window/Wall ratio no requirement 20%
Air-tightness
0.27 (3ACH) 0.06 min.
(CFM50)
Heat Recovery % no requirement 85% min.
electric heat pump
DHW systems gas
hot water
heat pump
Heating Systems heat pump w/ boiler
no fossil fuels
Roof R-value R-49 R-60 min.
Walls R-value R-26 R-36 min.
Floor R- value R-10 R-21 min.
PV
no requirement 157 Kw
75% roof area
Incremental
0% 0.91% increase
Construction Cost
3d
Incremental
0% 20% decrease
Operational Cost
56
4 - 5 story multifamily
typologiescase study - assemblies
Stretch Code Building - Modeled Assemblies:
• Windows: Low E- 0.30 U-value
• Glazing: Clear - SGHC 0.27
• Air Tightness: ACH o.27 CFM/ SF (code 3.0 ACH)
• Heat Recovery: no requirement
• Domestic HW: 80 gal. Hot Water Tank
• Heating System: Heat pump condenser + Boiler 2.8 COP
• Roof: 10” Joist w Sheathing with R-30 Cavity Insulation + R-24.5 Continuous Board - R50
• Wall: 2x6 wood framed wall + R-21 Cavity Insulation + R-5 Continuous Board
• Floor: Slab on grade with continuous R-10 insulation
• Photovoltaics: no requirement
Zero Emission Building - Modeled Assemblies:
• Windows: Triple pane - o.28 U-value
• Glazing: Clear - 0.30 SHGC
• Air Tightness: ACH 0.06 CFM /SF
• Heat Recovery: ERV - 85% Efficiency - 0.77 Watts/cfm
• Domestic HW Heat pump hot water 2.1 COP
• Heating System: Heat pump 1 ton system - ductless - 3.0 COP
• Roof: 10” Joist w Sheathing with R-38 Cavity Insulation + R-28Continuous Board - R60
• Wall: 2x6 wood framed wall + R-21 Cavity Insulation + R-15 Continuous Board - R36
• Floor (Basement): Slab on grade w/ R-21 continuous insulation
3d
• Photovoltaics: 157 Kw array
Note: For the sake of this study the project team modeled building products currently
available on the market. Manufacturer names have been withheld.
57
4 - 5 story multifamily
typologiescase study - assemblies
3d 4 - 5 story multifamily
typologies
58case study - massing
3d 4 - 5 story multifamily
typologies
59case study - orientation
3d 4 - 5 story multifamily
typologies
60case study - glazing
Window to Wall Ratio
23% of total surface
Window Specification
70 mm Upvc Tilt / Turn
U-value = 0.28
SHGC = 0.3
3d 4 - 5 story multifamily
typologies
61case study - airtightness
3d 4 - 5 story multifamily
typologies
62recommendations
Thermal bridge free shell
Window to wall ratio =6 story multifamily
3e 6 story multifamily
typologies
64case study - results
Stretch Code Zero Emission
Components
2019 Building
Window U-value 0.3 0.22 min.
Window SHGC no requirement 0.27 min.
Window/Wall ratio no requirement 17%
Air-tightness
0.27 (3ACH) 0.13 min.
(CFM50)
Heat Recovery % no requirement 57% min.
electric heat pump
DHW systems gas
hot water
heat pump
Heating Systems heat pump w/ boiler
no fossil fuels
Roof R-value R-49 R-60 min.
Walls R-value R-20 R-36 min.
Floor R- value R-10 R-21 min.
PV
no requirement 104 Kw
75% roof area
Incremental
0% 2.21% increase
Construction Cost
3e
Incremental
0% 26% decrease
Operational Cost
65
6 story multifamily
typologiescase study - assemblies
Stretch Code Building - Modeled Assemblies:
• Windows: Low E - 0.30 U-value
• Glazing: Clear - SGHC 0.27
• Air Tightness: ACH o.27 CFM/ SF (code 3.0 ACH)
• Heat Recovery: no requirement
• Domestic HW: 80 gal. Hot water tank
• Heating System: Heat pump condenser + Boiler 2.8 COP
• Roof: 10” Joist w Sheathing with R-30 Cavity Insulation + R-24.5 Continuous Board - R50
• Wall: 2x6 wood framed wall + R-21 Cavity Insulation + R-5 Continuous Board
• Floor: Slab on grade with continuous R-10 insulation
• Photovoltaics: no requirement
Zero Emission Building - Modeled Assemblies:
• Windows: Triple pane- o.22 U-value
• Glazing: Clear - 0.27 SHGC
• Air Tightness: ACH 0.06 CFM /SF
• Heat Recovery: HRV 65% efficiency - 0.77 watts /cfm
• Domestic HW Heat pump hot water tank 2.1 COP
• Heating System: Heat pump 1 ton system - ductless - 3.0 COP
• Roof: 12” Joist w Sheathing with R-38 Cavity Insulation + R-28 Continuous Board - R60
• Wall: 2x6 wood framed wall + R-21 Cavity Insulation + R-15 Continuous Board
• Floor (Basement): Slab on grade w/ R-21 continuous insulation
3e
• Photovoltaics: 104 Kw array
Note: For the sake of this study the project team modeled building products currently
available on the market. Manufacturer names have been withheld.
66
6 story multifamily
typologiescase study - assemblies
3e 6 story multifamily
typologies
67case study - massing
3e 6 story multifamily
typologies
68case study - orientation
3e 6 story multifamily
typologies
69case study - glazing
Window to Wall Ratio
17% of total surface
Window Specification
70 mm Upvc Tilt / Turn
U-value = 0.28
SHGC = 0.4
3e 6 story multifamily
typologies
70case study - airtightness
3e 6 story multifamily
typologies
71recommendations
Thermal bridge free shell
Window to wall ratio = ≤20% (total surface area)
Increased WWR above 20% results in a triple glazed window
0.18 u-value is recommended
Window performance criteria = Energy Star Air Leakage4| appendices
a | sources and resources
b | variations
c | tools and resources for embodied carbon
d | about this guide
appendices 73sources and resources
475 High Performance Building Buildings. In: Climate Change IEA 2019 - Perspectives for the
Supply (2019) 2014: Mitigation of Climate Clean Energy Transition: The
Double-Stud Smart Enclosure System Change. Contribution of Working Critical Role of Buildings
Version 2.1 Group III to the Fifth Assessment www.iea.org
Report of the Intergovernmental
9th Edition MA Residential Code Panel on Climate Change Massachusetts DOER Policy
780 CMR 51.00 Lucon O., D. Ürge-Vorsatz, A. Zain Ahmed, Planning and Analysis Division
H. Akbari, P. Bertoldi, L. F. Cabeza, N.
Eyre, A. Gadgil, L. D. D. Harvey, Y. Jiang,
- Projected Household Heating
Annual Energy Outlook 2019 E. Liphoto, S. Mirasgedis, S. Murakami, Costs for 2019/2020
with projections to 2050 J. Parikh, C. Pyke, and M. V. Vilariño, www.mass.gov/info-details/
Prepared by the U.S. Energy Information 2014 [Edenhofer, O., R. Pichs-Madruga, Y. household-heating-costs
Administration (EIA), the statistical Sokona, E. Farahani, S. Kadner, K. Seyboth,
and analytical agency within the U.S. A. Adler, I. Baum, S. Brunner, P. Eickemeier,
Department of Energy. www.eia.gov/aeo B. Kriemann, J. Savolainen, S. Schlömer,
Moisture Management for
C. von Stechow, T. Zwickel and J.C. Minx High R-Value Walls
(eds.)]. Cambridge R. Lepage, C. Schumacher, andA. Lukachko
Annual Housing End Use: 2015 University Press, Cambridge, United Building Science Corporation
Residential Energy Consumption Kingdom and New York, NY, USA.
Survey: Energy Consumption and The Economics of Zero-Energy
Expenditures Table CE4.7
Carbon Free Boston Summary Homes: Single-Family Insights.
Report 2019 Rocky Mountain Institute, 2019.
Architect’s Guide to Building Boston Green Ribbon Commission and Petersen, Alisa, Michael Gartman, and
Performance: Integrating Jacob Corvidae.
Boston University
www.rmi.org/
Simulation into the
economics-of-zero-energy-homes
Design Process City of Boston Greenhouse Gas
AIA guide for performance simulation Emission Inventory 2005-2016
https://data.boston.gov/dataset/
Zero Energy Building
BC Energy Step Code greenhouse-gas-emissions
Pathway to 2035
Whitepaper Report of the Rhode Island
Design Guide: Zero Energy Building Task Force
The BC Energy Step Code Design Guide is Household Energy Use in Prepared by National Grid, November
published by BC Housing in collaboration
with BC Hydro, the City of Vancouver, the
Massachusetts 2016
A closer look at residential energy
City of New Westminster, and the Province
consumption survey
of BC. This guide provides information
www.eia.gov/consumption/residential/
4a
on the key strategies and approaches to
meeting the Energy Step Code in mid- and
high-rise (Part 3) wood-frame and noncom-
bustible residential buildings within British
Columbia.
74
sources and resources
appendicesvariations
Roof Annual
Window Airtight- Heat Electric DHW HP Wall Floor EUI
Project Type SHGC R-val Operating CO2e
U-value ness Recovery Efficiency COP COP R-val R-val (kBTU)
Cost
Townhouse Flats-
0.77 lbs CO2e/pp
Ideal - cost effective 0.22 0.27 0.06 0.57 0.59 2.1 3 60 36 21 18 $1,450 0.77
0.18 0.27 0.05 0.85 0.53 2.1 3 60 46 36 17 $1,400 0.75
3 Story- 0.77 lbs
CO2e/pp
Ideal - cost effective 0.22 0.27 0.06 0.57 0.59 1 3 60 36 21 $1,200 0.77
0.22 0.27 0.05 0.57 0.59 2.1 3 60 36 21 22 $1,050 0.67
0.18 0.27 0.05 0.85 0.53 2.1 3 60 36 21 20 $950 0.61
4 -5 Story - 0.77 lbs
CO2e/pp
Ideal - cost effective 0.22 0.27 0.06 0.85 0.53 1 3 60 36 21 20.5 $1,100 0.77
0.18 0.39 0.05 0.85 0.53 1 3 60 36 36 20 $1,100 0.75
0.18 0.39 0.05 0.85 0.53 2.1 3 60 36 36 16.8 $882 0.62
6+ Story - 0.77 lbs
CO2e/pp
Ideal - cost effective 0.22 0.27 0.06 0.57 0.59 2.1 3 60 36 21 18 $1,100 0.77
0.22 0.27 0.05 0.85 0.53 2.1 3 60 36 21 16 $950 0.65
4b variations
appendices
75You can also read


