Potential for the use of wood-based energy in expanded and integrated primary processing in the Gisborne region - Confidential - MPI
←
→
Page content transcription
If your browser does not render page correctly, please read the page content below
Confidential

Potential for the use of wood-based energy
in expanded and integrated primary
processing in the Gisborne region
  - Report for the Forestry Ministerial Advisory Group
Peter Hall, September 2019

Report information sheet
 Report title             POTENTIAL FOR THE USE OF WOOD-BASED ENERGY IN EXPANDED AND INTEGRATED
                          PRIMARY PROCESSING IN THE GISBORNE REGION

 Authors                  Peter Hall
                          Scion

 Client                   Forestry Ministerial Advisory Group / Te Uru Rakau

 Client contract          19840
 number

 PAD output number        171795538

 Signed off by            Paul Bennett

 Date                     September 2019

 Confidentiality          Confidential (for client use only)
 requirement

 Intellectual                       © New Zealand Forest Research Institute Limited. All rights reserved.
 property                           Unless permitted by contract or law, no part of this work may be
                                    reproduced, stored or copied in any form or by any means without the
                                    express permission of the New Zealand Forest Research Institute
                                    Limited (trading as Scion).

 DISCLAIMER               The information and opinions provided in the Report have been prepared for
                          the Client and its specified purposes. Accordingly, any person other than the
                          Client uses the information and opinions in this report entirely at its own risk.
                          The Report has been provided in good faith and on the basis that reasonable
                          endeavours have been made to be accurate and not misleading and to
                          exercise reasonable care, skill and judgment in providing such information and
                          opinions.

                          Neither Scion, nor any of its employees, officers, contractors, agents or other
                          persons acting on its behalf or under its control accepts any responsibility or
                          liability in respect of any information or opinions provided in this Report.

Published by: Scion, 49 Sala Street, Private Bag 3020, Rotorua 3046, New Zealand. www.scionresearch.com

                                                      (ii)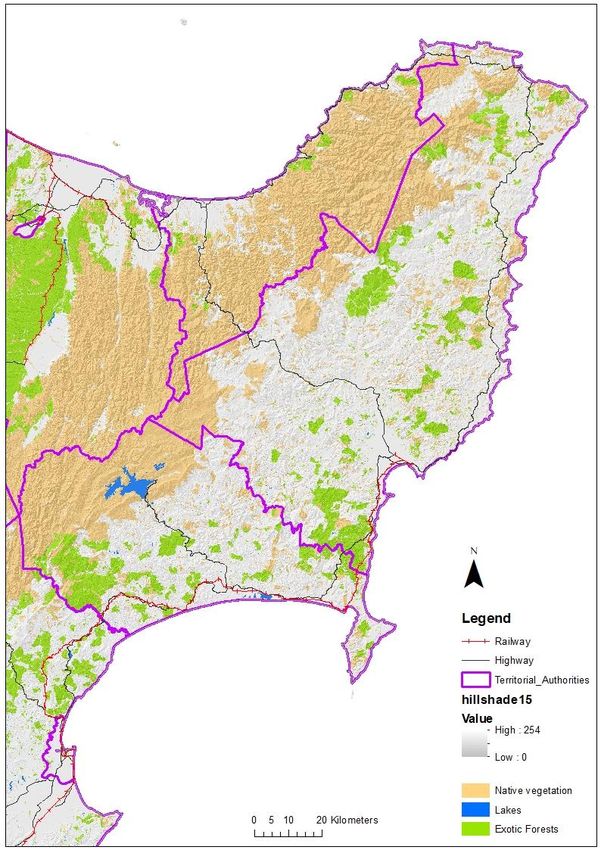
Executive summary
The objective of this study was to identify the potential for expanded wood processing based on current
wood supply, whilst taking into consideration the potential for expansion of other primary processing, such
as wood, meat, fruit etc, with the symbiotic development of heat and power generation across these
industries.

The Gisborne Region and Wairoa District plantation forest resources were considered together as the
forests in Northern Wairoa are closer to Gisborne than Napier.

The Gisborne / Wairoa area has long term wood availability of approximately 3.1 M m 3 per annum.
  Grade     2018 - 2022     2023 - 2027    2028 - 2032       2033 - 2037    2038 - 2042     2043 - 2047
 Pruned        769,000        1,111,000        1,030,000        730,000         496,000         643,000
     S        1,235,000       1,282,000        1,435,000       1,639,000       1,001,000        905,000
     A         889,000        1,128,000        1,154,000       1,153,000        680,000         675,000
     K         588,000         715,000          756,000         792,000         474,000         454,000
   Pulp        725,000          677, 00         873,000        1,208,000        675,000         491,000
   Total      4,208,000       4,915,000        5,251,000       5,524,000       3,328,000       3,170,000

There is variation in volume available over time and current volumes available are higher than the long
run supply. This supply is made up of a wide range of log grades. Only a small proportion of the Gisborne
/ Wairoa wood supply is processed locally.

There is a significant opportunity for expanded wood processing to be developed and the impacts of this
on GDP and employment are substantial.

However, there are limits on the power and natural gas supply into Gisborne City due to infrastructure
constraints which could limit the potential expansion in wood processing.

Wood processing can be substantially self-fuelled with the use of wood processing residues such as bark,
sawdust etc as an energy source. The production of electricity via combined heat and power plants is
also possible. Depending on the type of wood processing, energy demands per cubic metre of product
can be high. The ability to self-fuel varies widely across processes, with sawmills and secondary
processing having spare residues and reconstituted panel products requiring imports of fuel to meet their
heat demand

Five scenarios for expanded wood processing were considered;
1. WSI. A large cluster with near the maximum volume possible based on the long-term wood supply; 2.1
to 2.3M m3; a mix of engineered products (LVL), sawmilling and reprocessed lumber (CLT etc). Near the
limit of the maximum wood supply.

2. Industry Example. 1.19M m3 per annum. Smaller volume than WSI with high energy demand low
residue producing processes (OSB and MDF) prominent as well as sawmilling.

3. WSII. A smaller cluster with a significant amount of secondary wood processing (CLT and
Remanufacture), similar to the large cluster, but without the large LVL plant, includes a large MDF plant.

4. WS III. A smaller cluster with a significant amount of secondary wood processing (CLT and
Remanufacture), similar to the large cluster, but without the large LVL plant, includes a medium sized
OSB plant.

5. Smaller / staged development. Starting with three OEL™ modules followed by a large sawmill aligned
with secondary processing. The third stage (MDF) would depend on the ability / viability of exporting
sawmill chip via road, rail or barge to other regions or to the port at Napier.

                                                     3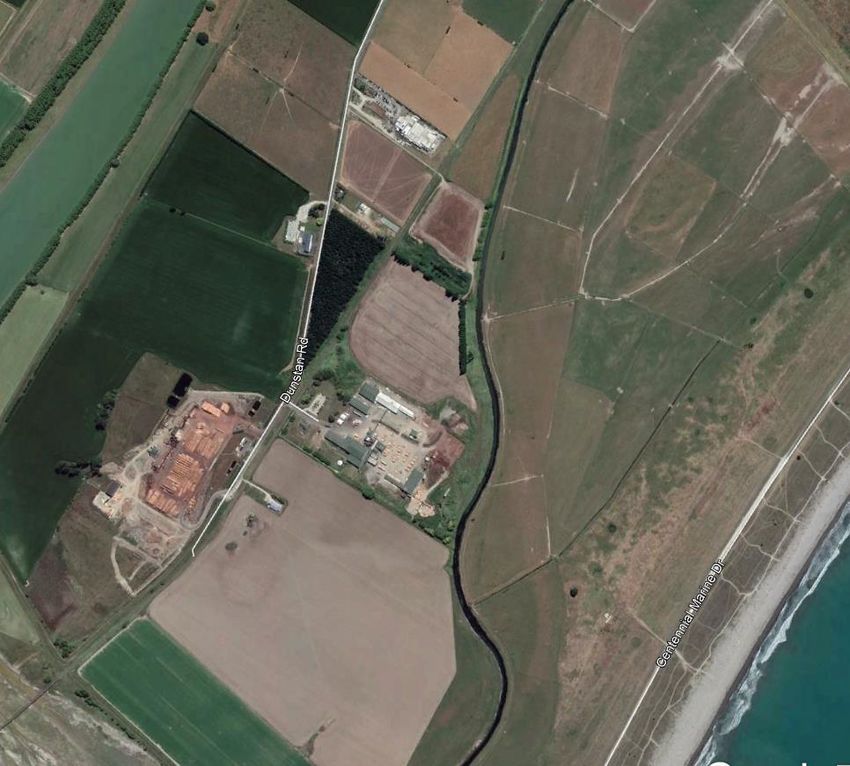
Total log      Total      Capital      Total             Total          GDP
                     volume in;     Capital;   weighted      direct       employment         $M p.a.
     Cluster           m3 p.a.        $M         RA           jobs          including
                                                ROCE                      indirect and
                                                                             induced
      WSI            2,250,000       $949         25%         1,427            3,540          $1,441
   Industry          1,190,000       $478         17%           671            1,797           $592
     WSII            1,850,000       $829         26%         1,183            2,886          $1,224
    WSIII            1,800,000       $702         23%         1,258            3,087           $855
 Small / staged*     1,450,000       $655         27%         1,085            2,771          $1,120

In terms of the RA ROCE the smaller cluster (WSII) with an MDF mill was the best performer.

The MDF option also has the advantage of taking all the sawmill chip. OSB cannot take this material and
therefore another market for the chip would need to be found.

There is potential to take a range of local organic waste streams (waste fruit and vegetables, meat works
effluent, municipal bio-solids) and feed them into an anaerobic digestion system with the biogas going to
a heat and power unit (ICE genset). This waste stream could make around 2MWe and 2MWth which
could be used either in the meat works or the wood processing cluster.

The inclusion of secondary processors is important to the overall energy supply and demand. These
operations have low energy inputs and comparatively high proportions of residuals, which mean they
make a positive contribution to the energy supply / demand of the cluster.

A large-scale cluster of wood processing technologies with high energy demands per cubic metre of
product is problematic as their demand for energy exceeds their supply of residues and if too many
operating plants are put in one location this can also exceed the supply of locally available wood
residues. This is in part why the Industry example cluster does not look as attractive as the other clusters
based on our analysis.

A cluster of mills as described in the report as WSII had an attractive set of metrics. The scale of the
operations, capital investment, return on investment, employment and GDP are outlined below. This
cluster has the best RA ROCE and the best fit with the energy available from residues and the grid. This
cluster of operations has a high demand for total labour in comparison to the local population.

 Mill Type             Log           Capital      ROCE         Capital       Total           GDP
                       volume in     cost ($M)    %***         weighted      Employment      $M p.a.
                       (m3 per                                 ROCE %
                       annum)
 Large S & A            750,000         85       8 to 12              -           522           $129
 sawmill
 Industrial sawmill      400,000        54          16                -            41            $59
 OEL™ (3 modules)        300,000        78          27                -           216           $127
 MDF                    400,000*       220          32                -           292           $482
 CLT (2 modules)       140,000**       162          31                -           295           $254
 Remanufactured        132,000**       110          29                -          1446           $128
 (2 modules)
 Glulam                 18,200**        20          22             -               74            $45
 Total log intake      1,850,000       729                        27.0           3,540          1,441
*MDF mill also takes 340,000 m 3 per annum of sawmill chip
** Lumber not logs
***Current and long run log prices

Supply and demand for energy for WoodScape cluster II are outlined here. This demand can be met
using the spare residues from the cluster, in-forest residues and around 6MWe from the grid.

                                                   4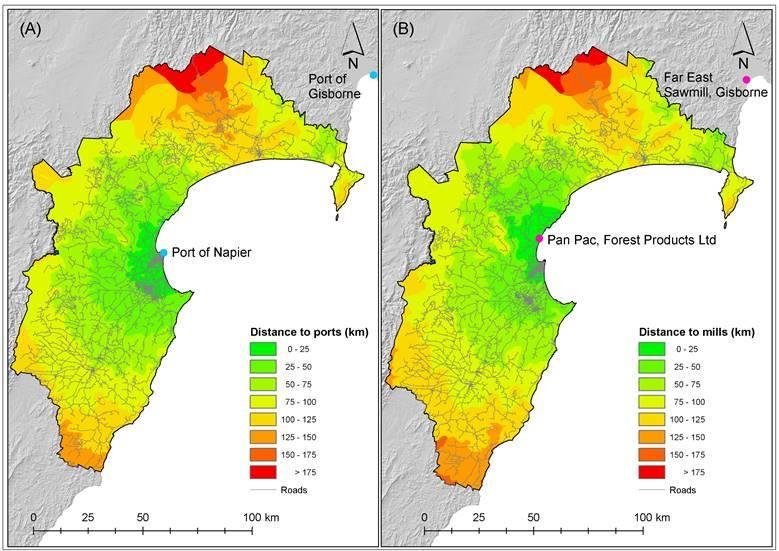
Mill type          Heat           Power           Residues;     Residues;      Heat fuel
                    demand;        demand;         odt p.a.      GJ p.a.        deficit /
                    GJ p.a.        kWh p.a.                                     surplus;
                                                                                GJ p.a.
  Large S & A         892,500       10,625,000         57,000     1,037,400      144,900
  sawmill
  Industrial          441,000        5,250,000         30,400      553,280        112,280
  sawmill
  OEL™ (multiple      530,100       16,758,000         55,200     1,004,640       474,540
  modules)
  MDF                 875,000       108,250,000        20,800      378,560       -496,440
  CLT                  64,260        2,261,000          8,400      152,880        88,620
  Remanufactured       53,460        4,059,000         13,200      240,240        186,780
  Glulam                9,720         342,000           1,893       34,449        24,729
  Total              2,866,000 147,545,000*            186,893    3,401,449,      535,409
* equivalent to a power plant of 17MWe

Further work
Investigation of sawmill slabwood as an OSB feedstock would be useful as if this is possible it allows an
option other than MDF to be considered at large-scale for the Gisborne region.

Investigation of the option of barging freight (containers and wood chip) from Gisborne to Napier.

There are many potential combinations of wood processing, wood residues to energy, waste to energy
that could be deployed. Some of them are dependent on more information (transport options) and value
of the waste to energy plant in the long term. A study that considers these in more detail may have value.

Previous work by Scion for the FMAG (Hall and Palmer, 2019) focussed on the extraction and use in-
forest residues in the Gisborne Region to reduce post-harvest issues with residues being mobilised in
flood events.

One option has always been to extract the broken tops that occur during tree felling to logging landings in
greater volumes. This has traditionally had a cost attached to it that is a barrier.

A developing option that addresses this is may be the use of fixed head feller bunchers as opposed to
dangle heads. The fixed heads can give much greater control of the stem during felling and this can lead
to reduced breakage. There was a short article in the August 2019 edition of NZ logger (page 18) that
quoted a presentation from a logging operator (HarvestTech 2019 conference) on the substantially
increased extraction of longer unbroken stems from a fixed head machine versus a dangle head machine.
The focus of the article was on the value of the greater volume of wood extracted that could be sold as
posts.

However, this development would be worth a more detailed examination to determine the impact on the
volume of residues left on the cutover.

                                                   5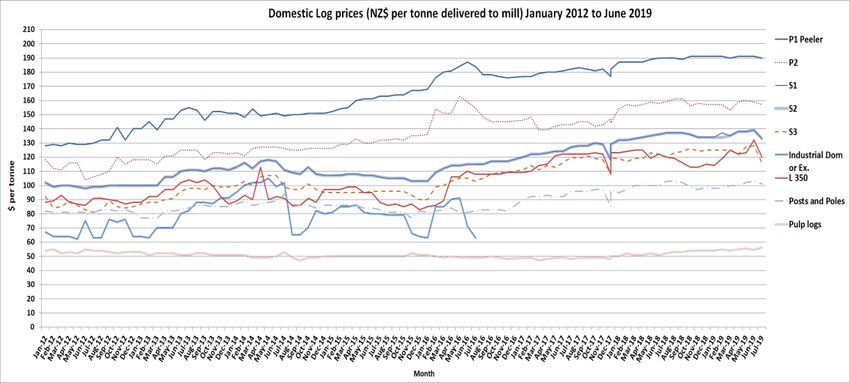
Potential for the use of wood-based energy in
expanded and integrated primary processing
in the Gisborne region

Table of contents
Executive summary ............................................................................................................................ 3
Glossary ............................................................................................................................................. 7
Introduction ......................................................................................................................................... 8
Methods ............................................................................................................................................ 12
   Regional wood supply ................................................................................................................... 12
   Biomass supply modelling - Wood supply to Matawhero ............................................................. 12
Results .............................................................................................................................................. 14
   Wood supply ................................................................................................................................. 14
   Afforestation to support long term wood processing .................................................................... 16
   Wood residue supply .................................................................................................................... 18
   WoodScape analysis of wood processing options ....................................................................... 20
   Gas and Power demand and supply capacity in Gisborne ........................................................... 26
   Energy demand from expanded primary processing .................................................................... 27
   Overall energy supply and demand .............................................................................................. 35
Discussion ........................................................................................................................................ 37
Conclusions ...................................................................................................................................... 40
Further work ..................................................................................................................................... 42
Acknowledgements .......................................................................................................................... 43
References ....................................................................................................................................... 44
Appendix A – GIS biomass supply model methodology .................................................................. 46
Appendix B – 140 km transport working circle for Matawhero ......................................................... 47
Appendix C - Gisborne and Wairoa wood processors ..................................................................... 49
Appendix D – Log prices .................................................................................................................. 50
Appendix E - GHG emissions by energy unit for different fuels (kg CO2e per GJ) .......................... 51
Appendix F – Heat and electricity demand for different wood processing options .......................... 52
Appendix G - projected forest harvest by small and large owners ................................................... 53
Appendix H – potential material flows between processing types ................................................... 54

                                                                        6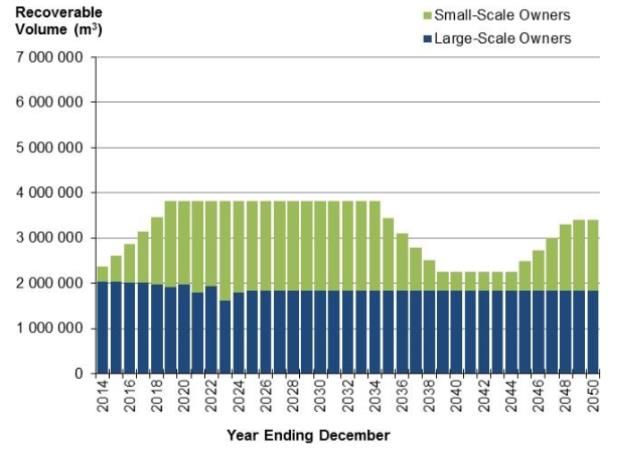
Glossary
AD           Anaerobic digestion (used to extract energy from wet organic wastes)
CHP          Combined heat and power plant – can produce heat and electricity simultaneously
CLT          Cross laminated timber
Chip         Wood chips, can be derived from pulp logs or from the slabwood (outer wood) on a
             sawlog produced during primary breakdown of the log
Glulam       Glue laminated timber – often large dimension structural elements; beams and joists
GDP          Gross domestic product
GIS          Geographic information system
GJ           gigajoule (unit of energy – for context 1 green tonne of wood at 58% moisture content
             = ~6.9GJ)
FMAG         Forestry Ministerial Advisory Group
Fish-tails   uneven shaped pieces of veneer produced from the outer part of a log when it is rotary
             peeled
LVL          Laminated veneer lumber
kWh          kilowatt hour
M            Million
MC           Moisture content (the % of the weight of wood that is water, calculated on the wet
             weight of the wood
MDF          Medium density fibre board
MPI          Ministry of Primary Industries
MWW          Municipal wood waste
MSW          Municipal solid waste
MW           Mega Watt
MWe          Mega Watt electrical energy
MWth         Mega Watt thermal energy
NEFD         National exotic Forest Description (annual publication from MPI)
odt          oven dry tonne
OEL™         Optimised Engineered Lumber (sawn and laminated structural wood product)
OSB          Oriented strand board (a panel product made form large flakes of wood)
p. a.        per annum
ICE          Internal combustion engine
m3           Cubic metre
IRR          Internal rate of return
ROCE         Return on capital invested (a measure of profitability)
RA ROCE      Risk adjusted return on capital invested (accounts for variability over time in factors
             such as product price, feedstock costs etc.).
Round-up     See fish-tails, both terms are used within the wood processing industry
Reman.       Remanufactured lumber (sawn lumber, kiln dried and then processed into a range of
             finger jointed and moulded wood products.
WAF          Wood Availability Forecast (published by MPI, approx. 5 to 6 years apart).

Log grades (outline only)
Pruned      large diameter logs with clear wood from pruning; p1, P2 and export P
S           Medium to large diameter logs with small knots (S1, 2 and 3)
A           Medium to large diameter log with medium sized knots
K           Small to medium diameter logs with large knots (K, Ki, KS and KIS)
Pulp        Small to large diameter logs, with large knots, and other defects (kink, wobble etc).

                                               7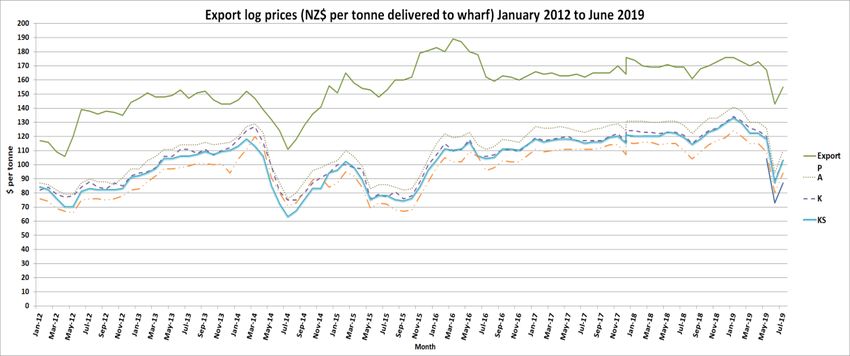
Introduction
Scion has been contracted by Te Uru Rakau on behalf of the Forestry Ministerial Advisory Group
(FMAG) to analyse the potential for the use of wood-based bioenergy in expanded and integrated
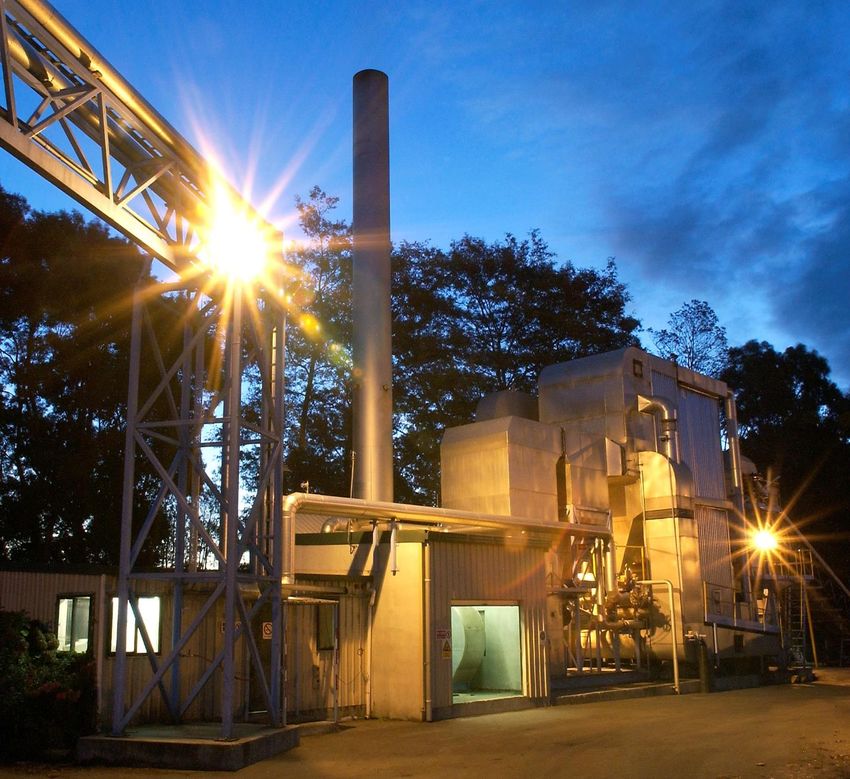
primary processing in the Gisborne region. Due to the nature of the territorial authorities’
boundaries in relationship to the logical wood supply catchment for Gisborne, the Wairoa district
will be included in the analysis (Figure 1). If a 140 km road transport distance limit is applied
(approximately a 100 km straight-line) virtually all the Gisborne Region and Wairoa District fall
within a viable transport distance (Appendix A).
Figure 1a – Map of Gisborne region and Wairoa district forests (red dot indicates Matawhero
location)
Gisborne
Wairoa
8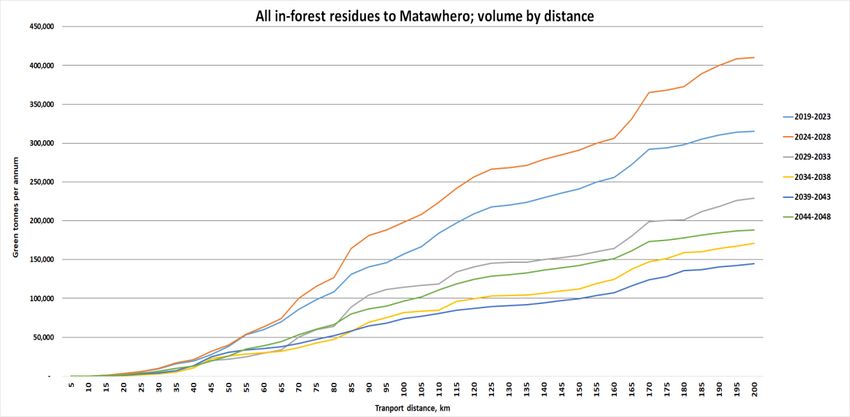
Figure 1b – current location of log yard, sawmill and meat works on industrial zoned land near
Matawhero south of Gisborne city, suggested site for wood processing expansion.

                                                        Meat works

                                                              800 metres

            Log yard

                                                          Sawmill &
                                                          WET Ltd

This study is a follow-on to the previous Scion study for the FMAG earlier in 2019 (Hall et al)
looking at processing options to increase the use of post-harvest in-forest residues on the East
Coast. It is also aligned with work on use of in-forest residues for heat and power on the Gisborne
Region for Eastland Community Trust (Hall and Palmer, 2019) and with the Gisborne Regional
study completed for the Wood Energy Industrial Symbiosis study (Alcaraz and Hall 2018, Hall et al,
2016).

The processing location being considered is at Matawhero, a few kilometres South-west of
Gisborne City where there is a developing wood processing cluster; sawmill, OEL™ plant and a
central processing log yard, along with another wood processing site (Juken NZ; LVL and saw mill)
four kilometres away and a meat works around 800 metres away from the sawmill noted in Figure
1b. Other primary processors and expansion of the existing sites are both possible.

Plantation forest area in the Gisborne region is 156,500 ha and the Wairoa district has a further
55,000 ha. Of this area, 97% is in Radiata pine and this report focuses on that species. Together
these areas are 12% of New Zealand’s total plantation estate.

The Gisborne region and Wairoa District together have a significant quantity of logs potentially
available for on-shore processing as the current and long-term wood availability is substantially
more than current processing demand of around 225,000 m3 per annum of a mix of log grades
(Appendix B).

The historic and current log export volumes from the port at Gisborne are shown in Figure 2.
Current exports are ~ 2.6M m 3 per annum.

                                                9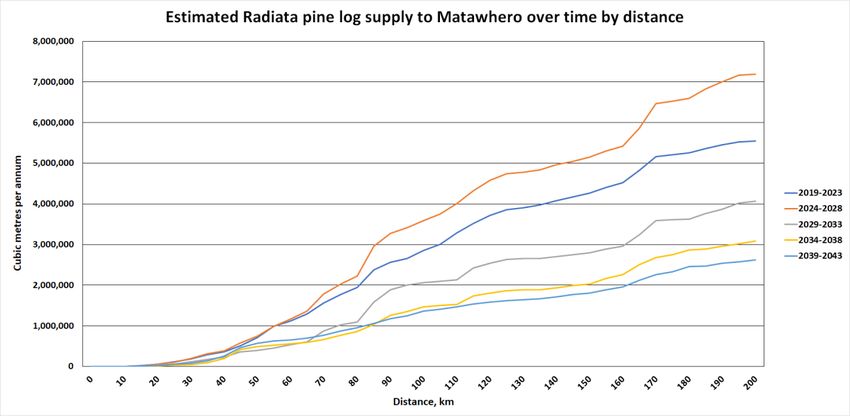
Figure 2 – Gisborne log export volumes (MPI website; July 2019)

The log exports at 2.6 M m3 per annum represent a large part of the estimated Gisborne / Wairoa
wood availability (Figure 3).

Wood availability varies over time and the long run availability of wood (Figure 3) dictates the scale
and type of wood processing that can be developed.

Figure 3 - Gisborne wood availability forecast (MPI, scenario 3)

The wood supply currently going out as export logs represents a wood processing opportunity of
over 2.0 million cubic metres per annum when long run wood supply is considered.

Some of the Wairoa District plantation forest resource is very close to the Gisborne region boundary
and is closer to Matawhero than the next major wood processing centre at Whirinaki (just north of
Napier). It is also closer to the port at Gisborne than the port at Napier (Appendix A).

The estimated wood supply from the Wairoa region is shown in Figure 4. The Wairoa wood
availability is highly variable over time.

                                               10
Figure 4 – Wairoa district wood availability projection (MPI, NEFD, 2018)
Log prices have a significant impact on the profitability of wood processing and in the month that this
study commenced there was a significant drop in log prices (Appendix C). The duration and depth of
the log price drop cannot be predicted, but the downwards movement in the price of saw logs (June
/ July 2019) was approximately NZ$30 per tonne delivered to wharf or mill. In many cases this is a
drop of around 25%. It is worth noting that whilst the export log prices dropped noticeably in June,
domestic log prices have not followed this movement, and have remained steady for now. These
drops in price do not greatly affect the financial analysis results as the log prices used are long run
averages.
Long run average export log prices (for the last 7.5 years) are 11% lower than they have been for
the last 12 months.
This study will also take into consideration limits on energy (coal, gas and electricity) supply into the
Gisborne region as well as government targets and aspirations (MBIE, 2019);
- transitioning to a low emissions economy by
o improving energy efficiency
o moving away from fossil fuels (particularly in process heat)
- regional growth
A critical issue when trying to align expanded primary processing and low emissions is to make sure
that where possible new processing plant use low emissions fuels such as wood processing residues
or post-harvest in-forest residues. Wood has the lowest GHG emissions of any other heat fuel on a
unit of energy basis (Appendix D).
11Methods
Regional wood supply
Regional wood supply (including in-forest residues) was summarised based on;
- data from the Ministry of Primary Industries wood availability forecasts (MPI, 2014),
- the 2017 National Exotic Forest Description (NEFD, MPI, 2018),
- log grades produced by regime (PradCalc_V4.0 Pro) and age and age class data by regime from
the 2018 NEFD
- Scions recent report on wood energy industrial symbiosis opportunities in the Gisborne region
(Hall et al 2018),
- and work conducted for the Ministry of Primary Industries on means to deal with the wood residue
issues on the East Coast (Hall et al, 2019).
These data are presented to give context to the scale of the opportunity and underpins the biomass
supply modelling.
Wood processing demand
Wood processing demand was summarised from Scion’s wood processing database. This dataset
was compiled for the WoodScape study (Jack et al, 2013) and has been maintained (updated and
expanded) since then. It contains information (size, type and location etc.) on 228 wood processing
sites across New Zealand. It is not considered to be 100% complete when considering smaller
wood processors such as joinery factories and post yards etc. However, it does contain data on all
the larger operations and many of the small ones.
Log exports
Log export data was derived from the data provided on the Ministry of Primary Industries website
(MPI, 2019) on quarterly forest products trade, which includes data on log exports by port.
Biomass supply modelling - Wood supply to Matawhero
The supply of logs to the Matawhero site was estimated using the biomass supply model as
outlined above and cross-checked against the regional wood supply data from MPI.
In-forest residues supply to Matawhero
The supply volume and costs of post-harvest in-forest residues was derived from the biomass
supply model data using up-to-date transport and handling costs.
New wood processing opportunities
The WoodScape model was used to determine potentially profitable wood processing opportunities
for mills based at Matawhero, operating on the scale and type of log supply identified as being
available in the Gisborne region and Wairoa district.
The WoodScape model (Figure 5) was developed as part of the WoodScape study conducted by
Scion for Woodco (Jack et al, 2013). The model is a tool for comparing the potential financial
performance of wood processing options off a common basis. It currently includes 146 wood
processing options (68 different technologies, some with scale variations of the same base
technology). It covers a wide range of wood processing, from pulp mills (Kraft and thermo-
mechanical) to sawmills (with a wide range of types and sizes), secondary solid wood processing
(CLT and remanufacturing) engineered wood products (Plywood, LVL, OEL™ etc.) reconstituted
panel products (MDF, particle board, OSB etc.) and a number of bioenergy products including,
12wood pellets, bark briquettes, combined heat and power plants and liquid fuels from woody
biomass.
The model compares the different processes where all the key inputs (labour rates, interest rates,
exchange rates, labour costs, energy prices etc.) are the same across all processing options.
There are several financial metrics calculated, including; return on capital employed (ROCE), risk
adjusted ROCE (RA ROCE), and internal rate of return (IRR). The initial comparison is with RA
ROCE, expressed as a percentage, which is a measure of profitability. For context, the higher the
RA ROCE number the better – for a new plant a RA ROCE of 10% for an established technology
and 20% for a new technology would attract investor interest.
Key drivers of the financial returns of wood processing plants are feedstock cost and yield of
product along with capital cost and the product sale price, which can be affected by exchange rate
as export markets are assumed for many of the wood products (but not for heat and power).
The RA ROCE values are not the last point in the financial analysis, but the first. ROCE is a means
of identifying opportunities that are worth more detailed analysis. The sensitivity of the ROCE of the
different processing options to variations in feedstock and product prices are calculated.
The model does not optimise or deal with wood resource calculations and requires that the user
filter out inappropriate options, based on their knowledge of the type and scale of wood resource
available. Market knowledge (size, location, product type and price) is also important.
Key financial parameters in the model;
Discount rate; 8%
Plant life; 20 years
Forex rate; NZ$1 = US$0.69
Interest rate; 11%
Log prices = 7-year averages + sensitivity based on 2019 log prices
Figure 5 – diagram of WoodScape model structure
13Mill energy demand
The energy demands (heat and power) of mills of various types and scales were estimated based
on industry data used in the WoodScape model which contains data on the consumption of heat
and electricity for a wide range of wood processing operations (Appendix E). The figures for
consumption of heat are for the fuel consumption, not the boiler output.
New non-wood primary processing (meat, fruit etc) and its energy demand.
Scion was advised that there was potential for expansion or development of other primary
processing (non-wood) at Matawhero. Consultation with Eastland Group, Gisborne District Council
and others was conducted to determine the scale of these operations, their heat and power
demands and their ability to align with the wood processing expansion.
Power and gas supply
Eastland Group and the gas distribution company were consulted regarding the ability of expanding
the lines and pipeline infrastructure to meet the expanded demand for heat and power at
Matawhero.
Results
Wood supply
The gross supply of Radiata pine to Matawhero Is shown in Figure 6. This data has had no
smoothing applied to it so the variation over time (the different lines on the graph) is substantial
Figure 6 – gross wood supply to Matawhero from Gisborne and Wairoa districts.
The combined wood supply from the Gisborne region and Wairoa district, projected forward to 2050
is shown in Figure 7. This data has had the smoothing of supply (MPI wood availability forecast
scenario 3).
14Initially, the wood available in Gisborne / Wairoa is around 5.0M m 3 per annum. However, this drops
to around 3.3 M m3 per annum between 2035 to 2040, after which it increases again. The data in
Figure 7 is a combination of MPI wood availability forecast for Gisborne and NEFD 2018 for Wairoa,
with averaging across 3 lustrums of the NEFD data for Gisborne. The data in Table 4 gives slightly
different total volumes, as the data is all derived from the 2018 NEFD and the same simple averaging
to get some smoothing. The NEFD data had to be used in Table 5 to derive sawlog grade splits.
Figure 7 – Gisborne and Wairoa wood availability projection
*dotted red line represents 2019 wood processing demand in Gisborne and Wairoa (225,000 m 3 per
annum)
Wood processing demand
Clearly there is a significant wood processing opportunity as there is only a small amount of the total
wood available in the Gisborne / Wairoa area that gets processed there (Table 1, Appendix B). There
are only around 40,000 m 3 per annum of saw logs processed in the Wairoa region. The Wairoa
district produces in the order of 900,000 m3 per annum in the long term, of which over 700,000 is
sawlogs and the rest pulp grade.
In the Gisborne region there is in the order of 1.8M m3 per annum of sawlogs over the existing
demand in the long term, including allowing for the dip in supply from 2033 to 2047. The excess
wood supply is higher than this now, but when considering wood processing expansion, the wood
supply over 20 to 30 years needs to be considered.
Table 1 – log volume by grade (approximate) processed in the Gisborne region.
Log Grade m3 per annum
Pruned 65,000
S 95,000
A 35,000
K 25,000
Posts etc 5,000
Pulp -
Total 225,000
Other species
15Whilst this report focusses on processing of the Pinus radiata resource it should be acknowledged
that there is a small volume of non-radiata species available (Figure 8). However, this resource is
variable over time and the mix of species changes. This material is best suited to a small sawmill
with secondary processing into higher value products.
These species include Douglas-fir, Cypresses, Eucalypts and other hardwood and softwood
species. The log supply volumes were estimated from the MPI national exotic forest description
(2018) which provides area and age class for plantings of these species. If it was determined that
these species could be used profitably in wood processing, then further plantings would help with
stabilising the wood supply. The total long run supply of non-radiata species is in the order of
40,000 m3 per annum. This volume could potentially be processed by a sawmill that is also taking
radiata. It seems unlikely that these species will be a major part of the wood processing sector in
Gisborne over the next 30 years.
Figure 8 – log supply non-radiata species in Gisborne and Wairoa
However, other studies have not shown Douglas-fir, Cypress or other hardwoods to be either
suitable for growing in the Gisborne region, or particularly profitable for anything other than very
small-scale processing. Some Eucalypt species have potential but require slow and careful drying
to avoid degrade of the sawn lumber.
Afforestation to support long term wood processing
Without stable long-term wood supply, investment in primary solid wood processing (PSWP) and
associated downstream (secondary) processing will be less likely to occur. Given the reduction in
supply in Gisborne (around 2035), the ability to have a greater amount of wood processing
established in Gisborne is in part limited by the long run maximum supply.
When looking at options as to what forest growing regime to use to fill in the gap in wood supply,
one of the important drivers is when the wood is required to make up for the decline in supply from
existing plantings. At a national level this is around 2035 (17 years from now). Traditionally a
radiata sawlog regime is around 28 years, this would not see expanded wood supply available until
2046, around 10 to 12 years too late to smooth out wood supply and support new processing.
However, there are plenty of examples of harvests of radiata pine at much earlier ages, with export
log markets having taken logs from stems as young as 20 to 22 years.
16A regime that provides wood in 16 to 17 years, would be considered non-traditional, but has been
described by West (2018a and 2018b). This would give expanded supply in the period where there
is a drop off in supply. Potentially, this regime (Ultra) can supply a range of log grades, including S
grade, with the bulk of the harvest being sawlog grades with ,10% pulp (assuming the KIS grade
market is present). This regime would also be flexible. It has a low initial stocking (500 stems per
ha) and this means it could be grown on to a much older harvest age (25) without significant risks
and issues.
The yields of logs by grade for the Ultra regime are shown in Table 2. Note – there are no pruned
logs in this regime – the rotation age is too short to consider pruning.
Table 2 – Log grades and volumes produced by Ultra regime.
Total S grade A grade K grade Chip grade
merchantable volume volume volume volume
Region volume m3 per ha m3 per ha m3 per ha m3 per ha
m3 per ha
East Coast 688 436 62 149 41
Wairoa 502 324 10 136 32
The area of planting required (and when it is required) to stabilise the Gisborne region wood supply
at 3.5M m3 per annum is shown in Table 3. Table 4 shows the planting required to stabilise the
Radiata pine wood supply in the Wairoa district at around 1.0M m3 per annum.
Table 3 – area of planting required to stabilise Radiata pine log supply in Gisborne
Year Area, ha
2019 1,033
2020 1,438
2021 1,805
2022 1,805
2023 1,805
2024 1,804
2025 1,804
2026 1,805
2027 1,475
2028 1,113
2029 717
2030 281
2031 151
Total 17,306
Table 4 – planting required to stabilise Wairoa district wood supply
Year Area, ha
2020 770
2021 770
2022 770
2023 770
2024 770
Total 3,850
This potential for expansion in wood supply is not considered in the wood processing analysis as
the resource does not exist.
In both Gisborne and Wairoa, the planting schedule could be front loaded to give more flexibility in
harvesting age.
Other species
17To alleviate variation in the supply of other (non-radiata) species there would need to be plantings
of around 100 ha per annum, for 25 years.
Wood residue supply
Note – for all the costs in this section it should be noted that the costs are estimates based of
productivity in published studies and New Zealand based costing of machines and systems. There
are few of these systems operating in New Zealand and benchmark prices are hard to obtain.
There may be a difference between the cost of a system and the price that a contractor wishes to
be paid. Actual costs of delivered fuel may vary by +/-10 to 15% with more upside risk.
Volumes of post-harvest residues by distance from Matawhero are shown in Figure 9. At a
transport distance of 85 km, there is consistently around 50,000 to 100,000 green tonnes per
annum likely to be available.
Figure 9 – Volume of all in-forest residues by distance to Matawhero
For these residues the cost by transport distance is shown in Figure 10. For a transport distance of
85 km, the delivered cost is around $60 per tonne. As the size of the demand rises, the average
delivered cost rises.
Figure 10 – volume weighted cost of residues delivered to Matawhero
18The data on volume and costs by distance can be combined to develop cost supply curves for each
of the time periods assessed. The costs supply curves for in-forest residues delivered to
Matawhero are shown in Figure 11.
The data in Figure 11 shows that for a demand of 50,000 green tonnes per annum the delivered
cost will vary over time between $58 and $60 per green tonne. For a larger demand, say 100,000
green tonnes per annum, the costs rise and the variation over time is greater; between $62 and
$70 per green tonne with the highest cost around 2034 to 2038. The higher cost for a set volume in
certain time periods is due to changes in total forest harvest available in that period. This is due to
the age class distribution of the forests, which means that to meet a specific demand the working
circle and transport distance must increase or decrease. Generally, the age class distribution is
uneven, with a peak in supply around 2024 to 2028.
Figure 11 - All in-forest residues to Matawhero; cost supply curves
For pulp logs the cost supply curve for material delivered to Matawhero is presented in Figure 12.
This data suggests that a volume of 100,000 tonnes could be available for a cost of $58 to $62 per
green tonne.
Figure 12 – Cost supply curves for pulp logs delivered to Matawhero
The principal barriers to use of in-forest harvest residues are the delivered cost of the material and
concern from potential users over its consistent availability.
19WoodScape analysis of wood processing options
Log supply by grade
For the WoodScape modelling to make practical sense the long run available wood supply by log
grade needs to be considered and is summarised in Table 5. The long run total log availability is
~3.0 M m3 and current processing demand is 0.225M m3 p. a, mostly pruned S grade and A grade.
Of the existing processing, 40,000 m 3 (pruned and S grade) is in Wairoa, which is in the Hawkes
Bay region / MPI Wood supply region. Therefore, the maximum primary solid wood processing
opportunity is 2.775 M m 3 per annum.
Table 5 – long run supply of logs in Gisborne and Wairoa by grade
Grade 2018 - 2022 2023 - 2027 2028 - 2032 2033 - 2037 2038 - 2042 2043 - 2047
Pruned 769,000 1,111,000 1,030,000 730,000 496,000 643,000
S 1,235,000 1,282,000 1,435,000 1,639,000 1,001,000 905,000
A 889,000 1,128,000 1,154,000 1,153,000 680,000 675,000
K 588,000 715,000 756,000 792,000 474,000 454,000
Pulp 725,000 677, 00 873,000 1,208,000 675,000 491,000
Total 4,208,000 4,915,000 5,251,000 5,524,000 3,328,000 3,170,000
*derived from 2018 NEFD data and PradCalc4.0
When the current demands by grade (Appendix C) are accounted for the volume of logs by grade
available in the long run can be estimated. There are significant processing opportunities in all log
grades. Increased capacity to process the following grades would be viable in the region:
Pruned; 350,000 m3 p.a.
S; 750,000 m3 p.a.
A; 600,000 m3 p.a.
K; 400,000 m3 p.a.
Pulp; 450,000 m3 p.a.
Bark; 75,000 green tonnes p.a.
In-forest residues; 100,000 m3 p.a. (~$66 per green tonne)
Note – these volumes are the gross supply and are indicative of the supply. There will be
competition for these logs from exporters and processors in adjacent regions. Not all of it will
necessarily be available to local processors.
Residues (wood processing and post-harvest in-forest) need to be considered both as a fuel and
as a potential feedstock.
There has been a change in the ownership structure of the log harvest in the Gisborne region in the
last 5 years (Appendix G; MPI 2015) with more of the cut coming from small owners. The cut from
large owners is estimated to remain relatively consistent at just below 2.0M m 3 per annum out to
2050. The cut from small owners was predicted to rise markedly in the last 5 years and was
estimated stay at around 1.8M m3 out to around 2035, at which point the supply from small owners
is expected to decline.
It is assumed that the large primary mills have long term wood supply agreements in place with
major forest growers. Without these finance for the mill development would be difficult to obtain.
20Wood processing opportunities
WoodScape
The WoodScape analysis, when Monte-Carlo risk adjustment was used, identified 22 wood
processing options that had a risk adjusted return on capital employed (RA ROCE) over 10%
(Figure 13). For a new plant to be an attractive investment the RA ROCE would preferably be over
20%. There are 14 options that fall into this category. In both groupings there are a mix of primary
(sawmill, MDF mill) and secondary (CLT, remanufacturing) processors
There is also a need to consider the interactions between mills. For a sawmill to be viable it needs
an outlet for its chip. The slab wood chip can be 25 to 30% of its output by volume and without a
market for this material the mill will not be financially viable.
Further, plants such as MDF mills, particle board plants and pulp mills are typically more viable at
larger sizes and they can take sawmill chip as well as logs. Therefore, where possible co-locating a
chip user with a sawmill will enhance both operations.
The pulp log supply on the East Coast is insufficient to support a pulp mill of economically viable
size and MDF has an attractive ROCE at a size where it can be viable using the pulp logs and the
chip residues from large scale sawmilling. This balancing of what mills are viable and what is
required to make a viable cluster is assessed external to the model.
For the value add operations such as CLT and remanufacturing to possible there needs to be a
sawmill to create the lumber that is their feedstock. They are also low in energy demand and
comparatively high in production of residues such as shavings. There needs to be an outlet for
these to avoid dumping costs, and comparatively high energy input mills such as LVL, MDF and
particle board need and can take these materials as heat fuels. In the case of particle board, some
of it could be feedstock as well as fuel.
Figure 13 – Risk adjusted return on capital employed (RA ROCE) for selected wood processing
operations1
1 The risk adjusted ROCEs presented in this analysis are intended to be used as a comparison
across a range of wood processing opportunities within the study. They are not intended to be used
for making investment decisions. The future earnings of the processing options identified will be
affected by variation in key inputs such as log price and product price. Earnings over the lifetime of
the plant will vary and the data here is indicative, not absolute. For investments, further more
detailed analysis of some the options identified will be required.
21Based on the wood resources available and the RA ROCE’s in Figure 13 potentially profitable
wood processing options were identified (Tables 6 and 7). Table 6 covers primary solid wood
processing. Table 7 covers secondary wood processing where material e.g. (lumber) from the
primary processors such as sawmills are further processed into higher value products (e.g. CLT).
The RA ROCE considers the variation in log prices, exchange rate (and therefore product prices).
The assumption is that all the product made will be exported.
Table 6 – financial metrics for the selected primary processing options
Mill Type In-feed Scale; log Scale; RA RA IRR Area,
in m3 per product out ROCE ROCE % Ha
annum m3 per % %
annum Long 2019
run** ***
LVL Pruned 400,000 220,000 20 19 11.1 12
logs
Large Structural S grade 750,000 425,000 12 8 5.3 22
& Appearance logs
sawmill
Industrial A grade 400,000 210,000 16 13 6.7 8
sawmill logs
OEL™ (multiple K grade 300,000 171,000 27 25 15.3 8
modules) logs
MDF Pulp logs 250,000 32 31 17.6 26
and saw
400,000 *
mill chip
Total 2,250,000 1,276,000 76
*this mill also takes 340,000 m3 of log equivalent in the form of sawmill chip
** 7-year average log prices
*** 2019 log prices
Table 7 - financial metrics for the selected secondary processing options
Mill Type In-feed Scale; log in Scale; RA IRR Area,
m3 per annum product out ROCE % ha
m3 per %
annum
CLT Lumber 140,000 119,000 31 17.3 4
Remanufactured Lumber 132,000 99,000 29 17.0 4
Glulam Lumber 18,200 18,000 22 12.7 1
Total 290,200 236,000 9
Given the resources available in the various log grades there is an opportunity to have a cluster of
wood processing operations. The various operations have different heat and electrical energy
demands (some have excess residues, and some do not) and some (sawmilling) enable secondary
processing (CLT etc.). Based on the RA ROCEs several possible cluster scenarios were
developed.
Five scenarios for expanded wood processing were considered;
1. WSI. A large cluster with near the maximum volume possible based on the long-term wood
supply; 2.1 to 2.3M m3; a mix of engineered products (LVL), sawmilling and reprocessed lumber
(CLT etc). Near the limit of the maximum wood supply (Table 8).
2. Industry Example. 1.19M m3 per annum. Smaller volume than WSI with high energy demand low
residue producing processes (OSB and MDF) prominent as well as sawmilling.
22These first two clusters proved to problematic based on size (WSI) and energy intensity (Industry)
so the following two clusters were developed and assessed.
3. WSII. A smaller cluster with a significant amount of secondary wood processing (CLT and
Remanufacture), like the large cluster, but without the large LVL plant, includes a large MDF plant.
4. WS III. A smaller cluster with a significant amount of secondary wood processing (CLT and
Remanufacture), like the large cluster, but without the large LVL plant, includes a medium sized
OSB plant.
5. Smaller / staged development. Starting with three OEL™ modules followed by a large sawmill
aligned with secondary processing. The third stage (MDF) would depend on the ability / viability of
exporting sawmill chip via road, rail or barge to other regions or to the port at Napier.
Table 8 – capital weighted RA ROCE of the WSI cluster
Mill Log in; m3 Capex; $M RA ROCE RA ROCE
per annum % current log
Long run price
log price
LVL Large 400,000 120 20 19
Large structural and Appearance 750,000 85 12 8
sawmill
Industrial sawmill 400,000 54 16 13
OEL™ (multiple modules) 300,000 78 27 25
MDF 400,000* 220 32 31
CLT 140,000** 162 31 31
Remanufactured 132,000** 110 29 29
Glulam 18,200** 20 22 22
Capital weighted RA ROCE 25 23
*does not include 340,000 m 3 of log equivalent as sawmill chip
**as lumber
There is potential for further expansion of secondary processing such as CLT and
Remanufacturing based on the volume produced by the sawmills, but we did not wish to be
excessively optimistic given;
- that CLT is still an emerging product
- the secondary processes are labour intensive, and the number of new employees required would
already be substantial (Table 9). The direct employment of skilled labour is estimated to be 1427
people. The flow on effect into indirect and induced employment suggests a further 2240 jobs and
a total impact on employment of 3540. Given that the total population of the Gisborne region is
43,656 (StatsNZ) and Gisborne city is estimated at 37,800 in 2018
Expansion of the secondary processing would improve the capital weighted RA ROCE. It would
also generate more residues to feed back into the energy system for the whole cluster.
Table 9 – GDP and employment of the WoodScape derived cluster
Mill Direct Indirect & Total GDP $M
employment Induced Employment per annum
employment
LVL Large 244 410 654 $217
Large structural & Appearance sawmill 195 327 522 $129
Industrial sawmill 70 98 168 $59
OEL™ (multiple modules) 81 135 216 $127
MDF 109 183 292 $482
CLT 160 135 295 $254
Remanufactured 540 906 1446 $128
Glulam 28 46 74 $45
Total 1427 2240 3540 1441
23The sensitivities of the RA ROCEs of the various processing operations to a 5% change in a range
of cost factors are shown in Figure 14. These factors are; capital costs, energy costs, labour costs
product price and feedstock cost. Product pricing is a major consideration for all mills and
feedstock cost is has the second greatest impact for many; Reman., CLT, structural and industrial
sawmill).
The movement in ROCE is an actual change in the ROCE, not a percentage of the percentage.
That is if a technology has a ROCE of 20% and sensitivity of 7% to a change of 5% to an input the
expected range would be 13 to 27%.
Figure 14 – ROCE sensitivities
There is also enough potential log supply for a plywood mill (industrial grade) taking 400,000 m 3
per annum of logs. However, this pushes the total log demand very close to the upper limit of the
log supply. Plywood is also a high energy intensity processing option. It has a similar ROCE and
IRR to the LVL mill (22% and 12% respectively). It would add to employment (300) and GDP
$200M). It would have a net deficit of wood residues even for heat production and would require a
power plant of around 7MWe. This option was not included further because if a plywood mill this
large was added to the list of plants in Table 5, collectively it would be a very large cluster and it
would add to the issues around energy supply as it is not self-sufficient in heat fuel.
Current log prices are around 10% higher than the long run average. This means that the ROCEs
would drop by between 1 and 4% depending on the processing option (Table 8 and figure 14) if
current lo0g prices were used instead of the long run average. This highlights the need for the
sensitivity analysis and some assessment of the volatility in returns that can be expected in the
long and short term.
24Industry Example cluster
As a comparison to the WoodScape clusters we made an example proposed development which is
planned to be constructed in stages rather than all at once and looked at the expected financial
returns of the individual plants and the cluster overall.
The outline of possible processing operations includes;
- LVL mill, 240,000 m3 per annum log in
- OSB mill is added; 350,000 m 3 per annum of log in
- Sawmill is added; 600,000 m 3 per annum in
- MDF mill aligned with the sawmill to take its chip residues
We have specified an LVL mill as the returns appear to be slightly better than a plywood mill. The
RA ROCEs of the Industry example cluster wood processing cluster is shown in Table 10.
Table 10 - financial metrics for the Industry example processing options
Mill Type In-feed Scale; log in Scale; product RA IRR
m3 per out m3 per ROCE %
annum annum %
LVL Pruned 240,000 125,000 20 11
Sawmill S&A 600,000 342,000 12 5.3
OSB Pulp 350,000 203,000 20 9.0
MDF Saw mill Chip 180,000 69,000 15 7.8
Total 1,190,000 670,000
The Industry example cluster is shown in Table 11. It is lower than that derived for the larger cluster
described previously (25%). That cluster includes value added processing (CLT and
Remanufacture) of sawn lumber (Table 9).
Table 11 - capital weighted RA ROCE of the total Industry example cluster
Mill Capex; $M RA ROCE % RA ROCE %
Log run log Current log
prices prices
LVL 120 20 19
Sawmill 105 12 8
OSB 93 23 22
MDF 160 15 14
Total capex 478
Capital weighted RA ROCE 17 15
Figure 15 shows the RA ROCE sensitivities for the Industry example cluster. Product pricing is
again the most significant driver of change in the RA ROCE.
25Figure 15 - ROCE sensitivities Industry example cluster
The GDP and employment impact of the Industry example cluster are shown in Table 12.
Table 12 - GDP and employment of the Industry example cluster
Mill Direct Indirect Total GDP $M
employment employment Employment per annum
LVL 244 410 654 $217
Sawmill 156 261 417 $104
OSB 184 309 493 $115
MDF 87 146 233 $156
Total 671 1126 1797 $592
The critical differences between the Industry example cluster and the WoodScape derived one is
that the Industry cluster has only one sawmill and no secondary processing of the sawn lumber.
This limits the generation of spare residues and means it is more reliant on external sources of fuel.
The ROCE’s of the secondary processors are higher than those of the sawmills, and the inclusion
of these value adding options therefore has two major benefits; increased ROCE and greater
volumes of residues available to fuel the energy intensive board manufactures.
Gas and Power demand and supply capacity in Gisborne
The gas pipeline into Gisborne has spare capacity given current demands. This is in the order of
6MWth. The gas company supplying the Gisborne region has also indicated that the pipeline could
be upgraded, and after that the spare capacity could increase by up to 20MWth.
Electricity demand in Gisborne has seen little increase in the last few years. The closure of the
Juken New Zealand Ltd plywood mill would have reduced electricity demand by around 3 to 4
MWe.
Electricity demand in the Gisborne Region in 2016 was 55 - 56MWe. Maximum growth is expected
to be to 75MWe in 2026 (2.5% growth per annum).
The lines leading into Gisborne have capacity to deliver a further 10 to 12MWe. Demand beyond
that would require lines being upgrading. One option would be to conduct a line tightening exercise
26that would increase capacity by a further 10MWe, but only with expenditure in the order of $2M to
$3M.
The Juken New Zealand Ltd plywood mill closure implies a lines capacity into Gisborne of ~15MWe
which with the 10MWe from the lines tightening means spare capacity sufficient to deliver a further
25MWe without major new capacity being constructed.
Energy demand from expanded primary processing
Wood processing
An outline of potential material flows between different processing plants is shown in Appendix H.
Some of the processing (CLT etc.) is secondary and relies on a sawmill to provide it with raw
material. Different processes have different residual streams and these materials may include a
mix of; bark, sawdust, shavings, off-cuts, edge trim, breakage, sander dust and fishtails from log
peeling. All these residuals can be used as fuel to meet the heat and or power demand of the
processing operations. Sawmill slab chip is not considered to be a residual; it is a secondary
product and its sale is critical to the financial viability of the mill.
WoodScape cluster I (WSI)
The heat and electricity demand of the first WoodScape derived cluster (WSI, described in Tables
6 & 7) is shown in Table 13. This shows a deficit in heat fuel from wood processing residues of
around 267,000 GJ per annum. The 100,000 green tonnes per annum of in-forest residues would
more than meet this demand, as it would provide around 690,000 GJ.
The power demand is the equivalent of 24 MWe. In the first instance the use of wood residues
would be for meeting heat demand. However, consideration also needs to be given to use of
combined heat and power (CHP) units to provide a mix of heat and electricity.
The inclusion of secondary wood processing (CLT, Remanufacture and Glulam) helps with residue
supply / fuel demand balance as they have low heat demand and comparatively high residue
production.
Different wood processing plants have varying levels of residuals produced within the process and
different heat demands, the surplus numbers deficit indicate the position of each mill, and in total
for the cluster. A deficit in total means a cluster would have to import fuel from outside sources,
such as in-forest residues.
27Table 13 – supply and demand for heat fuel by mill
Mill type Heat Power Residues; Residues; Heat fuel
demand; demand; odt p.a. GJ p.a. deficit /
GJ p.a. kWh p.a. surplus;
(peak (peak GJ p.a.
MW) demand,
MW)
LVL 2,200,000 61,380,000 76,800 1,382,400 -802,240
(73MW) (7.3)
Large S & A 892,500 10,625,000 57,000 1,026,000 144,900
sawmill (50) (2.1)
Industrial sawmill 441,000 5,250,000 30,400 547,200 112,280
(27) (1.1)
OEL™ (3 530,100 16,758,000 55,200 993,600 474,540
modules) (32) (3.6)
MDF 875,000 108,250,000 20,800 374,400 -496,440
(29) (12.9)
CLT (2 modules) 64,260 2,261,000 8,400 151,200 88,620
(7) (1.0)
Remanufactured 53,460 4,059,000 13,200 237,600 186,780
(2 modules) (6) (1.7)
Glulam 9,720 342,000 1,893 34,070 24,729
(1) (0.2)
Total 5,066,040 208,925,000* 263,393 4,746,000 -266,831
(225) (29.9)
*equivalent to a power plant of around 24MWe
Industry example cluster
The Industry proposed wood processing cluster (Table 14) although smaller than WSI one above
has a larger heat fuel deficit as it has a mix of operations that generally have high heat inputs (LVL)
and lower residue production (OSB, MDF).
The Industry example cluster has a heat fuel deficit that is over 1.4M GJ; equivalent to 210,000
green tonnes of wood. This is challenging given the in-forest residue availability of 100,000 green
tonnes.
Table 14 - supply and demand for heat fuel by mill for Industry example cluster
Mill type Heat Power Residues; Residues; Heat fuel
demand; demand; odt p.a. GJ p.a. deficit /
GJ p.a. kWh p.a. surplus;
(Peak (Peak GJ p.a.
demand) demand)
LVL 1,250,000 34,875,000 46,080 829,440 -420,560
(41) (4.2)
Sawmill 718,200 8,550,000 43,200 777,600 59,400
(43) (1.9)
OSB 1,339,800 30,450,000 18,200 327,600 -1,012,200
(44) (3.6)
MDF 241,500 29,877,000 9,360 168,480 -73,020
(8) (12.4)
Total 3,549,500 103,752,000* 116,840 2,103,120 -1,446,380
(137) (22)
*equivalent to a power plant of ~19MWe
For these first two clusters (especially the Industry one) getting sufficient supply of energy,
particularly heat, is challenging and would require investment outside of the wood processing.
28Two slightly smaller clusters, WoodScape clusters II and III, which were less energy intensive were
examined to address the energy challenges observed in the WSI and Industry scenarios.
WoodScape cluster II (WSII)
WSII is a smaller cluster, with an overall lower energy demand. This is essentially the same cluster
as WSI without the LVL mill. LVL is energy intensive with high heat demand per m3 of product and
moderate to high electricity demand (Appendix E).
The financial, employment and GDP metrics for the WSII cluster are shown in Table 15.
Table 15 – financial metrics for WoodScape cluster II
Mill Type Log Capital ROCE % Capital Total GDP
volume in cost ($M) Long run weighted Employment $M p.a.
(m3 per log price ROCE %
annum) and
(2019)
Large S & A 750,000 85 12 (8) - 522 $129
sawmill
Industrial sawmill 400,000 54 16 (13) - 41 $59
OEL™ (3 modules) 300,000 78 27 (25) - 216 $127
MDF 400,000* 220 32 (31) - 292 $482
CLT (2 modules) 140,000** 162 31 - 295 $254
Remanufactured 132,000** 110 29 - 1446 $128
(2 modules)
Glulam 18,200** 20 22 - 74 $45
Total log intake 1,850,000 729 27.0 (25.8) 3,540 1,441
*MDF mill also takes 340,000 m 3 per annum of sawmill chip; ** Lumber not logs
The energy demands of the WSII cluster are shown in Table 16. This option has spare wood
residues remaining (535,400 GJ p.a.) after its heat demand is met. These residues, if used in a
CHP could create 8.5 MWe and 13 MWth. The cluster needs around 17MWe and this could be met
with the wood fuelled CHP and from the existing lines infrastructure. It would have spare heat to
provide to other users.
Table 16 – supply and demand for energy for WoodScape cluster II
Mill type Heat Power Residues; Residues; Heat fuel
demand; demand; odt p.a. GJ p.a. deficit /
GJ p.a. kWh p.a. surplus;
(Peak (Peak GJ p.a.
demand) demand)
Large S & A 892,500 10,625,000 57,000 1,037,400 144,900
sawmill (50) (2.1)
Industrial 441,000 5,250,000 30,400 553,280 112,280
sawmill (27) (1.1)
OEL™ (3 530,100 16,758,000 55,200 1,004,640 474,540
modules) (32) (3.6)
MDF 875,000 108,250,000 20,800 378,560 -496,440
(29) (12.9)
CLT 64,260 2,261,000 8,400 152,880 88,620
(7) (0.9)
Remanufactured 53,460 4,059,000 13,200 240,240 186,780
(6) (1.7)
Glulam 9,720 342,000 1,893 34,449 24,729
(1) (0.2)
Total 2,866,000 147,545,000* 186,893 3,401,449, 535,409
(152) (22.5)
* equivalent to a power plant of 17MWe
29You can also read