L-Gas Market Conversion Review - Winter Report 2021 Task Force Monitoring L-Gas Market Conversion - Rijksoverheid
←
→
Page content transcription
If your browser does not render page correctly, please read the page content below
L-Gas Market
Conversion Review

Winter Report 2021
Task Force Monitoring L-Gas Market
Conversion
L-Gas Market Conversion Review – Winter Report 2021

Foreword
This is the third edition of the report monitoring the conversion of the low calorific gas (L-gas) markets in Belgium,
France, Germany, and the Netherlands in order to reduce demand for Groningen gas. This report looks back on
the market developments through the previous Gas Year (2019/20) and looks forward to the coming gas years
with regard to the observed and expected demand for Dutch L-gas and conversion progress of gas installations.

The current report provides an update on the progress of the conversion programs, with a special focus on the
impact of the Covid-19 induced lockdowns in 2020 and on planned conversions through the Gas Year 2021/22.
The estimated volume effect of the 2021 conversions (40 TWh) is the highest of all gas years of the conversion
programme, due to the particularly high conversion rates in Belgium and Germany.

The report is compiled by the International Energy Agency (IEA), the European Network of Transmission System
Operators for Gas (ENTSOG), Gasunie Transport Services (GTS), and the Netherlands Ministry of Economic Affairs
and Climate Policy (Min. EZK), under the umbrella of the Task Force Monitoring L-gas Market Conversion,
consisting of government representatives, representatives of transmission system operators (TSO’s) and energy
market regulators from Belgium, France, Germany, and the Netherlands, and an observer from the European
Commission. The activities of the Task Force are supported by the Benelux Secretariat. The report is published
semi-annually. The Netherlands will use this report to inform the Dutch Parliament on the progress of reducing
the demand for Groningen gas.

                                                                                                                    1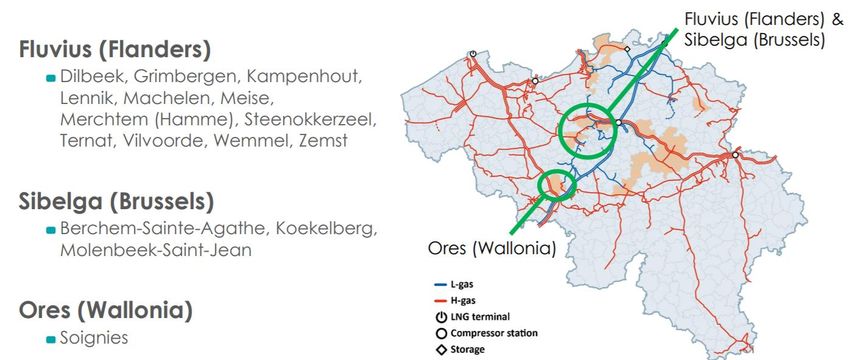
L-Gas Market Conversion Review – Winter Report 2021

Executive summary
The government of the Netherlands announced in March 2018 its decision to terminate natural gas production
from the Groningen field as soon as possible but not later than 2030, in order to guarantee safety in the area of
Groningen against the risk of earthquakes resulting from natural gas extraction.

The initial schedule for production phase-out - which aimed for termination in 2030 at the latest - was revised in
2019 following the adjusted advice of the State Supervision of the Mines after an earthquake occurred on 22 May
2019, with the objective of accelerating the termination by Gas Year1 (GY) 2022/23 for average weather
conditions. From mid-2022, gas from the Groningen field (Groningen gas) should only be needed in case of a
colder than average winter and in case of a severe disruption elsewhere in the L-gas system.

However the household appliances still need Groningen-gas in the Netherlands (max. Wobbe 44.4 MJ/m3) and
L-gas in Germany, Belgium, France (max Wobbe 46.5 MJ/m3). Without Groningen gas, so called “pseudo G-gas”
and “pseudo L-gas” is needed to secure the supply in the G- and L-gas market region.

Pseudo G-gas and pseudo L-gas can be principally produced as follows:

•   Pseudo G-gas:
        o   nitrogen is added to high calorific gas (H-gas) in order to bring down the Wobbe-value until it
            meets the upper Wobbe-limits of the G-gas specifications (44.4 MJ/m3); This gas quality is stored
            in the Dutch G/L-gas storages
•   Pseudo L-gas:
        o   nitrogen is added to high calorific gas (H-gas) in order to bring down the Wobbe-value until it meets
            the upper Wobbe-limits of the L-gas specifications (46.5 MJ/m3);
        o   enrichment: adding H-gas to pseudo G-gas until the upper Wobbe-limit of the L-gas specifications
            (46.5 MJ/m3) is reached.

Whilst Groningen gas production has halved from 341.8 TWh (or 35 bcm) in GY 2014/15 to 170.9 TWh (or 17.5
bcm2) in GY 2018/19, the production of pseudo G/L-gas more than doubled during the same period of time. This
trend accelerated through the GY 2019/20, as Groningen gas production more than halved year-on-year, falling
by 86.72 TWh year-on-year, from 171.12 TWh in GY 2019 to 84.4 TWh. Consequently, the share of pseudo G/L-
gas in total Dutch G/L-gas production grew from just above 30% in GY 2014/15 to close to 82% in GY 2019/20.
During the same period, the utilization rate of nitrogen blending facilities has increased steadily to average at
100% of firm capacity during the GY 2019/20. In the summer period (from May to September) pseudo G-gas is
used to inject into G-gas storages for usage through the heating season.

Pseudo G/L-gas is playing an increasingly important role in reducing Groningen gas production, with its share
expected to increase from 65% in GY 2018/2019 to close to 100% of G/L-gas produced in the Netherlands in GY
2022/23. Moreover, it is set to provide almost 95% of the upward production flexibility by GY 2022/23 necessary
to meet demand in a cold GY in the L-gas region. Nitrogen blending alone will account for over 87% of G/L-gas
produced in the Netherlands in GY 2022/23 and is expected to provide almost 85% of the upward production
flexibility necessary to meet demand in a cold GY.

Pseudo L-gas is exported to neighboring markets in Belgium, France and Germany, where it serves dedicated L-
gas consumers – who will be converted to other sources of energy, most notably H-gas, as a result of the
Groningen phase out.

The gas infrastructure operators of Belgium, France and Germany have made arrangements to undertake
extensive conversion programs, mainly switching L-gas consumers to H-gas, this to reduce the L-gas supply from
the Netherlands: by GY 2029/30, imports of L-gas will be reduced to nearly zero.

The current report aims to monitor the progress in L-gas conversion in Belgium, France and Germany and the
activities in the Netherlands to reduce the consumption of (pseudo) G-gas, as well as the overall security of
supply developments within the G/L-gas market region. It provides the analysis needed by the Min. EZK to decide
on the allowed Groningen production and to meet the requirements of the resolution of the Dutch Parliament to
be informed twice a year about the progress in reducing the demand for Groningen gas.

Consumption of L-gas from the Netherlands decreased by 5% (or 24.1 TWh) from 483.1 TWh in the GY 2018/19
to 459 TWh in the GY 2019/20 in the L-gas region. This has been primarily driven by the continued implementation
of the market conversion programs in the respective L-gas markets, which reduced demand for L-gas. In GY
2018/19 conversion totaled to 15.76 TWh, with 13.5 TWh taking place in Germany, 1.37 TWh in Belgium, 0.888

1
 A gas year (GY) starts on 1 October and ends on 30 September.
2
  Volumetric data is expressed in Normal cubic meters (Nm 3), under reference conditions of temperature (0 °C) and pressure
(101.325 kPa).

                                                                                                                         2
L-Gas Market Conversion Review – Winter Report 2021

TWh in France and 0 in the Netherlands. In GY 2019/20 conversion totaled to 21.22 TWh, with 18.1 TWh taking
place in Germany, 1.92 TWh in Belgium, 1.2 TWh in France and 0 in the Netherlands.

Worth to note, that the implementation of nationwide Covid-19 induced lockdowns in the spring of 2020 had a
significant impact on natural gas demand worldwide and in Europe. In the L-gas region Dutch L-gas and H-gas
consumption fell by 19% (or 13.3 TWh) and 16% (or 34.2 TWh) year-on-year respectively during April and May.
Besides the lower economic and industrial activity due to the lockdowns, stronger solar power generation (up by
30% year-on-year) weighed on natural gas consumption during that period.

In the ten consecutive years, between GY 2019/20 and GY 2029/30, combined L-gas exports from the Netherlands
to Belgium, France and Germany are expected to be reduced at an average rate of approximately 10% per year.3
Consequently, L-gas demand met with imports from the Netherlands is expected to fall from 43.6 TWh in GY
2019/20 to 0 in Belgium, from 37.92 TWh to 0 in France and from 151.9 TWh to 0.3 TWh in Germany 4 by GY
2029/30 both in an average and cold GY.

To make the transition successful, the following criteria should be met:

    •    the remaining L-gas demand is met with an adequate amount of L-gas supply, including pseudo L-gas
         production, and sufficient transport capacity to ensure security of supply at any time;
    •    H-gas supply to the Netherlands and the Northwest European markets needs continued monitoring as
         it is used as feedstock to produce pseudo L-gas;
    •    new nitrogen and conversion facilities come into operation without delays;
    •    there are no significant delays in converting appliances from L- to H-gas;
    •    the continuation of the Dutch TTF market structure (e.g. commercially one gas quality).

The Covid-19 induced lockdowns had only a minor impact on the overall schedule of the conversion programs. In
Germany, over 98% of the planned conversions have been executed in 2020. As foreseen in the Summer Report
of the Task Force, only an amount of 6,000 appliances (0.05 GW) out of 395.000 appliances have been
rescheduled from 2020 to 2021. In Belgium, due to the outbreak of the Covid-19 pandemic, delays in the works
carried out at TSO level and in the preparation activities at DSO level (amongst others the adaptation of household
pressure regulators) led to a postponement of the conversion to 1st of September instead of the 1st of June as
previously planned. However, this did not alter the initial conversion target for 2020. In France, the initial plan
for 2020 was the conversion of Dunkerque sector in October 2020 representing 42,000 customers and translating
into an annual consumption of 1 TWh under average weather conditions. The Dunkerque sector was successfully
converted on 27-28 October 2020 instead of 13 October as previously planned.

In 2021, over 900,000 of gas connections and appliances are expected to be converted in GY 2021/22 –the
highest number through the market conversion programme. The estimated volume effect of the 2021 conversions
(40 TWh) is the highest of all gas years, due to the particularly high conversion rates in in Belgium and Germany.
While the conversion areas are evenly distributed in terms of appliances per gas year for a large part of the
conversions, the resulting volume effect differs due to the regional distribution of industry and power plants with
a high gas consumption. Furthermore the high rates can be explained by optimization opportunities only possible
for specific areas in Belgium.

The analysis of the conversion programs, provided in Chapter 3 of the Report, shows an alignment with the
expected L-gas demand in each market and for each gas year.

To meet this declining L-gas demand against an even faster decreasing Groningen production, the Netherlands
will increase the production of pseudo L-gas, primarily by means of additional nitrogen blending.

Additional purchase of nitrogen allowed to expand the nitrogen blending capacity by 80,000 m3/h N2 at the
Wieringermeer conversion facility from 215,000 to 295,000 m3/h starting from 23rd December 2019. This
translated into an additional 48.9 TWh of pseudo L-gas production capability. Moreover, a new nitrogen plant at
Zuidbroek, planned to start operations from 1st of April 2022 with a capacity of 180,000 m3/h N2, will be able to
produce between 68 TWh to 97 TWh of additional pseudo L-gas. The outbreak of Covid-19 and consequent
lockdowns did up until now not have an impact on the commissioning date of the nitrogen plant as of September
2020.

However, the project slack has been exhausted. Uncertainty around the evolution of the Covid-19 and its
implications for the conversion planning and construction of the Zuidbroek facility remains a key risk. Due to the
current developments, there is a real risk of delay on the commissioning date of the Zuidbroek facility.

3
 GTS (2017), Netwerk Ontwikkelingsplan 2017.
4
 Please note that the remaining demand in the gas year 2029/30 (0.3 TWh / 100.000 kWh/h) is given by a regional grid in
Germany, that can only be supplied via the Netherlands (Haanrade / Thyssengas).

                                                                                                                          3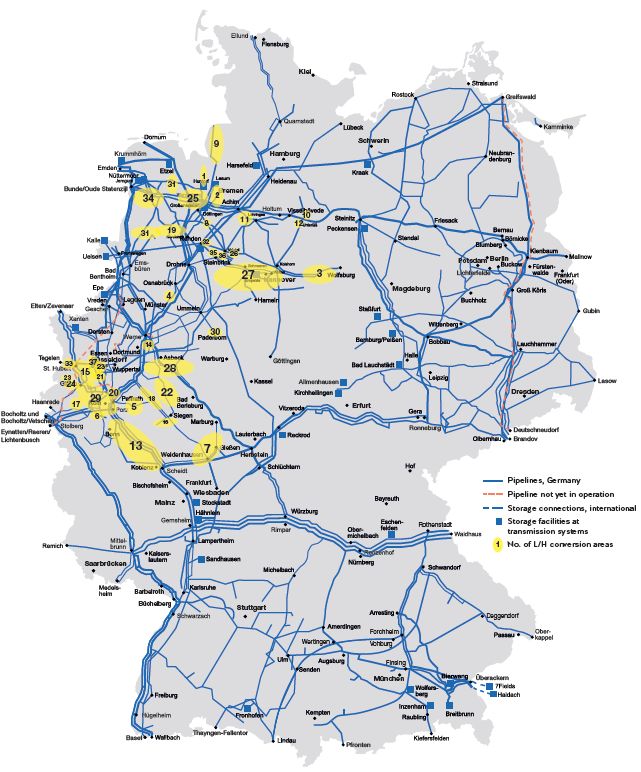
L-Gas Market Conversion Review – Winter Report 2021

The increase of H-gas conversion capacity via nitrogen blending in the Netherlands, the allowed Groningen
production and the market conversion from L-gas to H-gas in Germany, Belgium, France as well as in the
Netherlands will ensure the security of pseudo L-gas supply to consumers in all markets both in an average and
in a cold year.

GTS concluded in her advice of January 2021, that for the base case the minimum production from the Groningen
field is needed until GY 2025/2026. Based on the sensitivity analysis performed by GTS, a realistic bandwidth for
the closure of the Groningen field is between mid-2025 and mid-2028. The Government of the Netherlands wants
to close the Groningen field as quickly as possible. Alternatives for the Groningen field as a backup source for
security of supply are therefore being investigated. Anyhow, in the period 2021-2025 L-gas supply flexibility will
be entirely provided by the nitrogen blending facilities and the G-gas storages.

L-gas supply-demand balance projection in an average and cold year5 (GY 20/21-GY 29/30)

      600

      500

      400
    TWh

      300

      200

      100

          0
              20/21     21/22     22/23      23/24     24/25        25/26     26/27      27/28         28/29    29/30
                Groningen base              enrichment                   nitrogen blending              enrichment flex
                nitrogen flex               Groningen flex               Demand (average)               Demand (cold)

As a consequence of a declining domestic production and the subsequently growing need for H-gas to feed the
nitrogen facilities to deliver it as pseudo L-gas to L-gas consumers, the Netherlands almost doubled their H-gas
imports from 28.8 bcm (or 281.4 TWh) in GY 2013/14 to 57 bcm (or 556.9 TWh) in GY 2017/18. In fact, the
Netherlands became a net importer of natural gas in GY 2017/18 for the first time in the country’s history. Net
imports of natural gas rose by more than eight-fold since GY 2017/18 to reach 17.33 bcm in GY 2019/20 –
accounting for over 40% of the country’s total gas consumption.

Consequently, the security of L-gas supply is becoming intimately linked to the deliverability of H-gas into the
Netherlands.

Based on TYNDP2020 dataset, ENTSOG performed several additional disruption case calculations to investigate if
sufficient H-gas supply can be delivered to the northwest European markets in an average year and for high
demand situations. The results show that there is sufficient transport capacity during disruptions in an average
year. Compared to TYNDP2018 (disruptions) calculations the configuration at European level has improved thanks
to increased potential from suppliers (specifically extra LNG volume delivered to existing LNG terminals), new
import routes in Europe (see TYNDP2020), and the reduced gas demand in France and the UK. The planned
increase in capacity on the German/Dutch border raises the flexibility towards the Netherlands.

The L-Gas Market Conversion Monitoring Task Force will continue to monitor and assess the deliverability of H-
gas supply to the Netherlands and the Northwest European markets served by L-gas.

5
  In the case of Belgium and France, the demand profile for a cold GY has been calculated based on 1995-96 temperature
profile by GTS as stated in the Dutch Gas Act for the L-gas supply-demand balance of this Report. In the case of Belgium, the
preferred national approach is to consider the year 1962-63 as a cold year profile.The French regulation approach is requiring
to work with a 2% risk cold GY (using Lille weather data); leading to a demand profile national reference shared with the
French stakeholders, about 2% above the GTS’s figures.
.

                                                                                                                                 4
L-Gas Market Conversion Review – Winter Report 2021

                                                  Key findings
1.   Based on the received data of the expected consumers demand for Dutch L-gas in Germany, France and
     Belgium, and on the achieved results with regards to the market conversion in the three countries, GTS can
     make a detailed assessment of the necessary volumes of L-gas for the coming year and the years after that.
     As a result, a more precise assessment can be made of the necessary production from the Groningen field.

2.   Consumption of Dutch L-gas decreased 5% (or 24.1 TWh) from 483.1 TWh in the GY 2018/19 to 459 TWh in
     the GY 2019/20 in the L-gas region. This has been primarily driven by the continued implementation of the
     market conversion programs in the respective L-gas markets, which naturally reduced demand for L-gas. The
     analysis of the conversion programs, provided in this Report, shows an alignment with the expected L-gas
     demand in each market and for each Gas Year.

3.   Groningen gas production more than halved year-on-year, falling to 84.4 TWh in GY 2019/20. This has been
     possible due to higher L-gas production via nitrogen blending, which increased by over 26% and drove up the
     utilization rate of nitrogen blending facilities from an average of 90% through the GY 2018/19 to an average
     100% of their firm capacity during the GY 2019/20. The share of pseudo L-gas accounted for close to 82% of
     total Dutch L-gas production in GY 2019/20. Higher pseudo L-gas production was also possible with the
     expansion of the nitrogen blending capacity at the Wieringermeer conversion facility, starting from 23 rd
     December 2019. L-gas storage played a key role in allowing lower Groningen production, with net withdrawals
     increasing by 13.14 TWh year-on-year from -6.32 TWh in GY 2018/19 (when injection outpaced withdrawals)
     to 6.81 TWh in GY 2019/20. Net storage withdrawals met approximately one-fifth of the region’s L-gas demand.

4.   The Covid-19 induced lockdowns had only a minor impact on the overall schedule of the conversion programs.
     In Germany, over 98% of the planned conversions have been executed. In Belgium, due to the outbreak of the
     Covid-19 pandemic, delays in the works carried out at TSO level and in the activities at DSO level (amongst
     others the adaptation of household pressure regulators) led to a postponement of the conversion to 1 st of
     September from 1st of June as previously planned. However, this did not alter the initial conversion target for
     2020. In France, the initial plan for 2020 was the conversion of Dunkerque sector, which has been completed
     27-28 October 2020 instead of 13 October 2020. Uncertainty around the evolution of the Covid-19 and its
     implications for the conversion planning and construction of the Zuidbroek facility remains a key risk. Due to
     the current developments, there is a real risk of delay on the commissioning date of the Zuidbroek facility.

5.   In 2021, over 900,000 gas connections and appliances are expected to be converted in GY 2021/22 –the
     highest number through the market conversion program. The estimated volume effect of the 2021 conversions
     (40 TWh) is the highest of all gas years, due to the particularly high conversion rates in in Belgium and
     Germany. The Task Force does not see any possibilities to further accelerate the conversion process. Currently,
     all efforts are aiming at achieving the scheduled demand reduction for the coming years. In the ten consecutive
     years, between GY 2019/20 and GY 2029/30, combined L-gas exports from the Netherlands to Belgium, France
     and Germany are expected to be reduced to 0 at an average rate of approximately 10% per year.

6.   The increase of H-gas conversion capacity via nitrogen blending in the Netherlands and the market conversion
     from L-gas to H-gas in Germany, Belgium and France as well as the activities in the Netherlands to reduce the
     consumption of L-gas, will ensure the security of L-gas supply to consumers in all markets both in an average
     and in cold year. This will allow to stop production from Groningen by GY 2022/23. For capacity reasons the
     Groningen field may be needed for security of supply until approximately gas year 2025/2026. GTS concluded
     in her advice of January 2021, that for the base case the minimum production from the Groningen field is
     needed until GY 2025/2026. Based on the sensitivity analysis performed by GTS, a realistic bandwidth for the
     closure of the Groningen field is between mid-2025 and mid-2028. The Government of the Netherlands wants
     to close the Groningen field as quickly as possible. Alternatives for the Groningen field as a backup source for
     security of supply are therefore being investigated.

7.   Due to the continuously increasing demand for H-gas for the conversion capacity, the Netherlands has become
     a net importer of gas in GY 2017/18. Because of these developments, the security of supply of L-gas has
     increasingly become more dependent on the flow of the increasing H-gas volumes into the Netherlands. Based
     on TYNDP2020 dataset, ENTSOG performed several additional disruption case calculations to investigate if
     sufficient H-gas supply can be delivered to the NW European markets in an average year and high demand
     situations. The results show that there is sufficient transport capacity during disruptions in an average year.
     Compared to TYNDP2018 (disruptions) calculations the configuration at European level has improved thanks
     to increased potential from suppliers (specifically extra LNG volume delivered to existing LNG terminals), new
     import routes in Europe (see TYNDP2020), and the reduced gas demand in France and the UK. The planned
     increase in capacity on the German/Dutch border raises the flexibility towards the Netherlands.

                                                                                                                   5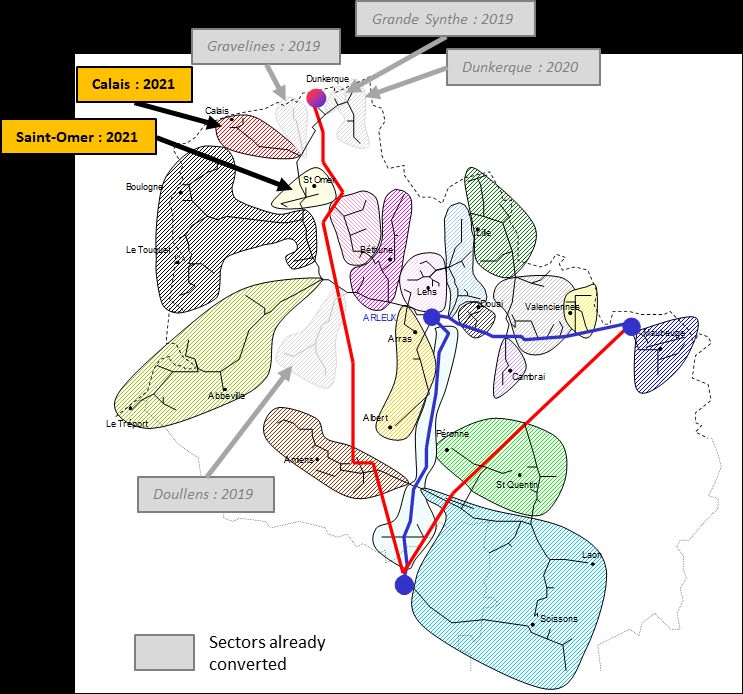
L-Gas Market Conversion Review – Winter Report 2021

Contents

Foreword ................................................................................................................................................. 1
Executive summary ................................................................................................................................. 2
   Key findings ......................................................................................................................................... 4
1. Introduction ......................................................................................................................................... 7
2. L-Gas demand ...................................................................................................................................... 8
3. L-gas market conversion volume....................................................................................................... 11
   3.1 Germany ...................................................................................................................................... 11
   3.2 France .......................................................................................................................................... 17
   3.3 Belgium ........................................................................................................................................ 20
   3.4 The Netherlands .......................................................................................................................... 22
4. L-gas production ................................................................................................................................ 23
5. Storage of L-gas ................................................................................................................................. 28
6. H-gas imports into the Netherlands .................................................................................................. 30
7. Conclusion & implications for Groningen production until 2029/30 ................................................ 32
Annex ..................................................................................................................................................... 34
Contributors .......................................................................................................................................... 44

                                                                                                                                                            6
L-Gas Market Conversion Review – Winter Report 2021

1. Introduction
The government of the Netherlands announced in March 2018 its decision to terminate natural gas production
from the Groningen field as soon as possible, in order to guarantee safety in the area of Groningen against the
risk of earthquakes resulting from natural gas extraction.

The initial schedule for production phase-out - which aimed for termination in 2030 at the latest - was revised in
2019 following the adjusted advice of the State Supervision of the Mines after an earthquake occurred on May
22, with the objective of accelerating the termination by Gas Year (GY) 2022/23 for average weather conditions.
From mid-2022, Groningen gas should only be needed in case of a colder than average winter and in case of a
severe disruption elsewhere in the L-gas system. Groningen gas has a notably lower calorific value compared to
the average European gas, which means it cannot simply be replaced by other domestic or imported sources.
These need to be converted, principally via nitrogen blending, to L-gas.

L-gas is consumed in the Netherlands and exported to neighboring markets in Belgium, France and Germany,
where it serves dedicated L-gas consumers – who will be converted to other sources of energy, most notably H-
gas as a result of the Groningen phase-out. In fact, whilst over 90% of L-gas in Northwest Europe is produced in
the Netherlands, almost half of it is currently consumed in the three importing markets.

Hence, the decision to terminate Groningen production has consequences in terms of adaptation for the Dutch
domestic gas market, but also for export markets in Belgium, France and Germany. The four countries have been
working together since 2012 on the phasing-out of L-gas consumption, which was initially motivated by the
natural decline of the Groningen field. Belgium, France and Germany have developed and are implementing
concrete plans to have their consumers of L-gas converted to other sources of energy, most notably H-gas, by
2030.

The Dutch Parliament adopted a resolution which requires the Ministry of Economic Affairs and Climate Policy of
the Netherlands (Min. EZK) to report twice a year on concrete measures to reduce the demand for Groningen gas
and their foreseen impact6. In this report, explicit attention has to be given to measures within and with regard
to neighboring countries. Moreover, the claimed reductions should be substantiated with actual data and options
should be investigated to accelerate the reduction of the demand. In order to fulfil this requirement, the
Netherlands proposed to establish a Task Force on Gas Market Conversion Monitoring within the framework of
the Pentalateral Gas Platform. The authorities of Belgium, France and Germany concurred with this proposal.

The current report aims to monitor the progress in L-gas conversion in Belgium, France and Germany and the
activities in the Netherlands to reduce the consumption of L-gas, as well as the overall security of supply
developments within the low-calorific market region. It provides the analysis needed by the Min. EZK to decide
on the allowed Groningen production and to meet the requirements of the resolution of the Dutch Parliament. It
also creates a dedicated platform through the Task Force to further improve transparency and mutual
understanding among the involved countries, and enables to share options to accelerate the conversion, without
prejudice to national operators and end users. During the previous months, it has served as a platform to monitor
and discuss developments related to Covid-19 and its impact on the market conversion planning. The Netherlands
has used the information received during these meetings to inform their Parliament on 21st February, 8 April, on
19 June and most recently on 21 September 2020.

The current report provides an update on the progress of the conversion programs, with a special focus on the
impact of the Covid-19 induced lockdowns in 2020 and on planned conversions through the GY 2021/22. Over
900,000 of gas connections and appliances are expected to be converted in GY 2021/22 –the highest number
through the market conversion program.

The estimated volume effect of the 2021 conversions (40 TWh) is the highest of all gas years, due to the
particularly high conversion rates in in Belgium and Germany.

6
  The Parliament’s resolution followed the decision made by the Dutch Council of State on July 3, 2019, which annulled the Min.
EZK’s decision on the allowed Groningen production in the Gas Year 2018/19. The Council of State concluded that it was not
sufficiently motivated why the demand for Groningen gas could not be reduced faster than foreseen. The Council of State not
only referred to Dutch demand but also to exports. According to the Council of State it was not sufficiently clear what the Ministry
meant with his statement that he is in dialogue with neighboring countries to reduce their demand and what actions he undertakes
to accelerate the reduction of exports of Groningen gas.

                                                                                                                                  7
L-Gas Market Conversion Review – Winter Report 2021
2. L-Gas demand7
2.1 Recent demand trends
The consumption of Dutch L-gas declined by 9.9% (or 50.5 TWh) in GY 2019/20 compared with GY 2017/18,
falling from 509.5 TWh to 459 TWh.
Following a drop of 5% year-on-year (y-o-y) in GY 2018/19, total consumption of Dutch L-gas declined by another
5% (24.1 TWh) from 483.1 TWh in the GY 2018/19 to 459 TWh in the GY 2019/20. The consumption of total H-
gas (excluding volumes used for conversion and enrichment in the Netherlands) remained stable in the region,
decreased by 1.4% in GY 2019/20.
The main driving force behind lower L-gas consumption in GY 2019/20 has been the continued implementation
of the market conversion programs in the respective L-gas markets, which naturally reduced demand for L-gas.
In GY 2018/19 conversion totaled to 15.76 TWh, with 13.5 TWh taking place in Germany, 1.37 TWh in Belgium,
0.888 TWh in France and 0 in the Netherlands. In GY 2019/20 conversion totaled to 21.22 TWh, with 18.1 TWh
taking place in Germany, 1.92 TWh in Belgium, 1.2 TWh in France and 0 in the Netherlands.
Figure 2.1 Consumption of L-gas from the Netherlands in between GY 2017/18 and 2019/20 (TWh)
-10%
500
450
400
350
300
TWh
250
200
150
100
50
0
2017/2018 2018/2019 2019/2020
Netherlands Germany Belgium France
It is important to highlight that market conversion volumes do not necessarily translate into the same amount of
L-gas consumption change as other demand side factors also have an influence on the overall L-gas demand.
There is particularly a strong correlation between the number of heating degree days (HDD) and L-gas
consumption, given its predominant use for space heating purposes.
The impact of climatological factors has been minor in GY 2019/20 as the number of wind-adjusted HDD was only
slightly lower (0.9%) compared to the previous GY based on the measurements by the Royal Netherlands
Meteorological Institute at the weather station De Bilt.8
Worth to note, that the implementation of nationwide lockdowns in the spring of 2020 had a significant impact
on natural gas demand worldwide and in Europe, including in the L-gas region, where Dutch L-gas and total H-
gas consumption fell by 19% (or 13.3 TWh) and 16% (or 34.2 TWh) year-on-year respectively during April and
May. Besides the lower economic and industrial activity due to the lockdowns, stronger solar power generation
(up by 30% year-on-year) weighed on natural gas consumption during that period. A secondary and indirect
impact of the lockdowns was the downward pressure on gas prices, which averaged 28% below last year levels
through June and September. This together with recovering carbon prices, prompted an increase in gas-fired
power generation at the expense of coal-fired power plants primarily in Germany and the Netherlands where –
based on data sourced from ENTSO-E- it in increased by 16% and close to 12% respectively during that period.
This provided support both for H- and L-gas consumption.
7
Demand is an ex ante concept, referring to expected energy quantitied being consumed. Consumption is an ex post concept,
referring to energy quantities which have been already consumed.
8
For more detail regarding the climatological context, please refer to Annex VI of the current report.
8L-Gas Market Conversion Review – Winter Report 2021
As shown in Figure 2.2 Germany accounted for over 48.6% of the decline in Dutch L-gas consumption through
the 2019/20 GY, followed by the Netherlands (28.4%), France (15.2%) and Belgium (7.8%). Regarding year-on-
year comparisons, France recorded a reduction of 8.8%, Germany 7.2%, Belgium 4.1% and the Netherlands
2.9%.
Figure 2.2 Change in Dutch L-gas consumption in GY 2019/20 vs GY 2018/19 (TWh)
490 -5%
480 -6.8
483
470 -11.7
-1.9
460 -3.7
450 458.9
TWh
440
430
420
410
400
390
2018/19 Netherlands Germany Belgium France 2019/20
L-gas is predominantly consumed in the residential and commercial sectors for space heating purposes.
Consequently, L-gas demand shows a significant seasonal profile, with over two-thirds of consumption occurring
through the heating season of the GY. As such, both monthly peak consumption and the annual demand swing9
is taken into account when considering the overall evolution of L-gas consumption.
Peak monthly consumption decreased by 16% (12 TWh) in the 2019/20 GY compared to the previous GY and
consequently the demand swing (represented by the arrows in Figure 2.3) decreased by 20% (11.5 TWh). This
has been largely driven by the climatological context and the more even distribution of HDDs through the 2019/20
heating season.
Figure 2.3 Dutch L-gas monthly consumption October 2018 – September 2020 (TWh)
80
70
60
50
TWh
40
30
20
10
0
mrt-20
jun-19
jun-20
feb-19
mrt-19
feb-20
apr-19
jul-19
aug-19
sep-19
apr-20
jul-20
aug-20
sep-20
nov-18
mei-19
nov-19
mei-20
okt-18
okt-19
dec-18
jan-19
dec-19
jan-20
Netherlands Germany Belgium France
9
The difference between the highest and lowest monthly gas consumption in a GY.
9L-Gas Market Conversion Review – Winter Report 2021
2.2 The expected annual demand for L-gas from the Netherlands until GY 2029/30
In the ten consecutive years, between GY 2019/20 and GY 2029/30, combined L-gas exports from the Netherlands
to Belgium, France and Germany are expected to be gradually reduced at an average rate of approximately 10%
per year.10
As a consequence, L-gas demand met with imports from the Netherlands is expected to fall from 47.2 TWh in GY
2020/21 to 0 in Belgium, from 39.5 TWh to 0 in France and from 154.4 TWh to 0.3 TWh in Germany11 by GY
2029/30 both in an average and cold GY12.
Figure 2.4 Projected annual demand for Dutch L-gas (TWh)
L-gas demand in average GYs L-gas demand in cold GYs
600 600
500 500
400 400
TWh
TWh
300 300
200 200
100 100
0 0
Netherlands Germany Belgium France Netherlands Germany Belgium France
10
GTS (2017), Netwerk Ontwikkelingsplan 2017.
11
Please note that the remaining demand in the gas year 2029/30 (0.3 TWh / 100.000 kWh/h) is given by a regional grid in
Germany, that can only be supplied via the Netherlands (Haanrade / Thyssengas).
12
In the case of Belgium and France, the demand profile for a cold GY has been calculated based on 1995-96 temperature profile
by GTS as stated in the Dutch Gas Act for the L-gas supply-demand balance of this Report. In the case of Belgium, the preferred
national approach is to consider the year 1962-63 as a cold year profile.The French regulation approach is requiring to work with
a 2% risk cold GY (using Lille weather data); leading to a demand profile national reference shared with the French stakeholders,
about 2% above the GTS’s figures.The preferred national approach both in the case of Belgium and France are reflected in Figure
2.4 and in the tables 2.2 and 2.3 of the Annex.
10L-Gas Market Conversion Review – Winter Report 2021
3. L-gas market conversion volume
The gas infrastructure operators of Belgium, France and Germany have made arrangements to undertake
extensive conversion programs, mainly switching L-gas consumers to H-gas, to reduce the L-gas supply from the
Netherlands: by the gas GY 2029/30, their imports of L-gas will be reduced to close to zero.
Both the realized number of gas installations or consumers that are converted and the corresponding volumes
are important to consider. In this report, countries supply data for each.
The current report provides an update on the progress of the conversion programs, with a special focus on the
impact of the Covid-19 induced lockdowns in 2020 and on planned conversions through the GY 2021/22. Over
900,000 gas connections and appliances are expected to be converted in GY 2021/22 –the highest number
through the market conversion programme.
The estimated volume effect of the 2021 conversions (40 TWh) is the highest of all gas years, due to the
particularly high conversion rates in in Belgium and Germany.
Figure 3.0 Volume effect of actual and planned conversions between GY 2019/20 and GY 2029/30
(TWh, based on average temperatures)
40
35
30
25
TWh
20
15
10
5
0
19/20 20/21 21/22 22/23 23/24 24/25 25/26 26/27 27/28 28/29 29/30
Germany Belgium France
3.1 Germany
Legislative changes, conversion costs and additional measures13
In order to implement the market conversion in Germany some 5.5 million gas appliances need a physical
adaptation. A sophisticated timetable for the conversion process was put into place in 2014 and legal changes
have been introduced. As of 2017, the Basic Energy Law (Energiewirtschaftsgesetz14) had been revised
substantially in order to serve as the basis for the market conversion from L- to H-gas. Article 19a of the Basic
Energy Law clarifies that the legal responsibility for the process lies with the transmission system operators and
that the necessary costs of adaptation of gas appliances are socialized (as an integral part of the gas grid fee).
Furthermore, the law lays down rules on partial reimbursement if customers buy a new gas appliance.
In addition, the Basic Energy Law was amended concerning access to the German L-gas grid in order not to
provide substantial amounts of L-gas to new customers.
13
For further details please refer to the Winter Report 2020 of the Task Force Monitoring L-Gas Market Conversion.
14
The text of the Basic Energy Law is accessible at: https://www.gesetze-im-internet.de/enwg_2005/
11L-Gas Market Conversion Review – Winter Report 2021
The total costs for the conversion from L- to H-gas in Germany are estimated at approx. EUR 4 billion. The
conversion costs can be split into two different cost categories (1) costs for adapting the customers’ appliances
from L- to H-gas and (2) costs for grid expansion.
The German TSO GTG Nord had built a new blending facility at the Dutch border in order to reduce the need for
Groningen gas by up to 6 TWh a year, cf. below.
Conversions from 2015 to 201915
Approximately 300,000 appliances have been converted from L- to H-gas in the years 2015 – 2018. During the
years 2015 – 2018, several early conversions have been implemented. Furthermore, the German TSOs have
accelerated the planning for the consecutive years repeatedly. The conversions realized between 2015 and 2018
account for a capacity of 4.6 GWh/h and a yearly volume of 28 TWh. More than half of this volume accounted to
conversions ahead of schedule, which served to bring down demand for Groningen gas.
As these advanced changes had been made years before the due date, they continue to be a relief for the
Groningen production in the years to come.
In 2019, 10 areas with 319,000 appliances in total have been converted as planned. Conversion relates to a
capacity of 4 GWh/h and a volume of 13.5 TWh.
Conversions in 2020 and the impact of Covid-19
In 2020, 7 areas with 389,000 appliances have been converted. Conversion relates to a capacity of 5.15 GWh/h
and an estimated volume effect of approximately 18.1 TWh (average year).
The rapid spread of Covid-19 in Germany has only resulted in minor changes to the original conversion plans for
2020. As foreseen in the Summer Report of the Task Force Monitoring L-Gas Market Conversion, only an amount
of 6,000 appliances (0.05 GW) out of 395,000 appliances have been rescheduled from 2020 to 2021.
This, however, will not result in any changes in the import assumptions from the Netherlands in terms of volume
or capacity due to the limited size of the conversion area.
It is important to highlight that the technical regulation for the conversion from L- to H-Gas in Germany requires
multiple customer contacts between service technicians and the owners of the respective household device. First,
an assessment of the natural gas device is performed on site to ensure technical feasibility, planning of the
technical adjustment date and spare part logistics. The assessment of the device often takes place more than
one year ahead of the physical conversion date. Second, the actual technical adaption takes place either before
or after the device is physically supplied with H-gas. Third, 10% of the converted devices are checked again for
quality assurance purposes.
Performing these multiple customer contacts in a limited time schedule was significantly hindered by Covid-19
and its surrounding effects, in particular during the first wave. The Covid-19 pandemic meant that all parties
involved were facing challenges previously unknown.
In particular, these included the reduction or temporary suspension of assessment and adjustment work (causes
including those refusing entry), guaranteeing the full availability of conversion service providers, the
implementation of special hygiene protocols and providing the customers concerned with comprehensive
information.
Temporary delays that have accumulated during the first wave of Covid-19 in spring 2020 have mainly been
compensated during summer 2020. Further compensation has been achieved by conducting conversion steps
later in the year than originally planned, despite higher risks for the involved end customers if their heating
installation should malfunction during the switchover process. The last conversion steps in Germany for the year
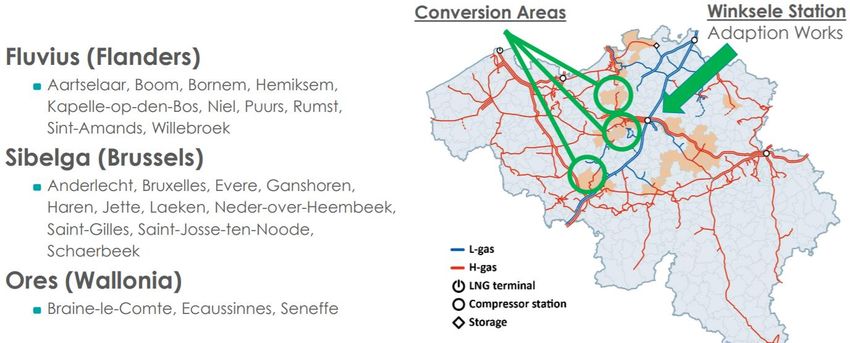
2020 have successfully been conducted by November 2020. The respective conversion areas are displayed in the
illustration below.
15
For further details please refer to the Winter Report 2020 of the Task Force Monitoring L-Gas Market Conversion.
12L-Gas Market Conversion Review – Winter Report 2021
Map 3.1.1 Conversion areas in 2020
Conversion areas 2020
The second wave did not have an impact on the timely implementation of the last conversion steps in the year
2020, which took place during November 2020. DSOs however reported a rising number of households under
quarantine that could not be entered on the foreseen date, but not in a critical magnitude to stop or postpone
the latest conversion steps. The respective areas are now physically supplied with H-gas. The process of
technically adapting heating devices is still ongoing and will approximately last until end of 2020 / beginning of
2021. Possible delays in these works would therefore not lead to an increased demand of L-Gas, but to an
increased number of malfunctions and disconnections.
Table 3.1.1 provides a detailed status of the conversion areas in Germany and the respective delays caused by
Covid-19.
13L-Gas Market Conversion Review – Winter Report 2021
Table 3.1.1 Market conversion in Germany in 2020
Area in the Gas NDP TSO Number of Number of Planned Planned
2020-2030 appliances appliances technical technical
(No on map) (original (realized) conversion conversion
plan) month month
(original) (realized)
EWE-Zone part I (1) GTG 50,000 38,000 February–June February–June
EWE-Zone part I (1) GTG 17,000 23,000 September–October September–
November
Bremen/ Delmenhorst (2) GUD 30,000 30,000 July July
Bremen/ Delmenhorst (2) GUD 22,000 22,000 September September
East Hannover/ Wolfsburg (3) GUD 5,000 5,000 March March
East Hannover/ Wolfsburg (3) GUD 34,000 34,000 April May
East Hannover/ Wolfsburg (3) GUD 27,000 27,000 June June
East Hannover/ Wolfsburg (3) GUD 8,000 8,000 September September
East Hannover/ Wolfsburg* (3) GUD 0 0 October October
Teutoburger Wald 5 (4) OGE (Nowega) 39,000 39,000 October October
Aggertal pipeline (5) OGE 4,000 4,000 April August
Aggertal pipeline (5) OGE 3,000 0 August –
Aggertal pipeline (5) OGE – 3,000 – September
Aggertal pipeline (5) Thyssengas 0 0 April April
Aggertal pipeline (5) Thyssengas 5,000 5,000 April August
Aggertal pipeline (5) Thyssengas 10,000 15,000 June September
Aggertal pipeline (5) Thyssengas 9,000 20,000 August November
Aggertal pipeline (5) Thyssengas 16,000 0 October –
Bonn (6) OGE 21,000 21,000 March March
Bonn (6) OGE 4,000 4,000 June July
Middle Hesse (7) OGE 22,000 22,000 March March
Middle Hesse (7) OGE 20,000 20,000 April April
Middle Hesse (7) OGE 17,000 17,000 June June
Middle Hesse (7) OGE 16,000 16,000 July July
Middle Hesse (7) OGE 16,000 16,000 September September
Total 395,000 389,000
*no distribution networks
Despite the difficult Covid-19 situation in spring 2020, the gas demand from the Netherlands will not deviate
against the assumptions already published in the Winter Report 2020. However, the challenge ahead will be to
manage the high numbers of conversions scheduled for the next years.
Moreover, it is important to highlight that as of December 2020, Covid-19 did not cause any delays for the planned
commissioning dates of the grid expansion projects in Germany required for the conversion from L- to H-gas.
GTG's blending facility at the Dutch border is not yet in operation, since it is not yet connected to the H-Gas
network of GTS. Delays are due to material, which is requested to have unusual specifications, being available
no earlier than January 2021. It is therefore expected that the blending facility will go into operation in Q2 2021.
Conversions in 202116
The major challenge for 2021 will be the significant increase of the number of appliances to be converted. The
total amount of 570,000 appliances is an increase of approximately 45% against 2020. The planned conversion
of 2021 relates to a capacity of 9.5 GWh/h and an estimated volume effect of 31.5 TWh (average year).
The estimated volume effect of the 2021 conversion is the highest effect of all gas years. While the conversion
areas are evenly distributed in terms of appliances per gas year, the resulting volume effect differs due to the
16
The German Network Development (NDP) plan also refers to calendar years for the appliances converted and gas years for
resulting gas demand. As conversion usually take place between March and (early) October, the difference is insignificant.
14L-Gas Market Conversion Review – Winter Report 2021
regional distribution of industry and power plants with a high gas consumption. An above-average effect on
volume results in particular from the conversion area (15) “Rhineland”, and besides that also from the conversion
areas (13) “Middle Rhine” and (3) “East Hannover/ Wolfsburg”. The planned conversion areas in 2021 are
displayed in the illustration below.
Map 3.1.2 Conversion areas in 2021
Conversion areas 2021
Due to the unclear development of Covid-19, additional risks may arise that could lead to delays. Possible risks
include workforce availability, spare parts availability or limited access to households for technicians to perform
adjustment works.
Due to the necessity to enter every single household 2 – 3 times for the conversion of one single appliance, the
future development of Covid-19 may be crucial to the success of the overall schedule for 2021. Adjustment works
in the respective households will start on a large scale in Q1/2021 typically 3 months before the actual conversion
date (switchover to physical supply with H-Gas), with a yet unclear Covid-19 situation.
Table 3.1.2 provides a detailed overview of the planned conversion areas in Germany in 2021.
15L-Gas Market Conversion Review – Winter Report 2021
Table 3.1.2 Market conversion in Germany in 2021
Area in the Gas NDP TSO Number of Planned technical conversion
2020-2030 appliances month
(No on map) (original plan)
Aggertal pipeline (5) Thyssengas 14,000 April
Aggertal pipeline (5) Thyssengas 17,000 June
Aggertal pipeline (5) Thyssengas 11,000 August
Bergheim 1 (17) Thyssengas 14,000 October
East Hannover/ Wolfsburg (3) GUD 8,000 March
East Hannover/ Wolfsburg (3) GUD 36,000 April
East Hannover/ Wolfsburg (3) GUD 12,000 June
East Hannover/ Wolfsburg (3) GUD 9,000 July
East Hannover/ Wolfsburg (3) GUD 6,000 September
East Hannover/ Wolfsburg (3) GUD 22,000 October
EWE-Zone part I (1) GTG 6,000 November
EWE-Zone part II (8) GTG 31,000 February-August
EWE-Zone part II (8) GTG 3,000 October
North Bremen/ Osterholz Scharmbeck/ GUD 9,000 July
Bremerhaven/ Cuxhaven (9)
North Bremen/ Osterholz Scharmbeck/ GUD 13,000 May
Bremerhaven/ Cuxhaven (9)
North Bremen/ Osterholz Scharmbeck/ GUD 43,000 June
Bremerhaven/ Cuxhaven (9)
North Bremen/ Osterholz Scharmbeck/ GUD 12,000 September
Bremerhaven/ Cuxhaven (9)
North Bremen/ Osterholz Scharmbeck/ GUD 9,000 October
Bremerhaven/ Cuxhaven (9)
Unterlüß-Gockenholz* (10) GUD 0 October
Verden (11) GUD 13,000 October
Munster Gockenholz area (12) Nowega 6,000 October
Middle Hesse (7) OGE 6,000 March
Middle Hesse (7) OGE 18,000 May
Middle Hesse (7) OGE 27,000 June
Middle Hesse (7) OGE 18,000 August
Middle Rhine (13) OGE 45,000 April
Middle Rhine (13) OGE 21,000 June
Middle Rhine (13) OGE 8,000 May-August
Middle Rhine (13) OGE 18,000 September
Middle Rhine (13) OGE 15,000 October
Oberaden* (14) OGE 0 June/ September
Oberbergisches Land (18) Thyssengas 10,000 September
Rhineland (15) OGE 22,000 July
Rhineland (15) OGE 21,000 July
Rhineland (15) Thyssengas 13,000 July
Rhineland (15) OGE 0 September
Rhineland (15) Thyssengas 0 July
Rhineland (15) Thyssengas 0 September
Westerwald/ Sieg (16) OGE 19,000 September
Westerwald/ Sieg (16) OGE 16,000 July
Total 570,000
*no distribution networks
16L-Gas Market Conversion Review – Winter Report 2021
Conversions until GY 2029/30
In Germany, over 3.7 million of gas appliances will need to be converted between GY 2021/22 and GY 2029/30,
translating into a total volume of 163.2 TWh.
Consequently, L-gas imports from the Netherlands to Germany are expected to fall to 0.3 TWh by GY 2029/30,
both in an average and a cold GY.17
Figure 3.1.1 Germany’s L-gas imports from the Netherlands (GY 2021/22-GY 2029/30) for average
and cold GYs (TWh)
160
140
120
100
TWh
80
60
40
20
0
21/22 22/23 23/24 24/25 25/26 26/27 27/28 28/29 29/30
Average Cold
Update on conversion costs
The costs for adapting the customers appliances from L- to H-gas are reimbursed. The reimbursement only refers
to the adaption and not the replacement of appliances. Customers with installations that cannot be adapted from
L- to H-gas and have to be replaced are entitled to receive a lump sum of up to EUR 600 under certain
circumstances.
The actual costs for the adaption of appliances from the years 2016 – 2019 and the planned costs for the years
2020 – 2021 are displayed in the illustration below, altogether totaling to € 726 million.
Figure 3.1.2 Actual and planned costs for the adaption of appliances, 2016-21 (€ million)
Actual costs Planned costs
250
224
200 179
150 141
€ million
95
100
59
50
28
0
2016 2017 2018 2019 2020 2021
17
Please note that the remaining demand in the gas year 2029/30 (0.3 TWh / 100.000 kWh/h) is given by a regional grid in
Germany, that can only be supplied via the Netherlands (Haanrade / Thyssengas).
17L-Gas Market Conversion Review – Winter Report 2021
The respective costs are financed by a “market conversion levy” that is paid on top of the TSO transport tariffs.
Estimates for the cumulated market conversion levy until 2029 see costs of roughly € 2 billion.
Costs for grid expansion on TSO and DSO level are not included in the market conversion levy described above.
TSO costs for grid expansion related to L- to H-Gas conversion amount to another € 2 billion and are financed by
the regular transport fees.
3.2 France
Legislative changes and conversion costs18
In France almost 1.3 million of gas consumers have to be converted between GY 2019/20 and GY 2029/30,
translating into a total volume of 40.73 TWh/y.
Since 2015, the French legal and regulatory framework has been adapted to carry out the conversion of the L-
gas network. The regulatory framework for conversion in France was adapted with a new decree dated 29 October
2020. In application of this new decree, L-gas network and storage operators updated the conversion plan which
was set up in 2016 taking into account mainly a few planning modifications and feedback from pilot phase.
Costs incurred by the TSO and the DSOs for the conversion of the L-gas networks are covered through gas
infrastructures tariffs and are estimated to amount to approximately € 800 million.
Conversions achieved in GY 2018/19 and GY 2019/20
A pilot phase has been decided to test the conversion process. During GY 2018/19 the conversion of the L-gas
network was carried out in the Doullens area (6,000 consumers converted on April 9, 2019, rural area with a
majority of individual housing) and the Gravelines area (10,000 consumers converted on September 17, 2019,
urban area with collective housing).
During the GY 2019/20 the conversion program continued in the Grande-Synthe area with 19,000 consumers
converted on November 28, 2019.
Conversions in 2020 and the impact of Covid-19
The initial plan for 2020 was the conversion of Dunkerque sector in October 2020 representing 42,000 customers
and translating into an annual consumption of 1 TWh under average weather conditions.
The Dunkerque sector was successfully converted on 27-28 October 2020 instead of 13 October as previously
planned. This sector is number four in France, the biggest and last of the pilot phase.
Operations at consumers’ houses to check and adapt gas appliances started on 2nd March 2020, with an expected
rhythm of 20% of appliances per month from April until June. 2,000 of them were checked and adapted as of
mid-March (16/03) when the operations have been suspended due to Covid-19 outbreak.
The lockdown in France stopped the conversion activities by DSO in the sector of Dunkerque on 16 March. It is
important to note that the area concerned by the conversion program in France was classified as a red area with
respect to Covid-19, which means that it was a highly contaminated area.
From 16 March, conditions for resuming settings of gas appliances have been put in place by the DSO and its
implementation has been initiated with customers: a letter and a "health instructions" brochure were sent to
customers informing them of the resumption of the settings under specific conditions to guarantee their safety
and the safety of the workers. The letter invited them to contact the DSO to confirm their agreement. Local
officials and local press relayed these messages.
Settings of customers appliances resumed on 18 May starting with around 30 volunteer heating technicians. A
ramp-up took place in the following weeks and significant efforts were made to catch up with the accumulated
delay. Thanks to these efforts the Dunkerque sector conversion was successfully achieved on 27-28 October,
2020 instead of 13 October as previously planned.
On the TSO side the network modifications for the conversion of the Dunkerque sector were achieved by the end
of 2019 and therefore the Covid-19 crisis had no consequence on that part of the program. Preparation by GRTgaz
of the conversions planned in 2021 and further was launched in 2019 and continued in 2020. In particular, there
are two GRTgaz projects to be achieved in 2021. Even if there is delay with respect to the original planning, the
current commissioning dates of these two projects remain compatible with the conversions planned in 2021.
18
For further details please refer to the Winter Report 2020 of the Task Force Monitoring L-Gas Market Conversion.
18L-Gas Market Conversion Review – Winter Report 2021
The status in France at the end of November 2020 is that the second wave of Covid-19 did not have any significant
impact on conversion activities because:
▪ The second wave in France occurred after the conversion of the Dunkerque sector on 27-28 October;
▪ Inventory activities for the sectors to be converted in 2021 were mostly achieved at the end of October
and they could be finalized at the end of November;
▪ Preparatory works on the transmission network were not suspended during the second lockdown in
November.
Conversions in GY 2020/2021
The plan for 2021 is the conversion of Calais and Saint-Omer sectors in September and October 2021 representing
a total annual consumption of 1.2 TWh under average weather conditions. Preparation works for these
conversions are currently on track.
During the year 2020 preparation of 2021 and future conversions have been realized. Executed and planned
conversions are displayed in the illustration below.
Map 3.2.1 Market conversions in France in 2019 and 2020
Conversions until GY 2029/30
In France, over 1.26 million of gas consumers will need to be converted between GY 2021/22 and GY 2029/30,
translating into a total volume of 38.5 TWh/y.
Consequently, L-gas imports from the Netherlands to France are expected to fall to 0 by GY 2029/30, both in
an average and cold GY.
19You can also read