Sistema PJSFC Investor Presentation - 2019 г.

Page created by Ben Todd
 
CONTINUE READING
Sistema PJSFC Investor Presentation - 2019 г.
2019 г.

          Sistema PJSFC
          Investor Presentation   2021
Sistema PJSFC Investor Presentation - 2019 г.
DISCLAIMER

Certain statements in this presentation may contain assumptions or forecasts in respect to forthcoming events within Sistema PJSFC.
The words “expect”, “estimate”, “intend”, “will”, “could” and similar expressions identify forward-looking statements. We wish to
caution you that these statements are only predictions and that actual events or results may differ materially. We do not intend to
update these statements to reflect events and circumstances occurring after the above-mentioned date or to reflect the occurrence
of unanticipated events. Many factors could cause Sistema’s actual results to differ materially from those contained in our projections
or forward-looking statements, including, among others, deteriorating economic and credit conditions, our competitive environment,
risks associated with operating in Russia, rapid technological and market change in our industries, as well as many other risks
specifically related to Sistema and its operations.

                                                                                                                                          2
Sistema PJSFC Investor Presentation - 2019 г.
SISTEMA: PORTFOLIO OVERVIEW
                                                  Sistema is a publicly-traded investment holding with an                                                                                                   OTHER ASSETS
                                                  asset portfolio representing companies across 15
                                                  sectors in Russia                                                                                                     BINNOPHARM GROUP
LSE: SSA              MOEX: AFKS                  Vladimir Evtushenkov Founder and main shareholder (59.2%),
                                                  Chairman of the Board
                                                  Vladimir Chirakhov President and CEO
                                                                                                                                                                        Alium                                  Sintez           Biocom
                                                                                                                                                                        24.9%                                  56.2% 1          75%1
PUBLIC ASSETS
                                                                                                                                                                        POWER GRIDS                           RENTAL PROPERTIES
                            MOEX: MTSS                                             MOEX: OZON                                                MOEX: ETLN
                            NYSE: MBT                                              NDAQ: OZON                                                LSE:  ETLN
                                                                                                                                                                        Bashkir Power Grid                     Business-
       50.1496%                                          33.1%
                                                                    2
                                                                                                               25.6%                                                    Company                                Nedvizhimost
                                                                                                                                                                        91%                                    100%
       Leading public                                    Leading multi-category                                One of the Russia’s largest
       telecommunications                                online sales platform in                              public development and                                   HOSPITALITY                            FASHION RETAIL
       operator in Russia                                Russia                                                construction companies

                                                                                                                                                                        Cosmos Hotel Group                     Concept Club
                                                                                                                                                                        100%                                   43%
KEY NON-PUBLIC ASSETS
                                                                                                                                                                        HIGH TECH

       FORESTRY                                           AGRICULTURE                                          HEALTHCARE

                                                                                                               Medsi                                                    RTI                                    Kronstadt Group
       Segezha Group                                      Steppe Agroholding
                                                                                                                                                                        87%                                    96%
       98.3%                                              84.6%                                                95.5%
                                                                                                                                                                        PE FUNDS                               VC FUNDS
       Largest vertically                                 Major agriculture holding                            Russia’s largest national
       integrated forestry holding                        and one of Russia’s largest                          healthcare chain
       in Russia                                          land owners

1
    Joint stake with financial partner
2 Upon completion of the initial public offering of Ozon, fulfilment of the private placement agreement and conversion of the convertible loans previously provided to Ozon, and assuming 4,472,969 ordinary shares issuable upon exercise of
outstanding vested share-based awards under the employee incentive program of Ozon Sistema’s total stake in Ozon will amount to at least 33.1% .                                                                                                3
Sistema PJSFC Investor Presentation - 2019 г.
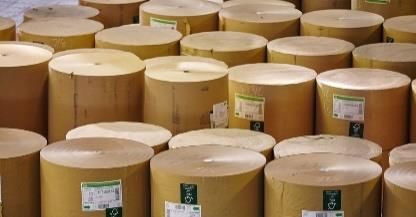
FINANCIAL REVIEW 3Q 2020

                           4
Sistema PJSFC Investor Presentation - 2019 г.
HIGH PACE OF BUSINESS GROWTH AND DECREASE IN FINANCIAL LIABILITIES
Results of portfolio companies                                                                      Consolidated revenue                                          Adj.2 OIBDA
-   Revenue grew significantly year-on-year1 in 3Q 2020, driven                                      RUB bln                                                       RUB bln
    by the strong results of MTS, Segezha Group, Steppe and
    Medsi.                                                                                                                  +9.6%                                                         +14.0%

-   Adj. OIBDA significantly increased year-on-year in 3Q 2020                                                                             184.9
    on the back of the growth in adj. OIBDA at MTS, Segezha                                                    168.7                                                                                        71.7
                                                                                                                                                                              62.9
    Group and Steppe and due to the gain from the sale of
    Detsky Mir shares in September 2020.

Key events in 3Q 2020 and after the reporting                                                                3Q 2019                     3Q 2020                           3Q 2019                     3Q 2020
period
-   In September 2020, Sistema fully disposed of its
    shareholding in Detsky Mir through a public offering, with                                      Assets leading by revenue
    proceeds amounting to RUB 16.9 bln.                                                             growth year-on-year in 3Q                                     Net financial liabilities at
                                                                                                    2020                                                          Corporate Centre3,4
-   In September 2020, Expert RA rating agency upgraded
    Sistema’s credit rating by two notches to ruAA-, and S&P                                                                                                       RUB bln
    rating agency upgraded Sistema’s credit rating to BB.
                                                                                                                                                                                         -16.6%
-   In November 2020, Sistema attracted the first ESG financing                                                                       25.4%
    from Sberbank. Under RUB 10 bln credit line interest rate on
    each loan could be tied to sustainability performance.

-   In November 2020, Ozon held an initial public offering (IPO)                                                                                                        199.0
    of its American Depositary Shares (ADSs) on NASDAQ and                                                                                                                                 190.7
                                                                                                                                        38.0%                                                                 166.0
    obtained listing of the ADSs on the Moscow Exchange.
    Gross proceeds to the company, including the
    underwriters’ overallotment option and the concurrent
    private placement, where Sistema participated and                                                                                                                 3Q 2019            2Q 2020             3Q 2020
    invested USD 67.5 million, amounted to approx. USD 1.25                                                                               48.4%
    billion. Upon completion of the IPO, fulfilment of the private
    placement agreement and conversion of the convertible
    loans previously provided to. Ozon, Sistema’s total stake in
                                       5
    Ozon will amount to at least 33.1%

1  Hereinafter results for 3Q 2019 are presented to reflect the reclassification of assets of Detsky Mir and MTS’s business in Ukraine as part of discontinued operations, and divestiture of AGK Yuzhny.
2 Hereinafter  please see Appendix A of the financial results press-release for 3Q 2020.
3 Source: Management accounts.
4 Including total borrowings, liability to Rosimushchestvo, financial lease net of cash and cash equivalents at the Corporate centre level.

5 Assuming the exercise of outstanding vested share-based awards under the employee incentive program of Ozon.                                                                                                         5
Sistema PJSFC Investor Presentation - 2019 г.
FINANCIAL REVIEW: 3Q 2020
Revenue: 3Q 2020
RUB bln                                                                                                                                           MTS: growth in mobile service revenue and
                                                                          +9.6%                                                                   revenue from other segments (Fintech, Media
                                                                                                                                                  and B2B Digital & Cloud); increase in adj.
                                                                                                                                                  OIBDA following revenue growth and
                                                                     4.8                    1.4                                            1      reduced      commercial   and       personnel
                                                                                                              -1.2              184.9             expenses, and despite a fall in revenue from
                                                                                                                                                  international roaming.
                                                 5.2
                               6.0
        168.7
                                                                                                                                                  Segezha Group: strong growth in revenue
                                                                                                                                                  and OIBDA, driven by increased production
                                                                                                                                                  and sales of paper and sawn timber, and
                                                                                                                                                  impacted by rouble depreciation.
    Revenue                    MTS          Segezha Group         Steppe                 Medsi              Other              Revenue
    3Q 2019                                                                                                 assets,            3Q 2020
                                                                                                             net
                                                                                                                                                  Steppe: significant growth in revenue and
Adj. OIBDA: 3Q 2020                                                                                                                               OIBDA due to increased sales of agricultural
                                                                                                                                                  products and higher grain prices, as well as
RUB bln                                                                                                                                           positive dynamics in the Dairy Farming
                                                                        +14.0%                                                                    segment.

                                                                                                              4.9                          1

                                                                      1.0                                                         71.7
                                                 1.4                                      -1.1                                                    Medsi: increase in revenue and OIBDA due to
                                2.6                                                                                                               the deferred demand for medical services,
        62.9
                                                                                                                                                  growth in revenue from diagnostics and the
                                                                                                                                                  treatment of COVID-19, and development of
                                                                                                                                                  home care services.

                                                                                                                                                  Business Nedvizhimost: decrease in revenue
Скорр. OIBDA 3 кв. 2020г.   Segezha Group        МТС               А/х "Степь"     "Бизнес-Недвижимость"     Прочие    2        Скорр. OIBDA      and OIBDA due to the completion of the
      Adj.                  Segezha             MTS               Steppe              Business              Other
                                                                                                             активы,
                                                                                                              нетто
                                                                                                                                  Adj.
                                                                                                                                 3 кв. 2020г.
                                                                                                                                                  commercial real estate sales programme.
     OIBDA                   Group                                                  Nedvizhimost            assets,              OIBDA
    3Q 2019                                                                                                   net               3Q 2020

1 Numbers may not add up due to rounding.
2 The
    dynamics of the Group’s adj. OIBDA in 3Q 2020 were affected by the reflection of the financial result from the sale of Detsky Mir shares in September 2020 in the amount of RUB 3.7 bln, and the reflection of the
Group’s share in reduction of Ozon’s net loss in the amount of RUB 0.2 bln (in 3Q 2020 the loss amounted to RUB 1.6 bln, in 3Q 2019 – RUB 1.8 bln).                                                                      6
Sistema PJSFC Investor Presentation - 2019 г.
CASH FLOWS AT THE CORPORATE CENTRE
RUB bln

          Placement of Detsky Mir shares
          Participation in the MTS buyback programme
          Other income

                                           +16.4              -26.6

                        +19.5
                          2.5

                                                                          -3.0
                          16,6                                                         -4.6
                                                                                                    -1.5           -1.3
       7.6                                                                                                                           -1.0             5.6

    30 Jun 2020     Monetisations      Dividends and Net repayment     Investments    Interest     SG&A,       Dividends for   Repayment of        30 Sep 2020
                     and other          cash returns  of financial                   expenses    incl. taxes       2019        other liabilities
                      income                            liabilities

-   Cash inflows in 3Q 2020 were driven primarily by the placement of Detsky Mir shares (RUB 16.6 bln), participation in the MTS buyback
    programme (RUB 2.5 bln), and MTS dividends (RUB 15.8 bln).
-   The change in financial liabilities was due to the issue of series 001P-14 bonds (RUB 10 bln) and series 001P-15 bonds (RUB 10 bln), as well as
    repayment of bank loans in the amount of RUB 31.9 bln and repayment of the liability to Rosimushchestvo in the amount of RUB 4.1 bln. In
    addition, the repurchase of series 001P-06 bonds in the amount of RUB 4.4 billion and series 001P-09 bonds in the amount of RUB 6.2 bln was
    completed.
-   The total volume of investments in 3Q 2020 amounted to RUB 3.0 bln, including the purchase of Etalon Group shares and investments in
    promising projects and startups through the platform of funds.
-   Interest expenses were due to interest payments on loans and coupon payments on local rouble bonds.
-   Dividend payments for FY 2019 amounted to RUB 1.3 bln.
Source: Management accounts. Numbers may not add up due to rounding.                                                                                             7
Sistema PJSFC Investor Presentation - 2019 г.
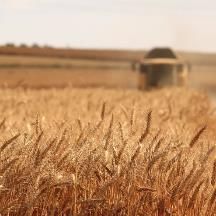
CORPORATE CENTRE’S FINANCIAL LIABILITIES
Corporate Centre’s financial liabilities1
RUB bln

                                                                                                                           -   Active participation in the domestic capital market
                                                                                                                               allowed Sistema to significantly reduce the average
                                                                                                                               interest rate of the debt portfolio, extend its maturity and
        198.3                  20.0                    -46.6
                                                                                                      171.6                    establish a comfortable repayment schedule.
          8.2                                                                  -0.1
                             RUB debt                                                                   4.6
                                                                         FX revaluation2
                                                                                                                           -   In 3Q 2020, the Corporation’s financial liabilities
                             attraction             RUB loans
                                                   redemption                                                                  decreased to RUB 171.6 bln due to the repayment of
        190.1                  198,3
                                                       171,7                  171,6                                            rouble-denominated loans and repayment of liabilities to
                                                                                                     167.0
                                                                                                                               Rosimushchestvo.
                                                                                                                           -   As of 30 September 2020, the share of rouble-
    30 Jun 2020                                                                                  30 Sep 2020                   denominated financing stood at 97% of the Corporate
                                                                                                                               Centre’s financial liabilities.
                RUB debt                        Liability to   Rosimushchestvo3

Comfortable repayment schedule                                                                                                 Structure analysis1
RUB bln                                                                               As of 30 September 2020
                                                                                                                                                      Liability to Rosimushchestvo
                                                                                                                                                                    3%
                                                                                      66.7

                                                                                      22.6
                                              34.2                                                                                                                                     Bank loans and other
                                                                  22.1                                                                                                                         35%
                                              6.0
                           16.5                                    3.3                                   21.0                            RUB bonds
       11.0                                                                           44.1
         0.2                6.5               28.2                                                                                          62%
        4.6                                                       18.8                                  21.0
        6.2                10.0
       2020                2021               2022                2023                2024           Thereafter

                Local bonds with put option4                             Loans and other debt (RUB)
                Liability to Rosimushchestvo3

1 Hereinafter the Corporate Centre’s financial liabilities are presented based on management accounts.
2 Including other non-cash flows.
3 As of the end of 3Q 2020, USD-denominated liability to Rosimushchestvo for shares of SSTL are presented at the RUB/USD exchange rate as of 30 September 2020.
4 RUB series 001Р-04 bonds with a put option in 2020; 001Р-07 with a put option in 2021; 001Р-01, 001Р-06, 001Р-09 and 001P-10 with a put option in 2022; 001P-11 and 001P-14 with a put option in 2023; 001Р-05, 001Р-08, 001Р-

12, 001Р-13 and 001Р-15 with a put option in 2024.                                                                                                                                                                                 8
Sistema PJSFC Investor Presentation - 2019 г.
CONSOLIDATED FINANCIAL LIABILITIES
Consolidated financial liabilities1,2: composition by borrower and maturity profile
RUB bln

                    711.6                        733.8                         717.9                                                                                                   227.4
                                                  39.3                          38.9
                     55.5                         20.1
                     20.3                         50.8
                                                                                20.5                                                                                         188.2
                     40.6                                                       54.0

                                                 198.3                         171.6
                    203.8
                                                                                                                                                104.5         104.6
                                                                                                                                       65.8
                                                 425.2                         432.9                                 27.4
                    391.5

                 3Q 2019                       2Q 2020                       3Q 2020                                     2020          2021      2022          2023          2024     Thereafter

                MTS         Corporate Centre          Segezha        RTI     Other                                                            Debt and other liabilities

Structure analysis1,2
RUB bln

           3%
                                                                                                                                                                              Liability to
                                5%                     5%                                                                                           Eurobonds
                                                                                                         15%                     11%                                       Rosimushchestvo
          10%                    5%                    6%                         24%                                                                   5%                        1%

          87%                   90%                   89%                                                85%                     89%
                                                                                  76%
                                                                                                                                                                                    Bank
                                                                                                                                              RUB bonds                          loans and
                                                                                                                                                 41%                               other
        3Q 2019               2Q 2020              3Q 2020                      3Q 2019               2Q 2020                   3Q 2020                                             53%

              RUB               USD                Other                       Long-term liabilities            Short-term liabilities

1 Including
          financial liabilities at the Corporate Centre, financial leases and total borrowings of portfolio companies.
2   Management accounts data is presented as of 30 September 2020.                                                                                                                                 9
SG&A EXPENSES
Group SG&A expenses1                              SG&A expenses: portfolio companies1          SG&A expenses: Corporate Centre1
IFRS, RUB bln                                     SG&A / Revenue, %                            RUB bln

                           -3.5 p.p.                                                                                -1.5 p.p.
               19.0%                                                               16.2%
                                                            MTS
                                        15.5%                                      17.7%
               32.0
               1.9
                                          28.7
                3.5
                                          1.8                                                              3.5
                                          1.1                                      17.6%
                1.0
                1.0                       0.9           Segezha
                                          0.5
                                                                                      20.8%
                2.9                       3.3
                                                                                                          2.1%

                                                                       3.4%
               21.7                       21.0           Steppe                                                                    1.1
                                                                            9.7%

                                                                                                                                  0.6%
             3Q 2019                    3Q 2020                                                          3Q 2019                 3Q 2020
                                                                            8.0%
                                                          Medsi
       MTS                             Segezha                                11.3%                      Corporate Centre SG&A
       Steppe                          RTI
       Corporate Centre                Other                                                             Corporate Centre SG&A/Group revenue

                Group SG&A / Group revenue                        3Q 2020       3Q 2019

Group SG&A declined by 10.5% year-on-             The     SG&A/revenue ratio   significantly   The Corporate Centre SG&A and the
year in 3Q 2020 primarily due to reduced          decreased year-on-year across most key       Corporate Centre SG&A/Group revenue
SG&A of the Corporate Centre and                  assets in 3Q 2020.                           ratio decreased significantly year-on-year
reduced commercial and personnel                                                               as a result of the high base effect - bonuses
expenses at MTS. The SG&A/Group                                                                were paid out in 3Q 2019 due to the
revenue ratio decreased by 3.5 p.p. year-                                                      monetisation of assets.
on-year to 15.5%.
1 Source:   management accounts.                                                                                                               10
SISTEMA: FOCUS ON SUSTAINABILITY IN SISTEMA
Approach to sustainability management                                           FTSE4Good Index
-   Sustainability is an integral element of Sistema’s activities, investment   -   In 2019, Sistema confirmed its inclusion in the FTSE4Good Index
    strategy and long-term success. The Corporation was one of the first            Series
    Russian companies to join the UN Global Compact in 2002.
                                                                                MSCI ESG Ratings
-   In 2020, Sistema’s Sustainability Policy was approved by the Board of
    Directors as a key document setting out the approach to sustainability      -   In 2019, Sistema improved its position and received a rating of BB
    and responsible investment, including integration of material ESG               (on a scale of AAA-CCC) in the MSCI ESG Ratings assessment,
    factors throughout the investment process and asset ownership.                  compared to B in 2018
-   Sistema has identified three key ESG areas, which are a natural
    continuation of its investment strategy and where long-term value can       MoEx-RSPP ESG Ratings and Indices
    be created for stakeholders:                                                -   Since 2016, Sistema has been included in the leaders’ group of the
          o The accessibility and quality of products and services                  ESG ratings compiled by the Russian Union of Industrialists and
                                                                                    Entrepreneurs (RSPP) and since 2019 has been a constituent
          o The wellbeing       of   employees,    customers    and    local        member of the new MoEx-RSPP ESG exchange indices
            communities
          o A smart, efficient and safe environment                             RAEX-Europe ESG-Ranking
-   As a corporate citizen Sistema and the Group companies contribute           -   AFK Sistema hit the top-15 for the first time entering the ESG-ranking
    to social development through the Sistema Charitable Foundation in              of Russian companies by the RAEX-Europe rating agency.
    areas such as education and technology, the social environment and
    volunteering, and culture and the arts.                                     CDP Climate Change Rating
-   Sistema Group companies made a significant contribution to the
                                                                                -   AFK Sistema received a “B” score and is among the top-7 Russian
    nationwide efforts to combat the COVID-19 pandemic and provided
                                                                                    companies that responded to the CDP Climate Change
    comprehensive support to their employees, partners and
                                                                                    questionnaire in 2020.
    communities, including inter alia: producing testing systems, vaccine,
    medication and PPE, treating COVID patients, adapting services,             -   The results of other ratings can be found at the corporate webpage
    supporting medical personnel and more.                                          “ESG Indices and Ratings".

Sistema attracts first ESG financing
-   In November 2020, Sistema agreed with Sberbank to open a framework credit line, with the option to tie the interest rate on each loan to
    sustainability performance (Sustainability Improvement Loan).
-   By entering this agreement, Sistema has committed to integrating responsible investment principles into its investment process and business
    model. Sustainable development is an integral part of Sistema's strategy, and will be established as one of the key benchmarks for investment
    decision-making and asset management.

                                                                                                                                                             11
KEY PORTFOLIO ASSETS

                       12
MTS: SUSTAINABLE FINANCIAL GROWTH AND HIGH DIVIDEND
PAYOUT
RUB bln
          1
                                              3Q 2020               3Q 2019                     YoY                 9M 2020               9M 2019                   YoY             Revenue, RUB bln
Rev enue                                               129,0                123,0                    4,9%                    366,4                 349,0                  5,0%
Adj. OIBDA     2
                                                        58,8                 57,4                    2,4%                    161,8                 160,8                  0,6%                         +4.9%
Adj. OIBDA margin                                      45,6%                46,7%                (1,1) п.п.                  44,2%                 46,1%              (1,9) п.п.                                  129.0
                   3
                                                                                                                                                                                              123.0
Adj. net profit                                          9,4                   9,2                    2,6%                    24,8                   22,6                  9,7%
Net debt 4                                             349,8                 339,0                    3,2%                   349,8                  339,0                  3,2%
Capex                                                   23,4                  22,0                    6,1%                    64,2                   61,3                  4,6%

Revenue                   increased year-on-year in 3Q 2020 due to growth in mobile services revenue on the back of a tariff
                                                                                                                                                                                            3Q 2019              3Q 2020
                          increase in 1Q 2020. In addition to the key Telecom segment, growth was delivered across other
                          business segments, including Fintech, Media and B2B Digital & Cloud. Growth in the revenue of MTS
                          Bank amounted to 15.5% year-on-year, and revenue from the sale of smartphones and accessories
                          increased by 2.9% year-on-year.
                                                                                                                                                                                    Adj. OIBDA, RUB bln
Adj.                       increased year-on-year in 3Q 2020, following revenue growth and reduced commercial and personnel
                           expenses, and despite a fall in revenue from international roaming.
OIBDA                                                                                                                                                                                                   +2.4%
                          grew year-on-year in 3Q 2020 due to a steady revenue flow from the core telecom business and lower                                                                  57.4                 58.8
Adj.                      net interest expenses on the back of lower interest rates.
net profit
                          grew year-on-year in 3Q 2020 mainly due to increased investments in network development and growth
Capex                     in foreign currency expenditure amid rouble depreciation.

                          MTS expects revenue growth of more than 3% in 2020, OIBDA growth of up to 2%, and capital                                                                         3Q 2019              3Q 2020
Outlook
                          expenditure to remain at RUB 90 bln, including the realised effect from the use of derivatives.
for 2020
High                      In September 2020, the Extraordinary General Meeting of Shareholders approved dividends for 1H 2020
dividend                  to the amount of RUB 8.93 per ordinary share.
payout ratio
Key                       MTS announced a partnership with the Spotify streaming service. As part of an exclusive offer, MTS
highlights                subscribers receive a free subscription to Spotify Premium for six months.
                          MTS was granted Russia’s first license for 5G operations in the 24.25–24.65 GHz mmWave band. The
                          license covers 83 Russian regions. Business clients and large industrial enterprises will be the first to use
                          the 5G network.
                          In September 2020, S&P upgraded its credit rating on MTS to the BBB- investment grade.
1 MTS’s results reflect reclassification of the Ukrainian business as part of discontinued   operations since 4Q 2019. The results for 3Q 2019 and 9M 2019 have been restated to reflect the results of this reclassification.
2 Adjustment for a one-off asset disposal in the amount of RUB 1.2 bln in 9M 2020.
3 Hereinafter net profit is presented in Sistema’s share.
4 Hereinafter net debt includes financial lease.
                                                                                                                                                                                                                                 13
SEGEZHA: LEADING FORESTRY HOLDING
Highlights                                                                          Leadership in production costs (var.): unbleached sack paper
-   Russia’s largest vertically-integrated forestry holding                         € / tonne

-   One of the top forest leaseholders in Russia: allowable cut ≈ 7.8 mln
    m3                                                                                                                                                          696
                                                                                                                                                    485
    High share of in-house raw wood supply in key products provides the                               361      451      452     462         466
-
                                                                                      302       309
    ability to control production costs
-   > 70% of revenues generated by exports

Strategy
                                                                                     Czech Segezha Turkey France Sweden Austria             Spain   Italy   Finland
-   Expansion of capacity and improvements in operating efficiency                  Republic
    as a result of the large-scale Investment programme
-   Accretive M&A in Russia and globally                                            Leadership in production costs (var.): birch plywood
Share of wood in manufacturing costs of Segezha’s key                               € / m3
products                                                                                                                                                  500
                                                                                                                                    390
                                                                                              250           255

                       36%                                            59%                Segezha            Russia              Latvia               Finland

                 Sack paper                                        Sawn timber      Segezha’s 9M 2020 revenue and OIBDA by business segment
                                                                                    RUB bln
                                                                                       28.1                                           Revenue        Adj. OIBDA

                                                                                                        14.0
                       56%                                            40%                       7.6                           6.2
                                                                                                                  2.9                 1.8           1.9

            Glued timber and                                    Birch plywood and                                                                           -1.1
         prefabricated home kits                                   particleboard      Paper&paper     Wood processing         Plywood                 Other
                                                                                         sacks
Source: Fisher International data (2019), Indufor data (2019)                                                                                                         14
1
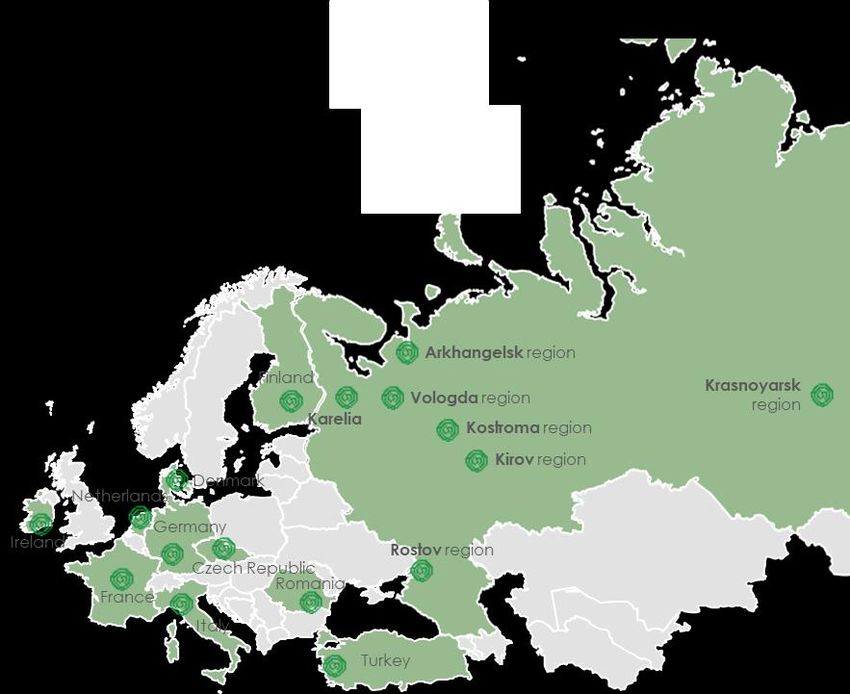
SEGEZHA: GLOBAL FOOTPRINT
Production facilities and offices in 11 countries

            #3                                                         #2                                                          #1
            Sack paper, Global                                         Paper sacks, Europe                                         Sawn timber, Russia
            thsd tonnes / a                                            mln sacks                                                   thsd m3 / a
                                                                                4                                                              3
      West Rock                                    775                 Mondi                                  5 228       Segezha Group                                       1400

              Mondi                             755         Segezha Group                 1 262                                          ULK                             1200
                      2
Segezha Group                     375                             Gascogne          560                                                  Titan                    850

          Qingshan                333                             Stora enso        260                                                   VLP              450
BillerudKorsnäs             180                              Smurfit Kappa          260                                    Ilim Timber (Rus)               450

                          #5
                          Large size birch plywood, Global
                          thsd m3 / a

                              Sveza                                   1 118

                               UPM                 435

                  Latvijas Finieris           260

                 Syktyvkarsky PM             240

                 Segezha Group             192

1 According  to Segezha’s internal research of 31 December 2019. Data on sack paper and large size birch plywood based on product capacity. Data on sawn timber, paper sacks based on final product output.
2 About  36% of the paper produced is converted into paper packaging.
3 Around 10% of the sawn timber total output is processed into glued timber.
4 Includes global production of Mondi.
                                                                                                                                                                                                              15
SEGEZHA: LEADING POSITIONS IN ATTRACTIVE SEGMENTS OF THE
GLOBAL MARKET WITH HIGH BARRIERS TO ENTRY
Global demand, sack paper                                                 Global demand, birch plywood                          Global demand, timber
Mln tonnes                                                                Mln m3                                                Mln m3

                                                                                                                                  Sawn timber                            +3.6%
                                          +1%                                                                    +2%              Glued timber             +1.5%
                                                         8.2                                                                                                                     417
                                            8.0                                                                          6.2                                       396
                               7.2                                                                                5.6                                 364                         7
     6.0          6.6                                                                                      5.0                               322       6
                                                                                                                                                                    6
                                                                                             4.2                                   271           5
                                                                              3.2
                                                                                                                                    5

                                                                                                                                                      358          390           410
                                                                                                                                   266          317

   2010         2015          2020         2025         2030                 2010          2015          2020    2025    2030     2010       2015     2020         2025          2030

European demand, sack paper                                              Global demand, bleached softwood pulp                  Global demand, bleached hardwood pulp
Mln sacks                                                                Mln tonnes                                             Mln tonnes

                                         +0.6%                                                                   +1.4%                                             +1.8%

                                                                                                                         29
  6 554         6 064                     6 015        6 198                                               26     27                                               38            42
                             5 633                                             22            24                                                 30    35
                                                                                                                                   25

  2010          2015         2020          2025         2030                 2010          2015           2020   2025    2030     2010       2015     2020         2025          2030

   %       CAGR’19-30

Sources: Fisher, Hawkins Wright, Poyry, RISI, Indufor, Eurosac, FAO, ISC, Woodstat, Timber-Online, HolzKurier                                                                           16
SEGEZHA: KEY INVESTMENT PROJECTS
               Segezha West Project
               -   Construction of a new production facility of market pulp in the Karelian region
               -   Capacity : 1,500,000 tonnes                                                                        ≈ RUB
               -   Launch: 2024                                                                                      150 bln
               Segezha PPM modernisation
               -   Modernisation of the existing Segezha PPM in the Karelian region for sack paper production
                                             Current
               -                          situation
                   Capacity increase: 32,000  tonnes                                                                 ≈ RUB
               -   Current status: ongoing                                                                           4.7 bln
               -   Launch: 2023

               Plywood mill in Kostroma
               -   New plywood mill in the Kostroma region (greenfield)
               -   Capacity increase: 125,000 m3                                                                     ≈ RUB
               -   Current status: under construction                                                                12 bln
               -   Launch: 2021

               Cross-laminated timber (CLT) mill
               -   Currently there is no CLT market in Russia. If it were to follow the same growth path as in the
                   EU, the demand could be ~0.5 mln m3 by 2030 (source: Poyry)
               -   Capacity increase: 50,000 m3 of CLT panels and 16,000 m3 of glulam products                       ≈ RUB
               -   Current status: under construction                                                                3 bln
               -   Launch: 2020

               Sokol PPM
               -   Modernisation of the pulp and paper mill in Sokol to produce sack paper and
                   greaseproof paper
                                                                                                                     ≈ RUB
               -   Capacity increase: 60,000 tonnes
                                                                                                                     9.2 bln
               -   Current status: under construction
               -   Launch: 2023

                                                                                                                               17
SEGEZHA GROUP: STRONG FINANCIAL PERFORMANCE AMID
EXPORT REVENUE GROWTH
RUB bln                                   3Q 2020        3Q 2019        YoY           9M 2020       9M 2019         YoY      Revenue and OIBDA by
Rev enue                                        19,0           13,7         38,0%           50,2          43,7         14,7% segments in 3Q 2020, RUB bln
Adj. OIBDA                                        5,1            2,5      105,8%            11,3          10,2         10,4%
Adj. OIBDA margin                              26,8%          18,0%       8,8 p.p.         22,5%         23,4%      (5,9 p.p.)             Revenue       OIBDA
Adj. net profit / (loss)                         (3,3)          0,2           n/a           (5,4)          4,3            n/a
Net debt                                         49,7          38,0         30,9%           49,7          38,0          30,9%
Capex                                             2,2           1,6         42,0%             9,5           4,2       123,4%
                                                                                                                                                                 10.8
FX-denominated rev ., %                        70,1%         67,8%        2,3 p.p.         70,5%         70,0%        0,5 p.p.     Paper &
Own consumption, %                             85,6%         74,1%       11,5 p.p.         77,8%         73,0%        4,8 p.p.    packaging
                                                                                                                                                      3.0
Total forestry, thsd cu m                     1 246,9       1 147,5          8,7%         4 092,1       3 703,1         10,5%

Revenue              increased significantly year-on-year in 3Q 2020 mainly due to growth in sales and production of paper
                     and sawn timber. Export revenue dynamics were significantly impacted by the growth of the average
                                                                                                                                                           5.5
                     FX rate year-on-year: EUR by 20%, USD by 14%.                                                                   Wood
                                                                                                                                   processing
Adj.                 increased by more than twofold year-on-year in 3Q 2020 following revenue growth due to increased                                1.5
                     share of high-margin products and rouble depreciation.
OIBDA

Adj. net             in 3Q 2020 compared to adjusted net profit in 3Q 2019 was mainly due to the effect of currency
                                                                                                                                                     2.0
                     exchange differences from the revaluation of the company’s FX-denominated debt.
loss                                                                                                                             Plywood and
                                                                                                                                    boards
                                                                                                                                                   0.7
CAPEX                in 3Q 2020 amounted to RUB 2.2 bln, investments were focused on the construction of a CLT plant, the
                     purchase of logging equipment, the integration of the SAP S/4HANA system, and the modernization of
                     existing facilities.

Business             In August 2020, the Sokol PPM launched a new production facility for technical powdered                                       0.7
                     lignosulphonates which are used for the production of black carbon for cement manufacturing and
development          road construction, with an annual capacity of 21 thousand tonnes per year.
                                                                                                                                       Other
                                                                                                                                            -0.2
                     In July 2020, a new splicing line with a capacity of 25 cu m of glued products per hour was launched at
                     the Sokol Wood Processing Plant in the Vologda region. As a result, the production of finished glued
                     products at the facility will increase by 20% to 100 thsd cu m per year.
                     In Q3 2020, Segezha Group continued to integrate a new enterprise management system based on SAP
                     S/4HANA. The system is expected to be fully operational in 2021.
                     In October 2020, the first trial CLT panel was produced at a new CLT plant in the Vologda region. The
                     capacity of the new production line will amount to 50 thsd cu m. The plant is at the final stage of
                     construction, and is scheduled for launch in December 2020.
                                                                                                                                                                        18
SEGEZHA GROUP: GROWTH IN SALES OF PAPER, SACKS AND
SAWN TIMBER
Trends across key segments                                                                                                    Sales
                                                                                                                              Sack paper1, thsd tonnes
                        In 3Q 2020, Segezha Group's paper production increased by 16.4% year-on-year to 102.71 thsd
                        tonnes mainly due to the postponement of planned annual equipment maintenance works from                            +58.1%
Sack
                        3Q 2020 to 4Q 2020, as well as improved efficiencies. The volume of paper sales increased by              `                    81
paper                   58.1% to 81.2 thsd tonnes following the growth in production volumes and as a result of inventory             51
                        reduction. Additional volume was sold to existing customers.
                                                                                                                                  3Q 2019            3Q 2020

                                                                                                                              Paper sacks, mln units
                        In 3Q 2020, the sales volume increased by 4.9% year-on-year to 358.9 mln units due to a recovery in
                        demand from the European construction industry, following a downturn in 1H 2020 as a result of the                  +4.9%
Paper
                        COVID-19 pandemic. The recovery in demand allowed for a reduction in warehouse inventory.                     342              359
sacks                   The decrease in production volume by 1.0% year-on-year to 335.62 mln units was due to a
                        decrease in demand in the Russian market during the COVID-19 pandemic.

                                                                                                                                  3Q 2019            3Q 2020

                        In 3Q 2020, plywood production decreased by 2.7% year-on-year to 45.8 thsd cu m. Sales volume         Plywood, thsd m3
                        in 3Q 2020 decreased by 21.1% to 38.1 thsd cu m. mainly due to the weakening of demand in the
Plywood                 main sectors of plywood consumption due to the COVID-19 pandemic. Revenue from plywood                              -21.1%
                        sales was maintained at the level of 3Q 2019 due to an increased share of higher-margin products              48               38
                        in sales in key markets, including the promotion of a new type of plywood in Australia, New
                        Zealand and North America.
                                                                                                                                 3Q 2019             3Q 2020
                        In 3Q 2020, sawn timber production increased by 17.2% year-on-year to 325.6 thsd cu m due to the
                        acquisition of Karelian Wood Company LCC, a logging and woodworking enterprise, in early 2020,        Sawn timber, thsd m3
                        and an increase in production volumes at existing enterprises. Output was also significantly
                        impacted by the reallocation of production capacity at the Sokol PPM from glulam products to                        +55.9%
Sawn
                        sawn timber in 3Q 2020 due to the commissioning of a new splicing line, which will increase the                                339
timber                  glulam production capacity of the Sokol PPM by 20%. Sawn timber sales volume in 3Q 2020                       218
                        increased by 55.9% year-on-year to 339.3 thsd cu m following an increase in production. The year-
                        on-year growth was also due to an uneven distribution of revenue in the segment between 3Q
                        2019 and 4Q 2019.                                                                                         3Q 2019            3Q 2020

1   Circa 26.7% of paper produced was supplied to Seghezha Group’s own converting facilities to produce paper packaging.
2   Including 18.8 mln consumer paper bags.                                                                                                                    19
STEPPE: INVESTMENT APPEAL OF THE RUSSIAN CROP FARMING SEGMENT
Land is cheaper than in other countries1
USD thsd / ha, 2019                                                                                          - The Russian agricultural land market remains
                                                                                                               fragmented, however the process of consolidation
                                                                                                               continues, especially in the most attractive
                                                                                                5 – 40
                                                                                                               Southern region.
                                                                                                             - The price of arable land has the potential to grow
                                                                            5 – 20                             fivefold compared to global peers, especially
                               5 - 10                 5 - 10                                                   given recent Russian ruble depreciation, which
       0.5 – 3.5                                                                                               pushes down dollar-denominated prices and
                                                                                                               increases returns per ha.
           Russia             Argentina               Brazil                USA             Western Europe
                                                                                                             - The cost of wheat growing in Russia remains at
                                                                                                               record lows due to the utilisation of modern
The lowest cost of wheat growing                                                                               technologies and depreciation of the rouble.
USD / tonne, 2019                                                                                            - Modernisation of the industry and advanced
                                                                                                               technologies have significantly increased average
    225                                                                                                        crop yields and improved the stability of harvests.
                      200
                                     170             150             130             108                     - Smaller and less efficient companies are leaving
                                                                                                  84
                                                                                                               the market, which creates great opportunities for
                                                                                                               consolidation.
    USA              EU -25       Canada         Argentina       Kazakhstan       Ukraine        Russia      - Currently, dollar wheat price is near its 10-year
                                                                                                               historical lows. As soon as wheat price rebound,
Significant yield growth potential                                                                             the value of land assets will increase.
Wheat yield, tonnes / ha, 2019

     5.9             5.6
                                 4.2
                                               3.5             3.4
                                                                           2.7         2.6
                                                                                                   1.0

    EU-25           China     Ukraine         USA        Canada        Russia         Turkey   Kazakhstan

1All data is shown for land with above-average crop yields.
Source: US Department of Agriculture, Rosstat, Agroholding Steppe                                                                                                    20
STEPPE: RUSSIA IS A GLOBAL LEADER IN CROP FARMING AND
AGRICULTURAL EXPORTS
1. Russia is one of the world's largest producers of grain                                   2. … and especially wheat
    Production output in Russia, 2019, mln tonnes                                              Share of global wheat production, 2017-2019

                                                                                     74.5
                                                                                                                                  Ukraine; 4%
                                                                                                                  Canada; 4%
                                                                             54.4                                 USA; 7%                       Other; 25%

                                                                                                          Russia; 10%
                                               20.5          22.1
                                16.3

     1.4           4.4                                                                                      India; 13%
                                                                                                                                                  EU; 20%
     Rye           Oat       Sunflower        Barley      Potatoes Sugar beet       Wheat
                                                                                                                         China; 18%

3. Russia is also one of the leading grain exporters ...                                     4. … with strong potential for further growth
    Share of global wheat exports, 2017-2019                                                   Russia’s wheat export volumes (by crop years), mln tonnes

                                                                                                                                                                55
                                                                                    20%
                                                                                                                                 41
                                                                        15%                                                               36       35
                                                       14%
                                       13%
                                                                                                                         28
                      10%                                                                                       24
                                                                                                       22
       7%                                                                                      18

   Australia        Ukraine         Canada              EU              USA         Russia   2013/14 2014/15 2015/16 2016/17 2017/18 2018/19 2019/20         Potential

Source: FAOSTAT, US Department of Agriculture, Rosstat, Agroholding STEPPE                                                                                               21
STEPPE: PRESENCE IN HIGH-POTENTIAL SEGMENTS AND VERTICAL
INTEGRATION
                              84.6%
      Sistema PJSFC                               STEPPE

      50.0%                                                                               100%

         RZ Agro                                                              Assets of STEPPE

                                                                                                                        Sugar and grocery
 Field crop production              Grain trading               Dairy Farming                 Fruit production
                                                                                                                              trading

Land bank:                    Own and third-party          6 dairy farms                  Orchards: 780 ha            Wholesale trade of sugar
                              grain trading                                                                           and cereals
o Steppe 560 thsd ha          (deep + shallow water)       Livestock >16 thsd head
o incl. RZ Agro 110 thsd ha
                                                           Production >70 thsd tonnes     Production 28 thsd tonnes   Sale of sugar and cereals
                              Export ≈ 2.1 mln tonnes
                                                           of milk / year                 of apples / year            under AgroHolding STEPPE
Production ≈ 1.4 mln tonnes
                              Grain elevators ≈ 0.5 mln                                                               Sales volume > 300 thsd
                              tonnes                       Yield of ca. 10 tonnes / cow                               tonnes
                                                           per year
                              Terminal 2 mln tonnes
                              (in stage of completion)

 Steppe AgroHolding is a major diversified player in the Russian agricultural industry, with significant growth and
              value creation potential that can be realised through synergies across segments.

                                                                                                                                                  22
STEPPE: STRATEGY FOR EXPANSION OF LAND HOLDINGS
Expansion of Sistema's land holdings                                           Geographical footprint
thsd ha
                                                                                                                             Russia
                                                                       >600
                                                    +144   560
                                                                                                                                Steppe

            Steppe              +65   +21    +15
                                                                                                   Geographical
                     +178                                                                          footprint of
   JV
                                                                                                    Steppe
RZ Agro
                                      380    401
             +38

     99
    12-13    14-15   2016      2017   2018   2019   2020 09'2020   …   2021E

Highlights                                                                     Russia's best agricultural regions
                                                                               Wheat yield, tonnes / ha
-    Quality land in the most attractive agricultural regions of Russia
     (Krasnodar, Rostov and Stavropol)
                                                                                                     Regions of Steppe's presence
-    Unique share of land in ownership compared to Russian peers: 60%

-    Proximity to sea and river grain terminals                                                              6.0

-    Significant potential for increasing production, crop yields and                                                     3.7             3.8
                                                                                       2.7
     OIBDA in all M&A deals

-    Focus on acquisition of assets at attractive prices vs peers
                                                                                Russia's average          Krasnodar    Stavropol         Rostov

Source: Rosstat, Agroholding STEPPE                                                                                                               23
STEPPE: LAND VALUE GROWTH POTENTIAL IN RUSSIA
Global growth of agricultural land prices                                                           Global market
USD thsd / ha                                                                     2002       2016
                                                                                                    - For the past 15 years, land prices have been growing at a
                                                                                                      significant rate.
                                                                                                    - A substantial value growth was achieved through the
                                                                                USD 40 thsd
                                                                                                      adoption of advanced agricultural technologies that
        +7%         +8%         +19%            +10%           +4%
                                                                                                      generate higher income per ha.
                       24.7                                                                         - The upward trend is expected to continue due to growing
                                                                                                      food consumption and a limited amount of land available.
                                   13.8
       10.1        8.9
    3.9                                                             6.7         USD 4.5 thsd
                               1.2            0.8 3.1         3.6
                                                                               Price range
        USA       Germany      Poland           Brazil        France              Europe

    %     CAGR’02-16

Growth of average agricultural land prices, Russia1                                                 Russian market
RUB thsd / ha                                                         2012       2016        2020
                                                                                                    - Land prices in the southern parts of Russia have grown
                                                                                                      substantially in the last 8 years (CAGR’12-20 in the Krasnodar
                +19%                          +10%                             +11%
                                                                                                      region was +19%).

                         220                                                                        - The price of quality land in Krasnodar is currently 3,5-4,0 USD
                                                                                                      thsd / ha.
                 125                                                                                - There is potential for matching the price of comparable assets
                                                         85                             85            in Europe (USD 12-15 thsd / ha).
                                                75                               65
          55
                                        40                                38                        - Long-term growth can be driven either by an improved
                                                                                                      system of subsidies and infrastructure or a better economic
                                                                                                      environment.
              Краснодар
               Krasnodar                  Ставрополь
                                          Stavropol                            Ростов
                                                                               Rostov

    %     CAGR’12-20

1All data is shown for land with above-average crop yields.
Source: Savills World Research                                                                                                                                          24
STEPPE: GROWTH IN THE DAIRY FARMING SEGMENT
Russia's milk market                                                                                Cow numbers and milk yield per cow in Russia
mln tonnes                                                                                              Milking cows herd
                                                                   Potential growth
                                                                                                        Yeild / cow in agri enterprises, tn / cow                                    6.5
    Milk import       Milk production                                                                                                                                        5.9
                                                                       up to 38-40
                                                                                                                                                                                           7,0

                                                                                             16,0

                                                                                                                                                      5.4      5.7
                                                                       mln tonnes            14,0

                                                                                                                                        4.8    5.1                                         6,0

                                                                                                         4.3      4.5         4.5
     9.4      9.2        7.9          7.0    6.6       6.4       6.4                         12,0
                                                                                                                                                                                           5,0

                                                                                             10,0
                                                                                                                                                                                           4,0

                                                                                              8,0

                                                                                                                                                                                           3,0

    30.5     30.8       30.8          30.8             30.6     31.3
                                                                                              6,0

                                             30.2                                                        9.0      8.9         8.4       8.3    8.1
                                                                                                                                                                                           2,0

                                                                                              4,0

                                                                                                                                                      8.0      8.0           7.9     8.0
                                                                                                                                                                                           1,0

                                                                                              2,0

                                                                                              0,0                                                                                          -

    2013     2014       2015          2016   2017     2018      2019       …        2020
                                                                                   2025-30              2011     2012         2013     2014   2015    2016     2017      2018       2019

-     Consumption of milk & dairy products: ~37.7 mln t (share import =17%)                         -    The downward trend in population of milk cows is explained by a
                                                                                                         reduction in the number of individual farmers and the closure of
-     The milk output has remained the same: ~ 31 mln t in the last 5 years
                                                                                                         inefficient producers, which is partially offset by increased milk yields.

Share of market-grade milk in Russia                                                                Dairy farming results at Steppe AgroHolding
                                                                                                           Milk cows, thsd head
                                                                                                           Milk yield per cow, thsd l/year
                                                                                                           Commissioning of new farms
                                                                                                                                                       9,000         9,000         9,000
              30%                                   Milk suitable for processing
                                                                                              10                                                                                           10,60

                                                                                                                                              7,172
                                                                                               9
                                                                                                                                                                                           10,40

                                                                                               8

                                                                                                                                                                                           10,20

                                                                                                         3,883                       4,908                            10.3         10.4
                                                                                               7

                                                    Low quality milk                           6

                                                                                                                     4,230
                                                                                                                                                                                           10,00

                                                                                                                                              10.1
                                                                                               5                                                                                           9,80

                                                                                               4

                                                                                                                                                        9.8
                                                                                                                                                                                           9,60

                                 70%                                                           3

                                                                                                          9.8           9.7                                                                9,40

                                                                                                                                      9.5
                                                                                               2

                                                                                                                                                                                           9,20
                                                                                               1

                                                                                               0                                                                                           9,00

                                                                                                         2016        2017            2018     2019      2020          2021         2022

-     The share of market-grade milk in Russia's total milk output is 70%, which                    -    As of today, STEPPE’s production efficiency exceeds its competitors by
      leads to a shortage of quality milk for processing => milk import.                                 47% on average.
-     Import substitution potential: Ongoing sector consolidation and the                           -    It would take 4-5 years of optimisation and efficiency enhancement
      deficit of raw milk create favourable conditions for developing modern                             measures for competitors to reach the current operational results of
      high-quality dairy farms.                                                                          STEPPE.

Source: Fedstat, Agroholding STEPPE                                                                                                                                                                25
STEPPE: IMPRESSIVE REVENUE AND OIBDA GROWTH AS BUSINESS
EXPANDS
RUB bln
          1,2                                       3Q 2020             3Q 2019                YoY                9M 2020             9M 2019                YoY           Revenue, RUB bln
Rev enue                                                     14,7                  9,9             48,4%                  22,3                 19,1              16,7%
OIBDA                                                          2,2                 1,2             80,9%                    4,9                  3,6             37,3%
                                                                                                                                                                                             +48.4%
OIBDA margin                                                14,9%               12,3%             2,7 п.п.               21,9%                18,7%             3,3 п.п.
Net profit / (loss)                                          (0,2)               (0,0)                n/a                   1,6                 0,7             124,1%                                    14.7
Net debt                                                     23,1                21,4                8,1%                  23,1                21,4               8,1%                 9.9
Capex                                                          0,9                 0,5              97,8%                   1,8                 1,2              53,4%

Revenue                  significantly increased year-on-year in 3Q 2020 primarily due to:
                                                                                                                                                                                   3Q 2019              3Q 2020
                         -   increased revenues in the Crop Production and Agrotrading segments through increased sales
                             volumes of agricultural products and higher grain prices;
                         -   positive dynamics in the Dairy Farming segment as a result of higher production volumes due to
                             an increase in the number of highly productive lactating cows and improved efficiency of dairy OIBDA, RUB bln
                             farms;
                         -   Increase in sales volume and price of sugar.                                                             +80.9%

OIBDA                    significantly increased year-on-year in 3Q 2020 due to an effective sales strategy for own                                                                                        2.2
                         agricultural products, improved operating efficiency in the Agrotrading segment and successful
                         implementation of the strategy of time arbitrage in the Sugar and Grocery Product Trading                                                                    1.2
                         segment.

                         amounted to RUB 0.9 bln in 3Q 2020. The bulk of capital investments were made to renew the                                                                3Q 2019              3Q 2020
CAPEX
                         agricultural machinery fleet, implement projects to build and modernise dairy farms, and buy out
                         land shares.

Net debt                 increased year-on-year in 3Q 2020 due to the acquisition of land assets in 1H 2020 and
                         implementation of the capital investment programme.

1 Steppe results are presented net of results of AGK Yuzhny due to its divestiture in May 2020. Results for 3Q 2019 and 9M 2019 have been revised to reflect the results of this reclassification. OIBDA, OIBDA margin,
operating profit and net loss of Steppe for 3Q 2020 and 9M 2020 reflect the adjustment as a result of 3Q 2020 review of fair value allocation of assets disposed and purchased as part of the buy and sell
transactions in 1H 2020.
2 RZ Agro is accounted for as an investment in a joint venture in Agroholding Steppe’s IFRS financial statements.
                                                                                                                                                                                                                          26
STEPPE: INCREASE IN SALES PRICES AND FOCUS ON IMPROVING
OPERATING EFFICIENCY
Trends in key segments
                                                                                                              Gross harvest, thsd tonnes
     Field Crops                                                                                                                      +6.8%
      Land bank
                    560 thsd hectares As of 30 September 2020, the gross harvest of Steppe amounted to
                                       1,238,000 tonnes (+6.8% year-on-year). Despite difficult weather
                                                                                                                1 042         1 159       1 238
                                       conditions, Steppe delivered high volume of harvest.
                                       In 3Q 2020, the average export price of wheat sales increased year-
       Orchards                        on-year by 20.3%.
                    780 hectares                                                                               9M 2018       9M 2019     9M 2020
  Orchards area
                                                                                                              Milk production, thsd tonnes
                                                                                                                 28.3         28.4         27.4
                                       The Dairy Farming segment reports stable growth: in 3Q 2020, gross
                                       milk    yield      amounted       to     nearly   18,000      tonnes                   17.2        18.0
  Dairy Farming                                                                                                  14.0
  Lactating cows    6,500 cows         (+28.0% year-on-year), while lactating cow productivity grew by 4.4%
                                       year-on-year. The lactating herd reached 6,526 cows at the end of
                                       the reporting period.
                                                                                                               3Q 2019       2Q 2020     3Q 2020
                                                                                                                Production      Price per litre, RUB

                                                                                                              Sales volumes, thsd tonnes

                                       Sales volumes in the Agrotrading segment for 9M 2020 amounted to                      +15.1%
    Agrotrading                        817,000 tonnes (+15.1% year-on-year). Higher wheat sale prices and a
 Sales volumes of   817 thsd tonnes    trading strategy focused on the improvement of operating efficiency          710                 817
           wheat                       helped to increase OIBDA in the segment.

                                                                                                                  9М 2019              9М 2020

                                                                                                              Sales volumes, thsd tonnes
                                       Sales volumes in the Sugar and Grocery Trading segment for 9M 2020
                                       amounted to 244,000 tonnes (+7.4% year on year). Higher margin                         +7.4%
Sugar & Grocery
 Product Trading    244 thsd tonnes    transactions were undertaken as part of a time arbitrage strategy
                                                                                                                    227                 244
   Sales volumes                       that facilitated OIBDA growth in the segment. In 3Q 2020, the sale
                                       price of sugar increased by 32.2% year-on-year.

                                                                                                                  9М 2019              9М 2020

                                                                                                                                                       27
MEDSI: THE LEADING PRIVATE HEALTHCARE GROUP IN RUSSIA
Highlights
-   Leading provider of private healthcare in Russia, offering a
    complete range of services for children and adults                       Services provided            17.3 mln             Patient visits     9.6 mln
                                                                                            annually                                  annually
     o Medsi is #1 in Russia
     o One of Russia’s most recognisable healthcare brands
     o 20+ yeas of successful operations
    Diversified infrastructure: 49 medical facilities, incl. 39 clinics, 5                                                      Physicians
-
    clinical and diagnostic centers, 2 hospitals, 3 wellness centers and
                                                                              Area of facilities           242 thsd m2          employed
                                                                                                                                                  6.2 thsd
    sanatoriums
-   Fast-growing business with an extensive investment programme
    underway
                                                                              х     – # of medical facilities

Key performance indicators
RUB bln
                                                                                      St. Petersburg
      Revenues                Adj. OIBDA              Adj. Net profit
                                                                                                 2

           25.8%                    64.3%                   175.3%                Bryansk
                                                                                     1       32      Moscow                      Nyagan
                                                                                                                           1
                                            5.9                      2.9                                   4
                   25.8
                                                                                                                6                 1
    17.7                     3.6                                                                     Izhevsk        Perm
                                                      1.1                                                                          Nizhnevartovsk
                                                                                             1

    2018           2019      2018           2019     2018            2019
                                                                                             Volgograd

                                                                                                                                         1
                                                                                                                                             Barnaul

                                                                                                                                                             28
MEDSI: STRUCTURAL CHANGES UNDERPIN THE A STEADY GROWTH OF
RUSSIA’S PRIVATE HEALTHCARE MARKET IN RUSSIA
1. The Russian market is experiencing robust growth…                                         2. …with significant headroom for further expansion…
    Healthcare services market breakdown (RUB bln)1                                            Healthcare spend (% of GDP)2

              11.2% CAGR’16-20                                                                                                                                          17.0%

                                                                                                      Average: 8.8%                               11.2%        11.7%
                                                                                                                                         10.3%
                                                                                 3 129
                                           2 461              2 710                                                            6.3%
         1 951          2 033                                                                          5.0%      5.4%
                                                                                              3.6%
                          140                152                181                 184
          138                                                                       543
          396             436                475                504
          177             191                202                207                 215
         2016            2017               2018               2019                2020F      India   China     Russia      Poland        UK     France       Germany    USA

                  Grey market          Out-of-pocket            VHI        State

3. …and great potential for market consolidation…                                            4. …where Medsi is focused on the most attractive segment
    Private healthcare sector, 2019 (Out-of-pocket and VHI)                                    Industry revenue breakdown by segments, 2019

         by revenues                               by revenues
                                                                                                                                         CAGR ‘16-19: 9.5% 8.4%
         in Russia                                 in Moscow
                                   Top 10                                           Top 10
                                                                                              Russia 207                                                                 RUB
                                                                                                                            2 710                       181    504
                                                                                                                                                                        3.6 tln
                         13%
                                                                          38%
                   RUB                                        RUB                                                              CAGR ‘16-19:      3.7%     6.3%
                  685 bln                                    215 bln                                                                                                     RUB
                                                                                             Moscow 18                   360                     106          109
                                                                                                                                                                        592 bln

                                                                                                              Grey market        State     VHI    Out-of-pocket

1 Voluntaryhealth insurance (VHI), mandatory health insurance (MHI), Source: BusinesStat.
2 Both
     government and voluntary, including spending on medical services and goods (pharma).
Source: For OECD – OECD (2019 or latest available), BusinesStat                                                                                                                   29
MEDSI: GROWTH IN FINANCIAL RESULTS ON THE BACK OF
DEFERRED DEMAND FOR MEDICAL SERVICES
RUB bln                                        3Q 2020               3Q 2019                 YoY            9M 2019       9M 2019       9M 2019      Revenue by clients,
Rev enue                                                  6,7                   5,4               25,4%           17,2          16,1          7,2% 3Q 2020
                1
Adj. OIBDA                                                1,8                   1,5               21,0%             4,1           4,0         1,8%      5% 2%
Adj. OIBDA margin1                                     27,2%                 28,2%             (1,0) п.п.        23,8%         25,1%      (1,3) п.п.                            Insurance
Adj. net profit 1                                         1,0                   0,8               23,5%             1,6           1,9      (15,4%)
                                                                                                                                                                                Individuals
Net debt                                                  3,0                   2,7               14,5%             3,0           2,7        14,5%
                                                                                                                                                      35%
Capex2                                                    1,3                   1,1               13,1%             3,7           2,9        26,2%                              Corporate
Patient v isits, thsd                                  2 177                 2 330                (6,6%)         5 396         7 016       (23,1%)                 58%
Serv ices prov ided, thsd                              4 339                 4 165                 4,2%         10 644        12 731       (16,4%)                              Other
Av erage ticket, thsd RUB                                 3,1                   2,3               34,1%             3,2           2,3        39,4%

Revenue                    increased year-on-year in 3Q 2020 due to the deferred demand for medical services following the Revenue by assets,
                           easing of COVID-19 restrictions introduced in 2Q 2020, the return to routine medical care services, 3Q 2020
                           revenues generated from repurposing the hospital in Otradnoe as an in-patient infectious diseases' unit,
                           as well as increased demand for COVID-19 testing and the development of home care and                        7%
                           telemedical support services.                                                                                                                               Clinics*
                                                                                                                                           33%
Adj.                       grew year-on-year in 3Q 2020 on the back of the revenue growth. Adj. net profit year-on-year was                                                            Hospitals
                           impacted by the adj. OIBDA dynamics.                                                                     36%
OIBDA                                                                                                                                                                                  CDC**
Net debt                   increased year-on-year in 3Q 2020 due to the drawing down of credit lines to finance CAPEX
                                                                                                                                                                 24%
                                                                                                                                                                                       Other
                           programmes, including the construction of a medical centre on Michurinsky Prospekt in Moscow. Debt
                           to OIBDA LTM remains at a comfortable level of 0.7x.
                                                                                                                                                      * Primary Care Clinics
Key                        Due to the recent new wave of COVID-19 cases, at the end of 3Q 2020 the Hospital in Otradnoe again                         ** Clinical Diagnostics Centre
                           switched to providing in-patient infectious disease services focused on screening and the treatment of
highlights                 patients with COVID-19.
                           The Clinical Diagnostics Centre (CDC) on Belorusskaya opened a Centre for diagnostics and the
                           treatment of health complications caused by COVID-19.
                           The construction of a new multifunctional centre on Michurinsky Prospekt, with more than 34,000 sq m of
                           space, is nearing completion, with the opening planned for 1Q 2021. The medical centre will include a
                           CDC for children and adults, a daytime in-patient clinic and a 24-hour in-patient clinic with a centre for
                           high-tech surgery.
                           In September and October 2020, Medsi opened a CDC in Maryino with a total area of 4,400 sq m, and
                           two Smart 500 clinics on Poletayev Street and Aviatsionnaya Street in Moscow.
                           The number of downloads of the SmartMed telemedical application and the number of users is growing
                           rapidly. The proportion of appointments made through the application has reached 35-40% of total
                           bookings. A new version of the application has been released that now enables in-app payments.
1 Adjustments  for accruals related to the LTI programme, the effect of clinic acquisitions in Izhevsk.
2 Сapex   excluding M&A.                                                                                                                                                                           30
MEDSI: INCREASE IN THE AVERAGE CHEQUE DUE TO
DIAGNOSTICS AND THE TREATMENT OF COVID-19
                                                                   Floor space                                      Utilisation, clinics3                             Utilisation, hospitals4
Number of
facilities1                      49                                thsd m2                                          %                                                 %

                                                                                     -8.4%                                               +2 p.p.                                       +11 p.p.

                                                                          235.7                                              45%                   47%                                                105%
                                                                                                 215.7                                                                         94%

Number of
patient
                                 2.2 mln
                                                                         3Q 2019               3Q 2020                    3Q 2019                3Q 2020                    3Q 2019                  3Q 2020
visits2
                                                                   Patient visits                                   Services provided                                 Average cheque
                                                                   mln                                              mln                                               thsd RUB
                                                                                     -6.6%                                               -4.2%                                         +34.6%
Number of
physicians                       4,000
                                                                            2.3                   2.2                         4.2                   4.3
                                                                                                                                                                                                       3.1
                                                                                                                                                                               2.3

                                                                         3Q 2019               3Q 2020                    3Q 2019                3Q 2020                    3Q 2019                  3Q 2020
Capacity2                        5     mln visits

                                                                   -   The increase in utilisation was due to deferred demand, changes in seasonal pattern, and the
                                                                       COVID-19 pandemic.
                                                                   -   The decrease in floor space resulted from the non-core assets optimisation programme.

                                                                   -   The average cheque grew due to the rising share of cost-intensive services in the outpatient
                                                                       coronavirus diagnostics segment, and the high average cost of a COVID-19 treatment at the
                                                                       hospital in Otradnoe.

1 Metrics   in the table and hereafter are presented as of 30 September 2020.
2 These   metrics are for 3Q 2020 with capacity calculated as the number of possible out-patient visits at Medsi facilities, and the visits as the actual number of patient visits for the period.
3Outpatient clinics in Moscow.
4 Utilisation accounts for multiple use of one in-patient bed in daytime in-patient facilities .
                                                                                                                                                                                                               31
OZON : OUTSTANDING GMV GROWTH, EXPANSION OF LOGISTICS
                1

INFRASTRUCTURE AND MARKETPLACE DEVELOPMENT
Key highlights:                                                                                                                                                                        GMV, incl. services2
                                                                                                                                                                                       RUB bln
-   The Company retained a triple-digit GMV growth rate year-on-year in 3Q 2020 on the back of an increased
                                                                                                                                                                                                  +188%
    number of marketplace sellers, expansion of the assortment and last mile delivery network.                                                                                 100,0

                                                                                                                                                                                                              +127%
                                                                                                                                                                                        +115%
                                                                                                                                                                                95,0

                                                                                                                                                                                90,0

                                                                                                                                                                                                                               170%
                                                                                                                                                                                85,0

                                                                                                                                                                                80,0

    Throughout 3Q 2020, Ozon worked to expand its logistics infrastructure in order to provide faster delivery to
                                                                                                                                                                                75,0

-
                                                                                                                                                                                70,0
                                                                                                                                                                                                                               120%

                                                                                                                                                                                                    45.8       44.2
                                                                                                                                                                                65,0

                                                                                                                                                                                60,0

    customers and make a wider range of products available in remote cities. The Company commissioned
                                                                                                                                                                                55,0

                                                                                                                                                                                         31.6
                                                                                                                                                                                                                               70%
                                                                                                                                                                                50,0

                                                                                                                                                                                45,0

                                                                                                                                                                                40,0

    new fulfilment-centres in Saint Petersburg and Rostov-on-Don with a total floor area of more than 18,000
                                                                                                                                                                                35,0                                           20%

                                                                                                                                                                                30,0

                                                                                                                                                                                25,0

                                                                                                                                                                                20,0
                                                                                                                                                                                                                               -30%

    and 22,000 sqm respectively3.
                                                                                                                                                                                15,0

                                                                                                                                                                                10,0

                                                                                                                                                                                 5,0

                                                                                                                                                                                 0,0                                           -80%

                                                                                                                                                                                        1Q 2020   2Q 2020     3Q 2020
-   In August 2020, Ozon signed an agreement with Orientir development company to construct a logistics                                                                                 GMV, incl. services
    centre with a floor area of over 150,000 sqm in the Moscow region. Its first phase is expected to launch in                                                                         Growth year-on-year
    2021.
                                                                                                                                                                                       Number of orders4,
-   The Company continues to develop its marketplace platform. As of 30 September 2020, more than 18,000                                                                               mln
    active sellers were registered on the platform.

-   Ozon is developing its financial services ecosystem. As of 30 September 2020, approximately 260,000                                                                 20,0

                                                                                                                                                                                                              16.6
                                                                                                                                                                                         13.1      14.6
    OZON.Cards were activated. Card holders made an average of approximately three orders per month                                                                     15,0

    over the first nine months of 2020, which is approximately 1.6 times more than an average number of orders                                                          10,0

    made by customers that made at least one order per month over the same period in 2020.                                                                               5,0

                                                                                                                                                                         0,0

-   In November 2020, Ozon conducted an initial public offering of its American Depository Shares (ADSs) on                                                                            1Q 2020    2Q 2020   3Q 2020
    NASDAQ, raising proceeds of USD 1,200 mln, including the underwriters’ overallotment option and the
    concurrent private placement, and net of underwriter commissions. OZON also obtained listing of the ADSs                                                                           Number of active sellers5,
    on the Moscow Exchange.                                                                                                                                                            thsd
                                                                                                                                                                        45,0                                            80%

                                                                                                                                                                                                    47%        51%
                                                                                                                                                                                                                        70%
                                                                                                                                                                        40,0

                                                                                                                                                                                                                        60%

                                                                                                                                                                                          33%
                                                                                                                                                                        35,0

                                                                                                                                                                                                                        50%

                                                                                                                                                                        30,0

                                                                                                                                                                                                              18.1
                                                                                                                                                                                                                        40%

                                                                                                                                                                        25,0

                                                                                                                                                                                                   13.5
                                                                                                                                                                                                                        30%

                                                                                                                                                                        20,0

                                                                                                                                                                                         9.2
                                                                                                                                                                                                                        20%

                                                                                                                                                                        15,0

                                                                                                                                                                                                                        10%

                                                                                                                                                                        10,0
                                                                                                                                                                                                                        0%

                                                                                                                                                                         5,0
                                                                                                                                                                                                                        -10%

                                                                                                                                                                         0,0                                            -20%

                                                                                                                                                                                       1Q 2020    2Q 2020   3Q 2020
1 Ozon’s financial results are not consolidated in the financial statements of Sistema PJSFC.
2 GMV incl. services (gross merchandise value including revenue from services) comprises      the total value of orders processed through Ozon’s platform, as well as                   Active sellers
revenue from services to buyers and sellers, such as delivery, advertising and other services rendered by Ozon.ru operating segment. GMV incl. services is inclusive                    Share of Marketplace GMV, %
of value added taxes, net of discounts, returns and cancellations.
3 Footprint area
4 Number of orders is the total number of orders delivered in a given period, net of returns and cancellations
5 Number of active sellers is the number of sellers that sold at least one order on the OZON.ru marketplace over the previous 12 months.
                                                                                                                                                                                                                                      32
ETALON GROUP: STRONG DYNAMICS OF OPERATING RESULTS
AND AMBITIOUS STRATEGIC GOALS
Strategic goals to be achieved by 2024                                                                                   Operating results
                                                                                                                         of the Group
Operational goals:                                              Financial goals:
                                                                                                                         New sales, thsd м2
-   Easy to scale business model through a transition to -         Double-digit sales and revenue growth rates
    digital end-to-end architecture
                                                            -      Gross profit margin before purchase           price                  +10.0%
-   Leadership through partnerships: less capital-intensive        allocation (PPA) of assets of more than 35%
    approach to creation of digital infrastructure                                                                             137.0             150.0
                                                            -      SG&A cost-to-revenue ratio of less than 10%
-   Long-term focus on landbank replenishment through
                                                            -      Guaranteed minimum dividend payment of at
    acquisition of unzoned land plots
                                                                   least RUB 12/GDR with the possibility of the upside
-   Leadership in cost efficiency and the speed of project         as net profit increases
    implementation by standardising the product line and
                                                                                                                              3Q 2019         3Q 2020
    integrating new technologies
-   Industry-leading customer experience through the
    development of additional services and improved                                                                      New sales, RUB bln
    customer communications
                                                                                                                                        +40.3%
Key highlights
-   Thanks to a balanced product offering, the company’s efforts to improve sales efficiency, an updated subsidised                              24.0
    mortgage programme, and the growing investment demand for real estate, Etalon Group delivered strong                       17.1
    results for the first 10 months of 2020.
-   Sales in October 2020: 60.7 thsd m2 worth RUB 9.8 bln – record-setting metrics in RUB equivalent
-   Average price for apartments in October: RUB 191.6 thsd / m2 – record-setting metrics                                     3Q 2019         3Q 2020
-   Average downpayment amount: 93% - one of the highest metrics in the history of the Group

Agreement on the ZIL-YUG project                                                                                         Cash proceeds, RUB bln
-   In 3Q 2020, Etalon Group reached an agreement with Moscow authorities on the final conditions of the Zil-YUG                        +31.8%
    project implementation, the largest complex development project in the Moscow region. According to the
                                                                                                                                                 21.2
    agreement, the company shall pay RUB 32.2 bln in installments till 2024.
                                                                                                                               16.1
-   1.2 mln m2 – total project area
-   1Q 2021 – planned launch of the sales
-   12 years – project implementation period
-   RUB 230 thsd/ m2 – starting price                                                                                         3Q 2019         3Q 2020

                                                                                                                                                         33
1
PHARMA ASSETS (BINNOPHARM GROUP ):
INCREASE IN SALES ACROSS ALL SEGMENTS
RUB bln                                  3Q 2020             3Q 2019                YoY                 9M 2020           9M 2019                YoY            Revenue, RUB bln
Rev enue                                            5,4                 4,2             26,4%                   14,8                12,1              21,9%
                                                                                                                                                                                  +26.4%
OIBDA                                               1,5                 0,9             59,9%                     3,2                2,7              18,9%
OIBDA margin                                     28,2%              22,3%             5,9 p.p.                21,9%               22,5%           (0,6) p.p.                                 5.4
Net profit                                          0,6                 0,1            643,0%                     1,0                0,5              78,5%              4.2
Net debt                                            9,9               11,3            (12,4%)                     9,9               11,3            (12,4%)

-   The joint Binnopharm Group holding includes five production sites across JSC Alium (formerly named Obolenskoe,
    Serpukhov district of the Moscow region), JSC Binnopharm (2 sites: Zelenograd and Krasnogorsk), JSC Sintez (Kurgan),
                                                                                                                               3Q 2019       3Q 2020
    and JSC Biocom (Stavropol).
-   The holding operates a portfolio of more than 450 products, the largest among Russian drug manufacturers.
-   In October 2020, Binnopharm Group announced its strategy to significantly increase the scale of the business. The main
                                                                                                                           OIBDA, RUB bln
    drivers of further growth will be the diversification of sales channels, new product development and updating the
    portfolio of medical products.                                                                                                     +59.9%
-   The CEO of Binnopharm Group is Rustem Muratov.
                                                                                                                                                                                             1.5
Revenue                 in 3Q 2020 increased by 26% year-on-year on the back of increased sales across all channels. Sales in
                                                                                                                                                                         0.9
                        the tender channel increased by 117% year-on-year, in part due to increased sales of antibiotics and
                        drugs used to treat COVID-19. Export growth amounted to 55% year-on-year with sales growth in all
                        foreign markets. In the retail segment, sales increased by 15% year-on-year.
                                                                                                                                                                      3Q 2019              3Q 2020

OIBDA                  in 3Q 2020 significantly increased year-on-year following revenue growth, mainly due to an increased
                                                                                                                                                                 Production of
                       share of high-margin drugs sales in revenue and cost control.
                                                                                                                                                                 pharmaceutical products,
                                                                                                                                                                 mln units
Net profit             in 3Q 2020 increased year-on-year primarily due to OIBDA growth, as well as lower interest expenses.
                                                                                                                                                                         Alium             Sintez
                                                                                                                                                                       +11.3%          +5.4%
Net debt               in 3Q 2020 decreased year-on-year due to positive cash flow and effective working capital
                       management.

Key                    Since August 2020, production of the "Gam-COVID-VAK" (Sputnik V) COVID-19 vaccine, developed at
                       the Gamaleya Scientific Research Institute of Epidemiology and Microbiology, has been underway at                                                                     85
highlights             the Binnopharm plant in Zelenograd. The plant has the capacity to produce approximately 1.5 million
                                                                                                                                                                             81
                       doses of the vaccine per year, with planned future upgrades designed to increase production volumes.
                                                                                                                                                                        16                   18
                                                                                                                                                                      3Q 2019          3Q 2020
1 Financial results of Binnopharm Group are presented to reflect the combination of the financial results of JSC Alium and JSC Sintez based on management accounts.
Financial results of Binnopharm Group are not consolidated in the financial statement of Sistema PJSFC. The data shows 100% net profit.                                                              34
POWER GRIDS (BPGC) AND HIGH-TECH (RTI)
BPGC
RUB bln                                          3Q 2020             3Q 2019               YoY                9M 2020             9M 2019                YoY            Revenue, RUB bln
Rev enue                                                    4,3                 5,0           (14,1%)                   14,7               14,9              (1,6%)
OIBDA                                                       0,5                 1,7           (70,5%)                    3,7                 4,5           (18,8%)                        -1.6%
OIBDA margin                                             12,0%              35,0%         (23,0) p.p.                 24,9%              30,2%           (5,3) p.p.
Net profit / (loss)                                       (0,1)                 0,9                n/a                   1,2                 2,0           (41,4%)                14.9
Capex                                                       1,0                 0,9             11,7%                    2,5                 2,5             (0,9%)
                                                                                                                                                                                                      14.7
Revenue               decreased year-on-year in 3Q 2020 due to a reduction in capacity and net electricity supply. This resulted from a
                      decrease in energy consumption in the oil and gas sector following the OPEC+ agreement, and reduced
                      economic activity in the region amid the COVID-19 pandemic.
OIBDA and             OIBDA declined year-on-year in 3Q 2020 on the back of the decrease in revenue, and due to an increase in costs,                                           9М 2019             9М 2020
                      including wage indexation, repair costs and services provided to Federal Grid Company (FGC). The decrease was
Net profit
                      also significantly affected by creating provisions for accounts receivable for a number of counterparties. OIBDA
                      dynamics were also affected by the restoration of previously accrued reserve on unsettled contractual
                      arrangements with FGC in 3Q 2019. Net loss in 3Q 2020, as opposed to net profit in 3Q 2019, was driven by OIBDA
                      dynamics and a decline in finance income.
Key                   In October 2020, Sergey Gurin was appointed CEO of BPCG. Sergey was Director for Human Resources and
highlights            Administrative Affairs at BPGC from 2012.

RTI
RUB bln                                             3Q 2020            3Q 2019               YoY                9M 2020            9M 2019               YoY            Revenue, RUB bln
Rev enue                                                       5,2                5,4            (3,5%)                  13,7               13,9             (1,7%)
              1
Adj. OIBDA                                                     0,1                1,3          (95,2%)                  (0,1)                1,6                n/a
                                                                                                                                                                                          -3.5%
Adj. OIBDA margin                                            1,2%             24,3%         (23,0) p.p.                   n/a             11,3%                 n/a
Adj. net profit / (loss)                                     (1,1)                0,2               n/a                 (3,6)                1,7                n/a
Net debt                                                     20,2               20,1               0,4%                  20,2               20,1               0,4%                5.4                 5.2
Revenue               decreased year-on-year in 3Q 2020 due to a number of new state procurement contracts by RTI Group companies
                      being postponed.

Adj. OIBDA            Adj. OIBDA decreased year-on-year in 3Q 2020 mainly due to the financial results of Element LLC, a joint venture
                      with the Rostec State Corporation in microelectronics, and the effect of a high base: in 3Q 2019, RTI Group                                               3Q 2019             3Q 2020
and margin            companies performed a significant amount of work on a number of projects, which drove a higher adj. OIBDA
                      margin.

Adj. net loss         Adj. net loss in 3Q 2020 relative to net profit in 3Q 2019 was due to OIBDA dynamics. Net debt remained largely
                      unchanged year-on-year, amounting to RUB 20.2 bln. In addition, as of the end of 3Q 2020, RTI's accounts include
and Net               RUB 3.1 bln of funds earmarked for work under state defence contracts, which are not included in the calculation
debt                  of net debt.
1Adj. OIBDA for 3Q 2020 includes net loss of Element LLC which is accounted for using the equity method of accounting (classified as investments in associates). Excluding the results of Element LLC, adj. OIBDA
of RTI in 3Q 2020 amounted to RUB 0.3 billion.                                                                                                                                                                      35
HOSPITALITY (СOSMOS HOTEL GROUP) & RENTAL ASSETS (BUSINESS NEDVIZHIMOST)
Hospitality assets1
RUB bln                                                3Q 2020           3Q 2019               YoY              9M 2020           9M 2019                   YoY             RevPar3, RUB thsd
Rev enue                                                         0,9               1,5          (41,8%)                   1,9               3,8                (50,3%)
Adj. OIBDA2                                                      0,3               0,6          (53,4%)                   0,1               1,1                (89,5%)
                                                                                                                                                                                             1.6
Adj. OIBDA margin
                          2
                                                              31,7%             39,6%          (7,9) п.п.               5,9%             28,0%               (22,1) п.п.    Hotel Cosmos
                                                                                                                                                                              ГК "Космос"
                        2
                                                                                                                                                                                            0.4
Adj. net profit / (loss)                                         (0,0)             0,2               n/a                (0,8)              (0,2)                    n/a
Net debt                                                           4,1             3,6             13,2%                  4,1                3,6                  13,2%                       2.7
Room capacity                                                   4 132           4 132               0,0%               4 132              4 132                       РоссийскиеRussia
                                                                                                                                                                   0,0%          отели
                                                                                                                                                                                             2.4
Revenue                 decreased year-on-year due to a sharp drop in occupancy caused by the COVID-19 pandemic.
                                                                                                                                                                                                            23.3
Adj. OIBDA               Adjusted OIBDA decreased year-on-year on the back of the decline in revenue, while hotels maintained an              Abroad
                                                                                                                                      Зарубежные отели
                         austerity regime to minimise losses. Adj. net loss was due to the negative OIBDA dynamics. The share of revenue                                                               13.7
and Net
                         from hotels outside Russia in 3Q 2020 fell to 23.3% (from 28.8% in 3Q 2019).
loss
                                                                                                                                                                                  3Q 2019           3Q 2020
Key                     In 3Q 2020, ADR4 for the Group's hotel portfolio increased year-on-year from RUB 4,200 to RUB 4,600 (+ 8%) primarily
indicators              due to foreign hotels (Euro +14%) and the Cosmos Collection Izumrudny Les and Cosmos Collection Altay Resort
                        hotels (RevPAR growth of 17% due to high demand for hotels in this segment).
                        RevPAR3 of the hotel portfolio decreased from RUB 2,900 to RUB 1,900 against the backdrop of a collapse in
                        occupancy. The average occupancy fell by 34 p.p. to 40% due to a significant drop in demand for hotel services.

Business Nedvizhimost
RUB bln                                       3Q 2020               3Q 2019                YoY                9M 2020             9M 2019                   YoY             Portfolio of assets under
Rev enue                                                  2,1                 2,4             (9,6%)                     4,1                  4,8             (14,9%)       ownership, 2020
OIBDA                                                     0,6                 1,7            (62,9%)                     1,3                  3,4             (61,7%)
OIBDA margin                                          29,7%               72,3%          (42,6) п.п.                 32,0%                71,2%             (39,1) п.п.
Net profit                                                0,5                 1,2            (59,8%)                     0,7                  2,2             (66,5%)
                                                                                                                                                                           01.сен.20
                                                                                                                                                                             30.09 12%          88%
Net debt/(cash position)                                  2,0               (0,6)                 n/a                    2,0                (0,6)                  n/a

Revenue                  in 3Q 2020, revenue from rental assets decreased year-on-year due to the completion of the 2019 commercial real
                         estate sales programme.                                                                                          30.06 11%
                                                                                                                                       01.июн.20            89%
OIBDA and                OIBDA and OIBDA margin decreased year-on-year due to a change in revenue structure in favour of lower margin
net profit               rental revenue. Net profit dynamics were impacted by a decline in OIBDA.                                                 Country property
                                                                                                                                                                                      Commercial property
Key                      In August 2020, the Company successfully placed the debut bond issue for RUB 4 billion at a 7.9% coupon rate with
                         a 4-year put option. Funds from the placement are being used to refinance the current debt portfolio and repay
highlights               non-current assets liabilities to MGTS, and for investment projects. Expert RA rating agency assigned Business
                         Nedvizhimost a ruA- rating with a stable forecast.
                         In September 2020, Artemy Marinin was appointed CEO of Business Nedvizhimost. Mr Marinin has considerable
                         professional experience in real estate and construction.
1
    Based on management accounts
2
    Adjusted in 1Q 2020 as a result of a one-time write-off due to the COVID-19 pandemic affecting the financial performance of the international hotels.
3                                              4
    Revenue per available room per day           Average daily rate                                                                                                                                                36
You can also read