Creating value by fulfilling our purpose Advancing the World of Health - May 6, 2021 - Investors
←
→
Page content transcription
If your browser does not render page correctly, please read the page content below

Creating value by fulfilling our purpose
Advancing the World of Health™
May 6, 2021
Caution Concerning Forward-Looking Statements
    This presentation contains certain estimates and other forward-looking statements (as defined under Federal securities laws) regarding BD’s future prospects and performance, including, but not
    limited to, future revenues, earnings per share, leverage targets, capital deployment, total return targets, and the proposed spin-off of the diabetes business, including strategies of BD and the
    independent company following the proposed spin-off, the anticipated benefits of the spin-off, and the expected timing of completion of the spin-off. All such statements are based upon current
    expectations of BD and involve a number of business risks and uncertainties. Actual results could vary materially from anticipated results described, implied or projected in any forward-looking
    statement. With respect to forward-looking statements contained herein, a number of factors could cause actual results to vary materially. These factors include, but are not limited to, risks
    relating to the impact of the COVID-19 pandemic on our business (including decreases in the demand for our products, any disruptions to our operations and our supply chain and uncertainty
    regarding the level of demand and pricing for our COVID-19 diagnostics testing); product efficacy or safety concerns resulting in product recalls or actions being taken with respect to our
    products; new or changing laws and regulations impacting our business (including the imposition of tariffs or changes in laws impacting international trade) or changes in enforcement practices
    with respect to such laws; fluctuations in costs and availability of raw materials and in BD’s ability to maintain favorable supplier arrangements and relationships; legislative or regulatory changes
    to the U.S. or foreign healthcare systems, potential cuts in governmental healthcare spending (including China’s volume-based procurement tender process), or governmental or private measures
    to contain healthcare costs, including changes in pricing and reimbursement policies, each of which could result in reduced demand for our products or downward pricing pressure; changes in
    interest or foreign currency exchange rates; adverse changes in regional, national or foreign economic conditions, particularly in emerging markets, including any impact on our ability to access
    credit markets and finance our operations, the demand for our products and services, or our suppliers' ability to provide products needed for our operations; the adverse impact of cyber-attacks on
    our information systems or products; competitive factors including technological advances and new products introduced by competitors; interruptions in our supply chain, manufacturing or
    sterilization processes; pricing and market pressures; difficulties inherent in product development, delays in product introductions and uncertainty of market acceptance of new products; adverse
    changes in geopolitical conditions; increases in energy costs and their effect on, among other things, the cost of producing BD’s products; the remediation of our infusion pump business (including
    risks relating to regulatory clearance and market acceptance of the BD Alaris™ System); our ability to successfully integrate any businesses we acquire; uncertainties of litigation and/or
    investigations and/or subpoenas (as described in BD’s filings with the Securities and Exchange Commission); issuance of new or revised accounting standards; risks associated with the impact,
    timing or terms of the spin-off; risks associated with the expected benefits and costs of the spin-off, including the risk that the expected benefits of the spin-off will not be realized within the
    expected time frame, in full or at all, and the risk that conditions to the spin-off will not be satisfied and/or that the spin-off will not be completed within the expected time frame, on the expected
    terms or at all; the expected qualification of the spin-off as a tax-free transaction for U.S. federal income tax purposes, including whether or not an IRS ruling will be sought or obtained; the risk
    that any consents or approvals required in connection with the spin-off will not be received or obtained within the expected time frame, on the expected terms or at all; risks associated with
    expected financing transactions undertaken in connection with the spin-off and risks associated with indebtedness incurred in connection with the spin-off; the risk that dis-synergy costs, costs of
    restructuring transactions and other costs incurred in connection with the spin-off will exceed our estimates; and the impact of the spin-off on our businesses and the risk that the spin-off may be
    more difficult, time-consuming or costly than expected, including the impact on our resources, systems, procedures and controls, diversion of management’s attention and the impact on
    relationships with customers, suppliers, employees and other business counterparties, as well as other factors discussed in BD’s filings with the Securities and Exchange Commission. There can be
    no assurance that BD’s spin-off will in fact be completed in the manner described or at all. We do not intend to update any forward-looking statements to reflect events or circumstances after the
    date hereof except as required by applicable laws or regulations.

2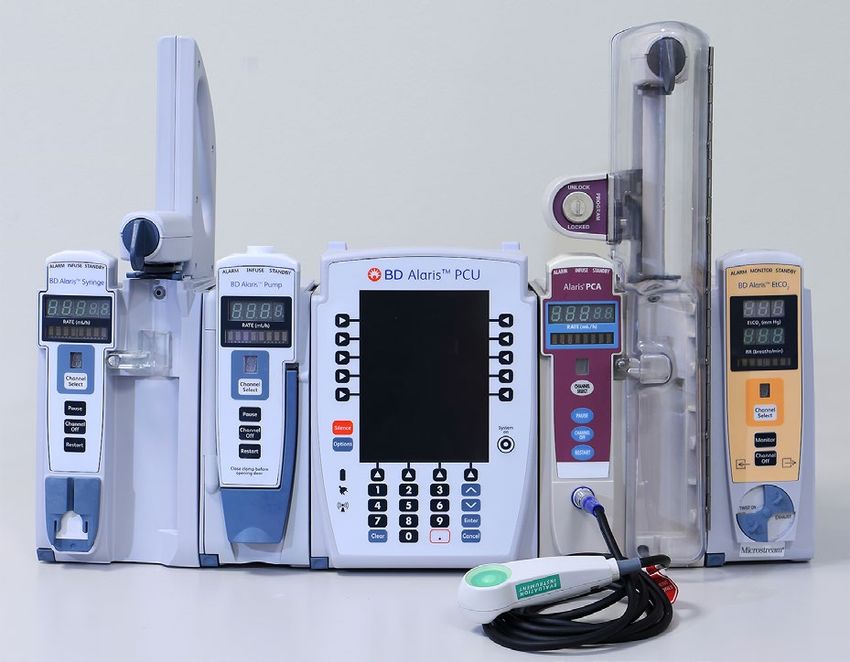
Caution Concerning Non-GAAP Financial Measures
    To supplement BD’s consolidated financial statements presented on a U.S. GAAP basis, the Company discloses certain non-GAAP financial measures. These non-
    GAAP financial measures are not in accordance with generally accepted accounting principles in the United States.
    BD management believes that the use of non-GAAP measures helps investors to gain a better understanding of our performance year-over-year, to analyze
    underlying trends in our businesses, to analyze our base operating results, and understand future prospects. It is also consistent with how management measures
    and forecasts the company's performance, especially when comparing such results to previous periods or forecasts. We believe presenting such adjusted metrics
    provides investors with greater transparency to the information used by BD management for its operational decision-making and for comparison for other
    companies within the medical technology industry.
    BD strongly encourages investors to review its consolidated financial statements and publicly filed reports in their entirety and cautions investors that the non-
    GAAP measures used by the Company may differ from similar measures used by other companies, even when similar terms are used to identify such measures.
    Non-GAAP measures should not be considered replacements for, and should be read together with, the most comparable GAAP financial measures.
    These materials include non-GAAP financial measures. Figures herein are on an “as adjusted non-GAAP” basis which exclude, among other things, the impact of
    purchase accounting adjustments (including the non-cash amortization of acquisition-related intangible assets); integration, restructuring and transaction costs.
    A reconciliation of non-GAAP to the most directly comparable GAAP measures can be found herein, or in our earnings releases and the financial schedules
    attached thereto.
    Note: The COVID impact represents BD’s estimate of the net financial impact of the global COVID-19 pandemic on the Company’s results. Revenue growth rates
    presented herein are not adjusted to reflect the impact of COVID-19.

3
Basis of Presentation
    All dollar amounts presented are US$ in millions, unless otherwise indicated, except per share figures.
    Certain financial information excludes the impact of foreign currency translation.
    “FXN” denotes currency neutral basis. We calculate foreign currency-neutral percentages by converting our current-period local currency financial results using the
    prior period foreign currency exchange rates and comparing these adjusted amounts to our current-period results.
    Growth denotes year-over-year percent change to the comparable period a year ago. Revenue year-over-year change comparisons are on a FXN basis
    unless otherwise noted.
    Total return = adjusted EPS growth plus dividend yield.
    NewCo refers to the diabetes business unit on a pro forma basis as an independent publicly traded company.
    RemainCo refers to BD on a pro forma basis post the separation of the diabetes business.
    Business Unit Acronyms: MDS refers to Medication Delivery Solutions; MMS refers to Medication Management Solutions; PS refers to Pharmaceutical Systems; DC
    refers to Diabetes Care; IDS refers to Integrated Diagnostics Solutions; BDB refers to Biosciences; PI refers to Peripheral Intervention; UCC refers to Urology &
    Critical Care; SURG refers to Surgery.

4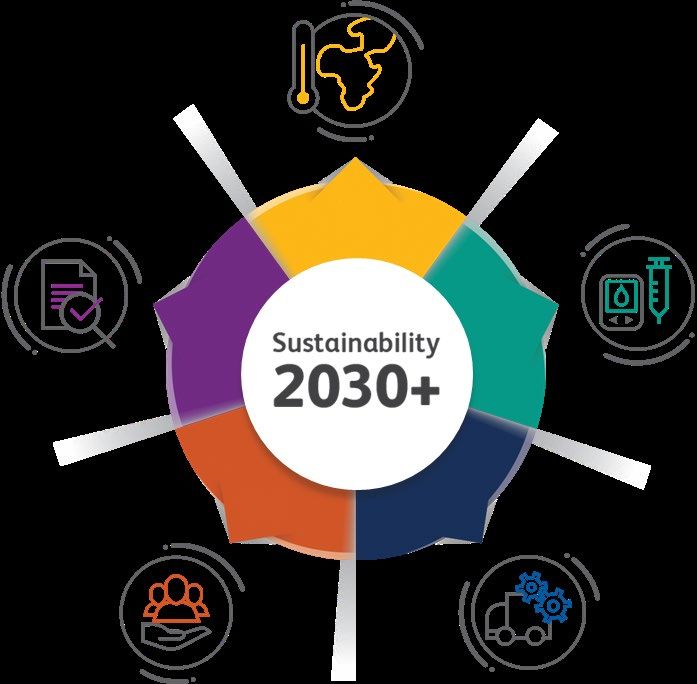
BD is an innovative medtech leader with the global reach and
    scale to address healthcare’s most pressing challenges
       Revenues by segment                                                                                                                        Revenues by region
                                                                                          70,000 +
                                                                                           BD associates

                    SURG
              UCC
               7%
                     6%          MDS                                                          190 +                                                        Europe
                                                                                                                                                                                     China
                                 21%                                                     countries served
         PI
         9%
                                                                                                                                                            20%
                                                                                                                                         57%                                         6%
                      $17.1
       BDB
       7%             billion           MMS                                                   40B +
                                        14%                                          devices made annually                          United States                       17%
              IDS                  PS                                                                                                                                Rest of World
              21%           DC
                            6%
                                   9%
                                                                                              $1B +
                                                                                      annual R&D spending

             #1 in nearly all                                                                                                                     43% International Revenue
         major served categories                                                          27,000 +                                                14% Emerging Markets
                                                                                          active patents

5   Note: BD financial information presented is for fiscal 2020. Market share information and rank based on internal estimates and publicly available information.
Tom Polen
Chairman, CEO, and President

BDX Key Investment Highlights
Achieving milestones and executing on value-creation as part of our BD 2025 strategy
• Core business momentum continues with solid Q2 performance; reaffirm FY21 guidance
• Advancing our product pipeline and tuck-in acquisition strategy to strengthen our growth profile
Announcing intention to spin off Diabetes business to shareholders to create value for stakeholders
• Simplification initiatives on track to enhance quality, customer experiences, and cost efficiencies
• Capital allocation strategy prioritizes growth vis-à-vis tuck-in M&A; includes return of capital
• Advancing the world of health™ and progressing with our 2030+ ESG goals
We see an exciting roadmap ahead in 2H FY21 and beyond
• Alaris 510(k) premarket notification filed; establishes path for remediation and commercial return
• Planning for Investor Day in Nov/Dec to showcase BD 2025 strategy and R&D pipeline
• Diabetes spin off expected to be completed in the first half of calendar 2022
Targeting sustainable, durable mid-single digit revenue and double-digit total return growth profile
Note: The intended spin-off of the diabetes business is subject to market, regulatory and other conditions, including final approval by the BD Board of Directors
and the effectiveness of a Form 10 registration statement that will be filed with the SEC.
7
Fiscal Q2 results reflects solid base performance and
    contribution from COVID response; reaffirm FY21 guidance
                                                                                                      Fiscal Q2 FY21 Revenue Drivers
     Fiscal Q2 FY21 Revenues and Year-over-Year Percent Change                                  (Commentary refers to FXN Y/Y basis unless specified)

                                                                                       FXN        •   Continued strong revenue growth in
                                                                                    Y/Y % ∆           pharmaceutical systems
                                   Q2 FY21             Reported        FXN         (ex-COVID      •   COVID-driven higher acuity
                                  $ in millions         Y/Y % ∆      Y/Y % ∆         testing)
                                                                                                  •   Higher OUS utilization, particularly China
       BD Medical                    $2,311             +7.4%         +4.7%                       •   Contributions from COVID-related vaccines
       BD Life Sciences              $1,586            +42.5%        +37.7%           (2.4%)
                                                                                                  •   Strong Bioscience growth
       BD Interventional             $1,011             +2.1%          0.0%                       •   Tough flu comparison (as expected) as
                                                                                                      minimal flu revenues in current quarter
       Total BD                     $4,907             +15.4%        +12.2%           1.7%
                                                                                                  •   COVID-19 testing revenues in current quarter,
     Note: FXN denotes FX-neutral year-over-year percent change. Ex-COVID testing excludes            but lower than expected volumes due to lower
     COVID-19 diagnostic revenues of $480 million, which included $290 million in BD Veritor™         market demand
     COVID-19 revenues and $190 million of BD Max™ COVID-19 testing and specimen collection
     and transport revenues in the Q2 FY21 period.                                                •   Continued strength in UCC driven by
                                                                                                      PureWick™ and Targeted Temperature
                                                       Reported         FXN                           Management
                                    Q2 FY21             Y/Y % ∆       Y/Y % ∆        Q2 FY20
                                                                                                  •   COVID-19 resurgence impacted procedure
       Adjusted EPS                   $3.19             +25.1%        +22.7%           $2.55          volumes early in quarter, but recovery
                                                                                                      followed

                                   We reaffirm our fiscal 2021 revenue and adjusted EPS guidance ranges
8   Please see Appendix for non-GAAP reconciliations
BD’s innovation, scale and strong execution has made us an
    essential partner in enabling the pandemic response globally
                           DIAGNOSE                                                           TREAT                    PREVENT

                      BD HealthSight™ with MedMined™ Data Analytics for real-time surveillance reporting and medication use reporting

                     BD Veritor™ rapid POC                                                                            Over 1.7 billion devices
                     COVID-19 antigen test                                            IV drug delivery in ICUs and
                                                                                                                      committed for
                     COVID-19 and Flu A+B                                             isolation extension sets
                                                                                                                      COVID-19 vaccinations
                     antigen test

                     BD Max™ molecular                                                                                Partnering with several
                     COVID-19 tests and                                                Medication management          biopharma companies
                     respiratory panel                                                 in field hospitals             for potential pre-filled
                     COVID-19 and Flu A+B                                                                             COVID-19 vaccines

                                                                                      IV catheters and PICCS for
                     Swabs and UVT kits
                                                                                      COVID-19 treatments

    Note: Not all products are available in all countries/regions. See Appendix for regulatory information.
9
We are making steady progress advancing our COVID-19
       diagnostic testing portfolio

                     The BD Max™ System                                      The BD Veritor™ System
                     Real time RT-PCR Test                               Rapid Point-of-Care Antigen Test

                                                                        •   SARS-CoV-2
            •   SARS-CoV-2                                              •   SARS-CoV-2 and Flu A+B
            •   SARS-CoV-2 and Flu A+B                  Updates
                                                                        •   Asymptomatic Screening for
                                                                            SARS-CoV-2 through Serial Testing
                                                                                                                         BD Veritor™
                                                                                                                         At-Home COVID-19
                                                                                                                What’s   rapid antigen testing
                                                                                                                Next?    (in development)

     Images are not to scale.

     Note: Not all products are available in all countries/regions. see Appendix for regulatory information.
     The BD Veritor™ At-Home antigen test is under development; it has not been FDA authorized or cleared.
10
Our innovation continues with a steady stream of new
products across our segments
BD Medical
BD Cathena™ IV Safety BD PhaSeal™ Optima BD Hylok™ BD HealthSight™
BD Securis™ BD Pyxis™ Inventory BD NeXus BD BodyGuard™
Catheter with BD Locking Injector for IV BD Pyxis™ ES 1.7 Infusion Diversion,
Stabilization Device Connect 1.0 (MedCaptain) DUO Barcode
Multiguard™ Technology N40-O MedSafety
BD Life Sciences
BD COR™
BD MAX™ BD Veritor™ BD Veritor™ BD Kiestra™ BD BD MAX™ BD
BD FACSDuet™ System with BD Veritor™
FLU + COVID-19 Connectivity FLU + COVID-19 ReadA FACSymphony™ CTGCTV2 FACSymphony™
(US) Onclarity™ (US) At-Home
Assay Module POC Antigen Test Compact A1 Assay A5.2 SE
and CTGCTV2
BD Interventional
Proxis™ Global Intermittent Sensica™ Automated Trek™ Bone Biopsy SureStep™ 1.1
PeritX™ Pristine™ Crosser™ IQ Glidepath™ LE
11/13 Self Cath - Economy Urine Output Device
Denotes product has received relevant regulatory
Note: Not all products are available in all countries/regions. clearance/approval and/or commercially launched
11 Products that appear on this page are in development unless otherwise notedWe achieved an important milestone in our commitment to our
customers and patients with our BD Alaris™ 510(k) submission
The 510(k) submission is intended to:
• Bring the regulatory clearance for the BD Alaris™ System
up-to-date
• Implement updated features and address open recall
issues, including through a new version of BD Alaris™
System software (v12.1.2)
The new BD Alaris™ System software v12.1.2 provides
The BD Alaris™ System clinical, operational and cybersecurity updates including:
The Power of One, Delivering Standardization • Clinical workflow improvements
• Advanced data encryption and network security
• PCU module • Interoperability Software
Submission
• BD Alaris™ Guardrails™ Suite
includes
• LVP module • Advanced analytics
• Syringe module • BD Guardrails™ Suite
• EtCO2 module + Drug Library
• PCA module
12 Note: these products have not received regulatory clearance.Our tuck-in M&A strategy further strengthens our expanding
pipeline of innovative solutions
Pristine dialysis
Rigorous Screening Criterion catheter
served market Innovative health care automation
Strengthens strategic position and growth rate mid- and cloud-based business
customer offering single digits intelligent solutions for non-acute
Creates shareholder value (ROIC Atherectomy and medication management; Served
hurdles, growth and margin accretion) thrombectomy; Infection market growth rate mid-teens
Served market growth prevention
rate double-digits product; Novel vascular
new market access product; new
# of tuck-ins opportunity
per year market opportunity
3 0 6 5
FY18 FY19 Sensica UO, A leader in RFID
automated urine
YTD FY21
FY20 pharmacy technology
output monitoring; solution for tracking and
New market storing prescriptions;
Point-of-care molecular
opportunity served market growth rate
diagnostics
(in development); double-digits
Served market growth
rate double-digits
13R&D investments and tuck-in acquisition strategy focuses on
our three key innovation themes and growth opportunities
Applying smart devices, Improved diagnosis and/or
robotics & analytics/artificial Enabling new care settings
treatment of chronic diseases
intelligence to care processes
Launched Q2 FY21; Controlled drug storage, Subcutaneous drug
automated urine output prescription filling, and delivery system for
monitoring leveraging retrieval system offering administration of biologics
our leading U.S. acute for retail, outpatient
Sensica™ care foley market share pharmacy settings
IntelliVault BD Libertas™*
Kiestra offers total lab Expanding access of our Extended genotyping
automation; SusceptA COVID-19 diagnostic supports risk stratification
offers automated testing to more patients and persistence
process for antimicrobial in the home setting monitoring to guide
susceptibility testing BD Onclarity™ patient management1-5
BD Kiestra™ BD Veritor™
SusceptA* At-Home* HPV Assay
Cloud based AI technology Vacuum-assisted female Long-term hemodialysis
connects BD medication external catheter for catheter with a unique
management products to urinary incontinence; design
address diversion of expansion into LTC and
BD HealthSight™ controlled substances PureWick™ Urine
homecare settings
Pristine™
Diversion Management Collection System
*These products are in development and have not received regulatory clearance. 1. Stoler MH et al. Gynecol Oncol. 2019;153(1):26–33; 2. Bonde J et al. Int J Cancer. 2019; doi:10.1002/ijc.32291; 3. Elfgren K et al. Am J Obstet Gynecol. 2017;216(3):264.e1–264.e7.;
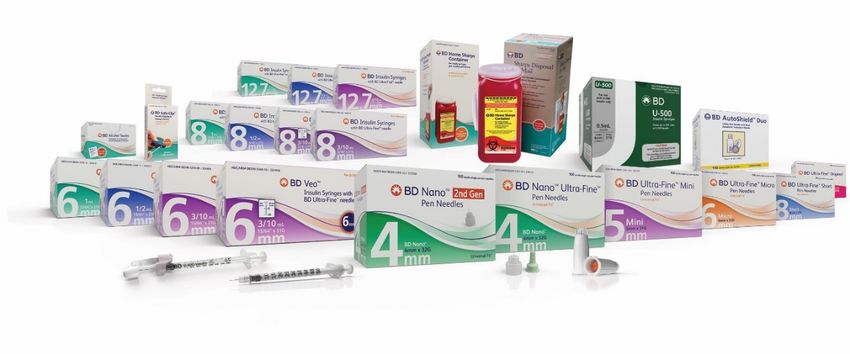
14 4. Radley D et al. Hum Vaccin Immunother. 2016;12(3):768–772.; 5. Bottari F et al. J Low Genit Tract Dis. 2019;23(1):39–42.We intend to spin off our diabetes business BD management
as part of our value-creation strategy expects the spin off to:
• Strengthen the growth
profile of BD and
NewCo.
Diabetes Care
• Enable BD and NewCo
MMS
to sharpen focus on
14% • FY20 revenues: ~ $1.1 billion
PS category innovation
9% and customer
MDS
DC
• Global market share leader in
21% insulin injection devices outcomes.
BD FY20 6%
Revenues • Serving an estimated 30 million
$17.1 billion • Allow BD and NewCo to
SURG patients worldwide have more efficient
6% IDS business processes,
UCC 21%
allocation of resources
7%
PI BDB and capital.
9% 7%
• Position BD and NewCo
for greater success and
value creation.
Notes: Market share and estimated number of patients are BD internal estimates. The intended spin-off of the diabetes business is subject
to market, regulatory and other conditions, including final approval by the BD Board of Directors and the effectiveness of a Form 10 registration
15 statement that will be filed with the SEC.We see several benefits for both entities; a spin off allows
NewCo to realize its full potential
RemainCo
NewCo
• Builds upon focused purpose of improving care for • Strengthens mid-single digit FX-neutral revenue
patients with diabetes growth and double-digit total return growth profile
• Leverages global, market-leading position in pen needles • Intensifies focus of human and financial capital on
strategic businesses
• Allocates capital and resources more effectively to
accelerate growth • Increases R&D efforts in strategic, higher-growth
categories to accelerate our weighted average
• Operationalizes strategic priorities more efficiently
market growth rate
• Tightens connection of management compensation to
• Advances RemainCo’s tuck-in M&A strategy
corporate goals
• Preserves a flexible balance sheet and investment
• Enhances ability to attract and retain talent
grade credit ratings
• Seeks acquisitions that enhance its growth profile
16Diabetes spin off transaction summary
• Spin-off expected to be implemented by means of a distribution of 100% of the shares of a new publicly traded
Transaction details entity to BD stockholders and is intended to be tax-free for U.S. federal income tax purposes
• BD expects to receive a cash distribution from NewCo upon transaction closing
• Enable BD and NewCo to sharpen focus on their respective category innovation and customer outcomes.
Strategic rationale • Allows NewCo to attract and retain talent, focus on its strategic growth goals and more efficiently allocate capital
• BD to focus on its priority businesses and continue to execute on its BD 2025 strategy
• Dev Kurdikar, current Worldwide President of BD Diabetes Care, to be CEO of NewCo
Leadership &
governance • Jake Elguicze, former Treasurer and VP of IR of Teleflex, has joined BD and to be CFO of NewCo
• Board of directors and other leaders will be named later
• Spin-off provides further confidence in mid-single digit revenue and double-digit total return growth profile
BD
• BD current dividend is not expected to be affected; BD remains committed to its investment grade credit ratings
Financial
details
• BD Diabetes revenue base in FY2020 was nearly $1.1 billion; cash flow positive
NewCo
• NewCo capital structure is expected to provide M&A flexibility for sustained organic and inorganic investment
• Transaction is expected to be completed in the first half of calendar year 2022, subject to market, regulatory, and
Timing and closing other conditions, including final approval by BD Board of Directors and the effectiveness of a Form 10 registration
conditions statement that will be filed with the SEC.
17NewCo will be led by an experienced management team
Dev Kurdikar
Chief Executive Officer of NewCo
• Joined BD February 2021 and currently serves as Worldwide President, BD Diabetes Care.
• Kurdikar served as CEO and president for Cardiac Science, a global manufacturer of automated external defibrillators
(AEDs) until the sale of the company to ZOLL Medical Corporation, an Asahi Kasei Group Company. Previously, he was the
general manager for the men’s health business at Boston Scientific and that business’s predecessor at American Medical
Systems (AMS). He also held positions of increasing responsibility and leadership with Baxter.
• Kurdikar earned an MBA from Washington University in St. Louis and a Ph.D. in Chemical Engineering from Purdue
University. He is currently a member of the Board of Directors of LMG Holdings.
Jake Elguicze
Chief Financial Officer of NewCo
• Elguicze has extensive experience in treasury, financial planning, reporting and analysis, and investor relations.
• He has joined BD from Teleflex, a global provider of medical technologies. Elguicze has served as Teleflex Treasurer and
VP of IR since 2011. He joined the organization in 2006 as Vice President of Financial Planning and Analysis. Prior to
Teleflex, Elguicze held various senior positions within Motorola and was an auditor at PriceWaterhouse Coopers, LLC.
• Elguicze earned a Bachelors of Accounting at University of Scranton and an M.B.A. from St. Joseph's University.
18Dev Kurdikar Worldwide President, Diabetes Care Incoming CEO, NewCo
NewCo is a leading insulin delivery company with significant
     manufacturing expertise, scale and global reach

                               Other
                           International                                 NewCo is a global market share leader
                               13%
                 Other
               Emerging                               United
                Markets                               States
                  9%                 FY20              52%
                                   revenues
                  China             $1,084
                   8%               million

                      Europe
                       18%

                                                                                Manufacturing 8 billion devices per year
             World-class
             manufacturing
             facilities

             Corporate offices located in New Jersey and Massachusetts

20   Source: BD internal data
Diabetes is a growing chronic condition that increases the risk of
health complications and burdens healthcare systems globally
Estimated Prevalence of diabetes in adults (20-79) in IDF Regions,
number of $760 by age adjusted comparative diabetes prevalence
adults with 700 billion
diabetes
(in millions) Worldwide
annual global
2045P health expenditure 8.3% 9.6%
on diabetes 2019 2045
578
Europe
6.3% 7.8%
10% 2019 2045
2030P North America & Caribbean
of global health care 11.1% 13.0% Western Pacific
463 2019 2045 Middle East & North Africa 11.4%
costs is spent on 12.8%
12.2% 13.9% 2019 2045
diabetes 2019 2045
285 2019 Central & South America Southeast Asia
4.2 8.5% 9.9% 11.3% 12.6%
2019 2045 2019
million Africa 2045
151 2009 deaths 4.7% 5.2%
2019 2045
2000 annually as a result of
diabetes and its
complications
Source: https://www.diabetesatlas.org/en/sections/demographic-and-geographic-outline.html
21As a separate entity, NewCo can use the spin as an operating
catalyst to effect change and chart its own course
Capitalize on the large, unmet medical needs Strong cash flows and financial flexibility to
of diabetes care and continuum of care support M&A
to accelerate revenue growth to expand product offering, enter
adjacencies or new product categories
Leverage global footprint and demographic
Increase R&D investments
trends
22Tom Polen Chairman, CEO, and President
We are building on our ESG leadership and advancing our 2030+
     sustainability strategy
               Climate change: Minimize our contribution to global emissions and utilize our capabilities to address unmet health needs for
               climate-vulnerable populations.

                     Commitment to reduce Scope 1 and 2 GHG emissions 46% by 2030 (from a 2019 baseline) and to be carbon neutral
                     across direct operations by 2040. This science-based target is aligned with 1.5⁰C global emissions reduction pathway.
                     BD completed a solar panel installation at our MMS San Diego facility which will reduce approximately 600 metric tons of
                     carbon dioxide, the equivalent of removing 120 cars from the road. This is BD’s nineth onsite solar installation.
               Product impacts: Reduce the environmental impact of our portfolio and address the sustainability needs of our customers.
               Supply chain resilience: Create a supply chain adaptable to disruption and able to contribute to strong environmental and social
               performance.

                     Investing $65 million to construct a state-of-the-art facility in Tucson, Arizona that will be a hub for the company's supply
                     chain, serving as a final-stage manufacturing and sterilization center.

               Healthy workforce: Maintain a healthy and thriving workforce that cultivates our culture of inclusion, safety and well-being.
                     Nearly 6,000 BD associates around the world participated in the 21 Day Social Justice Challenge. BD donated to racial
                     justice legal defense fund in memory of George Floyd and to other non-profit organization to support racial equity and
                     social justice.

               Transparency: Invite trust across stakeholder groups through transparent performance reporting on environmental, social and
               governance issues relevant to our business.

                                                                                                      What’s        Watch for our 2020 reports
                                                                                                      Next?         and more 2030+ targets
24
We are making significant progress advancing our
BD 2025 strategy with several milestones achieved
BD 2025: Our Value Creation Framework Identified priority high growth areas; increasing R&D,
established BD Innovation & Growth Fund
Completed several tuck-in M&A transactions focused on
higher-growth categories
Enhancing quality and compliance with BD Inspire
Quality; submitted BD Alaris™ System 510(k)
RECODE initiatives on track for $300M of savings by year-
end FY24
Embedding Growth Mindset into organization to shift
culture
Advancing our ESG goals; target carbon neutral across
direct operations by 2040
25Chris Reidy EVP, CFO & CAO
Fiscal Q2 results reflects solid base performance and
     contribution from COVID response; reaffirm FY21 guidance
                                                                                                       Fiscal Q2 FY21 Revenue Drivers
      Fiscal Q2 FY21 Revenues and Year-over-Year Percent Change                                  (Commentary refers to FXN Y/Y basis unless specified)

                                                                                        FXN        •   Continued strong revenue growth in
                                                                                     Y/Y % ∆           pharmaceutical systems
                                    Q2 FY21             Reported       FXN          (ex-COVID      •   COVID-driven higher acuity
                                   $ in millions         Y/Y % ∆     Y/Y % ∆          testing)
                                                                                                   •   Higher OUS utilization, particularly China
        BD Medical                    $2,311             +7.4%        +4.7%                        •   Contributions from COVID-related vaccines
        BD Life Sciences              $1,586            +42.5%       +37.7%            (2.4%)
                                                                                                   •   Strong Bioscience growth
        BD Interventional             $1,011             +2.1%         0.0%                        •   Tough flu comparison (as expected) as
                                                                                                       minimal flu revenues in current quarter
        Total BD                     $4,907             +15.4%       +12.2%            1.7%
                                                                                                   •   COVID-19 testing revenues in current quarter,
      Note: FXN denotes FX-neutral year-over-year percent change. Ex-COVID testing excludes            but lower than expected volumes due to lower
      COVID-19 diagnostic revenues of $480 million, which included $290 million in BD Veritor™         market demand
      COVID-19 revenues and $190 million of BD Max™ COVID-19 testing and specimen collection
      and transport revenues in the Q2 FY21 period.                                                •   Continued strength in UCC driven by
                                                                                                       PureWick™ and Targeted Temperature
                                                                                                       Management
                                                                                                   •   COVID-19 resurgence impacted procedure
                                                                                                       volumes early in quarter, but recovery
                                                                                                       followed

27   Please see Appendix for non-GAAP reconciliations
BD Medical: Continued strength in Pharmaceutical Systems
plus COVID-19 response and acuity benefits
Q2 FY21 FXN Y/Y BD Management Commentary
Business Unit Revenues % Change (Commentary refers to FXN Y/Y basis unless specified)
Medication Delivery $999M +8.1% • COVID-19 driving higher acuity of care.
Solutions (MDS) • Includes COVID-19 vaccination injection devices.
• Overall utilization still below pre-COVID levels.
• Anniversary of COVID-19 impact in China driving OUS growth.
Medication Management $566M (1.9%) • Dispensing: strong international growth partially offset by delayed
Solutions (MMS) installations in US.
• Infusion: includes contribution from medical necessity in US.
Diabetes Care $284M (0.2%) • Prior year quarter benefited from increased U.S. orders from retailers and
distributors in response to the COVID-19 pandemic.
• Q2 FY21 unfavorably impacted by accelerated timing of orders in Q1
FY21.
Pharmaceutical Systems $462M +9.8% • Strong growth of pre-fillable syringes benefitting from demand and
capacity expansion.
BD Medical $2,311M +4.7%
28
Please see Appendix for non-GAAP reconciliationsBD Life Sciences: global benefit from COVID-19 diagnostic
testing and research activity recovery in Biosciences
FXN Y/Y
% Change
Q2 FY21 FXN Y/Y (ex-COVID BD Management Commentary
Business Unit Revenues % Change testing) (Commentary refers to FXN Y/Y basis unless specified)
Integrated $1,261M +46.2% (7.5%) • Reported growth reflects total COVID-19 diagnostic revenues of
Diagnostic $480 million included in Q2 FY21 which consisted of:
Solutions (IDS) – BD Veritor™ Plus System: $290 million.
– BD Max,™ specimen collection and transport: $190 million
• Difficult flu comparison on a year-over-year basis was an impact
of 540bps as the flu was weaker in the current period.
• BD routine diagnostic testing not yet fully recovered to pre-
COVID-19 levels in the current period.
Biosciences $325M +12.3% +12.3% • Growth driven by strong demand for research instruments and
reagents due to continued recovery of research lab activity.
• Strong demand from Pharma/Biotech for vaccine research and
development.
BD Life Sciences $1,586M +37.7% (2.4%)
29
Please see Appendix for non-GAAP reconciliationsBD Interventional: UCC continues to deliver steady growth;
progressive recovery from COVID-19 resurgence
Q2 FY21 FXN Y/Y BD Management Commentary
Business Unit Revenues % Change (Commentary refers to FXN Y/Y basis unless specified)
Surgery $292M (7.7%) • Sales impacted by COVID-19 resurgence in US and Europe early in the
quarter, but recovery as quarter progressed.
Peripheral Intervention (PI) $420M +2.2% • Growth driven by the peripheral artery disease platform from the Straub
acquisition (atherectomy).
• Sales impacted by COVID-19 resurgence in US and Europe early in the
quarter, but recovery as quarter progressed.
Urology and Critical Care $298M +5.4% • Strong growth in Acute Urology driven by PureWick™.
(UCC) • Double-digit growth in Targeted Temperature Management as roll-out of
Arctic Sun™ Stat continues.
BD Interventional $1,011M 0.0%
30
Please see Appendix for non-GAAP reconciliationsUS growth dampened by COVID resurgence and absence of flu;
International strength driven by COVID response and China
Fiscal Q2 FY21 Revenue Drivers
(Commentary refers to FXN Y/Y basis unless specified)
Q2 FY21 Reported FXN United States
$ in millions Y/Y % ∆ Y/Y % ∆ Solid core revenue growth plus the addition of
COVID-19 response revenues helped to offset a
United States $2,462 +1.9% +1.9% difficult prior year comparison along with the
impact of COVID-19 resurgence early in the
quarter and the absence of a flu season.
International $2,446 +33.0% +25.7%
Developed markets $4,193 +13.8% +10.4% International
Contribution from COVID-19 response revenues,
and anniversary of COVID-19 impact in China.
Emerging markets $714 +25.7% +24.0%
China $338 +72.1% +62.0%
Total BD $4,907 +15.4% +12.2%
31
Please see Appendix for non-GAAP reconciliationsOur Q2 FY21 P&L shows strong revenue and adjusted EPS
growth while investing for the long-term prospects
BD Management’s Commentary
Q2 FY21 Q2 FY20 Reported FXN Our COVID-diagnostic profit reinvestments are
(Adjusted) $ in millions $ in millions Y/Y ∆ Y/Y ∆
reflected down our P&L.
Revenues $4,907 $4,253 15.4% 12.2%
• Gross margins: Favorable impacts of product
Gross Profit $2,642 $2,325 13.6% 11.8%
mix driven by COVID-19 testing offset by
Gross margin 53.8% 54.7% (90 bps) (20 bps)
continued re-investment of profits into our
SSG&A $1,147 $1,029 11.4% 9.0%
BD strategy. Unfavorable FX impact y/y was
% of revenues 23.4% 24.2% (80 bps) (70 bps)
70bps y/y.
R&D $295 $246 20.0% 18.7%
% of revenues 6.0% 5.8% 20 bps 30 bps • SSG&A: Higher shipping costs and deferred
Operating Income $1,201 $1,051 14.3% 13.0% compensation amount recognized in SSG&A
Operating margin 24.5% 24.7% (20 bps) 20 bps line (offset in other int/other).
Interest/Other, net $111 $170 (34.7%) (31.2%)
• R&D: Increased spending in COVID
Tax Rate 12.0% 16.0% (400 bps) (400 bps)
diagnostic and in other growth initiatives.
Net Income $959 $740 29.6% 27.4%
Preferred Dividend* $23 $38 (40.6%) (40.6%) • Int/other, net: Reduced interest expense
Net Income to Common* $936 $702 33.4% 31.0% due to debt repayment, refinancing activities,
Diluted Share Count* 294 275 6.7% 6.7% and lower interest rates. Lower deferred
Adjusted EPS* $3.19 $2.55 25.1% 22.7% compensation (offset in SG&A).
*In F2Q21 and F2Q20, the preferred shares are anti-dilutive. Therefore, the adjusted non-GAAP EPS is calculated
using net income to common (preferred dividends are included) while the diluted share count excludes the
conversion of the preferred shares in the calculation.
32 Please see Appendix for non-GAAP reconciliationsOur capital allocation strategy prioritizes growth, includes a
competitive dividend and potential share repurchases
FY 2018–2020 cash allocation BD expects capital deployment on one or more of:
Tuck-in M&A Internal Tuck-in M&A,
CapEx $0.4B investments to equity investments
$2.7B
Opportunities to drive growth
reallocate cash
Share going forward Competitive Share
Repurchases ~$10B
$0.0B Cumulative
dividend repurchases
Operating
Cash Flows
FY18-20
Dividends Debt
Paydown Focused on maintaining a strong, flexible balance sheet
$2.9B
$5.0B* • Net leverage 2.4x as of 3/31/2021
*Debt Paydown Notes: • Long-term net leverage target ~2.5x
Excludes the Bard transaction
Debt paydown notes: • Committed to full investment grade credit ratings
- $4.0b of debt paydown was achieved with operating cash flow
- $1.0b of debt paydown through proceeds from May 2020 equity offering
- Excludes $1.9b term loan drawn in Q2 and repaid in Q3 FY20
Note: capital deployment is subject to company and market conditions; net leverage targets are on an adjusted basis, see non-GAAP reconciliations
33We reaffirm our fiscal 2021 guidance ranges
Revenues Adjusted EPS
Reported revenue growth1 of 12%-14% Adjusted EPS of $12.75-$12.85
FX-neutral revenue growth1 of 10%-12% Reported EPS growth1 of 25%-26%
FX impact approx. +2.0% FX-neutral EPS growth1 of 24%-25%
Guidance incorporates the following assumptions:
• COVID-19: We continue to assume no major resurgences of • BD Veritor™: We assume revenues toward the higher end of the
COVID-19 that would lead to system-wide shutdowns of elective $1.0-$1.5 billion range; revenues weighted to first half of the
procedures. We assume that our acute-care oriented businesses fiscal year. We continue to reinvest some of the profits from BD
do not return to pre-COVID levels. Veritor™.
• BD Alaris™: We do not assume clearance of our 510(k) premarket
notification in fiscal 2021. We do not assume any significant
shipments of pumps under medical necessity going forward. We
expect a difficult comparison in Q3 FY21 due to high demand in
last year’s comparable quarter.
1 Revenue growth guidance is relative to FY20 revenues of $17,117 million and adjusted EPS growth guidance is relative to FY EPS of $10.20; see Appendix for non-GAAP reconciliations
34Question & Answer Session
Tom Polen
Chairman, CEO and President
Chris Reidy
EVP, CFO and CAO
Alberto Mas
EVP, President of BD Medical
Simon Campion
EVP, President of BD Interventional
Dave Hickey
EVP, President of BD Life Sciences
Kristen M. Stewart, CFA
SVP, Strategy and Investor Relations
35Appendix
BD Veritor™ Plus System
     The BD Veritor™ Plus System for Rapid Detection of SARS-CoV-2 is intended for the qualitative detection of SARS-CoV-2 nucleocapsid antigens in direct
     anterior nasal swabs from individuals who are either suspected of COVID-19 by their health care provider within the first five days of the onset of
     symptoms, or from individuals without symptoms or other epidemiological reasons to suspect COVID-19 when tested twice over two or three days with
     at least 24 hours and no more than 48 hours between tests.
     The BD Veritor™ System for Rapid Detection of SARS-CoV-2, and SARS-CoV-2 and Flu A+B Assay has not been FDA cleared or approved but has been
     authorized by FDA under an EUA for use by authorized laboratories.
     This product has been authorized only for the detection of proteins from SARS-CoV-2, influenza A and influenza B, not for any other viruses or
     pathogens; and the emergency use of this product is only authorized for the duration of the declaration that circumstances exist justifying the
     authorization of emergency use of in vitro diagnostics for detection and/or diagnosis of COVID-19 under Section 564(b)(1) of the Federal Food, Drug
     and Cosmetic Act, 21 U.S.C. § 360bbb-3(b)(1), unless the declaration is terminated or authorization is revoked sooner.
     For more information, please see bdveritor.com.

37
About the BD MAX™ System and BD® SARS-CoV-2 Reagent Kits
The BD MAX™ System is a molecular diagnostic platform already in use at thousands of laboratories worldwide. The system is fully automated,
reducing the opportunity for human error and increasing the speed to result, and can process 24 samples simultaneously, and up to several hundred
samples per 24-hour period. Each unit is capable of performing assays for respiratory infections, enterics, hospital acquired infections, and sexually
transmitted infections.
This product has not been FDA cleared or approved, but has been authorized for emergency use by FDA under an EUA for use by authorized
laboratories; this product has been authorized only for the detection of nucleic acid from SARS CoV-2, influenza A virus and influenza B virus and not
for any other viruses or pathogens; and the emergency use of this product is only authorized for the duration of the declaration that circumstances
exist justifying the authorization of emergency use of in vitro diagnostics for detection and/or diagnosis of COVID-19 under Section 564(b)(1) of the
Act, 21 U.S.C. § 360bbb-3(b)(1), unless the declaration is terminated or authorization is revoked sooner.
38Supplemental Non-GAAP Reconciliation
Quarterly Reconciliation of Adjusted Change and Adjusted Foreign Currency Neutral Change
(Unaudited; Amounts in millions, except per share data)
Interest
Acquisitions & Other Income Other Income
Gross Other (Income) Operating (Expense) Income, Tax Net Diluted
Revenues Profit SSG&A R&D Restructurings Expense Income Net Net Provision Income EPS
Three Months Ended Mar 31, 2021
Reported $ for Three Months Ended Mar 31, 2021 $4,907 $2,247 $1,148 $317 $52 $296 $434 ($122) ($8) $6 $299 $0.94
Reported % of Revenues 45.8% 23.4% 6.5% 8.9% 6.1%
Reported effective tax rate 1.9%
Specified items:
Purchase accounting adjustments pre-tax (1) - 348 (1) (0) - - 349 (1) - - 348 1.19
Integration costs pre-tax (2) - - - - (33) - 33 - - - 33 0.11
Restructuring costs pre-tax (2) - - - - (19) - 19 - - - 19 0.06
Transaction gain/loss, product and other litigation- - 37 - - - (296) 333 - - - 333 1.13
related matters pre-tax (3)
European regulatory initiatives-related costs pre-tax (4) - 11 - (22) - - 33 - - - 33 0.11
Impacts of debt extinguishment pre-tax - - - - - - - 4 15 - 20 0.07
Income tax benefit of special items and impact of tax - - - - - - - - - 125 (125) (0.43)
reform
Adjusted $ for Three Months Ended Mar 31, 2021 A $4,907 $2,642 $1,147 $295 $0 ($0) $1,201 ($119) $8 $131 $959 $3.19
Adjusted % of Adjusted Revenues 53.8% 23.4% 6.0% 24.5% 19.5%
Adjusted FXN % of Adjusted Revenues (A adjusted for E) 54.5% 23.5% 6.1% 24.9%
Adjusted effective tax rate 12.0%
1. Includes amortization and other adjustments related to the purchase accounting for acquisitions impacting identified intangible assets and valuation of fixed assets and debt.
2. Represents integration and restructuring costs associated with acquisitions, as well as restructuring costs associated with simplification and other cost saving initiatives.
3. The 2021 amount includes charges recorded to Other operating expense to record product liability reserves, including related legal defense costs, of $296 million. The amounts in 2021 and 2020 include charges of $37
million and $199 million, respectively, recorded to Cost of products sold related to the estimate of future product remediation costs."
4. Represents costs required to develop processes and systems to comply with regulations such as the European Union Medical Device Regulation ("EUMDR") and General Data Protection Regulation ("GDPR").
5. The prior-period amount primarily represents a charge recorded to write down the carrying value of certain intangible assets in the Biosciences unit.
39Supplemental Non-GAAP Reconciliation
Quarterly Reconciliation of Adjusted Change and Adjusted Foreign Currency Neutral Change
(Unaudited; Amounts in millions, except per share data)
Interest
Acquisitions & Other Income Other Income
Gross Other (Income) Operating (Expense) Income, Tax Net Diluted
Revenues Profit SSG&A R&D Restructurings Expense Income Net Net Provision Income EPS
Three Months Ended Mar 31, 2020
Reported $ for Three Months Ended Mar 31, 2020 $4,253 $1,734 $1,025 $264 $75 $0 $370 ($132) ($38) $17 $183 $0.53
Reported % of Revenues 40.8% 24.1% 6.2% 8.7% 4.3%
Reported effective tax rate 8.5%
Specified items:
Purchase accounting adjustments pre-tax (1) - 345 4 - - - 341 (1) - - 340 1.24
Integration costs pre-tax (2) - - - - (57) - 57 - - - 57 0.21
Restructuring costs pre-tax (2) - - - - (18) - 18 - - - 18 0.07
Transaction gain/loss, product and other litigation- - 199 - - - - 199 - - - 199 0.72
related matters pre-tax (3)
European regulatory initiative-related costs pre-tax (4) - 8 - (18) - - 27 - - - 27 0.10
Investment gains/losses and asset impairments pre-tax (5) - 39 - - - - 39 - 1 - 40 0.14
Income tax benefit of special items and impact of tax - - - - - - - - - 124 (124) (0.45)
reform
Adjusted $ for Three Months Ended Mar 31, 2020 B $4,253 $2,325 $1,029 $246 $0 ($0) $1,051 ($133) ($37) $141 $740 $2.55
Adjusted % of Revenues 54.7% 24.2% 5.8% 24.7% 17.4%
Adjusted effective tax rate 16.0%
1. Includes amortization and other adjustments related to the purchase accounting for acquisitions impacting identified intangible assets and valuation of fixed assets and debt.
2. Represents integration and restructuring costs associated with acquisitions, as well as restructuring costs associated with simplification and other cost saving initiatives.
3. The 2021 amount includes charges recorded to Other operating expense to record product liability reserves, including related legal defense costs, of $296 million. The amounts in 2021 and 2020 include charges of $37
million and $199 million, respectively, recorded to Cost of products sold related to the estimate of future product remediation costs."
4. Represents costs required to develop processes and systems to comply with regulations such as the European Union Medical Device Regulation ("EUMDR") and General Data Protection Regulation ("GDPR").
5. The prior-period amount primarily represents a charge recorded to write down the carrying value of certain intangible assets in the Biosciences unit.
40Supplemental Non-GAAP Reconciliation
Quarterly Reconciliation of Adjusted Change and Adjusted Foreign Currency Neutral Change
(Unaudited; Amounts in millions, except per share data)
Interest
Acquisitions & Other Income Other Income
Gross Other (Income) Operating (Expense) Income, Tax Net Diluted
Revenues Profit SSG&A R&D Restructurings Expense Income Net Net Provision Income EPS
Three Months Ended Mar 31, 2021 versus Mar 31,
2020
Adjusted $ change C=A-B $654 $317 ($118) ($49) $0 $0 $150 $15 $44 $10 $219 $0.64
Adjusted % change D=C/B 15.4% 13.6% (11.4%) (20.0%) - - 14.3% 11.0% 120.5% 7.2% 29.6% 25.1%
Foreign currency translation impact E $134 $42 ($25) ($3) $0 $0 $13 ($1) $7 ($2) $17 $0.06
Adjusted foreign currency neutral $ change F=C-E $520 $275 ($93) ($46) $0 $0 $137 $16 $37 $12 $202 $0.58
Adjusted foreign currency neutral % change G=F/B 12.2% 11.8% (9.0%) (18.7%) - - 13.0% 11.7% 102.0% 8.8% 27.4% 22.7%
Please note:
A refers to the adjusted figures for the three-month period ending March 31, 2021 from slide 39
B refers to the adjusted figures for the three-month period ending March 31, 2020 from slide 40
41Supplemental Non-GAAP Reconciliation
Year-to-Date Reconciliation of Adjusted Change and Adjusted Foreign Currency Neutral Change
(Unaudited; Amounts in millions, except per share data)
Interest
Acquisitions & Other Income Other Income
Gross Other (Income) Operating (Expense) Income, Tax Net Diluted
Revenues Profit SSG&A R&D Restructurings Expense Income Net Net Provision Income EPS
Six Months Ended Mar 31, 2021
Reported $ for Six Months Ended Mar 31, 2021 $10,223 $4,979 $2,298 $608 $102 $296 $1,676 ($238) $24 $160 $1,302 $4.28
Reported % of Revenues 48.7% 22.5% 5.9% 16.4% 12.7%
Reported effective tax rate 10.9%
Specified items:
Purchase accounting adjustments pre-tax (1) - 695 (4) (5) - - 704 (4) - - 700 2.39
Integration costs pre-tax (2) - - - - (66) - 66 - - - 66 0.22
Restructuring costs pre-tax (2) - - - - (36) - 36 - - - 36 0.12
Transaction gain/loss, product and other litigation- - 45 - - - (296) 341 - (12) - 328 1.12
related matters pre-tax (3)
European regulatory initiatives-related costs pre-tax (4) - 19 - (40) - - 59 - - - 59 0.20
Investment gains/losses and asset impairments pre-tax (5) - - - - - - - - - - - -
Impacts of debt extinguishment pre-tax - - - - - - - 5 26 - 30 0.10
Income tax benefit of special items and impact of tax - - - - - - - - - 204 (204) (0.69)
reform
Adjusted $ for Six Months Ended Mar 31, 2021 A $10,223 $5,738 $2,294 $563 $0 $0 $2,881 ($237) $38 $363 $2,319 $7.74
Adjusted % of Adjusted Revenues 56.1% 22.4% 5.5% 28.2% 22.7%
Adjusted FXN % of Adjusted Revenues (A adjusted for E) 56.8% 22.5% 5.6% 28.8%
Adjusted effective tax rate 13.5%
1. Includes amortization and other adjustments related to the purchase accounting for acquisitions impacting identified intangible assets and valuation of fixed assets and debt.
2. Represents integration and restructuring costs associated with acquisitions, as well as restructuring costs associated with simplification and other cost saving initiatives.
3. The 2021 amount includes charges recorded to Other operating expense to record product liability reserves, including related legal defense costs, of $296 million. The amounts in 2021 and 2020 include charges of $37
million and $258 million, respectively, recorded to Cost of products sold related to the estimate of future product remediation costs.
4. Represents costs required to develop processes and systems to comply with regulations such as the EUMDR and GDPR.
5. The prior-period amount primarily represents a charge recorded to write down the carrying value of certain intangible assets in the Biosciences unit.
42Supplemental Non-GAAP Reconciliation
Year-to-Date Reconciliation of Adjusted Change and Adjusted Foreign Currency Neutral Change
(Unaudited; Amounts in millions, except per share data)
te est
Acquisitions & Other Income Other Income
Gross Other (Income) Operating (Expense) Income, Tax Net Diluted
Revenues Profit SSG&A R&D Restructurings Expense Income Net Net Provision Income EPS
Six Months Ended Mar 31, 2020
Reported $ for Six Months Ended Mar 31, 2020 $8,479 $3,712 $2,146 $535 $161 $0 $871 ($266) ($11) $134 $461 $1.40
Reported % of Revenues 43.8% 25.3% 6.3% 10.3% 5.4%
Reported effective tax rate 22.5%
Specified items:
Purchase accounting adjustments pre-tax (1) - 690 3 (3) - - 690 (3) - - 688 2.50
Integration costs pre-tax (2) - - - - (119) - 119 - - - 119 0.43
Restructuring costs pre-tax (2) - - - - (41) - 41 - - - 41 0.15
Transaction gain/loss, product and other litigation- - 258 - - - - 258 - - - 258 0.94
related matters pre-tax (3)
European regulatory initiatives-related costs pre-tax (4) - 13 - (31) - - 44 - - - 44 0.16
Investment gains/losses and asset impairments pre-tax (5) - 39 - - - - 39 - 1 - 41 0.15
Income tax benefit of special items and impact of tax - - - - - - - - - 146 (146) (0.53)
reform
Adjusted $ for Six Months Ended Mar 31, 2020 B $8,479 $4,713 $2,149 $501 $0 $0 $2,064 ($269) ($9) $280 $1,506 $5.20
Adjusted % of Revenues 55.6% 25.3% 5.9% 24.3% 17.8%
Adjusted effective tax rate 15.7%
1. Includes amortization and other adjustments related to the purchase accounting for acquisitions impacting identified intangible assets and valuation of fixed assets and debt.
2. Represents integration and restructuring costs associated with acquisitions, as well as restructuring costs associated with simplification and other cost saving initiatives.
3. The 2021 amount includes charges recorded to Other operating expense to record product liability reserves, including related legal defense costs, of $296 million. The amounts in 2021 and 2020 include charges of $37
million and $258 million, respectively, recorded to Cost of products sold related to the estimate of future product remediation costs.
4. Represents costs required to develop processes and systems to comply with regulations such as the EUMDR and GDPR.
5. The prior-period amount primarily represents a charge recorded to write down the carrying value of certain intangible assets in the Biosciences unit.
43Supplemental Non-GAAP Reconciliation
Year-to-Date Reconciliation of Adjusted Change and Adjusted Foreign Currency Neutral Change
(Unaudited; Amounts in millions, except per share data)
te est
Acquisitions & Other Income Other Income
Gross Other (Income) Operating (Expense) Income, Tax Net Diluted
Revenues Profit SSG&A R&D Restructurings Expense Income Net Net Provision Income EPS
Six Months Ended Mar 31, 2021 versus Mar 31, 2020
Adjusted $ change C=A-B $1,744 $1,025 ($145) ($62) $0 ($0) $818 $32 $47 ($83) $813 $2.54
Adjusted % change D=C/B 20.6% 21.7% (6.8%) (12.4%) - - 39.6% 11.9% 513.9% (29.7%) 54.0% 48.8%
Foreign currency translation impact E $197 $40 ($37) ($5) $0 $0 ($3) ($2) $7 $0 $2 $0.01
Adjusted foreign currency neutral $ change F=C-E $1,547 $985 ($108) ($57) $0 ($0) $820 $34 $40 ($83) $811 $2.53
Adjusted foreign currency neutral % change G=F/B 18.2% 20.9% (5.0%) (11.4%) - - 39.7% 12.5% 439.7% (29.7%) 53.9% 48.7%
Please note:
A refers to the adjusted figures for the six-month period ending March 31, 2021 from slide 42
B refers to the adjusted figures for the six-month period ending March 31, 2020 from slide 43
44Supplemental Non-GAAP Reconciliation
Revenues by Business Segments and Units
Quarterly Reconciliation of Reported Change and Adjusted Foreign Currency Neutral Change
For the Three Months Ended March 31, 2021
(Unaudited; Amounts in millions)
A B C D=(A-B)/B E=(A-B-C)/B
Year-over-year % change
$ in millions 2021 2020 FX Impact Reported FX-Neutral
BD MEDICAL
Medication Delivery Solutions $999 $904 $21 10.4% 8.1%
Medication Management Solutions $566 $568 $9 -0.3% -1.9%
Diabetes Care $284 $278 $6 2.0% -0.2%
Pharmaceutical Systems $462 $400 $22 15.4% 9.8%
TOTAL $2,311 $2,151 $59 7.4% 4.7%
BD LIFE SCIENCES
Integrated Diagnostic Solutions $1,261 $833 $43 51.3% 46.2%
Biosciences $325 $280 $11 16.3% 12.3%
TOTAL $1,586 $1,113 $54 42.5% 37.7%
BD INTERVENTIONAL
Surgery $292 $312 $4 -6.5% -7.7%
Peripheral Intervention $420 $399 $13 5.3% 2.2%
Urology and Critical Care $298 $279 $5 7.0% 5.4%
TOTAL $1,011 $990 $21 2.1% 0.0%
TOTAL REVENUES $4,907 $4,253 $134 15.4% 12.2%
Note: FXN denotes FX-neutral.
45Supplemental Non-GAAP Reconciliation
Revenues by Business Segments and Units
Quarterly Reconciliation of Reported Change and Adjusted Foreign Currency Neutral Change
For the Three Months Ended March 31, 2021
(Unaudited; Amounts in millions)
A B C D=(A-B)/B E=(A-B-C)/B
Year-over-year % change
2021 2020 FX Impact Reported FX-Neutral
TOTAL REVENUES $4,907 $4,253 $134 15.4% 12.2%
Less:
COVID-19 Diagnostics $480 $12 $22 N/A N/A
Base Revenues ex-COVID Dx $4,428 $4,242 $112 4.4% 1.7%
impact of COVID-Diagnostics 11.0% 10.5%
BD LIFE SCIENCES $1,586 $1,113 $54 42.5% 37.7%
Less:
COVID-19 Diagnostics $480 $12 $22 N/A N/A
BDLS ex-COVID Dx $1,106 $1,102 $32 0.4% -2.4%
impact of COVID-Diagnostics 42.1% 40.1%
Integrated Diagnostic Solutions $1,261 $833 $43 51.3% 46.2%
Less:
COVID-19 Diagnostics $480 $12 $22 N/A N/A
IDS ex-COVID Dx $781 $822 $21 -4.9% -7.5%
impact of COVID-Diagnostics 56.3% 53.7%
Note: FXN denotes FX-neutral.
COVID-19 diagnostic revenues of $480 million, included $290 million in BD Veritor™ COVID-19
revenues and $190 million of BD Max™ COVID-19 testing and specimen collection and transport
revenues in the Q2 FY21 period.
46Supplemental Non-GAAP Reconciliation
Revenues by Geographic Regions
Quarterly Reconciliation of Reported Change and Adjusted Foreign Currency Neutral Change
For the Three Months Ended March 31, 2021
(Unaudited; Amounts in millions)
A B C D=(A-B)/B E=(A-B-C)/B
Year-over-year % change
$ in millions 2021 2020 FX Impact Reported FX-Neutral
United States $2,462 $2,415 $0 1.9% 1.9%
International $2,446 $1,839 $134 33.0% 25.7%
Developed Markets $4,193 $3,686 $124 13.8% 10.4%
Emerging Markets $714 $568 $10 25.7% 24.0%
China $338 $196 $20 72.1% 62.0%
TOTAL REVENUES $4,907 $4,253 $134 15.4% 12.2%
Note: FXN denotes FX-neutral.
47You can also read