AFTER THE PARTY: How Australia spent its mining boom windfall - David Hetherington Dominic Prior - Per Capita
←
→
Page content transcription
If your browser does not render page correctly, please read the page content below

AFTER THE PARTY:
How Australia spent its mining boom windfall

David Hetherington
Dominic Prior
After the Party:
        How Australia spent its mining boom windfall
        David Hetherington & Dominic Prior

        Executive Summary                                                                          3

        Introduction: What’s a lotto winner to do?                                                 4

        The WIndfall: A bolt from the blue                                                         6

        Party like it’s 1999: Spending the windfall                                               10

        Conclusion: Alternative futures                                                           16

        Bibliography                                                                              19

After the Party: How Australia spent its mining boom windfall   May 2012   Hetherington & Prior        1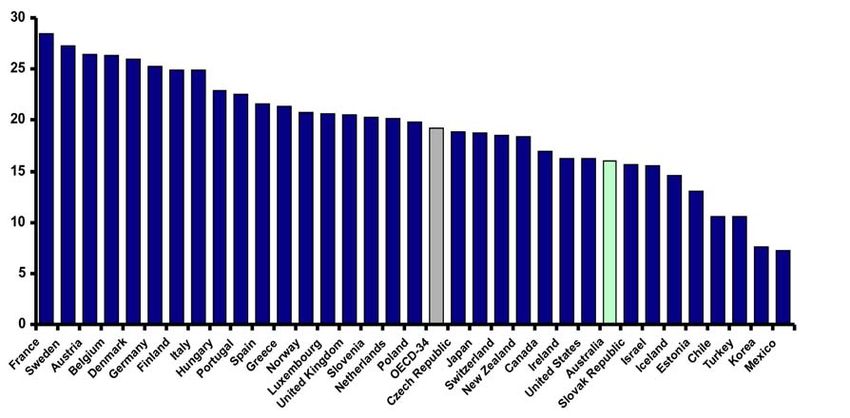
Acknowledgments
       The authors are grateful for valuable insights and feedback on drafts of this paper from Edwina Throsby, Josh
       Funder, Dennis Glover, and Anthony Kitchener. Special thanks are due to Maxine McKew who provided the spark of
       an idea and helped us think through the methodological approach. Most importantly, Per Capita acknowledges the
       generous support of the Becher Foundation and Trawalla Foundation without which this work would not have been
       possible.

       About the authors
       David Hetherington is the Executive Director of Per Capita. He has previously worked at the Institute for
       Public Policy Research, as a consultant to the OECD and for L.E.K. Consulting in Sydney, Munich and
       Auckland. He has authored or co-authored numerous reports on economic and social policy including Towards a
       Fair Go: Design Challenges for an NDIS (2011), The Per Capita Tax Survey (2010 & 2011), Employee
       Share Ownership and the Progressive Economic Agenda (2009), The Full-Cost Economics of Climate Change
       (2008), Unlocking the Value of a Job (2008), The InvestingSociety (2007), Disability 2020 (2007) and Would You
       Live Here? (2006). His articles have appeared in the Sydney Morning Herald, the Australian Financial Review, the
       Age and The Australian and he is a regular commentator on Radio National and ABC24. David holds a BA with First
       Class Honours from UNSW and an MPA with Distinction from the London School of Economics where he won the
       George W. Jones Prize for Academic Achievement.

       Dominic Prior is currently undertaking a research internship at Per Capita. Dominic graduated from St. Kevin’s
       College in 2010 and is currently a Dean’s Scholars commerce student at Deakin University in Melbourne. He is
       majoring in economics and finance, and intends to pursue a career in economic research.

       About Per Capita
       Per Capita is an independent progressive think tank which generates and promotes transformational ideas for
       Australia. Our research is rigorous, evidence-based and long-term in its outlook, considering the national
       challenges of the next decade rather than the next election cycle. We seek to ask fresh questions and offer fresh
       answers, drawing on new thinking in science, economics and public policy. Our audience is the interested public,
       not just experts and practitioners.

       Graphic design by Design Clarity

       Cover image by Zentilia at iStock

       © Per Capita Australia Limited, 2012

After the Party: How Australia spent its mining boom windfall      May 2012       Hetherington & Prior              2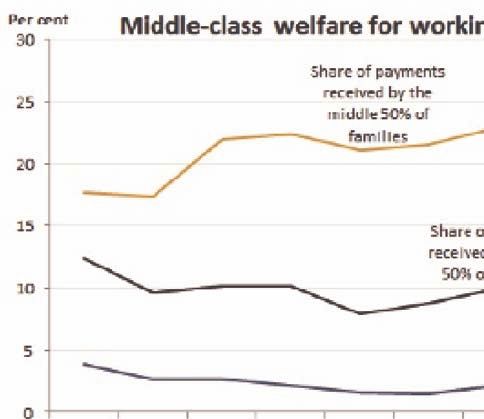
Executive Summary
       In the first decade of the century, Australia struck it lucky. A voracious global appetite for commodities meant that
       we could sell unimaginable quantities of our mineral resources at unimaginable prices. The result was a windfall
       to our public coffers of at least $180 billion over the six years from 2002 to 2008. To borrow a phrase from a
       prominent director of one of the big mining houses, it was “like being hit up the arse by a rainbow.”*

       To be clear, Australia had positioned itself cleverly to take advantage of such luck. Two decades of economic
       reform under Hawke, Keating and Howard had seen to that. But the material question is how we responded to
       such luck. How did we spend the windfall of our mining boom?

       In this paper, we examine the ten years of Commonwealth Budget papers to answer this question. We chart the
       rise of the boom and its explosive impact on our federal tax revenues up until 2008. We see how tax revenues
       fell away dramatically in the face of the Global Financial Crisis (GFC), despite our terms-of-trade continuing to
       rise for a further three years. Our estimate is that the pre-GFC phase of the boom delivered at least $180 billion
       over and above long-term GDP growth trend.

       What did we do with this bounty? Just over half of the windfall, $105 billion, was used by the Howard and Rudd
       Governments to shore up the fiscal position of the Commonwealth. We paid off $36 billion of sovereign debt and
       put $69 billion into long-term savings funds. This was the responsible course of action.

       But the remaining $75 billion represents a big missed opportunity. The Howard Government gave at least
       $25 billion away in tax cuts and concessions, on everything from fuel excise to voluntary superannuation
       contributions. It used another $50 billion on inflated spending programs and various cash handouts, from the
       baby bonus to the First Home Owners’ Grants.

       This profligacy had two damaging consequences. First, we missed the opportunity to invest $75 billion in long-
       term productive assets. We could have built a high-speed rail link down the east coast, or funded hundreds of
       thousands of skilled cadetships, or rolled out solar generation farms to power our mining and aluminium sectors.

       More importantly for the future, we have created a huge structural problem for our budget. The combination of
       tax cuts and spending growth left Australia ill-prepared for a change in economic circumstances. Most of the tax
       and spending changes were presented to voters as permanent benefits. No-one imagined that our tax take could
       fall by four percentage points of GDP in the three years from 2008 to 2011. Yet when this happened, a structural
       imbalance appeared in our Budget which will take years to redress.

       Voters had come to see the fruits of the boom years as entitlements, making it difficult for government to wind
       them back. The Gillard Government has begun this task – by means-testing family benefits, private health
       insurance rebates, and tightening superannuation tax treatment. But the process will take years and involve
       much political pain.

       Australia had a great boom – it’s a shame we don’t have more to show for it.

       *Quote on unexpected good luck from Sir Rod Eddington, former board member of Rio Tinto, City AM interview, Sept 2005

After the Party: How Australia spent its mining boom windfall          May 2012       Hetherington & Prior               3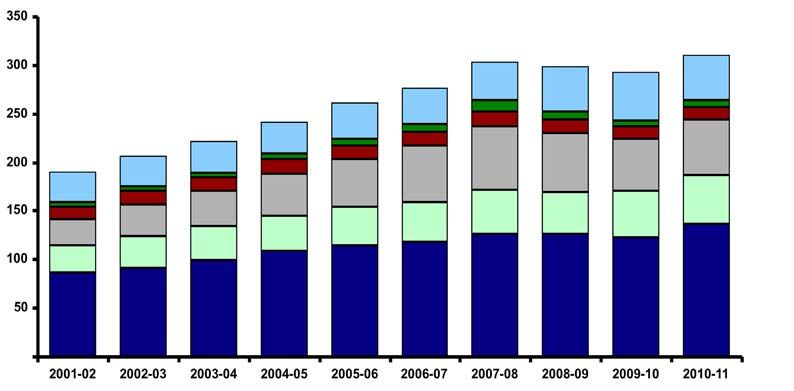
Introduction: What’s a lotto winner to do?
       What does a responsible parent advise a 20 year old child who wins big in the lottery? First, pay off your student
       debts. Then, invest the bulk of the winnings in shares, bonds, maybe property. Go backpacking for a year to see
       the world, or buy yourself a car.

       And sure, throw yourself a party. But no hard drugs and not too much booze. Don’t blow it all on the high life.

       This is uncontroversial advice: most of us would agree that luck has blessed our winner with the opportunity to
       build a future, and would counsel investing in educational qualification and financial security. Few of us would
       begrudge a bit of a good time into the bargain.

       This is akin to the situation in which Australia found itself in the early 2000s. For seven years from 2001,
       Australia enjoyed a public windfall which was the sovereign equivalent of winning the lottery. The choices
       Australia took over the use of this windfall make for a fascinating story.

       Admittedly the decision on how best to use these proceeds is less straightforward for a country than for an
       individual. Interest groups line up for their cut of the action, and the political process reconciles these priorities.
       Strong leadership should ensure that this reconciliation is driven by the national interest, rather narrow political
       ones. Ultimately though, similar principles apply to the country as to the 20 year-old. Pay off debt. Invest in
       productive assets. And don’t blow it all on a good time.

       For any country, the priority should be to advance prosperity and fairness in tandem – to build a stronger
       economy and stronger society. For the economy, this means investing in the hard and soft infrastructure that lifts
       productivity. For public finances, this means improving the underlying fundamentals – paying off debt, designing
       a sustainable budget balance, and building a fiscal surplus to be deployed in any future downturn. For society at
       large, this means ensuring the benefits of the boom are fairly distributed.

       So how did Australia manage its windfall? Broadly speaking, we did four things: paid off debt, cut taxes,
       increased spending and started long-term savings. Were these the right things? Was this the right mix? What
       should Australia have done differently?

       These questions are the subject of this paper. We explore the unexpected surge in federal tax receipts from
       2001 onwards, asking where the money came from, when did it arrive and critically, how much bigger were the
       inflows relative to historical experience. How much extra money did the Federal Government receive thanks
       to the terms-of-trade boom? We examine the structural changes that caused tax receipts to suddenly dry up in
       2008-09, and the likely outlook for the revenue side of the Budget in light of these changes.

       We then consider where the money went. What steps were taken to improve the structural budget balance?
       What share was needed to pay down the debt? Of the rest, how much was spent on productive investment?
       How much was saved, and how much wasted?

After the Party: How Australia spent its mining boom windfall         May 2012       Hetherington & Prior               4
Our approach has been to analyse the line-by-line detail of ten years of Commonwealth Budget papers from
       2001-02 to 2010-11. We have identified the various sources of the tax revenue increases from 2001, and the
       sources of revenue erosion from 2008-09 onwards. We have categorized spending measures into recurrent and
       stimulus spending, in order to assess these measures’ effect on the underlying budget position. We track the
       evolution of middle-class welfare over the period, and consider how the tax-and-transfer system has been used
       to change the distribution of income across the economy.

       The results are enlightening. Australia was presented with an enormous gift in the first decade of the century
       and, while a number of responsible policies were embraced, big opportunities were passed up. A reasonable
       share of this gift was used to invest for the long-term, but the country spent much of its windfall as it arrived,
       missing the chance to make bigger investments in boosting productivity, and in turn advancing prosperity and
       fairness.

       We behaved much like the 20 year old who blew too much his winnings on a big party, and left himself with some
       expensive habits. The speed with which we acknowledge this situation, and the design of our response, will go a
       long way to setting the direction of Australia for decades to come.

After the Party: How Australia spent its mining boom windfall        May 2012        Hetherington & Prior             5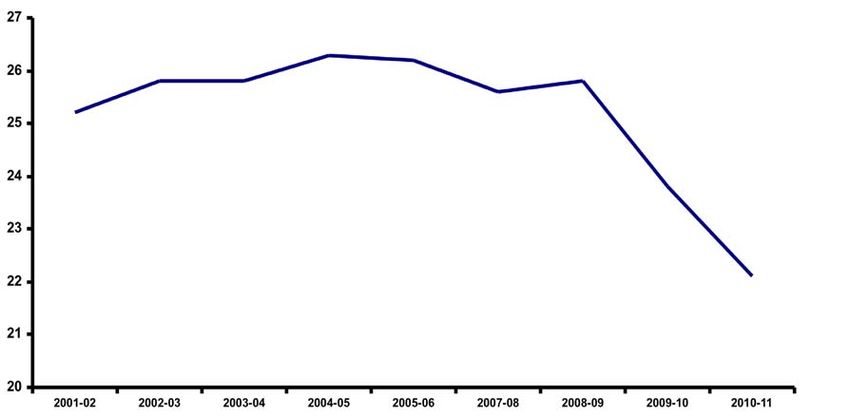
The Windfall: A bolt from the blue
       At the turn of the millennium, Australia’s economy was in impressive shape. We had enjoyed eight years of
       consecutive GDP growth, and productivity growth had been strong throughout the 1990s. We had sailed through
       the Asian financial crisis of the late 1990s intact, and were about to withstand the bursting of the dot-com bubble
       in the same fashion.

       None of this was down to good luck. Instead it was the product of long, often painful, years of reform during the
       Hawke, Keating and Howard governments.

       The story is well known - the reforms began with the float of the dollar in December 1983 and concluded with
       the introduction of the GST in July 2000. The suite of reforms spanned the removal of trade barriers, financial
       deregulation, enterprise bargaining, competition policy, central bank independence and redesign of the tax
       system. Its architects remain rightly proud of their work.

       But then we stopped. For 10 years following the introduction of the GST, Australia undertook not one major
       national economic reform. Why? Several factors contributed to this lack of action. One was a dearth of new
       ideas, emphasized by the sense that most of the pressing economic reforms had been completed. Another was
       simply reform fatigue – the country was tired of the constant effort of change and wanted nothing more than to sit
       back and enjoy the fruits of long years of hard work.

       A third factor is less obvious, but arguably more significant. In 2001, a seismic shift began, imperceptibly at first,
       that was to reshape the country dramatically over the ensuing decade. We didn’t see it at the time, but we were
       about to win big in the global trade stakes – to the tune of hundreds of billions of dollars.

       The effect of this torrent of money was to make reform seem less urgent. Who needs to take tough economic
       decisions when money is flowing in at an unprecedented rate? This unexpected windfall was the main reason
       Australian economic reform stopped dead in its tracks in 2001.

       What was the precise nature of the windfall? In 2001-02, a ton of exported thermal coal sold for around US$27.
       A ton of iron ore went for US$13. By 2008-09, these prices had reached US$131 and US$106, increases of five-
       fold and eight-fold respectively.

       In 2001-02, we exported 90 million tons (mt) of thermal coal and 165 mt of iron ore. By 2008-09, these figures
       were 115 mt and 363 mt. Eight years into the decade, growth in exports of these two commodities alone were
       delivering an extra $49 billion in national income to Australia each year.

       They were not alone. The gold price increased by 600% from 2001 to 2011, while the value of our liquid natural
       gas exports almost doubled over the same period to $11.1 billion. The wider story of Australia’s mining boom
       is well understood (see Cleary, 2011), but these specific details are worth repeating because they are simply
       staggering. By 2011, our terms of trade had hit their highest level in 140 years.

After the Party: How Australia spent its mining boom windfall        May 2012       Hetherington & Prior            6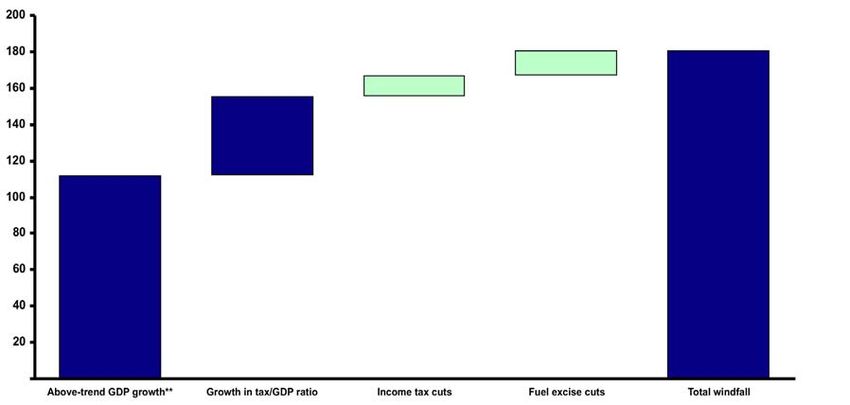
Over the first half of the decade, this translated into an enormous revenue windfall for the Commonwealth
       Treasury. At the start of the boom in 2001-02, Treasury revenues were $190 billion. By the time the revenue
       windfall peaked in 2007-08, annual revenues had hit $303 billion, increasing at a nominal growth rate of 8.2%
       p.a. during a period when nominal GDP grew by 7.7%.

       In dollar terms, this biggest single source of the windfall was the personal income tax take which grew by
       $40b, or 6.5% p.a., over the six year period. More staggering was the surge in company tax payments, which
       more than doubled from $27b in 2001-02 to $65b in 2007-08, an annual growth rate of 15.6%. Also delivering
       impressive growth rates, albeit off smaller bases, were superannuation tax at 19.2% p.a. and GST at 8.3% p.a.

                                                          Commonwealth Nominal Tax Revenues                              CAGR% CAGR%
                                                                (2001-02 to 2010-11)                                     (02-08) (08-11)

                                                                                                                 Total        8.2    0.7

                                                                                                                 Other        4.4    4.9

                                                                                                                 Super tax    19.2 (17.7)
                                                                                                                 Petroleum
          Billions                                                                                                            2.8    (4.0)
                                                                                                                 excise
         of dollars
                                                                                                                 Company tax 15.6    (4.0)

                                                                                                                 GST &
                                                                                                                              8.3     2.7
                                                                                                                 sales tax

                                                                                                                 Income tax    6.5   2.7

             Source: Commonwealth Treasury, Per Capita analysis

       The ratio of tax-to-GDP, often used as a proxy for size of government, grew from 25.2% to 25.8% after peaking
       in 2004-05 at 26.3%, busting the myth that John Howard and Peter Costello embraced a ‘small-government’
       philosophy. In December 2009, Howard wrote to the Australian newspaper rejecting Per Capita’s claim that his
       was the biggest taxing government relative to GDP in Australia’s history (Hetherington, 2009). In making this
       claim, Howard appears to have chosen to exclude the GST in his calculation of the tax-to-GDP ratio (Howard,
       2009).

       The tax-to-GDP ratio offers one perspective on the size of this windfall to Australia. Over the six year period from
       2001-02, the Commonwealth received $43.8 billion more income than it would have got had the tax-to-GDP ratio
       remained constant. This is on top of the $112 billion that was delivered by the above-trend rate in GDP growth
       alone.

After the Party: How Australia spent its mining boom windfall                May 2012     Hetherington & Prior                  7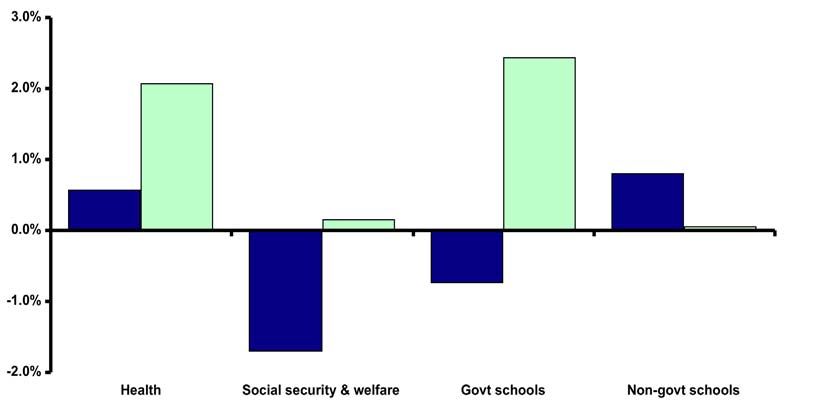
Commonwealth Tax-to-GDP Ratio
                                                                (FY02-FY11)

         Percent
         of GDP

                    Source: Commonwealth Treasury, Per Capita analysis

       This still understates the size of the windfall. This is because the Commonwealth Government offered seven
       consecutive years of personal income tax cuts from 2003-04 under both John Howard and Kevin Rudd. During
       this time, the marginal rate of a taxpayer on $35,000 fell from 30% to 15%. For a $60,000 taxpayer, it fell from
       42% to 30%, and for a $150,000 taxpayer it fell from 47% to 40%.

                                      Changes to Marginal Income Tax Rates at Selected Income Levels
                                                              (FY02 vs FY10)
                                                                                                                2001-02
                                                                                                                2009-10

         Percent

          Source: Australian Tax Office

After the Party: How Australia spent its mining boom windfall            May 2012    Hetherington & Prior         8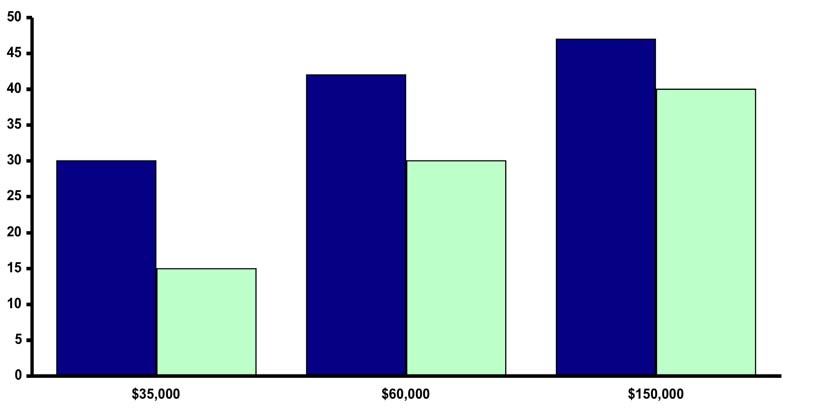
As these were permanent rather than one-off tax cuts, this represented an enormous fiscal transfer from
       Treasury to taxpayer, and a deep structural shift in the underlying budget position. The damaging legacy of this
       structural shift only became apparent when tax revenues plummeted in 2008-09.

       Given publicly available data, it’s hard to estimate the exact revenue foregone by the Commonwealth through
       these tax cuts. Let’s assume that, absent the tax cuts, income tax revenue had grown in line with GDP. This
       would have generated $11.2 billion in extra revenue between FY02 and FY08.

       In a similar vein to the tax cuts, the Howard government removed indexation of fuel excise in 2001. If we
       assume revenue from fuel excise had grown in line with GDP, this would have added an extra $13.9 billion to the
       budget over the six-year period from 2001-02.

       In total, this puts the size of the windfall enjoyed in the halcyon days of our boom at $180 billion. Between 2001-
       02 and 2007-08, Commonwealth revenues increased by $112 billion as a result of above-trend GDP growth,
       with a further $44 billion increase due to unprecedented growth in company tax, income tax and super tax which
       boosted the tax-to-GDP ratio. On top of this, the Federal Government returned an estimated $11 billion to
       taxpayers in personal income tax cuts and $14 billion from the freezing of the fuel excise.

                                                     Estimated Composition of Australia’s Revenue Windfall*
                                                                    (2001-02 to 2007-08)

                                          Revenue received                                       Revenue foregone

                                                                                                                $14b                 $180b
                                                                                          $11b
                                                              $44b

                                $112b
         Billions
            of
         dollars

          Notes: *All dollars are nominal
                 **Impact on tax receipts of nominal GDP growth above 5% p.a. with constant tax/GDP ratio
          Source: Commonwealth Treasury, Per Capita analysis

After the Party: How Australia spent its mining boom windfall                                May 2012         Hetherington & Prior           9
It’s worth noting that even these numbers understate the size of the windfall - $180 billion is a minimum
estimate. Our analysis does not capture the scale of the tax concessions offered by changes made to
superannuation tax arrangements in 2006. Under these changes, the Howard Government made super
payouts tax-free for those aged 60 and over, eased the assets test on the aged pension and offered a
reduced tax rate of 15% for voluntary super contributions. While we have not attempted to estimate
the size of these concessions since 2006, it is likely that they number in the tens of billions (see Ingles,
2009).
With the arrival of the GFC, the Commonwealth’s tax take hit a brick wall. Tax revenues fell from $303
billion to $299 billion in 2008-09 and further to $293 billion in 2009-10, before recovering to $310 billion in
2010-11. Hardest hit was company tax which fell by more than a fifth, from $65 billion in 2007-08 to $53
billion in 2009-10 as companies wrote down asset values and brought forward depreciation charges on
new investment.
The overall effect of the contraction was to shrink government revenues by four percentage points from
their peak, from 26.3% of GDP in 2004-05 to 22.1% in 2009-10, an enormous if unplanned reduction
in size of government.Clearly this unexpected contraction was compounded by the annual income tax
cuts delivered between 2003-4 and 2010-11. The upshot is that the net fiscal position is now structurally
weaker than it was before the GFC, with net government debt standing at $191 billion in June 2011 and a
surplus only forecast to be restored in the 2012-13 Budget.
The story of the blowout in the budget balance and the subsequent rebuilding of the Commonwealth
ledger is best understood by looking at federal government spending during the windfall decade. What
did we do with our $180 billion?
After the Party: How Australia spent its mining boom windfall May 2012 Hetherington & Prior 10Party like it’s 1999: Spending the windfall
As the windfall arrived, it was channeled in four directions. One slice was given to voters in the shape of tax cuts
and tax concessions. Another tranche was used to pay off Commonwealth debt. A third was used to establish
a series of Future Funds, the largest to cover the future liabilities of public service pensions. The final slice was
parceled out to taxpayers in a series of new welfare programs and one-off cash handouts. We’ve discussed the
tax cuts and concessions above, so let’s now explore how the remainder of the windfall was paid out.
Paying down the debt
The first thing a responsible windfall recipient does is pay off their debt. This frees them to invest in new
productive ventures, and to refinance any future debt at lower rates. The Howard Government took exactly this
approach and deserves acknowledgement for doing so. The budget had returned to surplus of $3.9 billion in
1998-99 as the productivity reforms of the previous decade took hold, and the government made aggressive
spending cuts, particularly in tertiary education (see Megalogenis, 2012A: 277-8). However the big surpluses
really began at the start of the decade with a $23.3 billion surplus in 2001-02.
These surpluses enabled the Howard Government to pay off net Commonwealth debt in full by 2005-06, from
a starting point of $35.9 billion in 2001-02. What’s more, it then proceeded to accumulate net savings of $46.8
billion by 2007-08. This was exactly the right approach to take with the first slice of the windfall.
Building the Future Funds
The Howard Government conceived the inaugural Future Fund in 2006 to act as a long-term savings vehicle
for the Commonwealth. The Fund was established with the specific mandate to provide for the future
superannuation liabilities of the Commonwealth which at that point were unfunded.
The Fund was seeded with $47 billion from Budget surpluses - $18 billion in 2005-06, $22 billion in 2006-07 and
$7 billion in 2007-08. To this was added $13 billion from the sale of the Commonwealth’s remaining holding in
Telstra.
Alongside the Future Fund, the Howard Government established two additional special-purpose funds: the
Communications Fund and the Higher Education Endowment Fund. These were subsequently restructured by
Labor in 2009 into the Building Australia Fund and the Education Investment Fund respectively. Finally in 2009,
the Rudd Government established a new Health and Hospitals Fund.
Each of these later Funds was conceived as a long-term special purpose investment fund. Between them, they
received from the Howard and Rudd Governments a total of $21.5 billion, mostly paid from the 2007-08 Budget
surplus.
There has been heated debate amongst commentators over whether Australia should have a sovereign wealth
fund (SWF), and if so, whether these special-purpose vehicles are in fact SWFs. The arguments centre on the
specific design of the fund – whether it enables currency stabilization and hedging, whether
After the Party: How Australia spent its mining boom windfall May 2012 Hetherington & Prior 11it is ‘locked’ for future generations. The Future Funds qualify on some of these metrics and not others. For the
purposes of this paper however, the important thing is that these monies were saved rather than spent, and both
the Howard and Rudd Governments deserve credit in this regard.
Spending the spoils
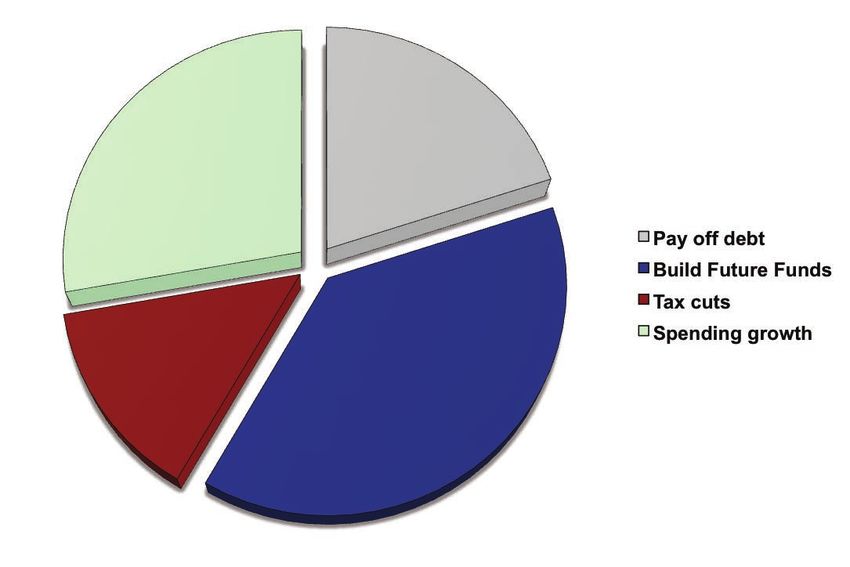
We’ve seen that the boom delivered at least $180 billion in windfall to the Commonwealth. Over $25 billion was
given back in tax cuts, $36 billion worth of public debt was paid off, and $69 billion was invested in the Future
Funds. That leaves $50 billion unaccounted for.
These remaining funds were spent on new, bigger programs and handouts. The scale of this inflated spending is
seen in the rise in Commonwealth expenditure relative to GDP. While the economy was growing strongly in the
early years of the decade, the total spending-to-GDP ratio grew by 1.7 percentage points - from 22.1% in 2001-
02 to 23.8% in 2007-08.
After the GFC hit, this ratio hit 25.4% as the Rudd Government embraced fiscal stimulus. Since then, spending
has been wound back as the Gillard Government attempts to return the budget to surplus and repay debt.
What was the money spent on? It makes sense to divide the spending into two blocks – pre-GFC (2001-02 to
2007-08) when increased spending was funded by our commodities windfall, and post-GFC (2007-08 to 2010-11)
when increased spending was funded by debt to offer fiscal stimulus.
The biggest source of expenditure growth in the pre-GFC period was health spending which outpaced GDP
growth by 0.6% p.a. Within health, the biggest driver was medical services and benefits which exceeded GDP by
1.8% p.a. Spending growth on hospitals and state health care agreements, on the other hand, fell behind GDP
growth by 1.3% p.a. In total, this equates to $1.4 billion extra spending on medical services with a $0.7 billion
reduction on hospitals and state agreements.
Another big-ticket growth item in this period was higher education spending which exceeded GDP by 1.8%,
although this largely offset cuts made in the early years of the Howard Government. Finally, payments to non-
government schools grew by 0.8% p.a. faster than GDP, in contrast with those to government schools which
lagged GDP growth by 0.7% p.a. This translates into $0.6b more for higher education, $0.2 billion more for non-
government schools and $0.2 billion less for government schools.
Other notable growth areas were rural assistance in the face of drought which outpaced GDP growth by 35.3%
p.a. off a small base, equating to an extra $0.9 billion, and fuel and energy spending which beat GDP growth by
9.8% p.a., costing an extra $0.5 billion.
In aggregate, spending on social welfare as a share of GDP fell through this period, as a stronger labour market
took people off the welfare rolls. This fall equated to a savings of $8.6 billion. However, as Megalogenis has
noted, total payments to families exceeded total payments to the unemployed, disabled and veterans for the first
time in 2003-04, a sign of the Howard government’s shifting priorities (2012B). A comparison of the Howard and
Rudd spending priorities is illustrated in the chart below.
After the Party: How Australia spent its mining boom windfall May 2012 Hetherington & Prior 12Average Annual Growth Rate above/below GDP Growth
by Selected Commonwealth Spending Area
(2001-02 to 2007-08 vs 2007-08 to 2010-11)
2001-02 to 2007-08
2007-08 to 2010-11
Percentage
points
Source: Commonwealth Treasury, Per Capita analysis
One of the fiercest debates over the Howard Government’s economic performance centres on whether it wasted
the windfall on ‘middle-class welfare’. The political battlelines of this debate are not straightforward. The
conservative Centre for Independent Studies attacked Howard’s middle-class welfare spending (Saunders,
2007), while some progressive economists observe that Australia’s levels of middle-class welfare are relatively
low by OECD standards (see Cowgill, 2012).
To unpick these competing arguments, we first need to define what we mean by middle-class welfare.
International welfare comparisons usually refer to cash benefits, which include pensions, payments for
healthcare, disability and unemployment, and family and community handouts. Overall, Australia spent 16% of
GDP on such payments in 2007, compared with an OECD average of 19%.
Public Social Expenditure by OECD Country
(2007)
Percent
of GDP
Source: OECD
After the Party: How Australia spent its mining boom windfall May 2012 Hetherington & Prior 13While Australia has a relatively low level of cash welfare, the share of welfare flowing to the middle 50% of fami-
lies did in fact increase during the Howard years from 21% in 1996-97 to 28% in 2007-08 according to research
by Whiteford, Redmond and Adamson. This continued an upward trend from a figure of 17% in 1990 (see chart
below).
So the facts tell us that middle-class welfare did rise during the Howard years, albeit from a low base and in a way
which left Australia with only a modest level of cash-based welfare spending by the end of the Howard era.
One source of this expansion in middle-class welfare was a series of non-means-tested cash payments introduced
in the years after the revenue boom began. A first home owners’ grant (FHOG) of $7,000 was introduced in 2000-
01. A baby bonus was rolled out in 2002, initially worth $3,000 and rising to $4,000 by 2007.
Other forms of indirect middle-class welfare were introduced which reached recipients in the form of rebates or
subsidies rather than direct cash payments. The private health insurance rebate offered recipients a contribution of
at least 30% of the cost of a health insurance policy. The growth in payments to non-government schools outlined
above increased an implicit subsidy to parents who chose to educate children outside the government school
system. The absence of means-testing for FHOG and the baby bonus and the higher take-up of private health
insurance and schooling amongst middle- and higher-income households means that the net effect of these policies
was a regressive transfer towards wealthier households.
After the Party: How Australia spent its mining boom windfall May 2012 Hetherington & Prior 14These policies added to a culture of ‘entitlement’, as subsequently described by former Howard minister Joe
Hockey in 2012. Hockey’s observations are poignant since he was a senior minister in the Howard Government
when many of these policies were first rolled out. Megalogenis summarises the psychological impact of this policy
approach on voters:
“…Howard indulged the electorate by breaking a longstanding convention of Australian politics
that a handout to voters had to be matched by an offset elsewhere in the budget. The surplus,
which began building again in 2002, was returned to voters as tax cuts and cash payments that
created their own bubble logic: to impress the public, every subsuqeuent handout had to be more
generous than the last…” (2012A: 310-11)
We return to the longer-term effects of this entitlement approach in our conclusion.
After the GFC
In 2008-09, the first full year of the Rudd Government, the money stopped flowing. In that year tax revenues fell
from 25.8% of GDP to 23.8%. The next year, they fell to 22.6% and the year after that to 22.1%.
In the face of the global financial crisis, the Rudd Government adopted an aggressive fiscal spending plan to stimu-
late the economy. This involved spending the available share of the accrued surpluses and borrowing approximate-
ly $40 billion in 2008-09, and $46 billion in 2009-10 and $44 billion in 2010-11.
The design of the stimulus program has been well documented elsewhere, notably by Chris Barrett in his paper
Australia and the Great Recession (2011). In December 2008, the Government paid $9 billion in cash stimulus
payments to households, based on Treasury advice to “go early, go households and go hard”. In February 2009,
the Government announced a $42 billion Nation Building and Jobs Plan, which included $15 billion for schools
infrastructure, $9 billion for social and defence housing, $4 billion for energy efficiency programs and a further $12
billion in stimulus bonus payments. Alongside all of this was a $42 billion investment in a National Broadband Net-
work which as a capital project did not show up in the Budget but nonetheless contributed to the stimulus effect.
These programs dramatically changed the composition of Commonwealth expenditure. In the three year period
from 2007-08 to 2010-11, public spending outpaced GDP growth on housing by 32.3% p.a., on education spending
by 14.3% and on unemployment payments by 10.8% p.a.
Several features of the Labor Government’s stimulus spending stand out. This was the first time since 1992 under
Paul Keating that a government had explicitly used fiscal spending to stimulate the economy. All the stimulus
programs were explicitly temporary in nature with capped spending limits and fixed end-dates. The majority of the
stimulus funds were spent on capital investment programs rather than recurrent expenditure items or cash hand-
outs.
These features distinguished the post-GFC Rudd/Gillard spending from the pre-GFC Howard/Rudd spending that
preceded it. It achieved the desired effect of stimulating the economy through a period of global contraction and
improving the productive capacity through capital investment in education, communications and infrastructure.
But at the end of the decade, the boom was well and truly over – the terms of trade had peaked and the windfall
had been spent. In hindsight, how well did Australia do?
After the Party: How Australia spent its mining boom windfall May 2012 Hetherington & Prior 15Conclusion: Alternative Futures
During the boom years from 2001-02 to 2007-08, the Australian Government stood to receive at least $180 billion
over and above trend expectations. Of this, almost three-quarters - $105 billion - was used to pay off Common-
wealth debt and build a series of long-term savings vehicles. $50 billion, over a quarter, was spent on expanded
policy programs and at least $25 billion, around one-seventh, was given back to taxpayers in the form of tax cuts.
Use of Australia’s Windfall
(2001-02 to 2007-08)
$50 billion $36 billion
$25 billion $69 billion
Source: Commonwealth Treasury, Per Capita analysis
On balance, this was a creditable performance from the Howard and (early) Rudd Governments. The decisions to
pay off $36 billion in debt and lock $69 billions away in Future Funds were undoubtedly the right ones. In this con-
text, the majority of the windfall was put to good use – dissolving our debt obligations, saving against future pension
liabilities and locking down funds for long-term investment in infrastructure, health and education.
It is the management of the remaining $75 billion that is the problem: it has created a structural problem for Austra-
lia’s public finances which will take years to fully rectify.
The issue is not middle-class welfare per se. The inflated spending programs did reflect an increase in middle-
class welfare, although not to the degree claimed by some commentators. The problem is that both the inflated
spending and the tax cuts have permanently shifted the baseline of the Australian budgets. What’s more, they’ve
shifted the expectations of Australians with regards to tax levels and government handouts. This is the entitlement
mentality Joe Hockey was describing.
After the Party: How Australia spent its mining boom windfall May 2012 Hetherington & Prior 16Because the tax cuts of the boom years were permanent cuts and the various cash handout and subsidy programs
of the boom years were recurring programs, the Budget was not in a position to balance these inflows and outflows
the economy turned and the revenue windfall died away. This was the great error of the boom years: committing
future governments to permanently reduced tax levels and permanently increased spending expectations that could
not sustain a change in economic circumstances. As Megalogenis remarked of the year when family payments
outpaced payments to the needy for the first time, “…Any society that values its working families above all other
beneficiaries in good times is asking for budget trouble in bad times” (2012B).
The Gillard government is now wrestling with the legacy of this error. Tax revenues have fallen dramatically and
are unlikely to return to boom-time levels for years to come. As a result, the Gillard government has been forced to
address the exceedingly generous handout programs of the boom years, now that the need for stimulus has faded.
It has imposed a means-test of $150,000 per year for numerous entitlements, including the family tax benefit parts
A & B, the baby bonus, the private health insurance rebate and tax rebates for dependents. The Government has
worn considerable criticism for doing so, notably over the health insurance rebate. However, if it is to restore a
sustainable balance to the Commonwealth Budget, the Government has little choice.
One reason its options are limited is that the income tax cuts cannot be undone for political reasons. This effective-
ly means over the long term that Australians are locked into a lower level of government service delivery, whether
we like it or not. And this has occurred without a political debate about the pros and cons of this path: this course of
action was effectvely locked in years ago.
So what should we have done with the remaining $75 billion? We should have made long-term investments that
increased productivity, which simply flatlined throughout the decade. And we should have made these collective
investments in a way which entrenched fairness as well as prosperity, which spread the benefits and increased
quality of life for all.
How would we have done this? Let’s go back to our proverbial 20 year old lottery winner. Rather than spend the
final quarter of the windfall on the decade-long party, let’s imagine they invest it in wealth creating ideas. Let’s say
they dare to dream. They’re not Paris Hilton, but Steve Jobs or Henry Ford. In the government realm, their equiva-
lent might be Franklin D. Roosevelt or even Ben Chifley. They build long-lasting, productive assets.
What are these assets in the case of Australia in the naughties? Australia might have built a high-speed rail line
linking Brisbane, Sydney, Canberra and Melbourne. We might have expanded much-needed public transport net-
works in the outer suburbs of Melbourne or Sydney. We might have completed a dual-track Pacific Highway or put
all our road freight onto rail. We might have increased our port capacity at a time when ships where anchored in
their dozens off Gladstone, Newcastle and Wollongong. Or even constructed a second Sydney airport.
For clean energy, we might have developed in our deserts publicly-owned solar generation farms which pipe clean
energy to our aluminium smelters and major mines through high-voltage DC transmission lines. We might have
financed every household in Australia to install solar PV panels plus battery storage with a payback to the taxpayer
from the trailing cost savings.
After the Party: How Australia spent its mining boom windfall May 2012 Hetherington & Prior 17We might equally have invested in human capital, our nation’s ‘soft’ infrastructure. We might have funded half a
million cadetships for skilled apprentices, addressing the chronic skilled labour shortages we face. We might have
developed a 21st century Colombo Plan, offering every high school student a reciprocal exchange opportunity be-
tween Australia and our regional neighbours. Or we might have addressed our long-term underinvestment in R&D,
building an Australian venture comparable to CERN.
Each of these initiatives builds national wealth in a sustainable way which shares the benefits amongst all Austra-
lia. With $75 billion to invest, we could have achieved at least one of them, perhaps more. Instead, we spent our
windfall on the here and now. Much like the 20 year-old having a decade-long party.
------
After the Party: How Australia spent its mining boom windfall May 2012 Hetherington & Prior 18Bibliography Australian Office of Financial Management, Portfolio at the End of the Financial Year 2009-11, Commonwealth of Australia: Canberra Barrett, C. (2011) Australia and the Great Recession, Per Capita: Sydney Cleary, P. (2011) Too Much Luck: The Mining Boom and Australia’s Future, Black Inc: Melbourne Commonwealth of Australia, Australian Government Budget – Budget Papers 2001-02 to 20010-11, Commonwealth of Australia: Canberra Cowgill, M. (2012) “Has Joe Hockey promised the end of the Australian safety net?”, Blog post, 19 April, http://mattcowgill.wordpress.com/2012/04/19/has-joe-hockey-promised-the-end-of-the-australian-safety-net/ Hetherington, D. (2009) “Conservative shift likely to spook the electorate”, The Australian, 9 December Hockey, J. (2012) “The End of the Age of Entitlement”, Speech to the Institute of Economic Affairs, London, 17 April Howard, J. (2009) “Howard defends his spending”, Letter to the editor, The Australian, 11 December Ingles, D. (2009) The Great Superannuation Tax Concession Rort: Research Paper No 61, The Australia Institute: Canberra Megalogenis, G. (2012A), The Australian Moment: How we were made for these times, Penguin: Melbourne ---- (2012B) “Budgets and hard truths”, The Australian, 5 May OECD (2010), Social Expenditure Database, 1980-2007, OECD: Paris (www.oecd.org/els/social/expenditure) Saunders, P. (2007) The Government Giveth and the Government Taketh Away: Tax Welfare Churning and the Case for Welfare State Opt-Outs: Policy Monograph 74, Centre for Independent Studies: Sydney Whiteford, P., Redmond, G. & Adamson, E.. (2011) “Middle class welfare in Australia: How has the distribution of cash benefits changed since the 1980s?”, Australian Journal of Labour Economics, Vol. 14, No. 2, pp. 81-102 After the Party: How Australia spent its mining boom windfall May 2012 Hetherington & Prior 19
www.percapita.org.au

Suite 205 61 Marlborough Street Surry Hills NSW 2010
50 Cardigan Street Carlton VIC 3053
info@percapita.org.au
You can also read