ECONOMIC, TAX REVENUE, & MEDIA IMPACTS - OF THE MILWAUKEE BREWERS BASEBALL CLUB & MILLER PARK - The Milwaukee ...
←
→
Page content transcription
If your browser does not render page correctly, please read the page content below
ECONOMIC, TAX REVENUE, & MEDIA IMPACTS
OF THE MILWAUKEE BREWERS BASEBALL CLUB & MILLER PARK

                    February 17, 2020
February 17, 2020

Mr. Timothy Sheehy
President
Metropolitan Milwaukee Association of Commerce
756 N. Milwaukee St., Suite 400
Milwaukee, WI 53202

Dear Mr. Sheehy,

Conventions, Sports & Leisure International (“CSL”) is pleased to present this Report regarding the economic, tax revenue, and media

impacts that the construction and annual operations of Miller Park (“Ballpark”) and the Milwaukee Brewers Baseball Club (“Brewers” or

“Team”) have had on the City of Milwaukee (“City”), Milwaukee County (“County”), and State of Wisconsin (“State”). The attached Report

summarizes our research and analyses and is intended to assist the Metropolitan Milwaukee Association of Commerce (“MMAC”) in

quantifying the economic, tax revenue, and media impacts associated with the construction and annual operations of the Ballpark and
the Brewers.

The information contained in this Report is based on estimates, assumptions, and other information developed from research of the

market, knowledge of sporting events, and other factors, including certain information the Brewers and other stakeholders have provided.

CSL has not independently audited or verified any information provided to us, and we have assumed such information is correct. Given

the scope of our engagement, we express no opinion or assurances of any kind on the achievability of any projected information contained

herein, and this Report should not be relied upon for that purpose. Furthermore, there will be differences between projected and actual

results. This is because events and circumstances frequently do not occur as expected, and those differences could be material. We have

no responsibility to update this Report for events and circumstances occurring after the date of this Report.

We sincerely appreciate the opportunity to assist you with this project, and we would be pleased to be of further assistance in the

interpretation and application of the Report’s findings.

Very truly yours,

CSL International

                    One Cowboys Way, Suite 325 • Frisco, TX 75034 • Telephone 972.491.6900 • Facsimile 972.491.6903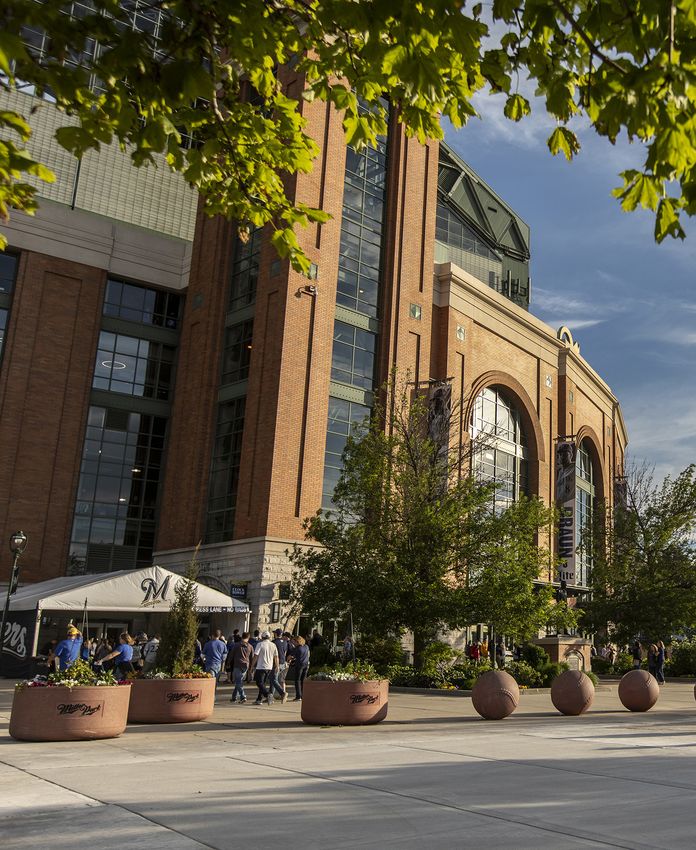
TABLE OF CONTENTS

    OVERVIEW OF RETURN ON INVESTMENT......................................                      i
    EXECUTIVE SUMMARY..................................................................         ii
    CONVENTIONS, SPORTS & LEISURE INTERNATIONAL...............                                  v
1   INTRODUCTION.............................................................................   1
2   HISTORICAL ANALYSIS.................................................................        3
3   STUDY METHODOLOGY.................................................................          9
4   DEVELOPMENT OF ASSUMPTIONS..........................................                  16
5   ECONOMIC & TAX REVENUE IMPACT ANALYSIS.....................                           26
6   MEDIA IMPACT ANALYSIS.........................................................        32
7   QUALITATIVE IMPACT ANALYSIS..............................................             35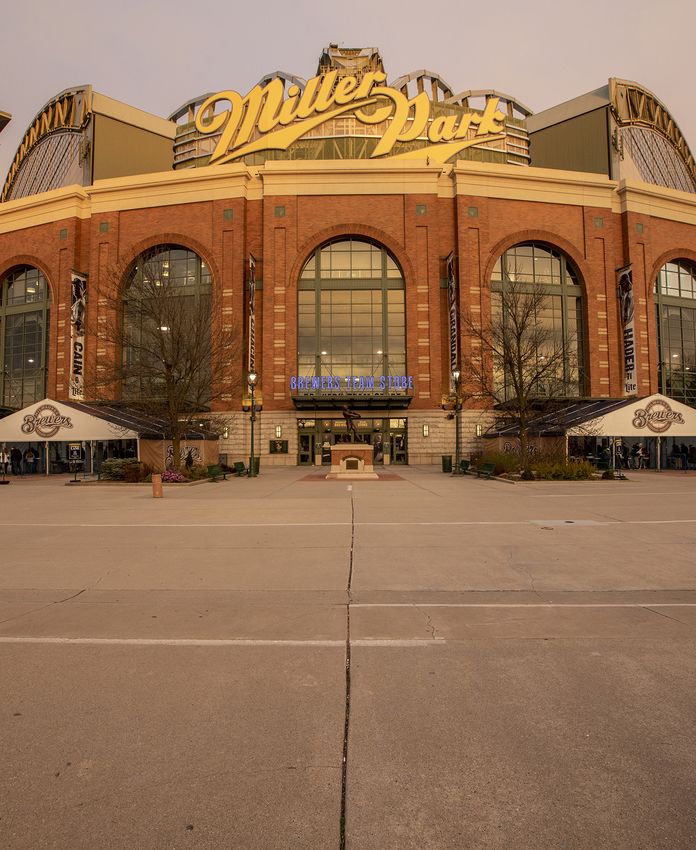
OVERVIEW OF RETURN ON INVESTMENT

          OVERVIEW OF RETURN ON INVESTMENT

                        NET NEW BALLPARK CONSTRUCTION &
                   19-YEAR TEAM & BALLPARK OPERATIONS IMPACTS
                                                                             STATE OF WISCONSIN

                                                                 $2.5 B                                1,835
                                                                TOTAL OUTPUT (1)                       FTE JOBS (2)

                                                                                    $1.2 B
                                                                                PERSONAL EARNINGS

                                     OTHER KEY HIGHLIGHTS

                            • In addition to generating billions of dollars in economic output through direct spending, job
                              creation, and new personal earnings, the construction and operations of the Ballpark have
                              generated hundreds of millions of dollars in new state and local tax revenue. Meanwhile,
                              approximately $605 million in taxes have been collected to pay for the original construction of
                              the Ballpark and for the Stadium District’s ongoing funding obligations for the Ballpark.
                            • 81 regular season Brewers home games each year (and exhibition & postseason when
                              applicable), as well as a variety of third-party events, including concerts
                            • 2.7 million paid attendees per year, approaching 3.1 million over the past two seasons (baseball
                              and non-baseball events)
                            • The Brewers have paid the District $19.8 million in rent since 2001
                            • The Brewers have independently invested $106.8 million to maintain and enhance the Ballpark
                              since 2001
                            • The Ballpark’s retractable roof eliminates the risk of weather-related postponements or
                              delays, which has enabled the Team to outperform other MLB clubs in attendance.

                 MEDIA IMPACTS FOR 12-MONTH PERIOD (3)

                                                                      $38 M
                                                                  STATE OF WISCONSIN

(1) Total Output represents the total direct, indirect, and induced spending effects generated by the Team and Ballpark. Employment is expressed in terms of
person years of employment and is based on project spending. Person years are defined as one year of employment, or 2,080 annual hours, and may be full- or
part-time. Media Impacts value the media exposure generated from the Team and Ballpark by estimating the total number of impressions and their corresponding
market value.
(2) Jobs do not accumulate over the time period studied herein. Represents total average full time equivalent jobs generated from 2019 annual operations of the
Team and Ballpark.
(3) From October 1, 2018 to September 30, 2019

                                                                            -i-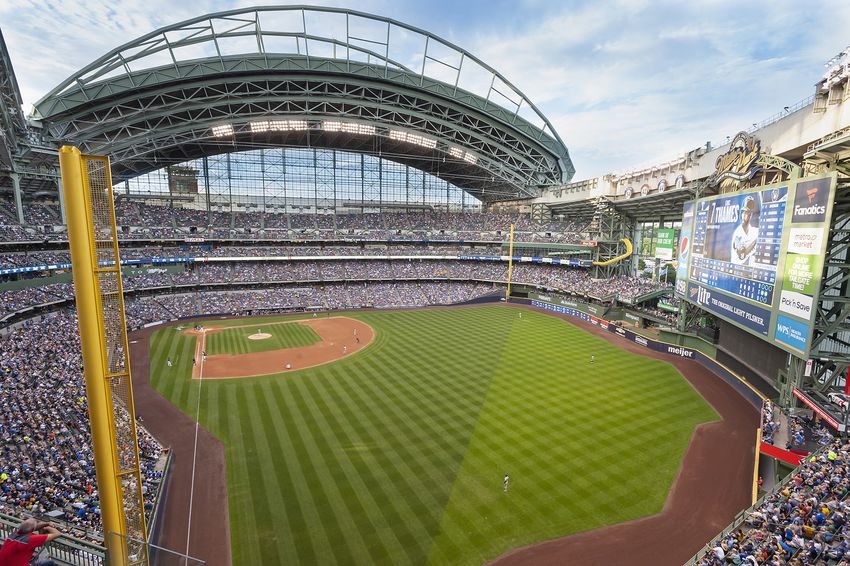
EXECUTIVE SUMMARY

     EXECUTIVE SUMMARY
     The Milwaukee Brewers Baseball Club (“Brewers” or “Team”) and the stadium currently named Miller Park (“Ballpark”) are important
     components of Wisconsin’s sports, entertainment, tourism, and business community. For 50 years, the Team has been an economic
     asset for the State of Wisconsin (“State”), Milwaukee County (“County”), and City of Milwaukee (“City”). Since moving to Milwaukee, the
     Brewers have played their home games in the Menomonee Valley area, with their first 31 years at Milwaukee County Stadium and the
     last 19 years at Miller Park.

     The Team and Ballpark are sources of year-round entertainment and civic pride that serve as a driver of tourism and economic
     development for the region, while also providing financial support for various community, athletic, academic, and charitable endeavors.
     The Ballpark and Team draw an average of 2.7 million paid attendees for Brewers home games and other third-party events. Over the
     past two seasons, despite operating in the smallest market in MLB, the Brewers have averaged 2.9 million in paid attendance (nearly 3.1
     million when non-baseball game events are included), placing the Brewers 8th in MLB in attendance in 2019 and 10th in MLB attendance
     in 2018.

     To this end, Conventions, Sports, & Leisure International (“CSL”) was retained to develop an independent estimate of the quantifiable
     benefits of the Ballpark and Team to the region to assist the Metropolitan Milwaukee Association of Commerce (“MMAC”) based on
     actual results from the Ballpark’s past 19 years of operations (2001 to 2019). For purposes of this report, quantifiable benefits are
     characterized in terms of economic impacts (direct spending, total output, personal earnings, employment), tax revenue impacts, and
     media impacts. Each of the measures of impact is further described below:

DIRECT SPENDING                                                                      TOTAL OUTPUT
represents spending generated by Team and Ballpark operations, including:
                                                                                     represents the total direct, indirect, and induced spending
  • Brewers operating expenditures;
                                                                                     effects generated by the Team and Ballpark. Indirect spending
  • In-Ballpark expenditures by patrons and event                                    consists of the re-spending of the initial direct spending, and
    personnel on admissions, food and beverage,                                      induced spending effects consists of the positive changes in
    merchandise, parking, etc.;                                                      spending, employment, earnings, and tax collections generated
  • Out-of-Ballpark spending by patrons, visiting teams, and event                   by personal income associated with the operations of the Team
    personnel on hotels, food and beverage, retail, transportation,                  and Ballpark. Economic impacts were estimated utilizing
    entertainment, and other such expenditures; and,                                 multipliers from the IMPLAN system which is an industry
                                                                                     leading resource used by various government entities,
  • Other spending specific to Ballpark operations, including
                                                                                     universities, and private companies.
    sponsorships and advertising, capital improvements, and
    other such expenditures.

PERSONAL EARNINGS represent the                         EMPLOYMENT is expressed in terms of person                       TAX REVENUE IMPACTS
wages and salaries earned by employees of               years of employment and is based on project                      denote changes in tax
businesses impacted by the past 19 years of                spending. Person years are defined as one year of             revenues.
operations at Miller Park.                                   employment, or 2,080 annual hours, and may be
                                                              full- or part-time.

           MEDIA IMPACTS value the media exposure generated from the Team and Ballpark by estimating the total number
           of impressions and their corresponding market value.

           The assumptions underlying the estimates of economic, tax revenue, and media impacts are based on the historical operations
           of the Ballpark, the results of random patron-intercept surveys conducted at Brewers home games during the 2019 season,
           industry data, use of IMPLAN multipliers, and CSL’s experience in quantifying the economic, tax revenue, and media impacts
           of similar projects.

           This Executive Summary outlines the key highlights of the economic, tax revenue, and media impacts to the State from the
           construction of the Ballpark and annual operations of the Brewers as set forth herein.

                                                                            - ii -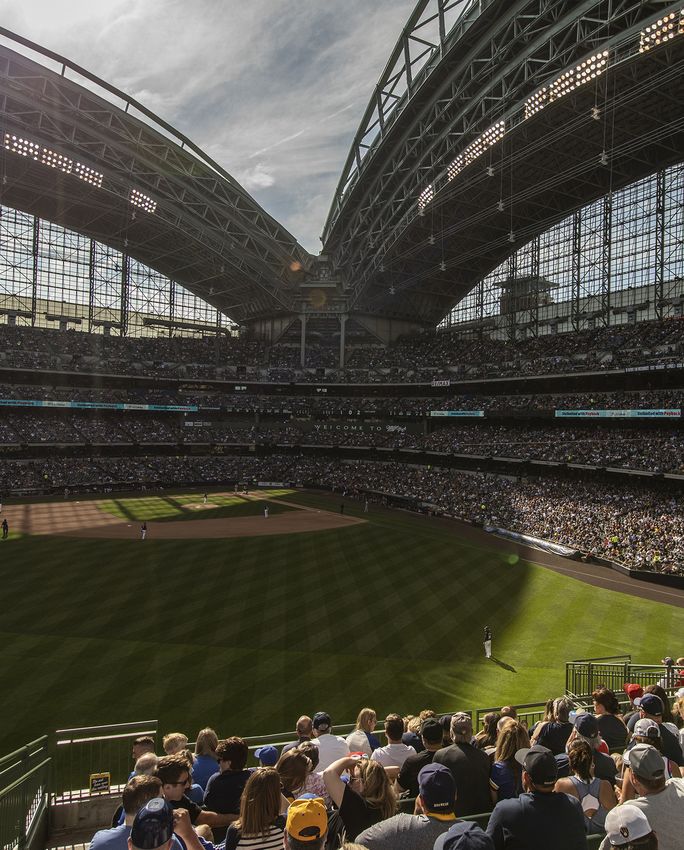
EXECUTIVE SUMMARY

KEY HIGHLIGHTS

         • The development of the 1.2 million square foot Ballpark cost approximately $392 million
             throughout the construction phase from 1999 to 2001.

         • In the first year in the Ballpark, Brewers attendance increased by nearly 80 percent from the
             Team’s final year at Milwaukee County Stadium.

         • Since opening in 2001, despite operating in the smallest market in MLB, the Ballpark has
             provided the region with a modern sports and entertainment venue, drawing an average of 2.7
             million paid attendees per year (3.1 million in the last two seasons, including 2.9 million Brewers
             game attendees, which ranked 8th highest in MLB in 2019 and 10th in the MLB in 2018).

         • Based on historical Brewers attendance data, approximately 22 percent of Ballpark event
             attendees are estimated to live within the City of Milwaukee, 38 percent within Milwaukee County,
             and 86 percent within the State of Wisconsin. The remaining 14 percent of attendees live outside
             the State of Wisconsin.

         • Spending by visitors for events at the Ballpark consists of in-facility spending on tickets,
             concessions, merchandise, and parking, as well as out-of-facility spending on hotels,
             restaurants, shopping, gas, transit, entertainment, services, and other such expenditures. In
             2019, based on the results of the intercept survey, per capita out-of-ballpark spending (1) by
             visitors is estimated to total the following:

                 o City Residents: $6.50                             o In-State Overnighters: $87.00

                 o County Residents: $11.50                          o Out-of-State Day Trippers: $5.00

                 o In-State Day Trippers: $8.50                      o Out-of-State Overnighters: $237.00

         • The construction and ongoing operations of the Ballpark and Team have provided significant
             benefits in the areas of direct spending, total output, personal earnings, employment, increased
             tax revenues, and media impacts to the three regions under study as summarized on the
             following page.

         • The Ballpark’s retractable roof eliminates the risk of weather-related postponements or
             delays, which has enabled the Brewers to outperform other MLB clubs in attendance.

       (1) Rounded to the nearest $0.50.

                                                 - iii -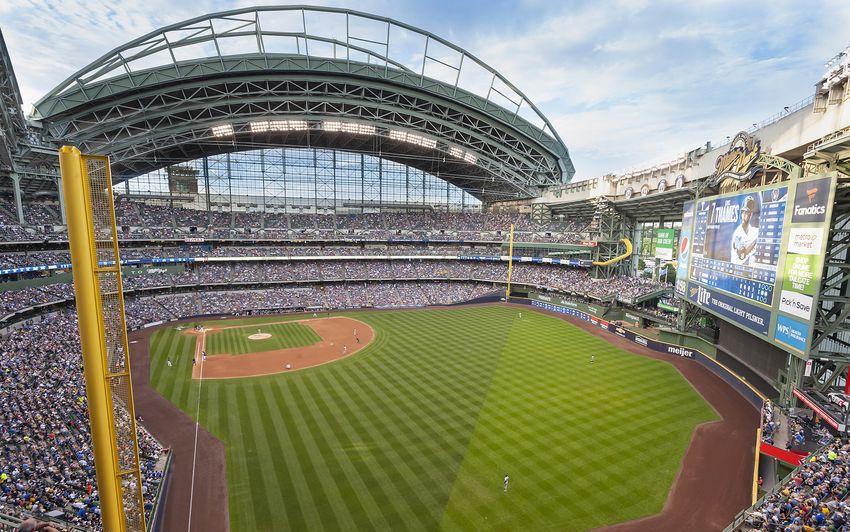
EXECUTIVE SUMMARY

         STATE OF WISCONSIN IMPACTS

            • Cumulative net new impacts to the State associated with initial Ballpark
                construction and 19 years of ongoing Ballpark and Team operations totaled
                approximately $2.5 billion in total output, $1.6 billion in direct spending,
                $263 million in new taxes, 1,835 total annual jobs (1), and $1.2 billion in
                personal earnings.

            • Overall, the Team and Ballpark generated approximately $37.7 million in
                media exposure value for the State over the 12-month period from October
                1, 2018 to September 30, 2019.

     THIS REPORT SHOULD BE READ IN ITS ENTIRETY TO OBTAIN THE
BACKGROUND, METHODS, AND ASSUMPTIONS UNDERLYING THESE FINDINGS.

       (1) Jobs do not accumulate over the time period studied herein. Represents total average jobs
       generated from 2019 annual operations of the Team and Ballpark.

                                                 - iv -
CONVENTIONS, SPORTS & LEISURE INTERNATIONAL

  CONVENTIONS,
SPORTS & LEISURE
 INTERNATIONAL

                      -v-
CONVENTIONS, SPORTS & LEISURE INTERNATIONAL

Conventions, Sports & Leisure International is an industry-leading consulting and advisory firm dedicated to the sports,
entertainment, convention, and attraction industries. As such, CSL has gained a reputation for providing our clients with
professional, thorough, and timely hands-on consulting services.

One of the primary strengths of CSL is our experience. The CSL team brings to each project a perspective gained through
more than 200 years of collective experience in consulting, participating in more than 2,000 projects including more than
300 economic impact studies. We assist our clients from the earliest stages of project planning, ensuring that all decisions
are informed ones. Our consultants provide in-depth information, creative solutions to underlying issues, a thorough
analysis of financial implications, and various measurements of risk and return surrounding alternative courses of action.

CSL has assisted numerous public bodies and private sector clients with the analysis of the benefits associated with
facilities similar to Miller Park. Specifically, CSL has assisted clients in evaluating the impact of the following selected
franchises or facilities:

         Green Bay Packers / Lambeau Field                             Oakland Athletics / New Ballpark

         Milwaukee Bucks / Fiserv Forum                                Orange Bowl Festival of Events

         Chicago Cubs / Wrigley Field                                  Portland Diamond Project / Portland MLB
                                                                       Franchise & Ballpark
         Cleveland Cavaliers /Rocket Mortgage FieldHouse
                                                                       San Diego Padres / Petco Park
         Dallas Cowboys / AT&T Stadium
                                                                       San Francisco 49ers / Levi’s Stadium
         Dallas Mavericks / American Airlines Center
                                                                       Tampa Bay Rays / New Ballpark
         Los Angeles Angels / Angel Stadium
                                                                       Texas Rangers / Globe Life Park
         Miami Marlins / Marlins Park
                                                                       University of Southern California / Los Angeles
         New York Giants / MetLife Stadium
                                                                       Memorial Coliseum

                                                           - vi -
INTRODUCTION

INTRODUCTION

       -1-
INTRODUCTION
INTRODUCTION
The Brewers have been an economic asset for the City, County, and State for nearly 50 years. Since moving to Milwaukee, the
Brewers have played their home games in the Menomonee Valley area, with their first 31 years at Milwaukee County Stadium
and now at Miller Park. The Brewers partnered with the governments of Milwaukee, Racine, Waukesha, Washington, and
Ozaukee Counties to open the 41,900-seat Miller Park in 2001, which is adjacent to the site of the prior stadium. In this way,
the Brewers demonstrated their commitment to the region, ensuring a strong financial base for the Team, and providing
increased benefits to the local economy.
Development of the 1.2 million square foot Ballpark cost approximately $392 million throughout the construction phase
from 1999 to 2001. Located approximately five miles west of downtown Milwaukee, the Ballpark draws an average of 2.7
million paid attendees (3.1 million in the last two seasons) each year to Brewers home games and other third-party events,
which benefits the local economy in terms of spending at the Ballpark and surrounding restaurants, bars, hotels, and other
area establishments, as well as providing employment and wages to area workers, and increased tax revenues to local
governments.
In order to assist the MMAC in understanding the quantifiable impacts of the construction and annual operations of the
Ballpark and Brewers to the City, County, and State, Conventions, Sports & Leisure International (“CSL”) developed an
independent estimate of the quantifiable impacts to the region of the Ballpark and Team, based on actual results from the
Ballpark’s past 19 years of operations (2001 to 2019).
Typically, and for purposes of this Report, quantifiable impacts are characterized in terms of economic impacts, tax revenue
impacts, and media impacts. Economic impacts are conveyed through measures of direct spending, total output, personal
earnings, and employment. Tax revenue impacts denote changes in tax revenues, while media impacts value the media
exposure generated from the Team and Ballpark by estimating the total number of impressions and their corresponding
market value.
The assumptions underlying the estimates of economic, tax revenue, and media impacts are based on the historical
operations of the Ballpark and Team, the results of random patron-intercept surveys conducted at Brewers home games
during the 2019 season, industry data, the use of IMPLAN multipliers, and CSL’s experience in quantifying the economic,
tax revenue, and media impacts of similar entities.
The study’s findings are presented in the following sections:
HISTORICAL STUDY DEVELOPMENT OF
INTRODUCTION
ANALYSIS METHODOLOGY ASSUMPTIONS
ECONOMIC & TAX REVENUE MEDIA IMPACT QUALITATIVE IMPACT
IMPACT ANALYSIS ANALYSIS ANALYSIS
-2-HISTORICAL ANALYSIS
HISTORICAL ANALYSIS
-3-HISTORICAL ANALYSIS
OVERVIEW OF THE MILWAUKEE BREWERS
The Seattle Pilots joined Major League Baseball (“MLB”) as an American League (“AL”) expansion
franchise in 1969. The team played its inaugural season at Sick's Stadium, a 25,000-seat facility
built in 1938 and located in Seattle, Washington. During its first and only season in Seattle, the
franchise suffered poor on-field performance and financial loss. In 1970, a group led by Bud Selig
purchased the franchise out of bankruptcy court and relocated the team to Milwaukee, becoming
the Milwaukee Brewers.
During the team’s first 31 seasons in Milwaukee, home games were played at
the multi-purpose Milwaukee County Stadium which also served as a football stadium. Located
approximately five miles west of downtown Milwaukee, the open-air stadium initially featured a
capacity of 45,768 seats before expanding to over 53,000 seats by 1979. Throughout its first few
years in Milwaukee, the Team lacked consistency on the field. Beginning with the 1978 season,
the team recorded six consecutive winning seasons, including an AL pennant and World Series
appearance in 1982, before struggling throughout the mid-1980’s and 1990’s. In 1998, the Brewers
became the first team in MLB history to switch leagues when the team moved to the National
League Central Division.
In order to provide enhanced fan amenities and drive additional revenues that the Team could
reinvest back into the roster and player development, Brewers management sought to construct a
new, climate-controlled, baseball-specific stadium. The Brewers partnered with the governments
of Milwaukee, Racine, Waukesha, Washington, and Ozaukee Counties to open Miller Park in 2001
adjacent to the Milwaukee County Stadium site, demonstrating their commitment to the region,
ensuring a strong financial base for the Team, providing increased benefits to the local economy,
and serving to attract people to the arena through its status as a “Major League” City.
Since the opening of Miller Park, the Brewers have experienced sustained on-field success and
underwent a change in ownership. In late 2004, it was announced that current majority owner Mark
Attanasio reached an agreement to purchase the Team from the family of then MLB Commissioner
Bud Selig. In 2008, the Team qualified for the postseason for the first time since 1982. Since then,
the Brewers have had a number of on-field achievements, including setting the franchise record
number of wins (2011), two divisional titles (2011, 2018), and back to back postseason appearances
(2018-2019). Construction of Miller Park has allowed the team to grow its fan base and reinvest
in the Team.
For 50 years, the Brewers have been an economic asset for the City, County, and State. Since
moving to Miller Park, the Team has provided enhanced benefits to the local economy, attracting
more that 2.7 million fans despite operating in the smallest market in MLB (3.1 million in the last
two seasons, including 2.9 million Brewers game attendees, which ranked 8th highest in MLB
in 2019 and 10th in the MLB in 2018). The consistent impact of the Brewers has led to additional
investment in the area surrounding the Ballpark, and has helped maintain the economic stability
of local businesses. Additionally, the Brewers are active community partners, donating volunteer
hours and monetary grants to a variety of charitable organizations in the region.
-4-HISTORICAL ANALYSIS
OVERVIEW OF MILLER PARK
Miller Park is located approximately five miles west of downtown Milwaukee and has served as the home of the Brewers
since 2001. The Ballpark was constructed at a cost of approximately $392 million and was funded by public and private
sources, including a 0.1 percent sales tax increase across Milwaukee, Racina, Waukesha, Washington, and Ozaukee
Counties.
The Ballpark is owned by the Southeast Wisconsin Professional Baseball Park District (“the District”), a local government
unit formed to oversee the financing, planning, and construction of the Ballpark. Approximately $605 million in contributions
from the District has been used to fund the initial construction and ongoing maintenance of the Ballpark over the last 21
years. The Brewers signed an initial 30-year lease with the District to operate the building and play their home games
therein. Since opening in 2001, the Brewers have paid the District $19.8 million in rent.
ANNUAL BALLPARK ATTENDANCE
Despite operating in the smallest market in MLB, since opening in 2001, the Ballpark has provided the region with a modern
sports and entertainment venue, drawing an average of 2.7 million paid attendees per year (3.1 million in the last two
seasons, including 2.9 million Brewers game attendees, which ranked 8th highest in MLB in 2019 and 10th in the MLB
in 2018). In addition to hosting 81 regular season Brewers home games, the Ballpark attracts a number of other events
including MLB exhibition and postseason games, concerts, banquets, meetings, and other such events. The following chart
summarizes the total paid attendance at Ballpark events in each full year of operation.
ANNUAL MILLER PARK ATTENDANCE (BASEBALL & NON-BASEBALL)
3.3M
3.2M
3.2M
3.0M
2.9M
2.9M
2.9M
2.9M
2.8M
2.8M
2.7M
2.6M
2.6M
2.4M
2.3M
2.3M
2.1M
2.0M
1.7M
2001 2002 2003 2004 2005 2006 2007 2008 2009 2010 2011 2012 2013 2014 2015 2016 2017 2018 2019
During the first year in the Ballpark, the attendance at Brewers home games increased by nearly 80 percent from the
Team’s final year at Milwaukee County Stadium. Additionally, the average home attendance at the Ballpark since 2001
has been approximately 76 percent larger than the average home attendance at Milwaukee County Stadium. The Ballpark
provides an intimate atmosphere for the Team that has allowed the Brewers to maintain elevated attendance levels and
achieve a more exciting gameday experience.
-5-HISTORICAL ANALYSIS
BREWERS SEASON TICKET HOLDERS
Season ticket holders are the backbone of sports teams and provide a stable revenue source and consistent attendance at
a facility. As visualized in the map below, Brewers season ticket holders are largely concentrated within 200 miles of the
Ballpark; however, the Team has account holders located throughout the Country. As shown, approximately 61 percent of
season ticket holders reside within 25 miles of the stadium, 70 percent reside within 50 miles of the stadium, 87 percent
reside within 100 miles of the stadium, and 95 percent reside within 200 miles.
Fewer Season Ticket More Season Ticket
Holders Holders
25 Miles: 61%
50 Miles: 70%
100 Miles: 87%
200 Miles: 95%
-6-HISTORICAL ANALYSIS
BALLPARK AREA DEVELOPMENT
Prior to opening, the land on which the Ballpark was constructed met the State’s definition of “blighted,” with environmentally
tainted and contaminated soil due to abandoned manufacturing operations. Through careful development planning, the
Ballpark became the center of revitalization for the area west of downtown Milwaukee.
The Village of West Milwaukee (“Village”), which is directly south of the Ballpark, is one area that has seen revitalization
through development since the Ballpark opened, as a number of service-oriented businesses, national brand retailers, and
residential developments have been built within the area. The development in the area has substantially raised land values
and generated large increases in property and sales tax revenues within the Village.
The Menomonee Valley, the area immediately east of the Ballpark, is another area that has seen revitalization through
development, largely as a result of the construction of the Ballpark. Largely empty industrial land prior to the Ballpark’s
opening in 2001, the Menomonee Valley has seen millions in investment and is considered one of the nation’s models for
industrial redevelopment. Anchored by the Ballpark on the west end, the Potawatomi Hotel & Casino in the middle, and the
Harley Davidson Museum on the east end, the majority of development within this area has been zoned for industrial use
only.
To make the development more appealing to the public, Menomonee Valley developers have integrated green space amidst
the industrial parks and water treatment center. The area has generated new industrial corporate real estate taxes,
hundreds of new jobs, and increases in land values.
Development Anchors
Redevelopment Areas
The Ballpark and Team have spurred millions in both private and public investment into the region, generated new
jobs and tax revenue sources, and increased the tax base by attracting new residents to areas that had previously been
underdeveloped.
-7-HISTORICAL ANALYSIS
INVESTMENT IN MILLER PARK
In order to maintain the Ballpark, the Brewers and the District have consistently invested in general repairs and maintenance,
as well as renovations to improve operations and provide new experiences for visitors and fans. Maintenance and capital
improvements have preserved the Ballpark in excellent condition for the game day experience and created local jobs and
spending each year in the local economy.
In total, the Brewers have independently invested approximately $106.8 million to maintain and enhance the Ballpark
over the past 19 years. In addition, the Brewers permit the Department of Transportation to sell Brewers license plates,
which has generated approximately $2.5 million ($250,000 annually) since 2010 directly to the Stadium District to help
reduce debt and to help pay for stadium maintenance and annual maintenance of the retractable roof. In the past, the
Brewers investments in the Ballpark included improvements to food and beverage infrastructure, upgrades to seating
options such as club lounge refreshes, updated club suites and renovated founders suites, and other similar improvements
and maintenance projects. During this same time frame, 10 MLB franchises have constructed new ballparks and several
other franchises have completed major renovation projects to enhance the game day experience for fans and to generate
additional revenues.
-8-STUDY METHODOLOGY
STUDY METHODOLOGY
-9-STUDY METHODOLOGY
The Team and Ballpark provide significant quantifiable benefits to the City, County, and State. To provide a detailed and
in-depth analysis of the benefits associated with the last 19 years of operations at the Ballpark, CSL synthesized historical
operating data and the results of random patron-intercept surveys conducted at Brewers home games during the 2019
season, and applied relevant assumptions to the study methodology outlined over the following pages.
Typically, and for purposes of this Report, quantifiable effects are characterized in terms of economic impacts, tax revenue
impacts, and media impacts. Economic impacts are conveyed through measures of direct spending, total output, personal
earnings and employment. Tax revenue impacts denote changes in tax revenues, while media impacts value the media
exposure generated from the Team and Ballpark by estimating the total number of impressions and their corresponding
market value.
Each of the measures of economic impact is further described below:
DIRECT SPENDING represents spending generated by Team and Ballpark operations, including:
• Brewers operating expenditures;
• In-Ballpark expenditures by patrons and event personnel on admissions, food and beverage, merchandise, etc.;
• Out-of-Ballpark spending by patrons, visiting teams, and event personnel on hotels, food and beverage, retail,
transportation, entertainment, and other such expenditures; and,
• Other spending specific to Ballpark operations, including sponsorships and advertising, capital improvements and
other such expenditures.
TOTAL OUTPUT represents the total direct, indirect, and induced spending effects generated by the Team and Ballpark.
Indirect spending consists of the re-spending of the initial direct spending, and induced spending effects consists of the
positive changes in spending, employment, earnings, and tax collections generated by personal income associated with the
operations of the Team and Ballpark.. Economic impacts were estimated utilizing multipliers from the IMPLAN system which is
an industry leading resource used by various government entities, universities, and private companies.
PERSONAL EARNINGS represent the wages and salaries earned by employees of businesses impacted by the past 19 years
of operations at the Ballpark.
EMPLOYMENT is expressed in terms of person years of employment and is based on project spending. Person years are
defined as one year of employment, or 2,080 annual hours, and may be full- or part-time.
- 10 -STUDY METHODOLOGY
DIRECT SPENDING ADJUSTMENTS
The ongoing operations of the Team and Ballpark impact the local economy in a variety of ways. As outlined in the following
graphic, GROSS DIRECT SPENDING is generated during construction on materials, supplies, and labor; and annual
operations on tickets, concessions, sponsorships, etc., as well as before and after events at local hotels, restaurants,
retail, and other such establishments.
In order to estimate the incremental economic impact benefits generated to the local economy from these SPENDING
sources, certain ADJUSTMENTS must be made to gross direct spending to reflect the fact that all spending is not likely to
impact the local economy. The following graphic also summarizes the adjustments made to gross direct spending in order
to determine NET NEW DIRECT SPENDING impacting the local economy.
GROSS DIRECT SPENDING
CONSTRUCTION EVENT REVENUES ANCILLARY COMMUNITY SPENDING
Materials Team Operations Advertising Lodging Entertainment
Supplies Ticket Sales Concessions Restaurants Transit
Labor Premium Seating Merchandise Bars Services
Other Sponsorship Other Retail Other
SPENDING ADJUSTMENTS
Adjustments are made for displacement (spending that would have occurred anyway by local
residents) or leakage (spending occurring outside of the local and regional area).
NET NEW DIRECT SPENDING
Represents portion of gross spending that is new to the local and regional area and would not
have occurred without the presence of the Team or Ballpark.
Adjustments must be made to account for the fact that a certain amount of spending associated with the Team and Ballpark
will be made by local residents and, therefore, likely represents money that could already be spent in the economy in
another form. This is called displacement and reduces the overall net new impacts. This type of spending is not considered
net new to the local economy.
Additionally, not all spending associated with the Team and Ballpark takes place in the local economy. A portion of this
spending is likely to occur outside the immediate area. This is called leakage and similarly reduces the overall impact. The
economic impacts presented herein are derived specifically from the net new direct spending associated with the Team
and Ballpark operations.
It should also be noted that estimated economic impacts across the City, County, and State are not additive. For example,
a ballpark attendee from the County who spends money at a restaurant in the City of Milwaukee represents net new
economic impact to the City but not to the County.
- 11 -STUDY METHODOLOGY
MULTIPLIER EFFECTS
Economic impacts associated with the Team and Ballpark operations are further increased through re-spending of the net
new direct spending. The total impact is estimated by applying an economic multiplier to initial direct spending to account
for the total economic impact. The total output multiplier is used to estimate the aggregate total spending that takes place
beginning with the direct spending and continuing through each successive round of re-spending.
Successive rounds of re-spending are generally discussed in terms of their indirect and induced effects on the surrounding
economy, as illustrated below.
NEW NET DIRECT SPENDING
INDIRECT SPENDING
INDUCED SPENDING
• Capital Projects / • Food & Merchandise • Business Services
Construction Spending Wholesaler • Household Spending
• Event Revenues • Transport Company • Governmental Spending
• Ancillary Community • Manufacturers • All Other Economic Sectors
Spending • Energy/Utilities
• Team-Related Spending • Numerous Other Industries
INDIRECT EFFECTS consist of the re-spending of the initial or direct net new expenditures. These indirect impacts extend
further as the dollars constituting the direct expenditures continue to change hands. This process, in principle, could
continue indefinitely. However, recipients of these expenditures may spend all or part of it on goods and services outside
the market area, put part of these earnings into savings, or use them to pay taxes. This spending halts the process of
subsequent expenditure flows and does not generate additional spending or impact within the community after a period of
time. This progression is termed leakage and reduces the overall economic impact. Indirect impacts occur in a number of
areas including the following:
• wholesale industry as purchases of food and merchandise products are made;
• transportation industry as the products are shipped from purchaser to buyer;
• manufacturing industry as products used to service the Ballpark, Team, vendors, and others are produced;
• utility industry as the power to produce goods and services is consumed; and,
• other such industries.
INDUCED EFFECTS consist of the positive changes in spending, employment, earnings and tax collections generated by
personal income associated with the operations of the Team and Ballpark. Specifically, as the economic impact process
continues, wages and salaries are earned, increased employment and population are generated, and spending occurs in
virtually all business, household and governmental sectors. This represents the induced spending impacts generated by
direct expenditures.
The appropriate multipliers to be used are dependent upon certain regional characteristics and also the nature of the
expenditure. An area that is capable of producing a wide range of goods and services within its border will have high
multipliers, resulting from an existing positive correlation between the self-sufficiency of an area’s economy and the higher
probability of re-spending occurring within the region. If a high proportion of the expenditures must be imported from
another geographical region, lower multipliers will result.
- 12 -STUDY METHODOLOGY
IMPLAN ECONOMIC MULTIPLIERS
The multiplier estimates used in this analysis are based on the IMPLAN system. IMPLAN, which stands for Impact Analyses
and Planning, is a computer software package that consists of procedures for estimating local input-output models and
associated databases. Input-output models are a technique for quantifying interactions between firms, industries and
social institutions within a local economy.
IMPLAN was originally developed by the U.S. Forest Service in cooperation with the Federal Emergency Management
Agency and the U.S. Department of the Interior’s Bureau of Land Management to assist in land and resource management
planning. Since 1993, the IMPLAN system has been developed under exclusive rights by the Minnesota Implan Group, Inc.,
which licenses and distributes the software to users. Currently, there are hundreds of licensed users in the United States
including universities, government and private companies.
The economic data for IMPLAN comes from the system of national accounts for the United States based on data collected by
the U.S. Department of Commerce, the U.S. Bureau of Labor Statistics, and other federal and state government agencies.
Data are collected for 440 distinct producing industry sectors of the national economy corresponding to the Standard
Industrial Categories (SICs). The IMPLAN multipliers specific to the Team and Ballpark are detailed in the following table.
IMPLAN ECONOMIC MULTIPLIERS
Milwaukee County
Total Output Employment Personal Earnings
Industry
Multiplier Multiplier Multiplier
Construction 1.41 9.83 0.60
Commercial Sports 1.55 10.13 0.93
Lodging 1.45 12.31 0.51
Food and Beverage 1.59 31.32 0.94
Retail 1.64 29.55 0.74
Entertainment 1.53 19.46 0.49
Transportation 1.35 12.27 0.53
Office 1.31 6.71 0.42
Other 1.73 36.61 1.00
Note: Total Output and Personal Earnings multipliers are applied one-to-one to dollars, whereas Employment multipliers are
applied one-to-one to millions of dollars.
As an example, say John attends a Brewers home game. Before the game, John goes to dinner at a restaurant in downtown
Milwaukee. John’s spending at the restaurant is defined as direct spending. The restaurant John eats at uses that money
(and the money spent by those similar to John) to purchase meat, produce and other supplies from a local supplier. The
restaurant's spending is defined as indirect spending. The local supplier uses the money spent by the restaurant to pay its
employees, who then turn around and spend money in the local area on goods and services. The spending by the suppliers
employees is defined as induced spending.
Thus, if John had spent $1.00 directly at the restaurant, that $1.00 is then multiplied by 1.59 to arrive at $1.59 of Total Output.
In other words, $1.00 of Direct Spending on food and beverage generates an additional 59 cents of re-spend in Milwaukee
County.
- 13 -STUDY METHODOLOGY
TAX REVENUE IMPACTS
In addition to the economic impacts generated by the Team and Ballpark throughout the local market area, the public sector
also benefits from increased tax revenues. In preparing estimates of tax revenue impacts, total tax revenues attributable
to the direct spending generated by the Team and Ballpark were estimated. In addition, estimates of the effect of total
output and earnings on the tax collections have been estimated. Tax revenues are based on the current applicable tax rates.
Future changes in these rates would have an impact on the resulting tax collections. The sources of tax revenue focused
on in this report are outlined below:
STATE OF WISCONSIN (1)
• Sales Tax – 5.00 percent
• Player Income Tax – 7.65 percent
• Visiting Team Income Tax – 6.27 percent
• Other Team & Ballpark Income Tax – 7.65 percent
• Non-Team Personal Income Tax – 6.27 percent
(1) Income tax rates shown reflect rate on the highest tax bracket, where applicable.
MILWAUKEE COUNTY
• Sales Tax – 0.56 percent (2)
• Food & Beverage Tax – 0.50 percent
• Hotel Tax – 2.50 percent
• Rental Car Tax – 10.00 percent
(2) Approximately $605 million has been generated from the five county sales tax
surcharge (one tenth of one percent) since the tax was implemented.
CITY OF MILWAUKEE
• Food & Beverage Tax – 0.50 percent
• Hotel Tax – 9.50 percent
• Rental Car Tax – 10.00 percent
- 14 -STUDY METHODOLOGY
MEDIA IMPACTS
Along with the economic and tax revenue benefits generated by the Team and Ballpark, the City, County, and State also
benefit from the media exposure generated from Brewers games and other Ballpark events. In preparing estimates of
added media value, the total number of impressions and their corresponding market value were estimated. Impressions
are generated through the following mediums:
TV; Internet;
Radio; Social media; and,
Print (newspapers, magazines, flyers, etc.); Media buy.
PRIMARY DATA COLLECTION
As a means of quantifying the benefits of the last 19 years of operations at the Ballpark, CSL’s study methodology relies on
primary, on-site data collection. To gather information regarding visitor spending by fans attending events at the Ballpark,
CSL conducted on-site surveys at Brewers home games during the 2019 season. Surveys were collected and analyzed to
determine the economic impact of ballpark visitors to the three regions under study.
- 15 -DEVELOPMENT OF ASSUMPTIONS
DEVELOPMENT OF
ASSUMPTIONS
- 16 -DEVELOPMENT OF ASSUMPTIONS
OVERVIEW
In addition to reviewing historical Team and Ballpark data and operations, CSL’s study methodology relies on primary
data collected and analyzed to determine the economic impact of the Team and the Ballpark on the City, County, and
State. Random, on-site surveys were conducted with attendees at Brewers home games in order to capture information
regarding visitor spending by fans attending events at the Ballpark during the 2019 season. This surveying was conducted in
order to understand the full extent of out-of-town visitation and spending, and are representative of the various opponents
the Brewers play throughout the season.
CSL, with the assistance of Brewers representatives, developed surveys that were administered to patrons in order to
analyze Brewers game attendance and spending characteristics of game attendees. Survey questions addressed the
following topics:
• Place of residence; • Location of out-of-Ballpark spending;
• Overnight stays; • Alternate use of money spent at Brewers games;
• Number of patrons per party; • Primary trip purpose; and,
• Out-of-Ballpark expenditures; • Other information.
Individuals participating in the surveys were randomly selected by members of the CSL research team at various locations,
including in the parking lots, areas outside the Ballpark, and inside the Ballpark. The intercept process was strategically
randomized to ensure that a representative cross-section of Brewers game attendees were sampled for the study.
- 17 -DEVELOPMENT OF ASSUMPTIONS
PLACE OF RESIDENCE
Located approximately five miles west of downtown Milwaukee, the Ballpark draws spectators and baseball fans from
throughout the country to Wisconsin, where they attend Brewers home games and events held at the Ballpark. A critical
element in quantifying the benefits of the annual operations of the Ballpark to the City, County, and State is determining the
net new spending imported into the area. To this end, historical Brewers attendance data was utilized to indicate primary
place of residence, in order to determine the geographic origin of those attending Brewers games. Attendee origins were
grouped into the following four categories:
1. CITY OF MILWAUKEE ATTENDEES 3. WISCONSIN, NON-COUNTY ATTENDEES
(“City Attendees”) (“State Attendees”)
2. MILWAUKEE COUNTY, NON-CITY ATTENDEES 4. OUT-OF-STATE ATTENDEES
(“County Attendees”)
The following chart summarizes place of residence among past Brewers attendees.
PLACE OF RESIDENCE
Out-of-State City of
Attendees Milwaukee
14% Attendees
22%
Milwaukee
County
(Non-City)
State of Wisconsin Attendees
(Non-Milwaukee 16%
County) Attendees
48%
Among past Brewers attendees, 14 percent were Out-of-State Attendees, 48 percent were attendees outside of Milwaukee
County but in Wisconsin, 16 percent were County attendees, and 22 percent were City Attendees.
Throughout the Report, unique attendee expenditure and behavioral characteristics are summarized based on attendee
geographical origin.
- 18 -DEVELOPMENT OF ASSUMPTIONS
OVERNIGHT STAYS
Visitors originating from outside the County were asked to indicate whether they were staying overnight in a hotel or other
type of lodging in conjunction with their game attendance. The following chart presents a summary of the percent of non-
local patrons staying overnight in conjunction with their game attendance.
OVERNIGHT STAY RATE
State Attendees 6% 94%
Out-of-State Attendees 41% 59%
Total 12% 88%
Yes No
The majority of patrons do not stay overnight in conjunction with their Brewers game attendance. Specifically, six percent
of State Attendees and 41 percent of Out-of-State Attendees stay overnight.
Among the patrons who stay overnight, respondents were shown the following map and asked to classify the location of
their lodging into one of three categories including: City of Milwaukee, Milwaukee County, and State of Wisconsin.
- 19 -DEVELOPMENT OF ASSUMPTIONS
OVERNIGHT STAYS (CONT’D)
The chart below presents an overview of the location of the hotel or other type of lodging for those attendees staying
overnight when attending games.
LOCATION OF OVERNIGHT LODGING
State Attendees 89% 5% 6%
Out-of-State Attendees 74% 12% 14%
Total 75% 12% 13%
City of Milwaukee Milwaukee County Wisconsin
Note: location of hotel/short-term rental asked only of State Attendees and Out-of-State Attendees.
As shown, approximately 75 percent of overnight patrons stay in a lodging facility within the City of Milwaukee, while 87
percent stay within Milwaukee County (12 percent of spending occurs within the County, but outside the City) and 100
percent stay within the State of Wisconsin (13 percent of spending occurs within the State, but outside the County and City).
Visitors who indicated they were staying overnight in conjunction with their attendance at the Brewers game were asked to
indicate the total number of nights they planned to stay. The following table presents a summary of their responses:
LENGTH OF OVERNIGHT STAY
State Out-of-State
# Nights Total
Attendees Attendees
1 night 84% 49% 69%
2 nights 15% 7% 13%
3 nights 1% 21% 8%
More than 3 nights 0% 23% 9%
AVERAGE # NIGHTS 1.3 2.2 1.9
MEDIAN # NIGHTS 1.0 1.0 1.0
Note: Number of nights in overnight stay asked only of State Attendees and Out-of-State Attendees.
Overall, respondents indicated an average stay of 1.9 nights, with State Attendees staying an average of 1.3 nights and Out-
of-State Attendees staying an average of 2.2 nights.
- 20 -DEVELOPMENT OF ASSUMPTIONS
NUMBER OF PATRONS PER PARTY
All respondents were asked to indicate the number of people for which they will pay expenses related to travel and
attendance at the game. The table below presents a summary of their response:
TRAVELING PARTY SIZE
City County State Out-of-State
# People
Attendees Attendees Attendees Attendees
1 person (myself only) 54% 44% 42% 51%
2 people 26% 36% 32% 29%
3 people 11% 9% 7% 6%
4 people 5% 7% 12% 8%
5 people 0% 2% 3% 0%
6 people 3% 2% 1% 2%
7 people 0% 0% 0% 2%
8 people 0% 0% 0% 0%
More than 8 people 1% 0% 1% 2%
AVERAGE # PEOPLE 1.8 2.0 2.2 1.8
MEDIAN # PEOPLE 1.0 2.0 2.0 2.0
As shown, the average number of people per traveling party was two.
- 21 -DEVELOPMENT OF ASSUMPTIONS
OUT-OF-BALLPARK EXPENDITURES
All survey respondents were asked to estimate the amount they spent before and after the game outside of the Ballpark, but
in conjunction with their attendance at the game (not including the amount of money they spent inside the Ballpark). Overall,
36 percent of survey respondents indicated that they spent money outside the Ballpark, with 39 percent of City Attendees,
45 percent of County Attendees, 31 percent of State Attendees, and 44 percent of Out-of-State Attendees indicating they
spent money outside of the Ballpark.
Respondents were also asked to break down their out-of-Ballpark spending into specific categories including hotel/lodging,
rental car, other types of transportation (such as taxi, rideshare, etc.), food and beverage, shopping/retail, entertainment,
and other spending (such as tips for valet, service staff, etc.).
The table below presents a detailed breakdown of out-of-Ballpark spending that occurred by survey respondents in
conjunction with their attendance at the Brewers game. It should be noted that the dollar figures presented below are
inclusive of all members of the traveling party during their entire stay (an average of two people per party, varying by
attendee origin).
AVERAGE OUT-OF-BALLPARK SPENDING PER PARTY
City County State Out-of-State
Category
Attendees Attendees Attendees Attendees
Hotel Lodging $0.00 $0.00 $4.79 $78.01
Rental Car $0.00 $0.00 $0.00 $41.34
Other Transportation $3.54 $1.17 $1.58 $6.53
Food / Beverage $6.57 $20.17 $10.89 $79.66
Shopping / Retail $1.40 $1.03 $5.81 $20.18
Entertainment $0.14 $0.31 $1.87 $22.02
Other $0.05 $0.15 $1.14 $4.06
TOTAL SPENDING PER PARTY $11.70 $22.83 $26.08 $251.81
TOTAL SPENDING PER PERSON $6.39 $11.71 $12.00 $142.75
All spending figures include those indicating zero for a specific category.
As shown, City Attendees spent approximately $11.70 per party ($6.39 per person) outside of the Ballpark, while County
Attendees spent approximately $22.83 per party ($11.71 per person), State Attendees spent approximately $26.08 per party
($12.00 per person), and Out-of-State Attendees spent approximately $251.81 per party ($142.75 per person).
- 22 -DEVELOPMENT OF ASSUMPTIONS
LOCATION OF OUT-OF-BALLPARK SPENDING
Those survey respondents who indicated they spent money outside of the Ballpark in conjunction with their attendance at
the Brewers game were asked to estimate the percent of their spending that occurred within the City, County, and State.
The chart below presents an overview of the geographic areas within which survey respondents spent money outside of
the Ballpark.
LOCATION OF OUT-OF-BALLPARK SPENDING
Hotel Lodging 75% 11% 13% 100%
Rental Car 94% 6% 100%
Other Transportation 71% 13% 14% 99%
Food / Beverage 56% 17% 26% 99%
Shopping / Retail 53% 16% 28% 97%
2%
Entertainment 87% 11% 99%
2%
Other 96% 1% 99%
City of Milwaukee Milwaukee County State of Wisconsin (Outside of County)
On average across all spending categories, 76 percent of out-of-Ballpark spending occurred within the City of Milwaukee,
86 percent occurred within Milwaukee County (10 percent within the County but outside the City), and 99 percent occurred
in Wisconsin (13 percent within the State but outside the County and City), while the remaining one percent of expenditures
occurred outside of the State.
- 23 -DEVELOPMENT OF ASSUMPTIONS
ALTERNATE USE OF MONEY SPENT
AT BREWERS GAMES
Respondents were asked to indicate what they likely would have done with the money spent outside of the Ballpark had they
not attended the Brewers game. The chart below presents a summary of whether respondents would have saved, invested
or spent the money; and if they would have spent it, where the spending would have occurred.
ALTERNATE USE OF MONEY SPENT
Spend it in
Milwaukee County 43%
7% would have
still occurred
Spend it in
the City of
Milwaukee
15%
Saved /
invested it
48%
Spend it in
Wisconsin
21%
Spend it
outside
57% Wisconsin
of spending would 9%
not have otherwise
occurred
As shown, 57 percent of fan spending would not have occurred in the region without the existence of the Team and Ballpark,
with 48 percent of survey respondents indicating they would have saved or invested the amount spent in conjunction with
attending the Brewers game and nine percent indicating they would have spent that money outside of the State of Wisconsin.
Approximately 43 percent of spending would have occurred in Wisconsin, with seven percent displaced from the City and
15 percent displaced from the County.
The approximate 43 percent of spending that would have occurred in the City, County, or State regardless of the presence
of the Brewers playing at the Ballpark is not considered net new, and thus, is not factored when calculating the net new
economic and tax revenue impacts to the City, County, and State from the Brewers at the Ballpark.
- 24 -DEVELOPMENT OF ASSUMPTIONS
PRIMARY TRIP PURPOSE
In order to understand whether attending a Brewers game was the primary trip purpose for attendees, survey respondents
were asked to indicate their primary reason(s) for being in the City on the day they attended the Brewers game. The chart
below provides an overview of the primary purpose behind visiting Milwaukee.
PRIMARY TRIP PURPOSE
Attend the baseball game 95%
Visit family/friends 7%
Special occasion 5%
Business trip 2%
Vacation 2%
OtherECONOMIC & FISCAL IMPACT ANALYSIS
QUANTITATIVE ECONOMIC
& TAX REVENUE IMPACT
ANALYSIS
- 26 -ECONOMIC & TA X REVENUE IMPACT ANALYSIS
INTRODUCTION
The focus of this analysis is to estimate the impacts generated from the operations of the Team and Ballpark. The following
key issues have been addressed in this section:
Construction Period Impacts; Annual Operations Impacts; and, Tax Revenue Impacts.
The findings and analysis in this study are derived from historical operating data provided by the Brewers, the results of
random patron-intercept surveys conducted at Brewers home games, industry data, the use of IMPLAN multipliers, and
CSL’s experience in quantifying the economic and tax revenue impacts of similar entities. The results presented are for the
construction period (1999 to 2001) and cumulative 19-year operations impacts (2001 to 2019).
KEY ASSUMPTIONS
The following is a list of key data points and assumptions used in order to estimate the economic and tax revenue impacts
associated with the construction and operations of the Team and Ballpark:
• Ballpark project costs totaled approximately $392 million throughout the construction phase from 1999 to 2001.
• Additional construction, maintenance, repair, and other such capital expenses from the Brewers have totaled
approximately $106.8 million from 2001 to 2019.
• The Ballpark hosts 81 regular season Brewers home games each year, as well as a variety of third-party events,
including concerts.
• Paid attendance for Brewers games and other Ballpark events has averaged approximately 2.7 million annually since
2001 (3.1 million in the last two seasons).
• Intercept survey data collected from Brewers home games is representative of annual Brewers attendance.
• Based on historical ticket data, 78 percent of attendees are estimated to live outside the City of Milwaukee, 62 percent
outside Milwaukee County, and 14 percent outside the State of Wisconsin.
• Spending by visitors for events at the Ballpark consists of in-Ballpark spending on tickets, concessions, merchandise,
and parking, as well as out-of-Ballpark spending on hotels, restaurants, shopping, gas, transit, entertainment,
services, and other such expenditures. In 2019, based on the results of the intercept survey, per capita out-of-Ballpark
spending by visitors is estimated to total the following:
o City Residents: $6.50 o In-State Overnighters: $87.00
o County Residents: $11.50 o Out-of-State Day Trippers: $5.00
o In-State Day Trippers: $8.50 o Out-of-State Overnighters: $237.00
- 27 -ECONOMIC & TA X REVENUE IMPACT ANALYSIS
ECONOMIC IMPACTS
The following table summarizes the net new economic impacts generated to the State, County, and City by the initial
construction and ongoing annual operations of the Team and Ballpark. Also shown are the cumulative net new construction
and operations impacts for the 21-year period from 1999 to 2019. It should be noted that annual impacts are summarized
with the 2019 fiscal year representing the most recent year with complete actual operating data. It should also be noted
that estimated economic impacts across the City, County, and State are not additive. For example, a ballpark attendee from
the County who spends money at a restaurant in the City of Milwaukee represents net new economic impact to the City but
not to the County.
ECONOMIC IMPACT SUMMARY
TEAM & BALLPARK
CUMULATIVE NET NEW CONSTRUCTION IMPACTS (1999-2001)
State County City
Direct Spending $318,377,000 $218,259,000 $160,190,000
Total Output $448,189,000 $307,249,000 $225,504,000
Jobs (FTEs) 3,130 2,150 1,570
Earnings $190,701,000 $130,732,000 $95,950,000
NET NEW ANNUAL OPERATIONS IMPACTS (2019)
State County City
Direct Spending $99,436,000 $144,761,000 $149,252,000
Total Output $152,458,000 $222,245,000 $229,248,000
Jobs (FTEs) 1,835 2,590 2,630
Earnings $72,684,000 $105,942,000 $109,415,000
CUMULATIVE NET NEW CONSTRUCTION & 19-YEAR OPERATIONS IMPACTS
State County City
Direct Spending $1,646,700,000 $2,148,200,000 $2,110,500,000
Total Output (1) $2,479,600,000 $3,267,000,000 $3,218,800,000
Jobs (FTEs) (2)
n/a n/a n/a
Earnings $1,163,700,000 $1,554,200,000 $1,538,463,530
Note: Economic impacts are not additive across State, County, and City.
(1) Total Output is the sum of Direct, Indirect, and Induced Spending.
(2) Jobs do not accumulate over the time period studied herein.
- 28 -You can also read