Intelligence Commanders Group - Major Cities Chiefs Association - MCCA Report on the 2020 Protests and Civil Unrest - Major ...
←
→
Page content transcription
If your browser does not render page correctly, please read the page content below

Major Cities Chiefs Association
                  Intelligence Commanders Group

                 Line Length Represents the
          Number of Protests in Each City/County

MCCA Report on the 2020 Protests and Civil Unrest
                                                          1 2020
                                                      October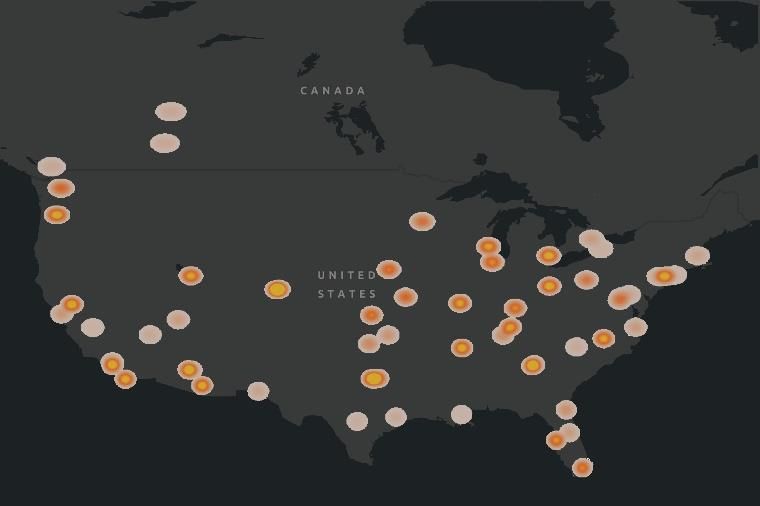
REPORT ON THE 2020 PROTESTS
            AND CIVIL UNREST
                                        October 2020

The Major Cities Chiefs Association (MCCA) is a professional organization of police executives representing
the largest cities in the United States and Canada. The MCCA provides a unique forum for urban chiefs,
sheriffs and other law enforcement executives to share ideas, experiences and strategies. MCCA provides a
collaborative forum for the advancement of public safety through innovation, research, policy development,
government engagement, community outreach, and leadership development. MCCA membership is
comprised of Chiefs and Sheriffs of the sixty-nine largest law enforcement agencies in the United States and
nine largest in Canada. They serve 79.9 million people (65.7 US and 14.2 Canada) with a workforce of 251,082
(222,973 US and 28,110 Canada) officers and non-sworn personnel.

The MCCA Intelligence Commanders Group (ICG) functions as a subset of the MCCA that focuses on law
enforcement intelligence and national security matters. The ICG is comprised of intelligence commanders
from each MCCA agency that represents their organization’s intelligence and/or national security mission.
The group serves as a mechanism for advising the Chiefs and Sheriffs on security matters, exchanging
intelligence between MCCA members, and developing programs for combatting crime and terrorism globally.

  MCCA Report on the 2020 Protests and Civil Unrest
                                                                                                         i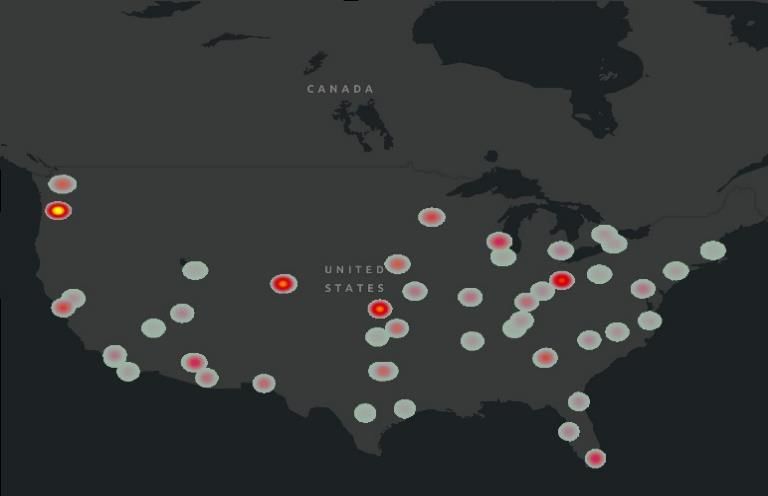
Table of Contents
  Introduction .................................................................................................................................... 1
     Background ..........................................................................................................................................................1
     Scope ....................................................................................................................................................................1
     Methodology ........................................................................................................................................................2
  Overview of Protests in the U.S. and Canada ................................................................................... 3
     Peaceful and Lawful Protests ...............................................................................................................................4
     Peaceful but Unlawful Protests (Civil Disobedience) ...........................................................................................5
     Violent Protests ....................................................................................................................................................7
  An In-Depth Look Into Protest-Related Violence .............................................................................. 9
     Types of Weapons Used .....................................................................................................................................11
     Paid and Out-of-State Protesters .......................................................................................................................13
     Nationwide Coordination ...................................................................................................................................13
     Violent Extremist Ideologies ..............................................................................................................................14
  Protest-Related Arrests.................................................................................................................. 15
  Police Use of Force ......................................................................................................................... 17
     Use of Force Analysis – Nationally .....................................................................................................................17
     Use of CS Gas – By Agency .................................................................................................................................18
     Use of Less Lethal Shotguns – By Agency...........................................................................................................19
     Use of 40MM Launchers – By Agency ................................................................................................................20
     Use of Pepper Balls – By Agency ........................................................................................................................21
     Use of High-Volume Pepper Spray – By Agency.................................................................................................22
  Protester Tactics and Challenges .................................................................................................... 23
     High Trending Protester Tactics .........................................................................................................................23
     Low Trending Tactics ..........................................................................................................................................24
     Challenges with Community Support.................................................................................................................25
     Challenges with Elected Officials and Federal Partners .....................................................................................26
     Challenges with Officer Morale..........................................................................................................................26
     Challenges with Planning for Protests ...............................................................................................................27
     Challenges with Overtime Costs ........................................................................................................................28
  Looking Ahead ............................................................................................................................... 29
     Possible Areas of Improvement .........................................................................................................................30
     The Use of Curfews and Weapons Ordinances ..................................................................................................31
  Conclusion ..................................................................................................................................... 32
  Acknowledgments ......................................................................................................................... 33
  Appendix A – Agencies that Participated in the Survey .................................................................. 34
  Appendix B – Agencies that Participated in the After Action Review .............................................. 35

MCCA Report on the 2020 Protests and Civil Unrest
                                                                                                                                                                              ii
List of Figures
FIGURE 1 - GENERAL STATISTICS ON ALL PROTESTS.................................................................................... 3
FIGURE 2 - PERCENTAGES OF AGENCIES THAT EXPERIENCED PROTESTS, CIVIL DISOBEDIENCE, AND VIOLENCE ......... 4
FIGURE 3 - GENERAL STATISTICS ON PROTESTS THAT INVOLVED SOME LEVEL OF CIVIL DISOBEDIENCE ................... 5
FIGURE 4 - PERCENTAGE OF PROTESTS THAT INVOLVED SOME LEVEL OF CIVIL DISOBEDIENCE BY LOCATION AND IN
TOTAL...................................................................................................................................... 6
FIGURE 5 - GENERAL STATISTICS ON PROTESTS THAT INVOLVED SOME LEVEL OF VIOLENCE................................. 7
FIGURE 6 - PERCENTAGE OF PROTESTS THAT INVOLVED SOME LEVEL OF VIOLENCE BY LOCATION AND IN TOTAL ...... 8
FIGURE 7 - PERCENTAGE OF AGENCIES THAT EXPERIENCED LOOTING, ARSON, AND RIOTING ............................... 9
FIGURE 8 - TOTAL NUMBER OF ACTS OF LOOTING, ARSON, AND ATTACKS ON POLICE ..................................... 10
FIGURE 9 - PERCENTAGE OF AGENCIES THAT EXPERIENCED VARIOUS WEAPONS USED BY PROTESTERS................ 11
FIGURE 10 - PERCENTAGE OF AGENCIES THAT HAD OUT-OF-STATE AND PAID PROTESTERS PARTICIPATE IN PROTESTS
............................................................................................................................................ 13
FIGURE 11 - PERCENTAGE OF AGENCIES THAT HAD FAR LEFT OR RIGHT VIOLENT EXTREMISTS INVOLVED IN PROTESTS
............................................................................................................................................ 14
FIGURE 12 - GENERAL STATISTICS FOR ALL PROTEST-RELATED ARRESTS ....................................................... 15
FIGURE 13 - LEVEL OF PROTEST-RELATED CASES DISMISSED BY DISTRICT ATTORNEYS AND NUMBER OF RE-ARRESTS
............................................................................................................................................ 16
FIGURE 14 - GENERAL STATISTICS ON POLICE USE OF FORCE, COMPARED TO THE PROPORTION OF ALL PROTESTS 17
FIGURE 15 - LEVEL OF PUBLIC TRUST AND POLICE COMMUNITY RELATIONS .................................................. 25
FIGURE 16 - LEVEL OF SUPPORT FROM ELECTED OFFICIALS AND EFFECTIVENESS OF COMMUNICATION WITH FEDERAL
PARTNERS .............................................................................................................................. 26
FIGURE 17 - LEVEL OF OFFICER MORALE ............................................................................................... 26
FIGURE 18 - RANKING OF THE MOST SIGNIFICANT CHALLENGES IN HANDLING PROTEST-RELATED INCIDENTS ....... 27
FIGURE 19 - PERCENTAGE OF AGENCIES THAT INCURRED OVERTIME COSTS .................................................. 28
FIGURE 20 - PERCENTAGES OF AGENCIES STILL EXPERIENCING PROTESTS AND EXPECTING MORE PROTEST-RELATED
VIOLENCE ............................................................................................................................... 29
FIGURE 21 - RANKED PRIORITIES FOR IMPROVING POLICE RESPONSE TO PROTEST-RELATED INCIDENTS .............. 30
FIGURE 22 - EXAMPLES OF WEAPONS AND PROHIBITED ITEMS BROUGHT TO PROTESTS IN 2020 ...................... 31
MCCA Report on the 2020 Protests and Civil Unrest
iiiList of Tables
TABLE 1 - PERCENTAGE OF TOTAL PROTESTS THAT INVOLVED SOME LEVEL OF CIVIL DISOBEDIENCE BY CITY ........... 6
TABLE 2 - PERCENTAGE OF TOTAL PROTESTS THAT INVOLVED SOME LEVEL OF VIOLENCE BY CITY ......................... 8
TABLE 3 - PERCENTAGE OF CS GAS USED IN COMPARISON TO THE PERCENTAGE OF VIOLENT EVENTS BY AGENCY . 18
TABLE 4 - PERCENTAGE OF LESS LETHAL SHOTGUNS USED IN COMPARISON TO THE PERCENTAGE OF VIOLENT EVENTS
BY AGENCY ............................................................................................................................. 19
TABLE 5 - PERCENTAGE OF 40MM LAUNCHERS USED IN COMPARISON TO THE PERCENTAGE OF VIOLENT EVENTS BY
AGENCY ................................................................................................................................. 20
TABLE 6 - PERCENTAGE OF PEPPER BALLS USED IN COMPARISON TO THE PERCENTAGE OF CIVIL DISOBEDIENCE
EVENTS BY AGENCY .................................................................................................................. 21
TABLE 7 - PERCENTAGE OF HIGH-VOLUME PEPPER SPRAY USED IN COMPARISON TO THE PERCENTAGE OF CIVIL
DISOBEDIENCE EVENTS .............................................................................................................. 22
MCCA Report on the 2020 Protests and Civil Unrest
ivINTRODUCTION
Background
On May 26th, 2020, protests erupted in Minneapolis, Minnesota as a result of the in-custody
death of George Floyd. Video footage of the catalytic event quickly went viral, garnering
widespread media attention and calls for condemnation of the involved officers. An
unprecedented wave of protests and civil unrest began flowing across the U.S. and Canada in
the days and months that followed. In total, there were 8,700 protests that took place in most
major cities between May 25th and July 31st, 2020. While the vast majority of these protests
were peaceful, a large portion did include non-violent acts of civil disobedience such as the
takeover of a roadway or disruption of commerce. Additionally, there were 574 protests that
involved acts of violence, some of which were severe. This violence was limited to only 7% of all
protests and in most cases, the acts were perpetrated by individuals or small groups that
infiltrated the larger protests. Nonetheless, the sheer volume of protests, combined with the
level of civil disobedience and existence of some ultra-violent events, created an extraordinarily
challenging environment for law enforcement agencies. This report examines the 2020 protests
and civil unrest that occurred, and it presents a comprehensive perspective into the law
enforcement challenges and lessons learned in 68 of the largest cities in the U.S. and Canada.
Scope
The scope of this report is limited to the experience and perspectives of law enforcement
agencies from the Major Cities Chiefs Association (MCCA). While not comprehensive of all law
enforcement, the MCCA represents 78 of the largest police agencies in the U.S. and Canada.
These agencies service 79.9 million people and comprise a workforce of 251,082 police officers
and non-commissioned personnel. MCCA members also represent the majority of cities that
experienced protests and civil unrest in 2020.
This report is also primarily based on a law enforcement account of the protests that occurred
within each jurisdiction. The data collected and presented does not include information from
open sources or the general public. The data is also limited to the protests and civil unrest that
occurred in MCCA member cities between May 25th and July 31st of 2020.
For the purpose of this report, “protest” is used as an umbrella term that includes
demonstrations or public assemblies that involve 1) lawful and peaceful, 2) unlawful but non-
violent (i.e. civil disobedience), and 3) violent protest-related activities. The first category of
lawful and peaceful is exclusive to protests that did not involve any acts of civil disobedience or
violence. However, the latter two categories are not mutually exclusive and instead involve
some overlap. For example, while civil disobedience is based on unlawful but non-violent acts,
there were some events where a portion of the protest involved some level of civil
disobedience and another portion that involved some level of violence. Additionally, there were
MCCA Report on the 2020 Protests and Civil Unrest
1some protests that involved a sudden or constant transition between these two types of
activity.
Methodology
This report was developed by the MCCA Intelligence Commanders Group (ICG), which functions
as a subset of the MCCA Homeland Security Committee. The ICG is comprised of intelligence
commanders from each MCCA agency and this network of representatives established the
following three datasets that were used for this report:
▪ Surveys: The first and most significant set of data was developed by surveying MCCA
member agencies. The five-page survey included qualitative and quantitative questions
about the protest-related events, violence, and the law enforcement response that
occurred in each jurisdiction. A total of 68 of 78 MCCA agencies responded to this
survey.
▪ Facilitated Discussion: The second dataset used for this report is based on ICG meetings
in Washington, D.C. and Dallas, Texas, where MCCA agencies participated in an after-
action review of the 2020 protests and civil unrest. There were 44 MCCA agencies
represented in the meetings, which also included a virtual component for those that
could not travel to the host cities. This after-action review was based on a facilitated
conversation where the representatives provided a briefing on the protests and civil
unrest they experienced in their city. The review also included a question and answer
period, as well as polling to help identify protest-related trends across jurisdictions.
▪ After Action Reports: The final dataset used for this report is based on a small number
of after-action reports that individual law enforcement agencies produced regarding the
2020 protest and civil unrest. Most MCCA agencies had not yet produced or published
an after-action report during the research phase of this project and therefore, the
number of after-action reports that were available was limited. However, these reports
did provide some additional context and helped confirm what was identified via the
surveys and facilitated discussion.
MCCA Report on the 2020 Protests and Civil Unrest
2OVERVIEW OF PROTESTS IN THE U.S. AND CANADA
There were approximately 8,700 protests that took place in 68 major cities and counties
between May 25th and July 31st, 2020.1 The largest numbers of protests in a single jurisdiction
were reported in Los Angeles County and New York City, each with over a thousand events. El
Paso and Honolulu reported the smallest number of protests, each with only eight during this
time. The largest crowd size for a single protest was in Houston, where one event was
estimated to involve 60,000 protesters. Several other cities, including Los Angeles, New York,
Seattle, Chicago, Boston, Tulsa, Wichita, and Edmonton also experienced protests with
extraordinarily large crowds, ranging from 15,000 to 50,000 in a single event. The largest crowd
size for the remaining cities ranged from 100 to 12,000, with most cities experiencing at least
one event that involved 3,000 or more protesters.
8,700 TOTAL PROTEST EVENTS
From May 25th to July 31st, 2020
1,100 128 60K 284
Largest Number Average Number Largest Crowd Average Crowd
of Protests in a of Protests in a Size at a Single Size at a Single
Single City Single City Protest Protest
Figure 1 - General Statistics on All Protests
1
While the group of 68 participating agencies represents a large portion of U.S. and Canadian law enforcement, it
is not comprehensive and as such, the figure of 8,700 is likely less than the actual total number of protests that
took place in the two countries.
MCCA Report on the 2020 Protests and Civil Unrest
3While the majority of protests were lawful and peaceful, 94% of major city law enforcement
agencies (64 out of 68) experienced at least one protest that involved unlawful but non-violent
acts of civil disobedience (e.g. illegal takeover of a public roadway). Also, 79% of agencies (54
out of 68) experienced at least one protest that involved some level of violence.2 The following
section offers a more in-depth analysis of each type of protest: events that were entirely
peaceful and lawful, events that were peaceful but unlawful (i.e. civil disobedience), and events
that involved some level of violence. It is important to note the latter two categories are not
mutually exclusive. For example, some agencies may have had a protest event that included
both a peaceful but unlawful component, as well as a violent component. As such, the data
presented in this report includes some overlap between the number of protests that were
categorized as having some level of civil disobedience, violence or both.
Percentages of Agencies that Experienced Protests and Civil Unrest in 2020
Percentage of agencies that Percentage of agencies that Percentage of agencies that
experienced protests in experienced protests with experienced protests with
general unlawful but non-violent acts acts of violence
of civil disobedience
Figure 2 - Percentages of Agencies that Experienced Protests, Civil Disobedience, and Violence
Peaceful and Lawful Protests
Of the 8,700 reported protests, approximately 4,434 (51%) were both peaceful and lawful.3 This
latter condition of lawfulness is important as it differentiates between these events and the
peaceful but illegal protests that involved non-violent acts of civil disobedience. Although any
form of peace is much better than violence, there is still a negative effect and challenge that
accompanies a law enforcement agency’s response to protesters that illegally block traffic or
passively disrupt commerce. Fortunately, these types of peaceful but unlawful protests were
limited to less than half of all events and entirely absent in at least three major cities.4
2
The term “some of level of violence” was broadly defined to include any protest event that involved physical
violence against law enforcement and/or the general public to include acts or rioting, looting, arson, and civil
unrest.
3
The remaining 4,266 protests were comprised of civil disobedience and/or violent events. Although civil
disobedience was defined as unlawful but non-violent, there were some agencies that reported protests that
included both a component of civil disobedience and violence simultaneously, or a constant transition between
the two types of activities.
4
Baltimore County, Prince George’s County, and Ottawa reported that all their protests were peaceful and lawful.
MCCA Report on the 2020 Protests and Civil Unrest
4Peaceful but Unlawful Protests (Civil Disobedience)
The level of civil disobedience that began in late May and continued for many months was
significant and unprecedented for most major city law enforcement agencies. These non-
violent but illegal acts often involved the takeover of a freeway or roadway, blocking traffic, and
refusing to cooperate with lawful orders. In some cities, protesters also disrupted outdoor
dining and entertainment areas by trespassing onto private property, harassing patrons, and
challenging the flow of commerce. Although most of these non-violent acts of civil
disobedience did not result in injury, many still posed a danger to innocent bystanders, as well
as to the individuals engaged in the civil disobedience. For example, in many cities, protesters
entered major highways on foot and began blocking both directions of travel. Innocent
motorists were often trapped by the protest crowd and in some cases, this resulted in
confrontations and violence.
In total, approximately 42% of all protests (3,692 out of 8,700) involved some level of unlawful
but non-violent acts of civil disobedience. The highest number of protests involving civil
disobedience in a single city was 500 and the average was 55.
PROTESTS WITH ACTS OF CIVIL DISOBEDIENCE
3,692 Total number of protests involving illegal
but non-violent acts of civil disobedience
500 Highest number of protests involving illegal
but non-violent acts civil disobedience in a single city
55 Average number of protests involving illegal but
non-violent acts civil disobedience in a single city
45% Average percentage of protests within a
single agency that resulted in unlawful but non-
violent acts of civil disobedience
Figure 3 - General Statistics on Protests that Involved Some Level of Civil Disobedience
MCCA Report on the 2020 Protests and Civil Unrest
5Although the average percentage of protests within a single city that resulted in civil
disobedience was 45%, the amount of civil disobedience varied significantly between cities. On
one hand, there were three agencies that did not report any instances of civil disobedience and
12 who indicated no more than 10% of the protests in their jurisdiction involved civil
disobedience. On the other hand, there were nine major city law enforcement agencies who
encountered civil disobedience in every protest they responded to.5
Total Unlawful but Non-Violent Protests
vs. All Other Protests
Unlawful but
Non-Violent
Protests
42% All Other
Protests
58%
Figure 4 - Percentage of Protests that Involved Some Level of Civil Disobedience by Location and In Total6
Arlington, TX 30.8% Edmonton, AB, CA 10.0% Nashville, TN 29.8% Portland, OR 100.0%
Atlanta, GA 87.0% El Paso, TX 12.5% Miami-Dade, FL 73.9% Prince George's Co. , MD 0.0%
Aurora, CO 91.7% Fairfax Co., VA 38.5% Milwaukee, WI 88.8% Raleigh, NC 93.7%
Baltimore Co., MD 0.0% Fort Worth, TX 23.1% Minneapolis, MN 50.0% Sacramento, CA 100.0%
Baltimore City, MD 10.5% Fresno, CA 3.6% Montgomery Co., MD 17.4% Salt Lake City, UT 91.7%
Boston, MA 13.5% Honolulu, HI 25.0% Nassau Co., NY 76.9% San Antonio, TX 6.1%
Buffalo, NY 7.5% Houston, TX 8.8% New Orleans, LA 2.1% San Diego, CA 100.0%
Calgary, AB, CA 10.0% Indianapolis, IN 88.9% New York, NY 20.5% San Jose, CA 16.7%
Charlotte-Mecklenburg, NC 8.5% Jacksonville, FL 25.0% Newark, NJ 9.5% Seattle, WA 60.0%
Chicago, IL 76.3% Kansas City, MO 59.0% Oakland, CA 20.0% St Louis, MO 88.9%
Cincinnati, OH 6.7% Las Vegas, NV 9.3% Oklahoma City, OK 33.3% Suffolk Co., NY 3.7%
Columbus, OH 100.0% Long Beach, CA 82.0% Omaha, NE 67.6% Tampa, FL 81.7%
Dallas, TX 70.7% Los Angeles Co., CA 6.5% Orlando, FL 16.7% Tucson, AZ 100.0%
Washington, DC N/A Los Angeles City, CA 27.4% Ottawa, ON, CA 0.0% Tulsa, OK 28.6%
DeKalb Co., GA 46.2% Louisville, KY 75.0% Peel, ON, CA 16.7% Vancouver, BC, CA 10.3%
Denver, CO 100.0% Memphis, TN 100.0% Phoenix, AZ 93.0% Virginia Beach, VA 18.2%
Detroit, MI 100.0% Mesa, AZ 25.0% Pittsburgh, PA 45.3% Wichita, KS 69.8%
Table 1 - Percentage of Total Protests that Involved Some Level of Civil Disobedience by City
5
67 of 68 agencies provided data for this measurement.
6
This graph is designed to highlight the portion of unlawful but non-violent protests compared to the total number
of 8,700 protests. The remaining “all other protests” reflected in this graph includes lawful and peaceful protests,
as well as the protests that involved some level of violence.
MCCA Report on the 2020 Protests and Civil Unrest
6Violent Protests
Despite the fact that the overwhelming majority of the 8,700 protests were either peaceful or
involved non-violent acts of civil disobedience, there were groups and individuals that sought to
exploit the protest environment in many cities and engage in violence. An estimated 7% of the
protests (574 of the 8,700 protests) involved violence.
The malicious actors who took part in this violence were motivated by a wide variety of factors.
Some were driven by extremist anti-government or anti-law enforcement ideologies on both
sides of the political spectrum. Others simply used the protests as cover to engage in criminal
behavior. As seen below, one city alone experienced 100 protests in which acts of violence
occurred. This consistent violence transpired in a span of just 68 days. Each agency also
experienced, on average, nine protests where some level of violence occurred. On average,
10% of all the protests occurring in each city resulted in some level of violence.
PROTESTS WITH ACTS OF VIOLENCE
574 Total number of protests involving acts
of violence
100 Highest number of protests involving
acts of violence in a single city
9 Average number of protests involving acts of
violence in a single city
10% Average percentage of total protests in
a single agency that resulted in acts of violence
Figure 5 - General Statistics on Protests that Involved Some Level of Violence
MCCA Report on the 2020 Protests and Civil Unrest
7Similar to the acts of non-violent civil disobedience that occurred throughout the different
cities, the severity and recurrence of violence varied dramatically between cities. For example,
3 major city law enforcement agencies reported over 60% of their protests involved some level
of violence and there were 16 other agencies that experienced violence in at least 10% of the
protests that took place in their cities. However, there were also 13 agencies that did not report
any instances of violence during protests.7
Violent Protests vs. All Other Protests
7% Violent Protests
All Other
Protests
93%
Figure 6 - Percentage of Protests that Involved Some Level of Violence by Location and in Total8
Arlington, TX 7.7% Edmonton, AB, CA 0.0% Nashville, TN 2.1% Portland, OR 62.5%
Atlanta, GA 3.5% El Paso, TX 12.5% Miami-Dade, FL 26.1% Prince George's Co. , MD 0.0%
Aurora, CO 8.3% Fairfax Co., VA 0.0% Milwaukee, WI 25.4% Raleigh, NC 6.3%
Baltimore Co., MD 0.0% Fort Worth, TX 2.6% Minneapolis, MN 20.0% Sacramento, CA 6.1%
Baltimore City, MD 10.5% Fresno, CA 0.0% Montgomery Co., MD 0.0% Salt Lake City, UT 3.3%
Boston, MA 2.7% Honolulu, HI 0.0% Nassau Co., NY 0.0% San Antonio, TX 2.4%
Buffalo, NY 5.0% Houston, TX 3.8% New Orleans, LA 2.1% San Diego, CA 4.7%
Calgary, AB, CA 0.0% Indianapolis, IN 6.2% New York, NY 4.9% San Jose, CA 8.3%
Charlotte-Mecklenburg, NC 7.6% Jacksonville, FL 7.5% Newark, NJ 0.0% Seattle, WA 16.0%
Chicago, IL 3.8% Kansas City, MO 10.3% Oakland, CA 20.0% St Louis, MO 11.1%
Cincinnati, OH 6.7% Las Vegas, NV 2.3% Oklahoma City, OK 3.3% Suffolk Co., NY 0.0%
Columbus, OH 63.8% Long Beach, CA 1.1% Omaha, NE 16.2% Tampa, FL 8.7%
Dallas, TX 5.4% Los Angeles Co., CA 0.9% Orlando, FL 16.7% Tucson, AZ 11.8%
Washington, DC N/A Los Angeles City, CA 7.7% Ottawa, ON, CA 0.0% Tulsa, OK 21.4%
DeKalb Co., GA 15.4% Louisville, KY 12.5% Peel, ON, CA 5.6% Vancouver, BC, CA 0.0%
Denver, CO 68.0% Memphis, TN 5.7% Phoenix, AZ 7.0% Virginia Beach, VA 4.5%
Detroit, MI 9.4% Mesa, AZ 18.8% Pittsburgh, PA 3.5% Wichita, KS 7.0%
Table 2 - Percentage of Total Protests that Involved Some Level of Violence by City
7
67 of 68 agencies provided data for this measurement.
8
This graph is designed to highlight the portion of protests that involved some level of violence compared to the
total number of 8,700 protests. The remaining “all other protests” reflected in this graph includes unlawful but
peaceful protests, as well as the protests that were both lawful and peaceful.
MCCA Report on the 2020 Protests and Civil Unrest
8AN IN-DEPTH LOOK INTO PROTEST-RELATED VIOLENCE
In cities where violence did occur, assaults on police officers, looting, and arson were the most
common criminal activities. Approximately, 72% of major city law enforcement agencies had
officers harmed during the protests.9 This included nearly every agency that experienced at
least one violent protest. In total, over the course of the civil unrest from May to July, more
than 2,000 officers sustained injuries in the line of duty. One agency reported 50 officers being
injured in a single week of protests. Another agency reported that 462 of their officers were
injured during the protests in their jurisdiction.
62% 56% 26% 72%
Percentage of Percentage of Percentage of Percentage of
agencies that agencies that agencies that had agencies that had
experienced experienced arson police cars burned officers injured
looting incidents incidents
Figure 7 - Percentage of Agencies that Experienced Looting, Arson, and Rioting
Looting was also a common occurrence (2,385 instances), with 62% of major city law
enforcement agencies indicating that at least one incident of looting occurred in their cities.10
This activity was primarily clustered during the first few days of protests. Of note, several
agencies reported that in some instances, the looting appeared to be coordinated and
organized. For example, some cities encountered “looting caravans” that moved throughout
different neighborhoods. One agency reported 115 commercial burglaries occurred in just one
day. Two other agencies reported $927,000 worth of damage as a result of looting in each of
their jurisdictions, and another agency reported a single looting event at a shopping mall that
resulted in over $70 million in damage.
9
67 of 68 agencies provided data for this measurement.
10
66 of 68 agencies provided data for this measurement.
MCCA Report on the 2020 Protests and Civil Unrest
9More than half of major city law enforcement agencies (56%) experienced arson incidents.11
The individuals who committed these crimes targeted a variety of structures including
government buildings, places of worship, and seemingly random stores and businesses. Law
enforcement buildings and property were also popular targets. One agency reported
dumpsters, trash cans, trees, furniture, and vehicles being set on fire. A UPS truck was reported
as being looted and set on fire in another jurisdiction. In many cities, city hall, as well as other
iconic public buildings and federal courthouses were targets of arson. Several agencies also had
police precincts set on fire and hundreds of police cars were significantly damaged throughout
the various protests across the U.S. One agency alone reported 300 police cars damaged to
include 19 that were fully engulfed in flames.
2,385 624 97 2,037
Looting Arson Police Cars Police Officers
Incidents Incidents Burned Injured
Figure 8 - Total Number of Acts of Looting, Arson, and Attacks on Police
11
Arson incidents that did not involve police vehicles were counted separately from those that involved the
burning of a police vehicle. 66 of 68 agencies provided data for this measurement.
MCCA Report on the 2020 Protests and Civil Unrest
10Types of Weapons Used
There were a variety of weapons used by protesters during acts of civil disobedience or
violence. The most common weapons were improvised or weapons of opportunity such as
rocks, bricks, pieces of landscape, and bottles (including frozen water bottles and glass bottles).
More than three quarters of major city law enforcement agencies (78%) that experienced
violent protests reported having officers attacked with these types of weapons. Another
common violent tactic used by protesters involved throwing “molotov cocktails” at officers.12
One agency reported these incendiary devices being thrown at officers who were standing at
their skirmish lines. In another instance, the devices were thrown behind officers, trapping
them between the ensuing fire and a barrier built by protesters. This tactic was extremely
dangerous and presented a high risk of death or injury to officers.
Rocks, bricks, and/or pieces of landscape
78%
Bottles to include frozen water bottles and glass bottles
75%
Fireworks to include those improvised to explode
63%
Wooden, metal, or plastic poles and bats
59%
Wooden, metal, or plastic shields
53%
Lasers used to target the eyes of officers
41%
Paint used to blind officers
24%
Incendiary devices to include Molotov Cocktails
46%
Firearms
51%
Other weapons such as leaf blowers
38%
No weapons used
19%
Figure 9 - Percentage of Agencies that Experienced Various Weapons Used by Protesters
12
“Molotov cocktails” are homemade incendiary devices typically made of a bottle filled with flammable liquid
with a means of ignition attached.
MCCA Report on the 2020 Protests and Civil Unrest
11Other items used as weapons or projectiles against officers included fire extinguishers,
hammers, wood, cinderblocks, rocks, frozen fruit, and suspected bodily fluids. Multiple agencies
also reported being attacked by protesters who threw these types of dangerous objects down
onto officers from elevated positions such as apartment or business windows, landings, and
rooftops. Another common tactic was to use peaceful protesters as human shields while violent
individuals attacked officers and attempted to incite violence by throwing objects from deep
within the crowds. Law enforcement officers were also attacked with weapons and tactics that
had rarely been seen before, such as the use of lasers to target the eyes of officers, which 41%
of agencies reported.
Approximately 63% of major city law enforcement agencies reported fireworks being launched
or thrown at officers. Other protesters showed up with more traditional weapons, indicating
that these individuals likely came prepared for, or looking to engage in, violence. These
weapons included items like bats and poles, which 59% of agencies reported, and shields, which
53% of agencies reported.
A slight majority of agencies (51%) were also confronted with firearms, most of which were
legally carried based on open carry laws. In these instances, protesters often carried semi-
automatic assault rifles such as AR-15s, shotguns, and handguns. Firearms carried by protesters
often required an elevated and more complex response from law enforcement agencies. It
became necessary for these agencies to deploy specialized squadrons and position additional
police officers armed with rifles and other deadly force options in order to proportionately
protect against any firearm threat or attack.
Tragically, this concern became a reality in numerous major cities. Five agencies reported police
officers being shot or critically injured during protests. One agency reported four of their
officers being shot and a retired police captain killed by protesters using firearms. Another
agency reported protesters discharging their firearms from vehicle caravans and two agencies
reported protesters being shot and killed by other protesters.
MCCA Report on the 2020 Protests and Civil Unrest
12Paid and Out-of-State Protesters
A common trend observed by major city law enforcement agencies was the large number of
visitors from out-of-state who participated in the protests. Nearly all agencies (90%)
experienced protest events with persons that came to the event from another state.
Additionally, many agencies reported that violence seemed to spike on days where out-of-state
protesters were present.13 The days that levels of violence were lower were days when local
protesters remained, and fewer numbers of out-of-state participants were observed.
While less common, over a quarter of major city law enforcement agencies (29%) reported
situations with participants that were paid to partake in the protest.
29%
OUT-OF-STATE PAID
PROTESTERS PROTESTERS
90%
90% of all Agencies (61 of 68) 29% of all Agencies (20 of 68)
Discovered Persons from Out-of- Discovered Persons Being Paid to
State Participating in Protests Participate in Protests
Figure 10 - Percentage of Agencies that had Out-of-State and Paid Protesters Participate in Protests
Nationwide Coordination
The weekend of May 29th to the following Monday, June 1st was by far the most violent for
many major city law enforcement agencies. These events had thousands of people in
attendance including groups with suspected violent extremist ideologies. “Prepared and
coordinated resistance” was reported by some agencies and similar tactics such as the use of
arson, looting, barricades, caravans, and specific types of weapons were seen in major cities
nationwide. Protesters seemed to coordinate their movements and actions on these days as if
the violence and tactics were pre-planned. For example, across the U.S., major city law
enforcement agencies reported peaceful protests beginning in the early to late afternoons and
violence beginning once it became dark.
13
Reported during the ICG After-Action Review in Washington, D.C. and/or Dallas, Texas.
MCCA Report on the 2020 Protests and Civil Unrest
13Violent Extremist Ideologies
Another trend seen in many cities involved individuals with suspected violent extremist
ideologies infiltrating various protest groups to commit acts of violence, looting, and rioting.
More than three quarters of agencies (78%) discovered persons that seemed to self-identify
with violent far-left ideologies, and more than half (51%) discovered persons that seemed to
self-identify with violent far-right ideologies.
VIOLENT VIOLENT
FAR-LEFT FAR-RIGHT 51%
EXTREMISTS EXTREMISTS
78%
78% of all Agencies (53 of 68) 51% of all Agencies (35 of 68)
Discovered Protesters with Violent Discovered Protesters with Violent
Far-Left Ideologies Far-Right Ideologies
Figure 11 - Percentage of Agencies that had Far Left or Right Violent Extremists Involved in Protests
MCCA Report on the 2020 Protests and Civil Unrest
14PROTEST-RELATED ARRESTS
From May 25th until July 31st, major city law enforcement agencies arrested 16,241 individuals
during protest-related events. Nearly 17% (2,735) of these arrests were for felony offenses.14
The average number of felony arrests per agency was 41 with the highest number of felony
arrests for a single agency being 639. The fact that only 7% of the protests were violent but
almost a fifth of the individuals arrested were for felony offenses is significant. This level of
felony arrests demonstrates that law enforcement agencies largely focused on individuals who
engaged in serious criminal activity and/or represented a threat to public safety.
PROTEST-RELATED ARRESTS
16,241 2,735
Total number of persons arrested during Total number of arrests that were for felony
protest-related events charges
4,146 639
Highest number of arrests for a single agency Highest number of felony arrests for a single
agency
239 41
Average number of arrests for a single agency Average number of felony arrests for a single
agency
Figure 12 - General Statistics for All Protest-Related Arrests
14
67 of 68 agencies provided data for this measurement.
MCCA Report on the 2020 Protests and Civil Unrest
15More than half (53%) of all agencies reported that their District Attorney’s Office elected not to
prosecute protest-related cases. More than half of these agencies (19 out of 36) indicated their
local District Attorney dismissed “a lot” of cases. One agency reported that a local District
Attorney dismissed more than 600 cases and would only pursue cases that had multiple
charges. In some instances, prosecutors refused to charge those arrested for felony crimes
committed during the protests despite the availability of video evidence and suspect
confessions. Large sums of money were also collected through public fundraising and other
means to post bail for some protesters, who in turn attended the next protest and re-
committed the same crimes.
This lack of accountability and failure to prosecute may have removed an important deterrent
for preventing criminal activity. This point is underscored by the fact that approximately 52% of
major city law enforcement agencies reported having to re-arrest suspects at least once at
different protest-related events.
Number of Protest-Related Cases Number of Agencies that Had to
District Attorney Offices Arrest the Same Person More than
Dismissed After Arrests Once for a Protest-Related Incident
30%
25%
15%
20%
15%
10% 52%
34%
5%
0%
Yes No Unknown
Figure 13 - Level of Protest-Related Cases Dismissed by District Attorneys and Number of Re-Arrests
MCCA Report on the 2020 Protests and Civil Unrest
16POLICE USE OF FORCE
Use of Force Analysis – Nationally
Analysis of the level of force used by major city law enforcement agencies indicates the
response to the protests that occurred between May 25th and July 31st, 2020 was measured and
proportionate. Major city law enforcement agencies deployed CS gas, pepper balls, and high
volume pepper spray during 1.8%, 1.8%, and 3.5% of protest-related events, respectively. The
use of kinetic projectiles was even more limited. The use of less lethal shotguns only occurred in
1.2% of all protests and 40mm launchers (for foam rounds or similar projectiles) only occurred
in 2.1% of all protests.15
NUMBER OF PROTESTS EACH FORCE OPTION WAS USED
# % # % # %
159 1.8% 156 1.8% 306 3.5%
Total number of events agencies Total number of events Total number of events agencies
used CS Gas and the percentage agencies used Pepper Balls and used High Volume Pepper Spray
of this use compared to the the percentage of this use and the percentage of this use
total number of 8,700 Protests compared to the total number compared to the total number of
of 8,700 Protests 8,700 Protests
# % # %
104 1.2% 185 2.1%
Total number of events agencies Total number of events agencies
used Less Lethal Shotguns (i.e. bean used 40MM Launchers (i.e. foam
bag rounds) and the percentage of rounds) and the percentage of
this use compared to the total this use compared to the total
number of 8,700 Protests number of 8,700 Protests
Figure 14 - General Statistics on Police Use of Force, Compared to the Proportion of All Protests
15
64 of 68 agencies provided data for the measurement regarding the use of high volume pepper spray. 65 of 68
agencies provided data for the measurements regarding the use of CS gas, pepper balls, less lethal shotguns, and
40MM launchers.
MCCA Report on the 2020 Protests and Civil Unrest
17Use of CS Gas – By Agency
CS gas was used proportionately by agencies in comparison to the violence experienced in their
jurisdictions.16 In fact, CS gas was used less frequently than the percentage of protests that
contained acts of violence per city. This means that most of the time, agencies deployed this
tool less often than they could have to quell violence. Overall, agencies refrained from the
disproportionate or overuse of this tool, despite being confronted with acts of violence and
large-scale coordinated acts of civil disobedience.
USE OF CS GAS - COMPARED TO PERCENTAGE OF VIOLENT EVENTS
% of Violent % of Force % of Violent % of Force
Agency Agency
Events Option Used Events Option Used
Arlington PD 7.7% 0.0% Metro Nashville PD 2.1% 2.1%
Atlanta PD 3.5% 0.9% Miami-Dade PD 26.1% 4.3%
Aurora PD 8.3% 0.0% Milwaukee PD 25.4% 0.8%
Baltimore Co. PD 0.0% 0.0% Minneapolis PD 20.0% 20.0%
Baltimore City PD 10.5% 0.0% Montgomery Co. PD 0.0% 0.0%
Boston PD 2.7% 1.4% Nassau Co. PD 0.0% 0.0%
Buffalo PD 5.0% 5.0% New Orleans PD 2.1% 2.1%
Calgary PD 0.0% 0.0% New York PD 4.9% N/A
Charlotte-Mecklenburg PD 7.6% 4.2% Newark PD 0.0% 0.0%
Chicago PD 3.8% 0.0% Oakland PD 20.0% 8.0%
Cincinnati PD 6.7% 5.0% Oklahoma City PD 3.3% 3.3%
Columbus PD 63.8% N/A Omaha PD 16.2% 5.4%
Dallas PD 5.4% 1.6% Orlando PD 16.7% 13.3%
Washington Metro PD N/A N/A Ottawa PD 0.0% 0.0%
DeKalb Co. PD 15.4% 7.7% Peel Regional PD 5.6% 0.0%
Denver PD 68.0% 24.0% Phoenix PD 7.0% 4.2%
Detroit PD 9.4% 6.3% Pittsburgh PD 3.5% 1.2%
Edmonton PS 0.0% 0.0% Portland PB 62.5% 39.1%
El Paso PD 12.5% 12.5% Prince George's Co. PD 0.0% 0.0%
Fairfax Co. PD 0.0% 0.0% Raleigh PD 6.3% 3.2%
Fort Worth PD 2.6% 2.6% Sacramento PD 6.1% 1.8%
Fresno PD 0.0% 0.0% Salt Lake City PD 3.3% 0.0%
Honolulu PD 0.0% 0.0% San Antonio PD 2.4% 2.4%
Houston PD 3.8% 0.0% San Diego PD 4.7% 0.9%
Indianapolis Metro PD 6.2% 4.9% San Jose PD 8.3% 2.5%
Jacksonville SO 7.5% 5.0% Seattle PD N/A N/A
Kansas City PD 10.3% 10.3% St Louis Metro PD 11.1% 1.1%
Las Vegas Metro PD 2.3% 1.9% Suffolk Co. PD 0.0% 0.0%
Long Beach PD 1.1% 0.0% Tampa PD 8.7% 0.0%
Los Angeles Co. SO 0.9% 0.9% Tucson PD 11.8% 5.9%
Los Angeles City PD 7.7% 0.0% Tulsa PD 21.4% 21.4%
Louisville Metro PD 12.5% 2.5% Vancouver PD 0.0% 0.0%
Memphis PD 5.7% 1.9% Virginia Beach PD 4.5% 4.5%
Mesa PD 18.8% 0.0% Wichita PD 7.0% 4.7%
Force Option Used More than the Percentage of Violent Events
Force Option Used Equal to the Percentage of Violent Events
Force Option Used Zero or Less than the Percentage of Violent Events
Table 3 - Percentage of CS Gas Used in Comparison to the Percentage of Violent Events by Agency
16
64 of 68 agencies provided data for this measurement.
MCCA Report on the 2020 Protests and Civil Unrest
18Use of Less Lethal Shotguns – By Agency
Less lethal shotguns were only used by 25 agencies (39%) during protests.17 Every agency
reported proportional use of this tool in relation to violence. Most agencies reported using it
even less than the number of times the tool may have been permitted. There is also a
correlation between the severity of violence that occurred in specific cities and the prevalence
of the less lethal shotgun used by police during protests.
USE OF LESS LETHAL SHOTGUNS - COMPARED TO PERCENTAGE OF VIOLENT EVENTS
% of Violent % of Force % of Violent % of Force
Agency Agency
Events Option Used Events Option Used
Arlington PD 7.7% 0.0% Metro Nashville PD 2.1% 0.0%
Atlanta PD 3.5% 0.2% Miami-Dade PD 26.1% 0.0%
Aurora PD 8.3% 2.8% Milwaukee PD 25.4% 0.0%
Baltimore Co. PD 0.0% 0.0% Minneapolis PD 20.0% 20.0%
Baltimore City PD 10.5% 0.0% Montgomery Co. PD 0.0% 0.0%
Boston PD 2.7% 0.0% Nassau Co. PD 0.0% 0.0%
Buffalo PD 5.0% 5.0% New Orleans PD 2.1% 0.0%
Calgary PD 0.0% 0.0% New York PD 4.9% N/A
Charlotte-Mecklenburg PD 7.6% 0.0% Newark PD 0.0% 0.0%
Chicago PD 3.8% 0.0% Oakland PD 20.0% 0.0%
Cincinnati PD 6.7% 5.0% Oklahoma City PD 3.3% 3.3%
Columbus PD 63.8% N/A Omaha PD 16.2% 0.0%
Dallas PD 5.4% 0.0% Orlando PD 16.7% 0.0%
Washington Metro PD N/A N/A Ottawa PD 0.0% 0.0%
DeKalb Co. PD 15.4% 0.0% Peel Regional PD 5.6% 0.0%
Denver PD 68.0% 24.0% Phoenix PD 7.0% 7.0%
Detroit PD 9.4% 3.1% Pittsburgh PD 3.5% 3.5%
Edmonton PS 0.0% 0.0% Portland PB 62.5% 0.0%
El Paso PD 12.5% 12.5% Prince George's Co. PD 0.0% 0.0%
Fairfax Co. PD 0.0% 0.0% Raleigh PD 6.3% 3.2%
Fort Worth PD 2.6% 2.6% Sacramento PD 6.1% 3.5%
Fresno PD 0.0% 0.0% Salt Lake City PD 3.3% 3.3%
Honolulu PD 0.0% 0.0% San Antonio PD 2.4% 0.0%
Houston PD 3.8% 0.0% San Diego PD 4.7% 0.0%
Indianapolis Metro PD 6.2% 0.0% San Jose PD 8.3% 3.3%
Jacksonville SO 7.5% 5.0% Seattle PD N/A N/A
Kansas City PD 10.3% 7.7% St Louis Metro PD 11.1% 1.1%
Las Vegas Metro PD 2.3% 0.5% Suffolk Co. PD 0.0% 0.0%
Long Beach PD 1.1% 0.0% Tampa PD 8.7% 7.7%
Los Angeles Co. SO 0.9% 0.0% Tucson PD 11.8% 0.0%
Los Angeles City PD 7.7% 6.0% Tulsa PD 21.4% 21.4%
Louisville Metro PD 12.5% 0.0% Vancouver PD 0.0% 0.0%
Memphis PD 5.7% 0.0% Virginia Beach PD 4.5% 0.0%
Mesa PD 18.8% 6.3% Wichita PD 7.0% 4.7%
Force Option Used More than the Percentage of Violent Protests
Force Option Used Equal to the Percentage of Violent Protests
Force Option Used Zero or Less than the Percentage of Violent Protests
Table 4 - Percentage of Less Lethal Shotguns Used in Comparison to the Percentage of Violent Events by Agency
17
64 of 68 agencies provided data for this measurement.
MCCA Report on the 2020 Protests and Civil Unrest
19Use of 40MM Launchers – By Agency
40MM Launchers were also used proportionately, if not fewer times than when it may have
been permitted.18 These statistics were like that of the less lethal shotguns. There was a
correlation between their use and cities that experienced high levels of violence during
protests.
USE OF 40MM LAUNCHERS - COMPARED TO PERCENTAGE OF VIOLENT EVENTS
% of Violent % of Force % of Violent % of Force
Agency Agency
Events Option Used Events Option Used
Arlington PD 7.7% 0.0% Metro Nashville PD 2.1% 2.1%
Atlanta PD 3.5% 1.0% Miami-Dade PD 26.1% 4.3%
Aurora PD 8.3% 5.6% Milwaukee PD 25.4% 0.0%
Baltimore Co. PD 0.0% 0.0% Minneapolis PD 20.0% 20.0%
Baltimore City PD 10.5% 5.3% Montgomery Co. PD 0.0% 0.0%
Boston PD 2.7% 1.4% Nassau Co. PD 0.0% 0.0%
Buffalo PD 5.0% 5.0% New Orleans PD 2.1% 2.1%
Calgary PD 0.0% 0.0% New York PD 4.9% N/A
Charlotte-Mecklenburg PD 7.6% 1.7% Newark PD 0.0% 0.0%
Chicago PD 3.8% 0.0% Oakland PD 20.0% 0.0%
Cincinnati PD 6.7% 6.7% Oklahoma City PD 3.3% 3.3%
Columbus PD 63.8% N/A Omaha PD 16.2% 4.1%
Dallas PD 5.4% 2.2% Orlando PD 16.7% 0.0%
Washington Metro PD N/A N/A Ottawa PD 0.0% 0.0%
DeKalb Co. PD 15.4% 0.0% Peel Regional PD 5.6% 0.0%
Denver PD 68.0% 16.0% Phoenix PD 7.0% 7.0%
Detroit PD 9.4% 3.1% Pittsburgh PD 3.5% 3.5%
Edmonton PS 0.0% 0.0% Portland PB 62.5% 39.1%
El Paso PD 12.5% 0.0% Prince George's Co. PD 0.0% 0.0%
Fairfax Co. PD 0.0% 0.0% Raleigh PD 6.3% 3.2%
Fort Worth PD 2.6% 2.6% Sacramento PD 6.1% 3.5%
Fresno PD 0.0% 0.0% Salt Lake City PD 3.3% 3.3%
Honolulu PD 0.0% 0.0% San Antonio PD 2.4% 0.0%
Houston PD 3.8% 3.8% San Diego PD 4.7% 0.9%
Indianapolis Metro PD 6.2% 0.0% San Jose PD 8.3% 3.3%
Jacksonville SO 7.5% 5.0% Seattle PD N/A N/A
Kansas City PD 10.3% 0.0% St Louis Metro PD 11.1% 1.1%
Las Vegas Metro PD 2.3% 1.9% Suffolk Co. PD 0.0% 0.0%
Long Beach PD 1.1% 1.1% Tampa PD 8.7% 3.8%
Los Angeles Co. SO 0.9% 0.9% Tucson PD 11.8% 11.8%
Los Angeles City PD 7.7% 6.0% Tulsa PD 21.4% 21.4%
Louisville Metro PD 12.5% 2.5% Vancouver PD 0.0% 0.0%
Memphis PD 5.7% 0.0% Virginia Beach PD 4.5% 4.5%
Mesa PD 18.8% 0.0% Wichita PD 7.0% 4.7%
Force Option Used More than the Percentage of Violent Protests
Force Option Used Equal to the Percentage of Violent Protests
Force Option Used Zero or Less than the Percentage of Violent Protests
Table 5 - Percentage of 40MM Launchers Used in Comparison to the Percentage of Violent Events by Agency
18
64 of 68 agencies provided data for this measurement.
MCCA Report on the 2020 Protests and Civil Unrest
20Use of Pepper Balls – By Agency
The agencies that used pepper balls did so proportionately and the vast majority used the tool
fewer times than when it may have been permitted.19 This tool is also commonly used to
address acts of civil disobedience, which may or may not involve violence. This tool was limited
to acts of violence or civil disobedience that created a public safety exemption for using the
tool (i.e. the takeover of an active freeway where persons were placed in immediate harm).
USE OF PEPPER BALLS - COMPARED TO PERCENTAGE OF CIVIL DISOBEDIENCE (C/D)
% of C/D % of Force % of C/D % of Force
Agency Agency
Events Option Used Events Option Used
Arlington PD 30.8% 0.0% Metro Nashville PD 29.8% 0.0%
Atlanta PD 87.0% 0.2% Miami-Dade PD 73.9% 0.0%
Aurora PD 91.7% 0.0% Milwaukee PD 88.8% 0.0%
Baltimore Co. PD 0.0% 0.0% Minneapolis PD 50.0% 0.0%
Baltimore City PD 10.5% 5.3% Montgomery Co. PD 17.4% 0.0%
Boston PD 13.5% 0.0% Nassau Co. PD 76.9% 0.0%
Buffalo PD 7.5% 7.5% New Orleans PD 2.1% 0.0%
Calgary PD 10.0% 0.0% New York PD 20.5% N/A
Charlotte-Mecklenburg PD 8.5% 4.2% Newark PD 9.5% 0.0%
Chicago PD 76.3% 0.0% Oakland PD 20.0% 0.0%
Cincinnati PD 6.7% 6.7% Oklahoma City PD 33.3% 0.0%
Columbus PD 100.0% N/A Omaha PD 67.6% 16.2%
Dallas PD 70.7% 2.2% Orlando PD 16.7% 0.0%
Washington Metro PD N/A N/A Ottawa PD 0.0% 0.0%
DeKalb Co. PD 46.2% 7.7% Peel Regional PD 16.7% 0.0%
Denver PD 100.0% 20.0% Phoenix PD 93.0% 8.5%
Detroit PD 100.0% 0.0% Pittsburgh PD 45.3% 0.0%
Edmonton PS 10.0% 0.0% Portland PB 100.0% 0.0%
El Paso PD 12.5% 0.0% Prince George's Co. PD 0.0% 0.0%
Fairfax Co. PD 38.5% 0.0% Raleigh PD 93.7% 3.2%
Fort Worth PD 23.1% 0.0% Sacramento PD 100.0% 3.5%
Fresno PD 3.6% 0.0% Salt Lake City PD 91.7% 0.8%
Honolulu PD 25.0% 0.0% San Antonio PD 6.1% 2.4%
Houston PD 8.8% 2.5% San Diego PD 100.0% 1.9%
Indianapolis Metro PD 88.9% 7.4% San Jose PD 16.7% 3.3%
Jacksonville SO 25.0% 5.0% Seattle PD N/A N/A
Kansas City PD 59.0% 0.0% St Louis Metro PD 88.9% 1.1%
Las Vegas Metro PD 9.3% 2.3% Suffolk Co. PD 3.7% 0.0%
Long Beach PD 82.0% 0.0% Tampa PD 81.7% 8.7%
Los Angeles Co. SO 6.5% 0.9% Tucson PD 100.0% 11.8%
Los Angeles City PD 27.4% 0.0% Tulsa PD 28.6% 28.6%
Louisville Metro PD 75.0% 12.5% Vancouver PD 10.3% 0.0%
Memphis PD 100.0% 0.0% Virginia Beach PD 18.2% 0.0%
Mesa PD 25.0% 6.3% Wichita PD 69.8% 4.7%
Force Option Used More than the Percentage of Civil Disobedience Protests
Force Option Used Equal to the Percentage of Civil Disobedience Protests
Force Option Used Less than the Percentage of Civil Disobedience Protests
Table 6 - Percentage of Pepper Balls Used in Comparison to the Percentage of Civil Disobedience Events by Agency
19
64 of 68 agencies provided data for this measurement.
MCCA Report on the 2020 Protests and Civil Unrest
21Use of High-Volume Pepper Spray – By Agency
The use of high-volume pepper spray was the most common tool that agencies utilized to quell
civil disobedience and violence during protests. All agencies that used this tool did so
proportionately and 98% of agencies used this tool fewer times than when it may have been
necessary.20 This tool is also commonly used to address acts of civil disobedience, which may or
may not involve violence.
USE OF HIGH VOLUME PEPPER SPRAY - COMPARED TO PERCENTAGE OF CIVIL DISOBEDIENCE (C/D)
% of C/D % of Force % of C/D % of Force
Agency Agency
Events Option Used Events Option Used
Arlington PD 30.8% 0.0% Metro Nashville PD 29.8% 2.1%
Atlanta PD 87.0% 0.9% Miami-Dade PD 73.9% 0.0%
Aurora PD 91.7% 2.8% Milwaukee PD 88.8% 0.8%
Baltimore Co. PD 0.0% 0.0% Minneapolis PD 50.0% 20.0%
Baltimore City PD 10.5% 0.0% Montgomery Co. PD 17.4% 0.0%
Boston PD 13.5% 1.4% Nassau Co. PD 76.9% 0.0%
Buffalo PD 7.5% 2.5% New Orleans PD 2.1% 0.0%
Calgary PD 10.0% 0.0% New York PD 20.5% N/A
Charlotte-Mecklenburg PD 8.5% 5.1% Newark PD 9.5% 0.0%
Chicago PD 76.3% 2.3% Oakland PD 20.0% 0.0%
Cincinnati PD 6.7% 6.7% Oklahoma City PD 33.3% 3.3%
Columbus PD 100.0% N/A Omaha PD 67.6% 5.4%
Dallas PD 70.7% 2.2% Orlando PD 16.7% 6.7%
Washington Metro PD N/A N/A Ottawa PD 0.0% 0.0%
DeKalb Co. PD 46.2% 15.4% Peel Regional PD 16.7% 0.0%
Denver PD 100.0% 20.0% Phoenix PD 93.0% 8.5%
Detroit PD 100.0% 6.3% Pittsburgh PD 45.3% 3.5%
Edmonton PS 10.0% 0.0% Portland PB 100.0% 39.1%
El Paso PD 12.5% 0.0% Prince George's Co. PD 0.0% 0.0%
Fairfax Co. PD 38.5% 0.0% Raleigh PD 93.7% 3.2%
Fort Worth PD 23.1% 0.0% Sacramento PD 100.0% 3.5%
Fresno PD 3.6% 0.0% Salt Lake City PD 91.7% 0.0%
Honolulu PD 25.0% 0.0% San Antonio PD 6.1% 2.4%
Houston PD 8.8% 3.8% San Diego PD 100.0% 0.0%
Indianapolis Metro PD 88.9% 4.9% San Jose PD 16.7% N/A
Jacksonville SO 25.0% 5.0% Seattle PD N/A N/A
Kansas City PD 59.0% 7.7% St Louis Metro PD 88.9% 0.0%
Las Vegas Metro PD 9.3% 3.7% Suffolk Co. PD 3.7% 0.0%
Long Beach PD 82.0% 0.0% Tampa PD 81.7% 7.7%
Los Angeles Co. SO 6.5% 0.2% Tucson PD 100.0% 11.8%
Los Angeles City PD 27.4% 0.0% Tulsa PD 28.6% 0.0%
Louisville Metro PD 75.0% 2.5% Vancouver PD 10.3% 0.0%
Memphis PD 100.0% 0.0% Virginia Beach PD 18.2% 4.5%
Mesa PD 25.0% 12.5% Wichita PD 69.8% 0.0%
Force Option Used More than the Percentage of Civil Disobedience Protests
Force Option Used Equal to the Percentage of Civil Disobedience Protests
Force Option Used Zero or Less than the Percentage of Civil Disobedience Protests
Table 7 - Percentage of High-Volume Pepper Spray Used in Comparison to the Percentage of Civil Disobedience Events
20
63 of 68 agencies provided data for this measurement.
MCCA Report on the 2020 Protests and Civil Unrest
22You can also read