National Drug Observatory Report - Ministry of Health and Quality of Life Republic of Mauritius - Ministry of Health ...
←
→
Page content transcription
If your browser does not render page correctly, please read the page content below
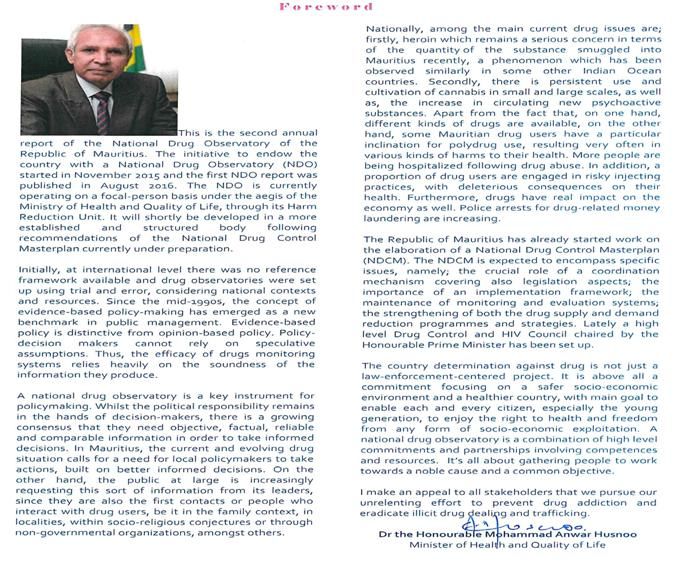
Republic of Mauritius
Ministry of Health and Quality National
                               of Life  Drug Observatory Report, March 2018

                                                  National
                                                   Drug
                                            Observatory
                                                    Report

                                     [1]

                                                               March          2018
National Drug Observatory Report, March 2018 [2]
National Drug Observatory Report, March 2018

Contents

    Page
         2                    Foreword
         4                    Acr0nyms
         5                    Second report of the National Drug Observatory
       6-9                    Executive Summary and general observation

Chapter 1                     HEALTH EFFECTS OF DRUG USE IN MAURITIUS
              1.1 Pattern and trend of inpatient treatment cases of drug users, in public health institutions
    12 - 14                  Pattern and trend of drug-related inpatient treatment cases, in public health institutions
    14 - 15                  Age distribution of drug users treated as inpatients, in public health institutions
    15 - 17                  Reported substances used, among drug users treated as inpatients, in public health institutions
         17                  Inpatient treatment cases in public health institutions, due to problems following multiple drug use
         18                  Diseases and health problems reported at public health institutions, due to drug use
                             Inpatient treatment cases in public health institutions, due to problems following new psychoactive
        18
                             substances
     19-21                   Drug-related Inpatient treatment cases, in public health institutions, by district of residence of patient
              1.2 Drug use, Hepatitis C and HIV concentrated epidemics
        22                   Drug injection and Hepatitis C
     23-24                   Drug injection, HIV and Hepatitis C linkages
     24-25                   Hepatitis C morbidity and mortality
              1.3 Injecting drug use
     25-26                   People who inject drugs as the driving agent of the national concentrated HIV epidemics
        26                   Characteristics of people who inject drugs
        26                   Injecting practices among people who inject drugs
        24                   Mode of initiation to injecting drugs
     26-27                   Risky behaviours among people who inject drugs
        27    1.4 Deaths due to drug use
Chapter 2                     THE HEALTH RESPONSE TO DRUG USE
     28-29                    The Needle Exchange Programme (NEP) and the Methadone Substitution Therapy Programme
     29-31                    The Suboxone Programme and the Codeine Phosphate Programme
     31-33                    Prevention against drug use

Chapter 3                     SITUATION OF DRUG USE AND TRAFFICKING IN MAURITIUS

              3.1 Drug control by the Mauritius Police Force

        34                    The Mauritius Police Force reported drug offences
     35-40                    Arrests by Police ADSU
              3.2 Seizures of drugs by the Mauritius Revenue Authority (MRA) Customs
        41                    Drug seizure cases by the MRA Customs
     41-42                    Value of drugs seized by the MRA
     43-44                    Quantity of drugs seized by the MRA
        44    3.3 Drug use in educational institutions
Chapter 4                     IMPRISONMENT AND THE JUDICIARY CONVICTED DRUG OFFENCES
     45-46                    Convicted drug offences, reported by the Judiciary
     46-47                    Drug offences, reported by the Mauritius Prisons Services
Chapter 5                     REHABILITATION CENTRES
     48-49                    The rehabilitation set up and activities and general observations from Rehabilitation Centres
        50                    Reference
        51                    ANNEX - Ministry of Youth & Sports drug-related activities

                                                               [3]
National Drug Observatory Report, March 2018
Acronyms
ADSU Anti-Drug Smuggling Unit (Mauritius Police Force)
CUT (NGO) Collectif Urgence Toxida
CYC Correctional Youth Centre
HCV Hepatitis C Virus
IBBS Integrated Biological and Behavioural Surveillance
ICD 10 International Classification of Diseases, 10th Revision
MOH&QL Ministry of Health and Quality of Life
MRA Mauritius Revenue Authority
NDCM National Drug Control Masterplan
NDO National Drug Observatory
NEP Needle Exchange Programme
NGO Nongovernmental Organization
PWID People Who Inject Drugs
[4]National Drug Observatory Report, March 2018
Second report of the National Drug Observatory
This report refers to the one-year period, from July 2016 to June 2017. Additional information and data for
earlier periods are also included for trend analysis purposes.
Indicators are constructed using essentially secondary data. As a result, most indicators are of reported nature
and should be used with careful interpretation given that they relate to institutional and administrative
settings and performances.
This report attempts to give a picture of the drug situation in Mauritius by examining available factual and
reliable drug-related data and information in the following areas; health problems resulting from drug use,
measured mainly through admissions in public health institutions; specific diseases epidemics linkage with
drug use, using routine service data as well as past surveys; the health response to drug use, through health
programmes; the government national drug control and law enforcement activities, through data obtained
from the Mauritius Police Force and the Mauritius Revenue Authority Customs; drug offences and
imprisonment, through data obtained from the Mauritius Prisons Services and published reports of the
Judiciary; and finally service-delivery-based observations on the drug situation from NGOs.
Data related to inpatient treatment cases have been provided by the Health Records Division of the Ministry of
Health and Quality of Life.
Acknowledgements
The National Drug Observatory wishes to express its gratitude to the following organizations:
The Mauritius Police Force and its Anti-Drug Smuggling Unit (ADSU);
the Mauritius Revenue Authority (MRA) Customs;
the Mauritius Prisons Services;
the Judiciary;
the Health Records Division of the Ministry of Health and Quality of Life;
the Health Statistics Unit of the Ministry of Health and Quality of Life;
the Harm Reduction Unit of the Ministry of Health and Quality of Life;
Rehabilitation centres:
o Dr Idriss Goomany Centre, Plaine Verte;
o Crysalid, Bambous;
o Centre de Solidarité Pour Une Nouvelle Vie, Rose Hill;
o Actresa, Calebasses;
o Centre d’Accueil de Terre Rouge ;
o Etoile d’Espérance, Moka ;
o Help de- Addiction, Cassis;
o Groupe A de Cassis ;
o Renaissance, Mahebourg ;
o and Sangram Sewa Sadan, St Paul;
The Ministry of Education and Human Resources, Tertiary Education and Scientific Research;
Statistics Mauritius; and all those who have contributed to this report.
[5]National Drug Observatory Report, March 2018
Executive summary
Health effects of drug use
o In 2015 and 2016 there were respectively 552 and 914 inpatient treatment cases in public health institutions
for drug problems and in the first six months of 2017, there were 689 corresponding cases (638 male cases,
51 female cases).
o In public health institutions, whilst a percentage increase of 66% was observed among drug-related
inpatient treatment cases, from 2015 to 2016, between the 2nd semester period of 2016 and the 1st semester
period of 2017, a corresponding increase of 47% was observed, from 469 cases to 689 cases respectively.
o Combining different sources of information, especially, health institutions and drug control agencies, there
is evidence to say that the current drug use picture in Mauritius is characterized by the consumption of a
variety of substances, namely; Heroin-(0pi0id), Cannabis, Cannabinoids-(THC in cannabis), Hashish-(Cannabis
resin), Methadone-(0pi0id), Cocaine-(Coca leaves -stimulant), Methamphetamine-(Central nervous system-
stimulant), Ecstasy-(Methylenedioxymethamphetamine-MDMA), Rivotril-(Clonazepam-benzodiazepine drug),
Valium-(Diazepam-benzodiazepine drug), Mogadon-(Nitrazepam-benzodiazepine drug), Panadeine-
(Paracetamol+CodeinePhosphate-opioid), Cough syrup, Tramadol-(Pain-treatment- opioid), New psychoactive
substances, Subutex-(Buprenorphine-opioid), Nova-(Pregabalin), among other unspecified substances.
o For the one-year period, from July 2016 to June 2017, significant inpatient treatment cases of suspected
multiple drugs use were reported in public health institutions, namely; using methadone with heroin/brown
sugar; heroin with rivotril; alcohol with new psychoactive substances; buprenorphine with rivotril; drug
injection while on methadone; heroin (brown sugar) with new psychoactive substances, Nova with cough
syrup, amongst others.
o In the first six months of 2017, out of the 689 inpatient treatment cases reported in public health
institutions due to drugs problems, at least 44% of cases were problems following use of suspected new
psychoactive substances and at least 17% inpatient cases were associated with use of opioids and opiates,
while, at least 6% inpatient treatment cases were reported as problems following use of cannabis, amongst
others.
o For the one-year period, from July 2016 to June 2017, in public health institutions, drug-related inpatient
treatment cases for teenagers (10-19 years) accounted for 19%.
o For the one-year period, from July 2016 to June 2017, in public health institutions, out of 536 known
inpatient treatment cases related to suspected use of new psychoactive substances, teenaged drug users
accounted for 23% and 28% were in the age group 20-24 years, while, 50% were aged 25 years and over.
o Among drug-related inpatient cases in public health institutions, just around half (53%) of cases were
reported to be from urban areas, against 47% from rural areas.
o For the one-year period, from July 2016 to June 2017, drug users have undergone inpatient treatment in
public health institutions, for the following health problems; mental and psychotic disorders including
acute psychosis; auditory hallucination; confusional state; depression; anxiety; drug overdose
complications; unconsciousness; fits; vertigo; palpitation; breathlessness; vomiting; nausea; abdominal
pain; headache; weakness; dizziness; agitation and restlessness; sleepiness; dyspnoea; withdrawal
syndrome; suicidal tendencies; abnormal aggressive disorders; and slurred speech. Addiction to heroin
during pregnancy was also reported among drug-related inpatient treatment cases.
o Based on information provided on death certificates and applying the principle of selecting the
underlying cause of deaths according to the International Classification of Diseases (ICD 10) of the
World Health Organization, 17 deaths were assigned to drug use in 2015 as compared to 23 in 2016. 18
deaths due to drugs have been registered in the period January to June 2017.
[6]National Drug Observatory Report, March 2018
o Three previous IBBS surveys carried out among people who inject drugs respectively in 2009, 2011 and
2013, showed that Hepatitis C (HCV) was above 95% among this high-risk group, while, the rate of co-
infection with HIV and HCV was 44% in the 2013 IBBS survey. In 2016, public laboratories’ HCV positivity
rate was 33.0 per 1,000, with 1,279 positive cases through 38,756 tested specimens. From 2004 to 2016,
the number of laboratory positive hepatitis C cases, has decreased by 53%, from 2,713 cases to 1,279
cases, while, the positivity rate has decreased by 35% for the same period 2004-2016, from 51.0 per
1,000 (peak of the epidemic) to 33.0 per 1,000 tested specimens.
o Hepatitis C treatment through the use of Direct Antiviral Agents (DAA) is provided to patients
according to the eligibility criteria established by the MOH & QL. Currently, Hepatitis C infected
patients are being treated and followed up at the Medical Unit, Victoria Hospital.
o The proportion of people who inject drugs (PWID), among annual newly detected HIV cases, was at its
peak in 2005, that is, 92%, it has thereafter declined to reach 33% in 2016. For the first six months of
2017, PWID was 41% of the annual newly detected HIV cases. People who are actively injecting drugs
are estimated to be around 5,000 and an estimated 40% of this high-risk population is infected with
HIV.
Health response to drug use
o As at June 2017, 4,021 people were on the Methadone Substitution Programme, through 42
methadone dispensing sites across the Island, including 3 sites within the prisons services.
o Between 2012 and 2016, the number of syringes distributed through the Needle Exchange Programme
(NEP), has increased by 312% to reach a total of 697,861 syringes distributed in 2016, with 47% done by
the Ministry of Health and Quality of Life (MOH&QL) and 53% by NGOs.
o A Suboxone-Naltrexone-based detoxification programme started at Mahebourg Hospital, in January
2016, with a 12-bed facility. At the end of June 2017, 457 cases, including 82 repeaters, have been
admitted at Mahebourg Hospital for the programme. 80% were heroin injectors against 20% heroin
smokers. On the other hand, an ongoing Codeine Phosphate treatment programme is conducted by
five NGOs in collaboration with the MOH&QL who in addition provides medications, as well as, medical
and health personnel for the programme.
o Since April 2016, the Ministry of Health and Quality of Life has launched a national drug use prevention
campaign, with a team comprising of Nursing Officers and Health Care Assistants. This campaign
focuses on several fronts, namely; schoolchildren and non-schoolchildren; communities; workplaces
and the public at large. 1,013 awareness sessions in school settings were organized, with 48,417
participants. 6,828 participants were sensitized through 155 drug-related prevention sessions on a
range of subjects such as; peer education initiation in schools; forums and rehabilitated drug addicts
confessions; non-schoolchildren education; and education in youth centres and youth associations.
20,784 participants were embraced in Community Centres through 463 awareness sessions and 17,850
persons at main bus stations and commercial centres, in 9 sessions.
Drug offence and drug control
o Based on data obtained from the Mauritius Police Force, between 2012 and 2014, the annual drug
offence ratio was on average 2.8 reported drug offences per 1,000 inhabitants. From 2015 to 2016, the
number of drug offences registered, decreased by 3% from 3,468 to 3,370, resulting in stabilization of
the drug offence rate to 2.7 per 1,000 population.
[7]National Drug Observatory Report, March 2018
o In 2015 and 2016, there were respectively 1,772 and 1,776 reported Police ADSU arrests for drug
offences and 1,133 arrests were reported for the period January to June 2017.
o Out of the 1,133 arrests by Police ADSU for drug offences, from January to June 2017, 838 arrests (74%)
were arrests for possession of drugs, 278 arrests (25%) were for dealing of drugs, 12 arrests (1%) were
for money laundering and 5 arrests were reported for causing obstruction to Police.
o For the period January to June 2017, out of 1,116 Police ADSU arrests (i.e excluding arrests due to money
laundering and obstruction to Police), heroin offences accounted for 38%, followed by cannabis, 30%,
cannabinoids, 20%, cultivation of cannabis, 5%, sedatives/tranquilizers, 4%, methadone, 2%,
buprenorphine, less than one percent and finally hashish, cocaine and methamphetamine, less than
one percent.
o There was a percentage increase of 19% in the number of arrests by Police ADSU for the 1 st semester of
2017 with respect to the previous 2nd semester of 2016. For the same two semester periods, arrests for
possession of drugs increased by 14%, arrests for dealing of drugs increased by 34% and arrests for
obstruction to Police increased by 25%. Twelve arrests were reported for money laundering in the
1stsemester of 2017 as compared to 3 corresponding arrests in the 2ndsemester of 2016.
o Among other drug control activities of the Police ADSU, 14,866 plants of cannabis were uprooted
during the period January up to June in 2017. In 2015 and 2016, 72,300 and 72,100 plants of cannabis
were uprooted respectively.
o During the first semester of 2017, the Mauritius Revenue Authority (MRA) Customs carried out 42 drug
seizure cases as compared to 32 cases in the second semester of 2016.
o Seizures of drugs for the one-year period, July 2016 up to June 2017, by the MRA, amounted to Rs 2.73
billion, out of which, Rs 2.66 billion (97%) were seized in the first semester of 2017.
o The amount of drugs seized in 2015 and in 2016 were Rs 178.5 million and Rs 170.4 million respectively
as compared to Rs 2,656.6 million (Rs 2.7 billion) for the first six months of 2017.
o For the first six months of 2017, out of the Rs 2,656.6 million of drugs seized by the MRA, Rs 2,614.9
million (98.4%) were related to heroin seizures.
o 10.7 kg and 9.9 kg of heroin were seized by MRA Customs in 2015 and in 2016 respectively as compared
to 174.3 kg in the first six months of 2017, that is, a percentage increase of 1661% for the 1st semester of
2017 with respect to the whole year 2016.
o Regarding cannabis, 9.4 kg and 3.1 kg were seized in 2015 and in 2016 respectively as compared to 50.1
kg in the first six months of 2017, that is, a percentage increase of 1516% for the 1st semester of 2017
with respect to the whole year 2016. Furthermore, 78 units of cannabis seeds were seized in 2015, 500
units in 2016 and 111 units in the first semester of 2017. 5.4 kg of hashish were seized in 2015, 0.1 kg in
2016 and 3.1 kg in the first six months of 2017.
o In 2015, 0.3 kg of new psychoactive substances were seized against 0.1 kg in 2016 and 2.1 kg in the first
six months of 2017, that is, a percentage increase of 2000% for the 1st semester of 2017 with respect to
the whole year 2016.
o 1.3 kg of cocaine was seized in 2016, while, no seizures involving this drug was reported in 2015 and in
2017(as at end of June).
[8]National Drug Observatory Report, March 2018
o There were no reported seizures of psychotropic substances by the MRA in 2015, as compared to
seizures of 2,256 units (tablets) in 2016 and 1,529 units in the first six months of 2017.
o There were no reported seizures of ecstasy by the MRA in 2015 against seizures of 2,256 units (tablets)
in 2016 and 1,529 units in the first six months of 2017.
Drug offence and imprisonment
o Out of 2,140 admissions in prisons, in the first semester of 2017, drug-offence imprisonment accounted
for 6%. Among drug-offence admissions, 68% were associated with possession of drugs, 14% with
dealing of drugs, 15% with drug trafficking and 3% for importation of drugs.
o During the first six months of 2017, among drug-offence imprisonment, most admissions were due to
heroin-related offences, 47%, and cannabis-related offences, 69%, followed by new psychoactive
substances offences, 14% and ecstasy, 8%. There were also very few cases, around one percent, for
other specified drug offences, while, a significant proportion of drug-offence admissions were
reported with unspecified drugs, 17%.
o 2,222 convicted drug offences were reported by the Judiciary, in 2016, as compared to 2,363 in 2015. In
2016, most convicted drug offences were given fines, 87%, against 10% imprisonment and 3% combined
for probation, community services and conditional & absolute discharges.
o 57% of the 2,222 convicted drug offences reported by the Judiciary, in 2016, were associated with
cannabis-related offences, that is, cultivation, possession and consumption of cannabis.
Drug use in schools
o For the first half of 2017, 19 cases of suspected illicit drug use, involving more than 35 students in 17
educational institutions, were reported, as compared to 43 students concerning 9 educational
institutions in the first half of 2016.
General observation
In Mauritius, even if drug offences represent only 6% of all offences (excluding road traffic offences),
evidence-based information shows that there are some drug concerns in the country, specifically in
terms of health, social and economic implications. Each year, around 3,000 drug offences are reported
by the Mauritius Police Force, about 2,000 convicted drug offences are reported by the Judiciary.
Regarding health, at least a thousand drug-related inpatient treatment cases are now expected
annually at the public health institutions, while, nearly half of whom usually attend the specialized
Mental Health Care Centre. Among patients receiving drug-related care, a high proportion (above 90%)
is found in the age group 15 -49 years, that is, an important age segment of the active labor force. The
national Hepatitis C and HIV epidemics are high-risk groups concentrated epidemics and are drug-use
driven. The positive outcomes of the existing prevention and harm reduction programmes need to be
maintained by consolidating and adapting the programmes. On the other hand, control by the
authorities shows that importations of major illicit drugs are increasing, in terms of quantity and
values. In addition, Police arrests due to money laundering are increasing.
Inpatient treatment cases following drug abuse are increasing annually at public health institutions
and drug abuse is causing a range of health problems such as; mental and behavioural disorders as
[9]National Drug Observatory Report, March 2018
well as other systemic diseases. Since April 2016, in addition to the existing drug treatment and
prevention programmes, the Ministry of Health and Quality of Life is implementing a strong national
drug use prevention campaign among schoolchildren and non-schoolchildren, at workplaces and in
the public at large. The objective of these programs is to build new and at the same time to strengthen
existing protective factors and to reverse or reduce risk factors, particularly among the youth.
Inpatient treatment cases in public health institutions have revealed that various categories of drugs
are being used, namely; narcotics, hallucinogens, depressants, stimulants and other psychoactive
drugs, amongst others. Health problems following suspected use of new psychoactive substances
constitute one of the major reasons for drug-related inpatient treatment in public health institutions.
Triangulation of information indicates that, female drug users generally account for 5% to 10% of drug
users in Mauritius. For instance, 6% of the known suspected new psychoactive drug inpatient cases
were females. It was 9% among heroin cases and 6% among cannabis cases. On the other hand, all
IBBS surveys carried out so far have shown a proportion of 5% to 10% of female injectors among the
whole population of people who inject drugs.
People in need of inpatient treatment, due to drug problems, are from all age groups, ranging from
teenagers to adults aged above 50 years old. It is most frequent among abusers in the 20-34 years age
group, though there is a greater concentration within the 25-34 years age group. In addition, drug-
related inpatients come from all parts of the country, the impact in the rural areas being as substantial
as in the urban ones. Furthermore, Mauritian drug users are choosing an assortment of drugs and
substances namely, heroin, cannabis, cannabinoids, hashish, methadone, cocaine, methamphetamine,
ecstasy, Rivotril, Valium, Mogadon, Panadeine, Cough syrup, Tramadol, new psychoactive substances,
buprenorphine and Nova, amongst others. The particular interest in the benzodiazepines class of drug
is also to be noted.
Polydrug use is causing quite a number of health harms to those who are addicted. Multiple drugs use
is indicating the strong drug dependence nature of some drug users, not to mention the aggravated
situation of drugs being taken with alcohol concurrently or sequentially. For instance, inpatient
treatment cases at public health institutions have revealed circumstances where heroin has been used
with alcohol, thus adding the risk of overdosing. Other sources of information reported to the
National Drug Observatory are associating multiple drugs use to the poor quality of street drugs
available. The increasing circulation of new psychoactive substances is also contributing to polydrug
use.
Hepatitis C (HCV) among people who inject drugs (PWID) was found to be high, above 95%. In
addition, among this high-risk population, 44% were co-infected with HIV and HCV. High positivity rates
of laboratory tested Hepatitis C among patients, as compared to the low positivity rates in the general
population, observed through blood donors’ laboratory tests, is an indication of a national
concentrated hepatitis C epidemic. In Mauritius, deaths registered due to hepatitis C is low, around 10
deaths yearly, while, 9 in 1o deaths due to hepatitis C are acute cases against one chronic case.
Management of Hepatitis C (HCV) and HIV co-infection should consider the health vulnerabilities of
individuals touched by this condition. For instance, among the HCV-HIV co-infection issues are; firstly,
the shorter interval for the development of liver diseases as compared to HCV mono-infected patients;
secondly, the replication of HCV which is enhanced in the presence of HIV co-infection; thirdly, some
studies have found HCV-HIV co-infection to be associated with an increased risk of death compared
with HCV mono-infection, amongst others.
The proportion of people who inject drugs, among the annual newly detected HIV cases, has declined
drastically since 2011. HIV transmission in this high-risk population has been brought under control
through the Harm Reduction programmes. The national HIV epidemic is still a concentrated one. The
[10]National Drug Observatory Report, March 2018
population size of people who are actively injecting drugs is estimated to be around 5,000–6,000.
Continuous monitoring of this high-risk group, through Integrated Biological and Behavioural
Surveillance studies (IBBS) every two years, remains vital since it currently represents around 40% of
newly detected HIV cases and that the prevalence of HIV among this key population is estimated to be
around 40%.
Collaboration and partnership in drug prevention and treatment programmes between the public and
the private sector is ongoing. Government and NGOs interactions in the Needle Exchange Programme
(NEP) and in the Codeine Phosphate Programme are examples of the public-private sector
collaboration. Including NGOs in the demand reduction strategies and inviting consultation of NGOs at
all levels of the policy is vital.
Based on the regular and constant rate of monthly drug-offence arrests by Police ADSU, especially for
possession of drugs (monthly average of 131 arrests), coupled with the steady increase of people seeking
hospital drug-related inpatient treatment, there is an indication that there is a continuous dynamic
supply of drugs.
[11]National Drug Observatory Report, March 2018
Chapter 1
Health effects of drug use in Mauritius
This chapter gives an account of the different health disorders as well as other systemic diseases. In
problems encountered by some Mauritians following addition to inpatient treatment cases in public
drugs use, for the one-year period July 2016 to June health institutions, this chapter considers other
2017. Information compiled and analyzed on drug- information such as injecting drug use which causes
related inpatient treatment cases in public health harms when using and sharing dirty injecting
institutions, shows evidence of how drug use can equipment, resulting in transmission of HIV infection
hurt health. It shows how drug use can affect the and hepatitis C.
body, leading to various diseases such as mental
1.1 Inpatient treatment cases in public health institutions due to drug use problems
1.1.1 Pattern and trend of inpatient treatment in public health institutions due to drug use problems
For the one-year period, from July 2016 to June 2017, there were 1,158 cases treated as inpatients in public
health institutions, due to drug use problems, out of which, 7% were female cases.
From 2015 and 2016, inpatient treatment cases in public health institutions following drug use problems,
increased by 66% (66% among males and 56% among females), that is , from 552 cases to 914 cases.
Between the 2nd semester period of 2016 and the 1st semester period of 2017, inpatient treatment cases in
public health institutions, following drug use problems, increased by 47% (+46% among males and +65% among
females). For the same period, there were increases for almost all kind of drugs used and also across all age
groups, particularly among male inpatient cases in the age group 25-34 years, that is, a percentage increase of
52% between the two semester periods for this age group.
For the one-year period July 2016 up to June 2017, reported inpatient treatment cases for drug problems at
Brown Sequard Mental Health Care Centre accounted for nearly 50% of all reported drug related inpatients
treatment cases in all public health institutions. From 2011 to 2016, at Brown Sequard Mental Health Care
Centre, inpatient treatment cases due to drug abuse have increased from 65 cases in 2011 to 300 cases in 2016.
For the first six months of 2017, 337 drug-related inpatient treatment cases have been reported at this same
care centre.
[12]National Drug Observatory Report, March 2018
Table 1
Public Heath Institutions
Inpatient treatment cases due to complications following drug use
by semester period
January 2015 - June 2017
Percentage change
of reported
2015 2016 2017
inpatient treatment cases
2nd semester
2nd semester
1st semester
1st semester
1st semester
Year 2016 1st semester 2017 /
/Year 2015 2nd semester 2016
Male 207 297 401 438 638 +66% +46%
Female 15 33 44 31 51 +56% +65%
Both sexes 222 330 445 469 689 +66% +47%
Figure 1
Public Health Institutions
Inpatient treatment cases due to complications following drug use
Quarterly trend, January 2015 - June 2017
400
Number of admissions
FEMALE 318
320
300 MALE
267
233
205
200 171
140 134
126
100
67
18 26 17 14 22 29
9
0
3rd quarter 2015
2nd quarter 2016
2nd quarter 2017
4th quarter 2016
2nd quarter 2015
1st quarter 2016
4th quarter 2015
3rd quarter 2016
First quarter 2015
1st quarter 2017
Quarterly period (Jan 2015 - Jun 2017)
[13]National Drug Observatory Report, March 2018
Figure 2
Brown Sequard Mental Health Care Centre
Cases treated as inpatients
due to mental and behavioural disorders following drug use
2005 - 2017(As at June)
350 316
Number of admissions
287
300
250
200 183
MALE
150 FEMALE
94 105
100 61 59
49 49 56
38 38 43
50 9 11 13 21
3 3 2 2 4 6 7 3 5
0
2012
2005
2006
2013
2015
2016
2007
2009
2017(As at
2008
2011
2010
2014
June)
1.1.2 Age distribution of drug users treated as inpatients, in public health institutions
For the one-year period, from July 2016 to June 2017, the age distribution of patients for drug-related inpatient
treatment cases in public health institutions, was as follows; 2% were aged 10-14 years, 17% were aged 15-19
years, 28% were aged 20-24 years, 31% were aged 25-34 years, 18% were aged 35-49 years and 4% were aged 50
years and above. Thus, inpatient treatment cases were essentially in the age band 15-49 years for male cases,
93%, while it was essentially in the age band 15-34 years for female cases, 91%.
In public health institutions, for the one-year period, from July 2016 to June 2017, drug-related inpatient
treatment cases for teenagers (10-19 years) accounted for 19% of all drug-related inpatient cases (18% among male
teenagers, 33% among female teenagers).
Table 2
Public Heath Institutions
Inpatient treatment cases due to complications following drug use
ONE-YEAR PERIOD: JULY 2016 TO JUNE 2017, by age group & sex of patient
Both
Percent
Age group (Years) Male Female sexes
10 - 14 years 22 5 27 2.3
15 - 19 years 169 22 191 16.5
20 - 24 years 300 22 322 27.8
25 - 34 years 339 25 364 31.4
35 - 49 years 197 6 203 17.5
50 years & above 49 2 51 4.4
TOTAL 1,076 82 1,158 100.0
(92.9%) (7.1%) (100.0%)
[14]National Drug Observatory Report, March 2018
Figure 3
Public Heath Institutions
Inpatient treatment cases due to complications following drug use
ONE-YEAR PERIOD: JULY 2016 TO JUNE 2017,
by age group of patient
35 years & above,
22% (10-19 years)
19%
20 - 34 years,
59%
Table 3
Public Heath Institutions
Inpatient treatment cases due to complications following drug use
by age group & sex of patient and semester period,
(July–December) 2016 (January-June) 2017
Both Both
Male Female Percent Male Female Percent
Age group sexes sexes
(Years)
10 - 14 years 10 2 12 2.6 12 3 15 2.2
15 - 19 years 78 10 88 18.8 91 12 103 14.9
20 - 24 years 123 9 132 28.1 177 13 190 27.6
25 - 34 years 130 6 136 29.0 209 19 228 33.1
35 - 49 years 78 3 81 17.3 119 3 122 17.7
50 years & above 19 1 20 4.3 30 1 31 4.5
438 31 469 100.0 638 51 689 100.0
TOTAL
(93.4%) (6.6%) (100.0%) (92.6%) (7.4%) (100.0%)
1.1.3 Suspected substances reported, among drug users treated as inpatients, in public health institutions
Information collected from public health institutions, indicates that from July 2016 to June 2017, Mauritian drug
users have been on a range of substances. Among the reported specified suspected drugs used, there were
the following:
o Heroin (Brown sugar),
o Buprenorphine,
o Cannabis,
o Rivotril,
o Valium,
o Mogadon,
o Panadeine,
o Cough syrup,
[15]National Drug Observatory Report, March 2018
o Cocaine,
o Methadone,
o Tramadol,
o New psychoactive substances,
o and Nova.
Suspected use of new psychoactive substances related to hospital inpatient treatment cases have been
reported under various names as follows:
o “La poussière tombée”
o “C’est pas bien”
o “Batte dans la tête”
o “Rambo”
o “Strawberry”
o “Murder”
o “Wasabi”
o “Black Mamba”
o “Résine”
o “Simin”
The Table below gives the distribution of drug-related inpatient treatment cases in public health institutions, by
substances used, for the period July 2016 to June 2017. Although a substantial proportion (30%) of inpatient
cases was reported with unspecified drugs, the use of new psychoactive substances appeared to be one of the
major reasons why drug users have sought after hospital care.
Table 4
Public Health Institutions
Inpatient treatment cases due to complications following drug use
By type of drug & semester period,
July 2016 to June 2017
First Second Total
Drug semester semester (One-year period) Percent
2017 2016 July 2016 - June 2017
New psychoactive substances 305 231 536 46.3%
Opioids and opiates 120 79 199 17.2%
Cannabis 38 25 63 5.4%
Medicinal 3 5 8 0.7%
Buprenorphine 0 1 1 0.1%
Unspecified (including multiple drugs) 223 128 351 30.3%
TOTAL 689 469 1,158 100.0%
[16]National Drug Observatory Report, March 2018
Table 5
Public Heath Institutions
Inpatient treatment cases due to complications following drug use
by type of drug & sex of patient
One-year period, July 2016 - June 2017
Drug Male Female Both sexes Percent
New psychoactive substances 504 32 536 46.3%
Opioids and opiates 181 18 199 17.2%
Cannabis 59 4 63 5.4%
Medicinal 8 - 8 0.7%
Buprenorphine 1 - 1 0.1%
Unspecified drugs (Including multiple drugs) 323 28 351 30.3%
TOTAL 1,076 82 1,158 100.0%
Table 6
Public Heath Institutions
Inpatient treatment cases due to complications following drug use
by type of drug & age group of patient
One-year period, July 2016-June 2017
DRUG
New Opioids Unspecified
(Including
Cannabis Medicinal psychoactive and Buprenorphine Multiple
Total Percent
substances opiates drugs)
10 - 14 years 4 0 14 1 0 8 27 2.3%
15 - 19 years 16 2 108 18 0 47 191 16.5%
Age group
20 - 24 years 20 2 148 56 0 96 322 27.8%
25 - 34 years 16 3 160 76 0 109 364 31.4%
35 - 49 years 5 0 90 35 0 73 203 17.5%
50 years & above 2 1 16 13 1 18 51 4.4%
Total 63 8 536 199 1 351 1,158 100.0%
1.1.4 Inpatient treatment cases in public health institutions, due to multiple drugs use
Cases of multiple drugs use were reported as follows: taking methadone with heroin/brown sugar; heroin with
rivotril; brown sugar with caustic soda; alcohol with new psychoactive substances; buprenorphine with rivotril;
drugs injection while on methadone; heroin (brown sugar) with new psychoactive substances, Nova with
cough syrup; amongst others.
[17]National Drug Observatory Report, March 2018
1.1.5 Diseases and health complications reported at public health institutions due to drug use
For the one-year period, from July 2016 to June 2017, among drug-related inpatient cases in public health
institutions, several diseases associated with mental and behavioural disorders were reported, namely;
auditory hallucination, psychotic disorders, acute psychosis, confusional state, depression and anxiety,
amongst others.
Drug users treated as inpatients also presented the following symptoms, namely; unconsciousness, fits,
vertigo, palpitation, breathlessness, vomiting, nausea, abdominal pain, headache, weakness, dizziness,
agitation and restlessness, sleepiness and dyspnoea.
Other conditions which have necessitated inpatient treatment cases in public health institutions, following
drug use, were withdrawal syndrome, suicidal tendencies, abnormal aggressive disorders and slurred speech.
Addiction to heroin during pregnancy was also reported among drug-related inpatient treatment cases.
1.1.6 Inpatient treatment in public health institutions following complications due to suspected use of
new psychoactive substances
For the one-year period, July 2016 to June 2017, out of 1,158 inpatient treatment cases in public health
institutions, at least 536 cases, 44%, were specified as suspected use of new psychoactive substances, out of
which, female inpatient cases accounted for 6%. It is to be noted, as already mentioned, that 30% of all drug-
related inpatient cases were reported with unspecified drugs.
Out of the 536 known inpatient cases of suspected new psychoactive substances, 3% of cases were associated
to patients aged 10-14 years, 20% were aged 15-19 years, 28% were aged 20-24 years, 30% were aged 25-34
years, 17% were aged 35-49 years and 3% were aged 50 years and over.
Thus, among the known inpatient cases of suspected use of new psychoactive substances, in public health
institutions, teenagers’ (10-19 years) inpatient cases accounted for 23%.
Table 7
Public Heath Institutions
Inpatient treatment cases due to complications following suspected use of new psychoactive substances
One-year period, July 2016 to June 2017, by age & sex of patient
Female Percent Male Percent Both sexes Percent
10 - 14 years 2 6.3% 12 2.4% 14 2.6%
15 - 19 years 11 34.4% 97 19.2% 108 20.1%
Age group
20 - 24 years 6 18.8% 142 28.2% 148 27.6%
25 - 34 years 9 28.1% 151 30.0% 160 29.9%
35 - 49 years 3 9.4% 87 17.3% 90 16.8%
50 years & above 1 3.1% 15 3.0% 16 3.0%
Total 32 100.0% 504 100.0% 536 100.0%
[18]National Drug Observatory Report, March 2018
1.1.7 Inpatient treatment cases in public health institutions following complications due to drug use, by
district of residence of patient
For the one-year period, from July 2016 to June 2017, the distribution of the place of residence of drug users
attending public health institutions, for inpatient care, indicates that drug use was scattered in almost all areas
of the Island of Mauritius, even if some regions were more affected than others. Drug users admitted to public
health institutions were predominantly from the two districts constituting the urban region, namely, Port Louis
and Plaines Wilhems. Nearly one-quarter of drug-related inpatient cases were from Port Louis and 28% were
from Plaines Wilhems, making a total proportion of 53% for urban cases against 47% for rural cases.
Each rural district represented respectively 3% to 10% of all drug-related inpatient cases in the Island. The district
of Savanne had the lowest proportion of admitted drug-users with only 3% of all inpatients cases in the Island.
One percent of drug-related inpatient treatment cases, in public health institutions, were from correctional
centres and from prisons.
Table 8 (a)
Public Heath Institutions
Inpatient treatment cases due to complications following drug use
One-year period, July 2016 to June 2017
by place of residence & sex of patient
Place of residence Male Percent Female Percent Both sexes Percent
Port Louis 264 24.5% 22 26.8% 286 24.7%
Pamplemousses 101 9.4% 7 8.5% 108 9.3%
Rivière du Rempart 58 5.4% 3 3.7% 61 5.3%
Flacq 100 9.3% 5 6.1% 105 9.1%
Grand Port 51 4.7% 2 2.4% 53 4.6%
Savanne 33 3.1% 2 2.4% 35 3.0%
Plaines Wilhems 302 28.1% 24 29.3% 326 28.2%
Moka 53 4.9% 2 2.4% 55 4.7%
Black River 103 9.6% 13 15.9% 116 10.0%
Correctional centres 11 1.0% 2 2.4% 13 1.1%
Total 1,076 100.0% 82 100.0% 1,158 100.0%
[19]National Drug Observatory Report, March 2018
Table 8 (b)
Public Heath Institutions
Inpatient treatment cases due to complications following drug use
One-year period, July 2016 to June 2017
by place of residence & suspected substances used
(Number of inpatient treatment cases)
PLACE OF RESIDENCE OF PATIENT
Pamplemousses
Plaines Wilhems
centre/ prison
R du Rempart
Correctional
Black River
Grand Port
TOTAL
Port Louis
Savanne
Moka
Flacq
DRUG
Cannabis 6 8 3 15 5 6 10 2 8 0 63
Medicinal 2 1 0 0 2 1 2 0 0 0 8
New psychoactive substances 145 50 28 32 27 12 156 24 53 9 536
Opioids and opiates 49 21 7 28 6 4 49 12 22 1 199
Buprenorphine 1 0 0 0 0 0 0 0 0 0 1
Unspecified 83 28 23 30 13 12 109 17 33 3 351
TOTAL 286 108 61 105 53 35 326 55 116 13 1,158
(Percentage inpatient treatment cases)
PLACE OF RESIDENCE OF PATIENT
TOTAL
Pamplemousses
Plaines Wilhems
centre/ prison
R du Rempart
Correctional
Black River
Grand Port
Port Louis
Savanne
Moka
Flacq
DRUG
Cannabis 2% 7% 5% 14% 9% 17% 3% 4% 7% 0% 5%
Medicinal 1% 1% 0% 0% 4% 3% 1% 0% 0% 0% 1%
New psychoactive substances 51% 46% 46% 30% 51% 34% 48% 44% 46% 69% 46%
Opioids and opiates 17% 19% 11% 27% 11% 11% 15% 22% 19% 8% 17%
Buprenorphine 0% 0% 0% 0% 0% 0% 0% 0% 0% 0% 0%
Unspecified 29% 26% 38% 29% 25% 34% 33% 31% 28% 23% 30%
100%% 100% 100% 100% 100% 100% 100% 100% 100% 100% 100%
TOTAL
[20]National Drug Observatory Report, March 2018
Table 8 (c)
Public Heath Institutions
Inpatient treatment cases due to complications following drug use
One-year period, July 2016 to June 2017
by place of residence, semester periods & suspected substances used
[Continue with next table below for further districts).
Number of inpatient cases
Port Louis Pamplemousses R. D. Rempart Flacq Grand Port
One-year (July 2016 - June 2017)
One-year (July 2016 - June 2017)
One-year (July 2016 - June 2017)
One-year (July 2016 - June 2017)
One-year (July 2016 - June 2017)
Second semester 2016
Second semester 2016
Second semester 2016
Second semester 2016
Second semester 2016
First semester 2017
First semester 2017
First semester 2017
First semester 2017
First semester 2017
DRUG
Cannabis 4 2 6 7 1 8 1 2 3 7 8 15 1 4 5
Medicinal 1 1 2 1 0 1 0 0 0 0 0 0 1 1 2
New psychoactive substances 90 55 145 30 20 50 12 16 28 14 18 32 14 13 27
Opioids and opiates 37 12 49 10 11 21 2 5 7 13 15 28 4 2 6
Buprenorphine 0 1 1 0 0 0 0 0 0 0 0 0 0 0 0
Unspecified 57 26 83 17 11 28 13 10 23 20 10 30 7 6 13
TOTAL 189 97 286 65 43 108 28 33 61 54 51 105 27 26 53
…Continue from above
Correctional All public health
Savanne Plaines Wilhems Moka Black River
Centres Institutions
One-year (July 2016 - June 2017)
One-year (July 2016 - June 2017)
One-year (July 2016 - June 2017)
One-year (July 2016 - June 2017)
One-year (July 2016 - June 2017)
One-year (July 2016 - June 2017)
Second semester 2016
Second semester 2016
Second semester 2016
Second semester 2016
Second semester 2016
Second semester 2016
First semester 2017
First semester 2017
First semester 2017
First semester 2017
First semester 2017
First semester 2017
DRUG
Cannabis 5 1 6 8 2 10 0 2 2 5 3 8 0 0 0 38 25 63
Medicinal 0 1 1 0 2 2 0 0 0 0 0 0 0 0 0 3 5 8
New psychoactive substances 7 5 12 95 61 156 14 10 24 23 30 53 6 3 9 305 231 536
Opioids and opiates 3 1 4 24 25 49 10 2 12 16 6 22 1 0 1 120 79 199
Buprenorphine 0 0 0 0 0 0 0 0 0 0 0 0 0 0 0 0 1 1
Unspecified 8 4 12 65 44 109 9 8 17 24 9 33 3 0 3 223 128 351
TOTAL 23 12 35 192 134 326 33 22 55 68 48 116 10 3 13 689 469 1,158
[21]National Drug Observatory Report, March 2018
1.2 Drug use, Hepatitis C and HIV epidemics
1.2.1 Hepatitis C and drug injection
The link between drug use and hepatitis C has been widely documented by many countries and communities
and is now evident globally. Hepatitis C is a disease of the liver caused by the hepatitis C virus (HCV), which if
not resolved can lead to chronic liver disease such as cirrhosis. HCV which affects millions of people, globally, is
communicable and is spread by contact with infected blood or other bodily fluids.
In Mauritius, three Integrated Biological and Behavioral Surveillance (IBBS) surveys carried out in 2009, 2011
and 2013 have shown that, at each point of time, above 95% of people who inject drugs were HCV infected,
although these studies also showed a decrease in the size of this high-risk population from 10,000 to 5000
active drug injectors.
The evolution of the national Hepatitis C concentrated epidemic is portrayed through the trend of positivity
rates of this pathogen confirmed through tests carried out in public laboratories from 2000 to 2016. The peak
of the Hepatitis C epidemic was observed in 2004 when 2,713 positive cases were found among 52,713
specimens tested, that is a positivity rate of 51.0 per 1,000 and has since then constantly decreased to reach a
positivity rate of 27.2 per 1,000, through 55,158 specimens tested in 2011. No further decrease has been
observed as from 2011 to 2016 in the positivity rate, although it decreased in absolute numbers, respectively
from 1,502 cases to 1,279 cases. In 2016, HCV positivity rate was 33.0 per 1,000 with 1,279 positive cases out of
38,756 specimens tested - (excluding blood donors in 2016).
Figure 4 (a)
Island of Mauritius
Trend of Hepatitis C positivity rate /1,000 specimens tested in public laboratories, 2000 - 2016
51.0
37.0 Public
Rate / 1,000
33.0
27.0 27.0 laboratories
positivity rate of
Hepatitis C per
1,000 specimens
tested
2016
2006
2009
2010
2013
2014
2000
2004
2007
2008
2011
2012
2015
2003
2001
2002
2005
Figure 4 (b)
Public Laboratories (40,000-60,000 tested specimens yearly)
Number of positives cases of Hepatitis C, 2000 - 2016
3000
Number of positive cases
2,713
2000
1,279
911
1000
0
2016
2006
2009
2014
2013
2004
2007
2010
2012
2015
2000
2002
2008
2011
2003
2005
2001
[22]National Drug Observatory Report, March 2018
1.2.2 Drug injection, HIV and Hepatitis C linkages
In Mauritius, the Hepatitis C epidemic curve has followed almost the same pattern and trend as the HIV
epidemic, thus indicating people who inject drugs as the driving element of the national Hepatitis C
concentrated epidemic (See figure 5(a) below). The methadone substitution treatment set up in Mauritius as from
2006, coupled with provision of sterile injecting equipment, through needle and syringe programmes, have
been the determinant prevention measures that have contributed to the control of the HIV epidemic and at
the same time have curbed down the Hepatitis C epidemic.
It should be noted that, while a drastic decline in the number of annual newly detected HIV cases is observed
as from 2011 to 2016 (see chart below), on another hand, for the same period, the positivity rates of Hepatitis C
through public laboratories have remained constantly around 30 per 1,000.
In 2015, positivity rate of hepatitis C, in public laboratories, was 120 per 1,000 among patients (1,700 positive
cases out of 14,125 specimens tested), while, it was 3 per 1,000 among blood donors (133 positive cases among
46,617 specimens tested) indicating a concentrated hepatitis C epidemic.
In 2013, HIV and Hepatitis co-infection was 44% among people who inject drugs.
Figure 5 (a)
Republic of Mauritius
People who inject drugs (PWID) as a percentage of annual newly detected HIV cases
and Hepatitis C positivity rate/1,000, in public laboratories,2000 - 2016
92%
88%
72% 74%
68% 68% % PWID on
annual newly
51.0 detected HIV
31.0 cases
27.0 30.0 33.0
Hepatitis C
14%
3% Lab positivity
rate per 1,000
2010
2013
2000
2008
2011
2012
2015
2003
2005
2001
2002
2016
2006
2009
2014
2004
2007
Figure 5 (b)
815 Republic of Mauritius
Newly detected HIV cases, by sex
2000 - 2017(As at June)
Male
455 433 Female
167 190 155 190
135 151
106 121 (As at June)
59
32 109 132 107 129 73 (As at June)
2002
2007
2016
2003
2005
2014
2001
2006
2009
2010
2012
2000
2004
2008
2013
2015
2011
2017
The high prevalence of HCV can be explained by the high-risk drug injecting practices that were observed
among people who inject drugs. For instance, 90% of PWID reported injecting heroin in the three months
previous to the 2013 IBBS survey. 63% percent of them reported injecting drugs daily; more than two thirds
[23]National Drug Observatory Report, March 2018
(69%) reported injecting two or more times in a day and only 25% had never shared a needle/syringe previously
used by someone else and 25% had never shared injecting equipment such as cookers, vials, containers in the
three months previous to the 2013 IBBS survey.
1.2.3 Hepatitis C morbidity and mortality
In 2016, based on the International Classification of Diseases (ICD 10), 12 deaths were registered due acute
hepatitis C and all were in the age band 30-64 years. From 2010 to 2016, 68 deaths (63 males, 5 females) due to
hepatitis C have been registered among adults aged 30 years & over, out of which, 61 deaths were acute cases
against 7 chronic cases.
The three tables below give details of the morbidity and mortality trend of hepatitis C from year 2005 to 2016.
For instance, in 2016, there were 1,279 positive hepatitis C cases detected by public laboratories (excluding tests
among blood donors) and 11 inpatient treatment cases were reported in public hospitals due to hepatitis C,
while, 13 deaths were registered due to hepatitis C in whole Island of Mauritius.
Table 9
HEPATITIS C
Trend of public laboratories positivity rates, morbidity and mortality, 2005 – 2016
Number of Number of deaths
Number of Cases treated as
specimens Positivity registered
YEAR positive inpatients in public
tested in public Rate (%) in
cases health institutions
laboratories Island of Mauritius
2005 42,899 1,952 4.6 2 2
2006 55,135 2,026 3.7 1 6
2007 54,842 1,839 3.4 - 6
2008 54,262 1,660 3.1 5 5
2009 51,773 1,735 3.4 4 5
2010 54,950 1,637 3.0 7 6
2011 55,158 1,502 2.7 14 12
2012 57,586 1,598 2.8 7 13
2013 61,665 1,713 2.8 11 7
2014 58,951 1,901 3.2 5 10
2015 60,742 1,833 3.0 11 19
2016 38,756 1,279 3.3 13 11
Table 10
Island of Mauritius
Deaths registered due to Hepatitis C (Acute and Chronic) among adults aged 30 years and over
2010 2011 2012 2013 2014 2015 2016
Hepatitis C
Male Female Male Female Male Female Male Female Male Female Male Female Male Female
Acute 5 1 12 - 5 - 10 1 4 1 9 1 11 1
Chronic 1 2 - 2 - - - - - 1 - 1 -
Total 7 14 7 11 5 11 13
Table 11
Island of Mauritius
[24]National Drug Observatory Report, March 2018
Cases treated as inpatients in government general hospitals
Hepatitis C (Acute and Chronic) among adults aged 30 years and over
2010 - 2016
2010 2011 2012 2013 2014 2015 2016
Hepatitis C
Male Female Male Female Male Female Male Female Male Female Male Female Male Female
Acute 5 1 12 - 8 5 4 3 1 5 7 1 2 1
Chronic - - - - - - - - 2 2 7 4 5 3
Total 6 12 13 7 10 19 11
1.3 Injecting drug use
1.3.1 People who inject drugs (PWID) as the driving agent of the national HIV epidemic
At the beginning of the HIV epidemic, the mode of transmission of the HIV virus was mainly heterosexual. The
escalating incidence as from year 2000 was propelled by PWID acting as the main mode of transmission. The
gradual shift in mode of transmission from heterosexual to PWID became flagrant in 2003 when 68% of the
new cases were detected among the PWID as compared to only 14% in 2002. The shift got to its peak in 2005,
92%, and declined to 68% in 2011. In 2016, PWID accounted for 33% of the annual newly detected HIV cases as
compared to 35% in 2015. For the first six months of 2017, it was 41%.
Based on the UNAIDS Spectrum, the number of people living with HIV was estimated to stand around 7,900 in
2016, with an HIV prevalence of 0.87% among the Mauritian population age 15-49 years.
Figure 6
Republic of Mauritius
Estimated HIV prevalence (%) among adult 15 - 49 years
1987 - 2016
2.00
1.80
1.60
1.14 1.22
1.20
0.87
0.80
0.47 0.52
0.40
0.00
1988
1996
1999
1990
1994
1997
2016
1993
1998
1992
1995
2006
2009
2010
2013
2014
1991
1987
1989
2000
2004
2007
2011
2012
2015
2003
2001
2008
2002
2005
Male Female Both sexes
Two Integrated Biological and Behavioral Surveillance (IBBS) surveys, carried out in the years 2009 and 2011
provided an estimated population size of around 10,000 active PWID in Mauritius. Another similar survey,
carried out in 2013, provided an estimated population size of 5,000 active PWID. An estimate of the PWID
population size in 2016, using the UNAIDS Spectrum, is around 5,000–6,000 active injectors. It is to be
[25]National Drug Observatory Report, March 2018
highlighted that over 6,500 PWID have been induced on methadone since 2006 and as at June 2017, around
4,000 PWID were on the methadone maintenance programme.
1.3.2 Characteristics of people who inject drugs
The IBBS study, carried out in 2013, revealed that male drug injectors made up 93% of the population of people
who inject drugs against 7% female drug injectors. The majority of drug injectors, 80%, were aged between 20 –
49 years for both sexes. Those aged 15 – 19 years constituted 7% among female injectors and less than 1%
among male injectors. Regarding their educational attainment, it was observed that at least 95% of drug
injectors had reported that they have not completed the secondary education cycle. Concerning civil status,
only 2% of PWID were widows or widowers and the remaining 98% of this population was equally distributed
within those who were singles, those living in common whether civilly or religiously and those divorced or
separated couples.
85% of PWID reported they have ever been arrested by police and mostly, 69%, for drug-related problems,
while, 21% were arrested for larceny, 6% for violence, 3% for prostitution and 2% for other matters. 81 % of
those that have ever been arrested have ever been incarcerated, which means that roughly 70% of PWID have
ever been incarcerated.
Most drug injectors started injection in the age group 15 – 19 years (43%), 27% started in the age group 20 – 24
years, 23% started as from 25 years and above. 7% started under the age of 15 years. The median duration on
injecting drug use was 18 years with 11% who claimed a duration of 30 years and above of drug injection
practice.
Regarding the age of initiation to drugs, it is worth underlying the link between injecting drug and non-injecting
drug practice. In fact, 95% of PWID reported they have ever used non-injecting drug and once they have
started with this type of drug use, 16% have started with injecting practices on the same year, 15% have started
injecting one year after the first non-injecting drug, 34% have started injecting 2 – 4 years after first the non-
injecting drug, 20% have started injecting 5 – 10 years after first the non-injecting drug and finally only 7% have
started with injecting drug more than 10 years after first non-injecting drug use.
1.3.3 Mode of initiation to injecting drug
The 2013 IBBS survey showed that the age at first injecting drug use was independent of the mode of
initiation, i.e. age at first drug injection was not associated with whether injecting drug initiation was done by
a friend, in a group or the drug user himself/herself. On the other hand, a significant decrease was observed
from 85% in 2011 to 68% in 2013 with respect to the percentage of those who used to inject drug with another
person or use to inject in a group. Forty-three percent of PWID reported they have been initiated to injecting
drug practice by a friend while 32% reported the initiation was made on their own. 18 % admitted they had
started injecting drugs within a group (not in prison). Only 5% have had their first injecting drug by a partner.
1.3.4 Injecting drug practices
According to the 2013 IBBS survey, the two main places chosen by drug users to inject were at home (63%) and
on unoccupied land (32%) and the remaining 5% at other miscellaneous spots. In the 2013 IBBS survey, 69% of
PWID were estimated to inject drugs more than once on any particular day. Although a majority (80%) of them
reported they used sterile equipment, it was observed that injecting more than once in a day slightly increased
the probability of using non-sterile equipment. Furthermore the use of sterile or non-sterile equipment was
found to be independent of the person who injected the drug user. It is to be noted that usually 81% of PWID
were self-injecting their drug and 15% were done by any friend of the drug user, while, very few (4%) were done
by either a peer or other persons. 23% of PWID reported they have ever had drug overdose.
[26]National Drug Observatory Report, March 2018
The 2013 study showed that 75% of PWID have ever shared used needles and among this sub-group 46% have
ever shared used needles either “always” or “most of the time”. Among PWID who have ever shared used
needles, 80% were cleaning the used needles (mostly with cold water), out of which, only 27% were using hot or
boiled water for the cleansing. On the other hand, 76% had shared cookers/vials in the last three months prior
to the 2013 study. Ease of access to new, unused needles and/or syringes was high (95%) with pharmacies being
reported as the most common place for obtaining them (51%), followed by needle exchange programmes, 37%.
1.4 Death due to drug use
Based on information provided on death certificates and applying the principle of selecting the underlying
cause of deaths according to the International Classification of Diseases (ICD 10) of the World Health
Organization (WHO), 17 deaths were assigned to drug use in 2015 as compared to 23, in 2016. Eighteen deaths
due to drugs have been registered in the period January to June 2017.
[27]You can also read