Projecting the Supply and Demand for Primary Care Practitioners Through 2020 - Health Resources and Services Administration Bureau of Health ...
←
→
Page content transcription
If your browser does not render page correctly, please read the page content below
Projecting the Supply and
Demand for Primary Care
Practitioners Through 2020
November 2013

Health Resources and Services Administration Bureau of Health
Professions
National Center for Health Workforce Analysis
The National Center for Health Workforce Analysis (the National Center)
    informs public and private sector decision-making related to the health
    workforce by expanding and improving health workforce data,
    disseminating workforce data to the public, improving and updating
    projections of the supply and demand for health workers, and
    conducting analyses of issues important to the health workforce.

    For more information about the National Center, e-mail us at
    healthworkforcecenter@hrsa.gov      or   visit   our website at
    http://bhpr.hrsa.gov/healthworkforce/index.html.

    Suggested citation:

    U.S. Department of Health and Human Services, Health Resources and
    Services Administration, National Center for Health Workforce Analysis.
    Projecting the Supply and Demand for Primary Care Practitioners
    Through 2020. Rockville, Maryland: U.S. Department of Health and
    Human Services, 2013.

    Copyright information:

    All material appearing in this report is in the public domain and may be
    reproduced or copied without permission. Citation of the source,
    however, is appreciated.

i      Projecting the Supply and Demand for Primary Care Practitioners Through 2020
Contents
I. EXECUTIVE SUMMARY ...................................................................................................1
A. Key Findings .................................................................................................................. 1
B. Conclusions ................................................................................................................... 3
C. Limitations of These Projections................................................................................... 3
II. INTRODUCTION ..............................................................................................................5
A. Definition of Primary Care............................................................................................. 6
III. PRIMARY CARE PHYSICIAN SUPPLY ............................................................................8
A. Overview of the Supply Model ..................................................................................... 8
B. Estimating the Active Supply of Primary Care Physicians in 2010 .............................. 8
C. Projecting the Future Supply of Primary Care Physicians.......................................... 11
1.Entrants ........................................................................................................................... 11
2.Retention ......................................................................................................................... 13
3.Projected Changes in Patient Care Hours Worked ......................................................... 13
D. Projected Change in Primary Care Physician Supply, 2010 Through 2020 ............... 14
IV. NP SUPPLY.....................................................................................................................15
A. Estimating the Active Supply of NPs in 2010 .................................................................. 15
B. Projecting the Future Supply of NPs ............................................................................... 15
V. PA SUPPLY .....................................................................................................................17
A. Estimating the Active Supply of PAs in 2010 ............................................................. 17
B. Projecting the Future Supply of PAs........................................................................... 17
VI. PRIMARY CARE DEMAND ............................................................................................19
A. Background ................................................................................................................. 19
B. Estimate of PCP Demand in 2010 ............................................................................... 20
C. Estimating Demand in 2020 ....................................................................................... 20
1.Baseline Patterns of Health Care Use .............................................................................. 20
i. Data Sources ................................................................................................................................... 20
ii. Practitioner-to-Population Ratios .................................................................................................. 22
2.Key Determinants of Future Demand .............................................................................22
i. Population Aging and Growth ....................................................................................................... 23
Projecting the Supply and Demand for Primary Care Practitioners Through 2020 iiii. Health Insurance Coverage ............................................................................................................. 23
iii. Disease Risk Factors: Obesity Rates ................................................................................................. 24
D. Results: Drivers of Projected Future Demand for Primary Care Services................... 25
VII. PROJECTED ADEQUACY OF FUTURE SUPPLY OF PCPs ............................................26
A. Physicians ..................................................................................................................... 26
B. NPs and PAs .................................................................................................................. 26
VIII.DISCUSSION ...................................................................................................................28
A. Geographic Disparities Will Likely Continue .............................................................. 30
B. Limitations of These Projections................................................................................. 30
iii Projecting the Supply and Demand for Primary Care Practitioners Through 2020List of Exhibits
Exhibit 1. Projecting Primary Care Physician Supply .........................................................................8
Exhibit 2. Physician Age Distribution at Completion of Medical School, 2009................................12
Exhibit 3. Average Patient Care Hours Worked per Week: General Internal Medicine ..................14
Exhibit 4. Annual Number of Graduates From NP Programs: Master’s and Post-Master’s
Graduates, 2002 Through 2012 .........................................................................................................16
Exhibit 5. Annual Number of Newly Certified PAs, 2001 Through 2012 .........................................18
Exhibit 6. Estimated Use of PCPs (FTEs) per 100,000 Persons Within Each Age Group, 2010 ........ 22
Exhibit 7. Projected Demand for Primary Care Physicians ..............................................................26
Exhibit 8. Projected Supply and Demand for Primary Care NPs and PAs .......................................27
Projecting the Supply and Demand for Primary Care Practitioners Through 2020 ivList of Acronyms
Acronym Definition
AACN American Association of Colleges of Nursing
AAMC Association of American Medical Colleges
AAPA American Academy of Physician Assistants
AMA American Medical Association
BRFSS Behavioral Risk Factor Surveillance System
CBO Congressional Budget Office
CDC Centers for Disease Control and Prevention
EHR Electronic Health Record
FTE Full-time equivalent
HIT Health information technology
HPSA Health Professional Shortage Area
HRSA Health Resources and Services Administration
NAMCS National Ambulatory Medical Care Survey
NCCPA National Commission on Certification of Physician Assistants
NH Non-Hispanic
NHAMCS National Hospital Ambulatory Medical Care Survey
NIS Nationwide Inpatient Sample
NP Nurse Practitioner
NSSRN National Sample Survey of Registered Nurses
PA Physician Assistant
PCP Primary Care Practitioner
v Projecting the Supply and Demand for Primary Care Practitioners Through 2020I. EXECUTIVE SUMMARY
This study examines the adequacy of the future supply of primary care practitioners (PCPs) to
meet the future demand for primary care services. Data on supply and demand for primary
care services in 2010, with demand adjusted for physician shortages in Health Professional
Shortage Areas (HPSAs), are used as a baseline to project supply and demand in 2020 for
physicians, nurse practitioners (NPs), and physician assistants (PAs). The model assumes
continuation of key trends in service utilization, practitioner practice patterns, and practitioner
production. The model also accounts for aging and population growth and the expansion of
coverage under the Affordable Care Act. The impact of the Affordable Care Act is modeled
under the assumption that all states expand Medicaid. Therefore, the numbers reported here
overestimate the demand for primary care services, until such time as all states fully
implement the law. Projections of demand for each type of practitioner are based on how
these practitioners are currently deployed to provide services.
Demand for primary care services is projected to increase through 2020, due largely to aging
and population growth and, to a much lesser extent, the expanded insurance coverage
implemented under the Affordable Care Act, which includes a number of investments that
strengthen the primary care workforce. Consistent with prior studies, this analysis finds that
demand for primary care physicians will grow more rapidly than the physician supply,
resulting in a projected shortage of approximately 20,400 full-time equivalent (FTE) physicians.
The supply of NPs and PAs, however, is projected to grow rapidly and could mitigate the
projected shortage of physicians if NPs and PAs continue to be effectively integrated into the
primary care delivery system. In order for this integration to occur, patient and health system
acceptance is necessary and the dissemination of more effective models of workforce
deployment must continue. New models that allow for an increased role of NPs and PAs in the
provision of primary care services, such as patient-centered medical homes that emphasize
team-based care, have the potential to help address the projected shortage of primary care
physicians.
Under a scenario assuming full deployment of available NPs and PAs, the projected shortage
of PCPs in 2020 is only 6,400 FTEs. Physicians would remain the dominant provider of
primary care services, decreasing from 77 percent of primary care services in 2010 to 72
percent in 2020.
A. Key Findings
Demand for primary care services is projected to grow, mostly due to population aging and
growth.
• Aging and population growth are projected to account for 81 percent of the change in
demand between 2010 and 2020.
Projecting the Supply and Demand for Primary Care Practitioners Through 2020
1• The remainder of the projected change in demand is associated with the estimated
expansion of health insurance coverage under the full implementation of the Affordable
Care Act, including an assumption that all states expand Medicaid.
Based on current utilization patterns, demand for primary care physicians is projected to
grow more rapidly than physician supply.
• The number of primary care physicians is projected to increase from 205,000 FTEs in 2010
to 220,800 in 2020, an 8-percent increase.
• The total demand for primary care physicians is projected to grow by 28,700, from 212,500
FTEs in 2010 to 241,200 FTEs in 2020, a 14-percent increase.
• Without changes to how primary care is delivered, the growth in primary care physician
supply will not be adequate to meet demand in 2020, with a projected shortage of 20,400
physicians. While this deficit is not as large as has been found in prior studies, the
projected shortage of primary care physicians is still significant.
The primary care NP and PA workforces are projected to grow far more rapidly than the
physician supply.
• The supply of primary care NPs is projected to increase by 30 percent, from 55,400 in 2010
to 72,100 in 2020. The supply of primary care PAs is projected to increase by 58 percent,
from 27,700 to 43,900 over the same period.
• Assuming that NPs and PAs provide the same proportion of services in 2020 that they did
in 2010, the combined demand for NPs and PAs would increase by only 17 percent. If NPs
and PAs are used to provide a greater proportion of primary care services, their projected
demand will be higher.
Increased use of NPs and PAs could somewhat alleviate the projected primary care
physician shortage if they are effectively integrated into the health care delivery system.
Under a scenario in which the rapidly growing NP and PA supply can effectively be
•
integrated, the shortage of 20,400 physicians in 2020 could be reduced to 6,400 PCPs.
• If fully utilized, the percent of primary care services provided by NPs and PAs will grow
from 23 percent in 2010 to 28 percent in 2020. Physicians would remain the dominant
providers of primary care, only decreasing from 77 percent of the primary care services in
2010 to 72 percent in 2020.
Projecting the Supply and Demand for Primary Care Practitioners Through 2020
2B. Conclusions
The extent to which the national supply of PCPs will come close to meeting the national
demand in 2020 will depend on a number of factors. Given the rapid growth in the NP and PA
workforce, as well as ongoing efforts to effectively integrate these providers into the primary
care delivery system, the projected physician shortage could be somewhat alleviated.
Efficient use of NPs and PAs will require patient and health system acceptance and the
continued dissemination of more effective models of workforce deployment. There are
indications of the acceptance of these practitioners by patients.
The projections do not account for new programs and policies included in the Affordable Care
Act. To help strengthen access to the primary care workforce, the Affordable Care Act invests
in health workforce training, including: a $1.5 billion investment in the National Health Service
Corps Scholarship and Loan Repayment programs over five years; a substantial expansion of
Community Health Centers; and $230 million over five years to primarily train medical residents
in community-based settings. The Affordable Care Act also includes incentives that encourage
greater emphasis on initiatives (i.e., Primary Care Medical Homes and Accountable Care
Organizations) which are anticipated to result in more effective use of providers in care delivery.
Such programs and policies are designed to increase the supply of PCPs and increase the
effectiveness of their use through models emphasizing team-based care. Such changes could
further integrate NPs and PAs in the provision of primary care services and have the potential
to somewhat alleviate the projected shortage of primary care physicians.
Finally, the national averages reported here mask substantial distributional disparities across
the United States. It is anticipated that some communities will continue to face significant
shortages. Ensuring patient access to primary care will continue to require programs and
policies to address the maldistribution of the primary care workforce.
Given the importance of access to primary care for an effective health care system, the Health
Resources and Services Administration (HRSA) will continue to monitor the supply and
distribution of PCPs. HRSA also will periodically update these projections as new data and
information become available.
C. Limitations of These Projections
Numerous factors will influence future supply and demand for PCPs. The baseline projections
in this report do not account for new programs and policies that may help grow the supply of
PCPs or reform the health care delivery system. However, these projections do consider the
estimated impact of expanded health insurance coverage associated with full
implementation of the Affordable Care Act.
Further, this study does not address provider shortages at subnational levels of geography.
National projections represent the average adequacy of supply: some areas have a supply of
Projecting the Supply and Demand for Primary Care Practitioners Through 2020
3PCPs well above the national norm or average; other areas have a supply that is inadequate to
meet the need for PCPs. Geographic maldistribution of practitioners will mean some local
areas will face practitioner shortages.
This study assumes that the supply and demand for PCPs was balanced in 2010 except for the
number of physicians that would be needed to de-designate HPSAs. The HPSA shortfall is
used as a proxy for the base-year national shortfall since it is the only federal measure of
shortage available at this time. Shortages may exist in areas that are not designated as HPSAs
or in professions not currently covered by HPSAs (such as NPs and PAs).
Projecting the Supply and Demand for Primary Care Practitioners Through 2020
4II. INTRODUCTION
The availability of primary care services is essential for an effective and efficient health care
system. Having an adequate supply and distribution of well-prepared primary care
practitioners (PCPs) will help ensure the availability of primary care services for the nation. This
study was undertaken to assess whether the future supply of PCPs is likely to be sufficient to
meet the future demand for primary care. In order to make this assessment, the study
examines the projected supply of physicians, NPs, and PAs.
The national demand for primary care services can be defined as the quantity and mix of
services that society is willing to pay for based on population needs, economic constraints
such as income and prices, and technological considerations for what is possible to provide. It
reflects the realities of the current health care system with its reimbursement structure,
incentives and disincentives for health care use and delivery patterns, public expectations, and
other personal and systematic economic considerations.
The demand for primary care practitioners is the number and mix of clinicians needed to meet the
demand for services. Demand for practitioners in specific disciplines is influenced by practitioner
productivity, scope of practice, and the structure and financing of the health care delivery system.
A variety of configurations of PCPs can meet the demand for primary care services.
The development of a baseline for supply and demand is based upon recent patterns of use of
services stratified by population characteristics, trends in the education and training of PCPs
(where 2010 data are not available), and recent practice patterns of current PCPs. Using the
typical projection model method, the study assumes that supply and demand are in balance in
the base year (2010), except for the added demand for the number of primary care physicians
needed to de-designate primary care HPSAs. From this baseline, the study considers a variety
of potential changes in the future and their possible impact on both supply and demand.
Some of these changes can be predicted with reasonable confidence, like the aging of the
population. Others, such as changes in productivity, practice hours, and retirement patterns,
are less certain.
The projections in this report take into consideration the estimated impact of expanded health
insurance coverage associated with the full implementation of the Affordable Care Act,
including an assumption that all states expand Medicaid. However, these projections do not
account for new programs and policies that will help grow the supply of PCPs or reform the
health care delivery system. Many provisions included in the Affordable Care Act, for example,
broad implementation of patient-centered medical homes, are designed to implement change
in the health care delivery system. The impact of such provisions, at this point, is difficult to
quantify in a projection model. Thus, the projection model predicts future demand
fundamentally on the utilization patterns in the delivery system of the recent past for which
there are data.
Projecting the Supply and Demand for Primary Care Practitioners Through 2020
5National projections of supply and demand can assist policymakers and practitioners in
assessing the adequacy of supply for the nation as a whole. National projections, however, do
not reveal problems that exist in specific geographic areas, because they represent the
average adequacy of supply across the nation. While some areas have a supply of PCPs well
above the national average, other areas have a supply that is inadequate to meet the need for
primary care services. Hence, the national projections in this report do not provide a complete
picture of the adequacy of the supply of PCPs needed to ensure patient access to care. More
detailed analysis of the adequacy of supply within local geographic areas—whether counties,
cities, townships, or neighborhoods—is needed to fully understand the adequacy of the
primary care workforce and how that workforce would need to be distributed across the
nation to ensure access.
A. Definition of Primary Care
The Institute of Medicine’s Committee on the Future of Primary Care defined primary care as:
“The provision of integrated, accessible health services by clinicians who are accountable for
addressing a large majority of personal health care needs, developing a sustained partnership
with patients, and practicing in the context of family and community.” 1 Medical specialties
that could meet the criteria for a PCP include general and family medicine, general pediatrics,
general internal medicine, and geriatrics. While the majority of the nation’s hospitalists—
practitioners who mainly provide care to hospitalized patients—are trained in primary care
specialties, they are excluded from practitioner counts in this study because they are not
engaged in activities that meet the definition of primary care. 2 Disciplines generally
considered in the definition of PCPs may include physicians, NPs, and PAs who trained and
practice in primary care specialties.
A broader definition of primary care capacity could consider primary care services provided by
physicians in other specialties. Some examples include internal medicine subspecialists like
cardiologists or endocrinologists with whom a patient may have a long-term relationship and
who may be the primary source of care for a chronic condition. Obstetrician/gynecologists
also provide some primary care services and may be the principal source of care for some
women. Similarly, a certified nurse midwife may provide some primary care for women. While
these practitioners provide important services, this study excludes primary care services
provided by these specialists. On the other hand, many primary care physicians also provide
some specialty services that are often provided by specialists. For this study, these services are
1
Donaldson, M. S., Yordy, K. D., Lohr, K. N., & Vanselow, N. A. (Eds.); Institute of Medicine, Division of Health
Care Services, Committee on the Future of Primary Care. (1996). Primary care: America’s health in a new era.
Washington, DC: National Academy Press. Available online at: www.nap.edu/catalog.php?record_id=5152.
2
Society of Hospital Medicine. (2010, June). 2010 Society of Hospital Medicine media kit. Available online at:
www.hospitalmedicine.org/AM/Template.cfm?Section=Home&CONTENTID=23077&TEMPLATE=/CM/ContentD
isplay.cfm.
Projecting the Supply and Demand for Primary Care Practitioners Through 2020
6implicitly included because it is not possible to estimate the proportion of time primary care
physicians spend providing specialty services.
Projecting the Supply and Demand for Primary Care Practitioners Through 2020
7III. PRIMARY CARE PHYSICIAN SUPPLY
A. Overview of the Supply Model
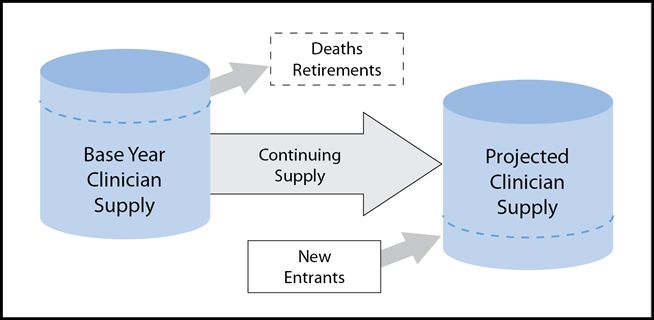
The starting point for projecting future supply is the current supply (see Exhibit 1). Projecting
forward from the baseline, a number of factors are taken into account. Each year, new
physicians enter the workforce after completing the required education and training and after
other physicians retire. In addition, clinicians in the workforce may change their level of
activity (i.e., average hours worked) or their area of practice.
Exhibit 1. Projecting Primary Care Physician Supply
Two measures commonly used to track clinician supply are: (1) the number of clinicians
actively engaged in patient care activities (active supply) and (2) a measure that takes into
account productivity (FTE supply). In this report, both supply and demand projections are
calculated as FTEs rather than as persons or headcounts. For example, a clinician who works
half the time of the typical physician counts as 0.5 FTE.
B. Estimating the Active Supply of Primary Care Physicians in 2010
Estimates of the number of primary care physicians engaged in patient care activities are
based on data from multiple sources. 3 The American Medical Association (AMA) Masterfile,
one of the most complete national sources of information on current physician supply,
contains birth year, sex, self-reported primary specialty, primary activity (e.g., direct patient
care, non-patient care, or resident), and other information. This source provides estimates of
the number of active physicians by self-reported primary specialty, age, and sex.
3
Estimates were developed in collaboration with the Agency for Healthcare Research and Quality, the Office of the
Assistant Secretary for Planning and Evaluation, and the Robert Graham Center, from January through March 2011.
Projecting the Supply and Demand for Primary Care Practitioners Through 2020
8There are limitations to the AMA Masterfile data. For example, there is a time lag between
when a physician’s activity status changes and when the information is updated in the
Masterfile. The AMA updates the Masterfile using multiple sources, including licensure
information, and attempts to contact about one-third of physicians each year. However, if
physicians’ status changes, there can be up to a three-year lag before their information in the
Masterfile is corrected. Additionally, some physicians choose not to respond to AMA’s request
for information, which contributes further to the uncertainty of whether an individual
physician is active or retired. The time lag in updating physicians’ activity status creates the
likelihood that the Masterfile overestimates the supply of active physicians—especially for
older physicians. 4 This study excluded physicians age 75 and older listed as active in the AMA
Masterfile, reflecting concerns about the accuracy of the AMA Masterfile regarding the activity
status of older physicians.
In addition, comparison of physician self-reported activity status in the 2006 AMA Masterfile
with the 2006 Association of American Medical Colleges (AAMC) survey of physicians from 50
to 74 years old suggests that activity status in the Masterfile for some of these physicians may
be incorrect. Some physicians in this age group listed as active in the Masterfile reported in
the AAMC survey that they are currently inactive, and vice versa. 5 The Masterfile lists as active
only physicians working more than 20 hours per week in professional activities. The AAMC
survey collected hours worked data on physicians working fewer than 20 hours. This study
used an algorithm to adjust the estimated number of active physicians in the 2010 Masterfile.
Using logistic regression analysis with activity status from the AAMC survey as the dependent
variable, the analysis determined the probability that each physician age 51 to 74 in the
Masterfile is active based on age, sex, specialty, and activity status in the Masterfile.
Application of this retirement algorithm removes from the Masterfile active physician count
approximately 20,000 physicians primarily engaged in patient care activities. The algorithm
also adds to the count 17,000 physicians listed as “semi-retired” or “retired” (which includes
those working fewer than 20 hours per week in professional activities). 6
Estimates from the Robert Graham Center are that approximately 10,500 primary care
physicians whose status is “unclassified” in the 2010 Masterfile are likely active in patient care.
This analysis used estimates of primary care consistent with the Robert Graham Center’s
supply estimates, and it includes these unclassified physicians in the primary care category. 7
4
Staiger, D. O., Auerbach, D. I., & Buerhaus, P. I. (2009). Comparison of physician workforce estimates and supply
projections. Journal of the American Medical Association, 302(15), 1674–1680.
5
Jewett, E. A., Brotherton, S. E., & Ruch-Ross, H. (2011). A national survey of “inactive” physicians in the United
States of America: Enticements to reentry. Human Resources for Health, 9(7).
6
The appendix of the following report outlines additional detail on applying this type of retirement algorithm: Dill,
M. J., & Salsberg, E. S. (2008). The complexities of physician supply and demand: Projections through 2025.
Washington, DC: Association of American Medical Colleges, Center for Workforce Studies.
7Personalcommunication with Stephen Pettersen and Robert Phillips at the Robert Graham Center on analysis
conducted by the Robert Graham Center regarding the application of the AMA Masterfile to estimation of primary
Projecting the Supply and Demand for Primary Care Practitioners Through 2020
9The analysis classifies physician specialty based on self-reported primary specialty. Physicians
without a reported specialty are proportionally reallocated across the other specialties based
on the specialty distribution within their age, gender, and education type. The AMA Masterfile
only recently added the specialty of “hospitalist” to its survey of physicians, and very few
physicians self-reported as hospitalists. The Society of Hospital Medicine estimates that
among the 28,000 hospitalists in practice in 2010, 82.3 percent are trained in general internal
medicine, 6.5 percent in general pediatrics, 4.0 percent in an internal medicine subspecialty,
3.7 percent in family practice, 3.1 percent in general pediatrics, and 0.4 percent in a pediatrics
subspecialty. 8 Estimates of the specialty distribution for hospitalists, as reported by the Society
of Hospital Medicine, were used to remove hospitalists from the primary care supply estimates.
Finally, estimates of practicing primary care physicians from sample surveys of physicians, in
particular the National Ambulatory Medical Care Survey (NAMCS) and the Health Tracking
Physician Survey, 9 suggest that there may be fewer primary care physicians. That is, additional
physicians classified as active in the Masterfile may be either inactive or no longer practicing in
primary care settings. For example, during the data collection for the NAMCS and the Health
Tracking Physician Survey, a greater proportion of physicians were found to be inactive (e.g.,
retired or deceased) than from initial adjustments to the AMA Masterfile. Others have used
findings from the NAMCS, for example, to adjust estimates from the AMA Masterfile
downward. 10 The NAMCS is an ongoing annual survey that uses the AMA Masterfile for its
sampling frame. Based primarily upon review of this survey, the study reduces the preliminary
estimate from the AMA Masterfile by 8 percent to account for additional inactive and non-
primary care physicians. 11
care physician counts. For more information about the Robert Graham Center, see www.graham-
center.org/online/graham/home.html.
8
Society of Hospital Medicine. (2010, June). Society of Hospital Medicine 2010 media kit. Available online at:
www.hospitalmedicine.org/AM/Template.cfm?Section=Home&CONTENTID=23077&TEMPLATE=/CM/ContentD
isplay.cfm.
9
National Center for Health Statistics, Division of Health Care Statistics. (n.d.). 2008 NAMCS micro-data file
documentation. Hyattsville, MD: Author. Available online at:
ftp://ftp.cdc.gov/pub/Health_Statistics/NCHS/Dataset_Documentation/NAMCS/doc08.pdf; Center for Studying
Health System Change. 2008 Health Tracking Physician Survey. Washington, DC: Author. Available online at:
www.hschange.com/index.cgi?data=04.
10
Colwill, J. M., Cultice, J. M., & Kruse, R. L. (2008, May-June). Will generalist physician supply meet demands of
an increasing and aging population. Health Affairs, 27(3), w232–w241.
11
In reviewing the NAMCS, as well as the Health Tracking Physician Survey, a number of issues were considered.
These surveys use the AMA Masterfile to develop their sampling frames, but data collection for the surveys occurs
between 6 months to a year from when the frame was developed. Thus, for example, some cases out of scope at data
collection (e.g., retired, deceased, unlicensed, or having left the United States) that were active on the frame may
have become out of scope between frame development and data collection. Similarly, with its focus on office-based
practice, some cases in the NAMCS defined as out of scope, such as physicians in institutional settings like school-
based clinics, might appropriately be counted in estimates of PCPs. Nonetheless, even with these qualifications, the
annual NAMCS—coupled with findings in the single Health Tracking Physician Survey—indicated further
Projecting the Supply and Demand for Primary Care Practitioners Through 2020
10After all adjustments were made, the study estimates that there were 205,000 practicing
primary care physicians in 2010. Of these, 91,300 are in family practice, 65,600 in general
internal medicine, 44,800 in pediatrics, and 3,300 in geriatrics.
C. Projecting the Future Supply of Primary Care Physicians
The main drivers of the future number of active practitioners are the number of newly trained
practitioners entering the workforce (entrants) and the number of practitioners leaving the
workforce because of retirement, disability, or death (attrition). The projection also adjusted
for changes over time in physician characteristics that are associated with patient care hours
worked per week.
1. Entrants
Training new practitioners is a vital component of maintaining an adequate long-term supply
of health professionals. This study projects supply using best estimates of the number of new
primary care physicians who will be trained between 2010 and 2020, given current plans by
educational institutions to expand education and training capacity. 12
In order to become a physician licensed to practice medicine in the United States, some
accredited graduate medical education is required. Physicians enter graduate medical
education through one of three routes: graduation from a U.S. school of allopathic medicine
(i.e., U.S.-trained Medical Doctors), graduation from a U.S. school of osteopathic medicine (i.e.,
Doctors of Osteopathic Medicine), or graduation from an international medical school (i.e.,
International Medical Graduates).
The number of physicians beginning their graduate medical education in the United States in
2010 was approximately 26,000—up from around 24,000 in 2004. 13 Using graduate medical
education completion data published from the AMA and American Osteopathic Association
statistics, the study calculates that the nation produces approximately 8,700 primary care
physicians annually, with the number projected to rise slightly each year over the next
decade. 14,15
downscaling of the physician estimate was appropriate. Depending on the categories out of scope in these surveys,
the estimate of primary care physicians in 2010 ranges between 200,000 and 210,000.
The midpoint of this range represents an 8-percent reduction to the preliminary estimate, yielding a final estimate of
205,000 for a baseline in modeling projections.
12
Association of American Medical Colleges, Center for Workforce Studies. (2009, May). Medical school enrollment
plans through 2013: Analysis of the 2008 AAMC survey. Washington, DC: Author.
13
Brotherton, S. E., & Etzel, S. I. (2010). Graduate medical education, 2009-2010. Journal of the American Medical
Association, 304(11), 1255–1270.
14
Jolly, P., Erikson, C. & Garrison, G. (2013). U.S. graduate medical education and physician specialty choice.
Academic Medicine, 88(4), 468-474.
Projecting the Supply and Demand for Primary Care Practitioners Through 2020
11The distribution of sex and specialty choice of new entrants to the physician workforce is
modeled using recently published data for Accreditation Council for Graduate Medical
Education programs. 16 The age distribution of physicians completing medical school in 2009
comes from the Medical School Graduation Questionnaire: 2013 All Schools Summary
Report. 17 When the age distribution of physicians completing graduate medical education is
calculated (see Exhibit 2), the study adds the average post-graduate training
(residency/fellowship) duration to the age distribution. This simplifying assumption may
misrepresent the actual age distribution of new physicians for some specialties to the extent
that older medical school graduates, for example, are more likely to choose a specialty with a
shorter residency.
Exhibit 2. Physician Age Distribution at Completion of Medical School, 2009
16%
14%
12%
Percentage of Graduates
10%
8%
6%
4%
2%
0%
25 26 27 28 29 30 31 32 33 34 35 36 37 38 39 40
Age at Completion of Medical School
Data Source: AAMC Medical School Graduation Questionnaire: 2013 All Schools Summary Report.
15
DeRosier, A. & Lischka, T.A. (2012). Osteopathic graduated medical education 2012. Journal of the American
Osteopathic Association, 112(4), 196-203.
16
Brotherton, S. E., & Etzel, S. I. (2010). Graduate medical education, 2009-2010. Journal of the American Medical
Association, 304(11), 1255–1270.
17
Association of American Medical Colleges. Medical School Graduation Questionnaire: 2013 All schools summary
report. (2013). Washington, DC: Author. Available online at:
www.aamc.org/download/350998/data/2013gqallschoolssummaryreport.pdf.
Projecting the Supply and Demand for Primary Care Practitioners Through 2020
122. Retention
In some medical specialties, a relatively large proportion of physicians are approaching
traditional retirement age. The 2006 AAMC Survey of Physicians Over Age 50 collected
information on age of retirement (if retired) or age expecting to retire (if still active). Historical
retirement rates and expected retirement rates by physician age, sex, and medical specialty are
calculated using these data. These rates are combined with data on mortality rates for men
and women in the United States obtained from the Centers for Disease Control and Prevention
(CDC). The mortality rates take into consideration that people in professional occupations
tend to have lower mortality rates through age 65, as compared with national mortality rates. 18
Age-adjusted mortality rates for White males in professional and technical occupations are
approximately 25 percent lower than national rates; for White females, the mortality rates for
professional and technical occupations are 15 percent lower than overall rates.
3. Projected Changes in Patient Care Hours Worked
The study adjusts average hours worked for changes over time in the distribution of physician
age and sex, because these characteristics are associated with the average patient care hours
worked per week. Average hours tend to be lower for women than for men, especially during
child-rearing ages. While hours worked by male physicians start to decline in the late 50s, the
decline for women, on average, starts in the early 60s.
Physician-level data on patient care hours worked per week comes from two sources: (1) the
2006 AAMC Survey of Physicians Over Age 50, which provided information for approximately
9,000 respondents, and (2) a survey sponsored by HRSA during 2002 and 2003, which collected
information for approximately 46,800 physicians. The AAMC survey data are used for the
specialties in which the AAMC oversampled physicians and for physicians older than age 50.
For all other specialties and for physicians younger than age 50, the study uses data from the
HRSA-sponsored survey. Data are unavailable for geriatric medicine, so the study assumes that
patterns of hours worked in geriatric medicine are similar to patterns for general internal
medicine.
Dividing average hours worked by practitioners of a given age and sex by the average hours
worked in that profession provides an estimate of the average FTE by demographic group.
When general internists are used as an example, the patient care hours in the profession average
about 45 hours per week (see Exhibit 3). Men age 50 to 54 work, on average, 53 patient care
hours per week (or approximately 18 percent higher than the overall average of 45), while men
age 70 to 74 who are still working average 34 patient care hours per week (or 75 percent of the
average). Therefore, when FTEs for general internal medicine are calculated in this example, the
study counts each male physician age 50 to 54 as 1.18 FTE and each male physician age 70 to 74
18
Johnson, N. J., Sorlie, P. D., & Backlund, E. (1999). The impact of specific occupation on mortality in the U.S.
National Longitudinal Mortality Study. Demography, 36(3), 355–367.
Projecting the Supply and Demand for Primary Care Practitioners Through 2020
13as 0.75 FTE. This approach adjusts the FTE count over time as the demographic composition of
the health workforce changes.
Exhibit 3. Average Patient Care Hours Worked per Week: General Internal Medicine
1.4
1.18
1.2
1.10 1.14
Average Patient Care Hours per Week
1.07 Males
1.04 1.06 FTE = 45 hours/week
1.0
0.96 Females 0.90
0.91
0.86 0.94
0.8 0.82 0.84
0.76 0.75
0.6
0.54
0.4
0.2
0.0IV. NP SUPPLY
A. Estimating the Active Supply of NPs in 2010
Approximately 55,400 NPs were clinically active in primary care in 2010. Estimates were
derived from analysis and comparison of data from multiple sources, because there is no
single comprehensive source of data on NPs. Estimates of clinically active NPs and the
proportion practicing in primary care generated using the 2008 National Sample Survey of
Registered Nurses (NSSRN) were similar to those recently reported by the Agency for
Healthcare Research and Quality. 19 Based on the 2008 NSSRN, projected forward to 2010, it is
estimated that there were approximately 110,800 clinically active NPs, of which half (55,400)
were practicing in primary care.
B. Projecting the Future Supply of NPs
According to the American Association of Colleges of Nursing (AACN), more than 11,100 NPs
graduated at the master’s or post-master’s level in academic year 2009 to 2010. This number
increased to more than 14,400 in 2012. 20 Moreover, the number of NP graduates has increased
steadily over the past eight years and more than doubled between 2002 and 2012 (see Exhibit
4). An analysis performed by HRSA’s National Center for Health Workforce Analysis (the
National Center) suggests that a portion of newly trained NPs may not practice in the NP role,
instead serving in registered nursing positions not requiring NP training. The current study
projects a moderation of the recent rapid growth. It further estimates that 50 percent of these
NPs will practice in primary care specialties. 21
19
Agency for Healthcare Research and Quality. (2011, October). The number of nurse practitioners and physician
assistants practicing primary care in the United States: Primary care workforce facts and stats no. 2 (AHRQ
Publication No. 12-P001-3-EF). Rockville, MD: Author. Available online at: www.ahrq.gov/research/pcwork2.pdf
20
Fang, D., Tracy, C., & Bednash, G. D. (2012). 2011-2012 enrollment and graduations in baccalaureate and
graduate programs in nursing. Washington, DC: American Association of Colleges of Nursing.
21
Analysis of the 2008 National Sample Survey of Registered Nurses by HRSA’s National Center. See also Health
Resources and Services Administration. (2010, September). Advanced practice registered nurses [Chapter 5]. In The
registered nurse population: Findings from the 2008 National Sample Survey of Registered Nurses. Rockville, MD:
Author. Available online at: http://bhpr.hrsa.gov/healthworkforce/rnsurveys/rnsurveyfinal.pdf; Agency for
Healthcare Research and Quality. (2011, October). The number of nurse practitioners and physician assistants
practicing primary care in the United States: Primary care workforce facts and stats no. 2 (AHRQ Publication No.
12-P001-3-EF). Rockville, MD: Author. Available online at: www.ahrq.gov/research/pcwork2.pdf.
Projecting the Supply and Demand for Primary Care Practitioners Through 2020
15Exhibit 4. Annual Number of Graduates From NP Programs: Master’s and Post-Master’s
Graduates, 2002 Through 2012
15,500
14,409
14,500
13,500
12,500
12,273
11,500
11,135
10,500
9,500
9,698
8,865
8,500
8,014
7,500
6,526 7,583
6,500
6,979 6,611 6,900
5,500
2002 2003 2004 2005 2006 2007 2008 2009 2010 2011 2012
Data Source: HRSA compilation of data from the AACN Annual Survey (in collaboration with the National
Organization of Nurse Practitioner Faculties for collection of nurse practitioner data). Note: Counts include
master’s and post-master’s degree NP and NP/clinical nurse specialist graduates as well as bachelor’s-to-
doctorate of nursing practice graduates.
In total, the supply of NPs delivering primary care is projected to increase by 30 percent, from
55,400 in 2010 to 72,100 in 2020. This is an increase of 16,700 practitioners.
Projecting the Supply and Demand for Primary Care Practitioners Through 2020
16V. PA SUPPLY
A. Estimating the Active Supply of PAs in 2010
There were an estimated 27,700 PAs clinically active in primary care in 2010. This estimate is
based on the 2008 American Academy of Physician Assistants (AAPA) Physician Assistant
Census. It is projected forward to 2010 based on the addition of approximately 12,000 new
graduates over the two years and the subtraction of 3 percent of PAs annually for expected
attrition. Of the 84,000 PAs the current study estimates as clinically active in 2010,
approximately one-third (27,700) are in primary care, and two-thirds (56,300) are in non-
primary care specialties.
B. Projecting the Future Supply of PAs
The projection assumes that the number of new PA graduates will increase by 200 annually,
from approximately 6,000 in 2010 to 8,000 by 2020. 22 The number of accredited PA programs
has steadily risen over the past decade from 134 in 2003 to 173 in 2013, with anticipated
additional growth in the near future. 23 The number of certified PAs has also risen over the past
decade (see Exhibit 5). Approximately one-third of new PA graduates are assumed to enter a
primary care specialty. 24
22
In 2006, there were an estimated 4,800 new PA graduates, growing to about 6,000 in 2010, representing a mean
annual increase in new graduates of 240. A constant increase of 200 new graduates annually was applied in the
projection with the assumption that the rate of growth between 2006 and 2010 may decline slightly after 2010. See
Physician Assistant Education Association. (2010, October). 26th annual report on physician assistant educational
programs. Presentation on preliminary data, 2009-2010. Baltimore, MD: Author. Available online at:
www.paeaonline.org/index.php?ht=a/GetDocumentAction/i/114396; Physician Assistant Education Association.
(2008). 23rd annual report on physician assistant educational programs in the United States, 2006-2007 (p. 52).
Alexandria, VA: Author. Available online at: www.paeaonline.org/index.php?ht=a/GetDocumentAction/i/3520.)
23
Program data from the Accreditation Review Commission on Education for the Physician Assistant, Inc. are
available online at: www.arc-pa.org/acc_programs/program_data.html.
24
From a sample of PAs, AAPA estimated the universe of PAs around 83,500 in 2010, of which 31 percent were in
primary care with 2 percent with specialty unknown. (American Academy of Physician Assistants. (2011). Physician
assistant census report: Results from the 2010 AAPA census. Alexandria, VA: Author. Available online at:
www.aapa.org/uploadedFiles/2010%20Census%20Report%20National%20_Final.pdf.)
Projecting the Supply and Demand for Primary Care Practitioners Through 2020
17Exhibit 5. Annual Number of Newly Certified PAs, 2001 Through 2012
7,000
6,479
6,500
5,979
6,000
5,823
5,500
4,989 5,243
5,000
4,337 4,393 5,215
4,500
4,235 4,654
4,512
4,000
4,009
3,500
3,000
2001 2002 2003 2004 2005 2006 2007 2008 2009 2010 2011 2012
Data Source: National Commission on Certification of Physician Assistants (NCCPA), “Certified Physician Assistant
Population Trends”; 2012 data from personal communication with NCCPA, January 16, 2013.
Taking new graduates into account, the supply of PAs delivering primary care is projected to
increase by 58 percent, from 27,700 in 2010 to 43,900 in 2020.
Projecting the Supply and Demand for Primary Care Practitioners Through 2020
18VI. PRIMARY CARE DEMAND
A. Background
The national demand for primary care services can be defined as the quantity and mix of
services that society is willing to pay for based on population needs, economic constraints
such as income and prices, and technological considerations of what is possible to provide.
The demand for primary care practitioners (PCPs) is the number and mix of clinicians needed to
meet the demand for services. Therefore, practitioner productivity, scope of practice, and how the
health care system is structured for care delivery influence the demand for practitioners in specific
disciplines. In reality, different configurations and mixes of PCPs can meet demand for primary
care services. This study projects future demand for primary care services using the current
utilization patterns and rates by population characteristic. Those estimates are then used to
project the demand for PCPs. Both the demand for services and the resulting demand for
practitioners are influenced by the complex interaction of the following determinants:
Population needs are highly correlated with demographics such as the size and age of the
population and the prevalence of chronic conditions. Projected increases in population,
especially growth in the older population, portends strong growth in demand for primary
care services for adults. Geographic variation and trends over time in chronic diseases and
risk factors (e.g., obesity) affect the need for primary care services.
Economic constraints and prices affect the ability and willingness of consumers to pay for
services and influence how the health care system evolves to provide such services.
Expanded health insurance coverage that will occur because of the Affordable Care Act is
anticipated to increase demand for primary care services by reducing financial barriers to
accessing care.
Technological and medical innovations influence the services provided and care delivery.
Since many medical advances improve survival and lifestyle for those with chronic illness,
demand will likely increase. At the same time, advances in technology could increase
practitioner productivity, requiring fewer practitioners to care for a given population.
System-induced demand is the portion of health care use generated by health care
practitioners that includes practitioner referrals for tests, procedures, and follow-up visits. 25
25
According to findings from the 2007 NAMCS, in 67.6 percent of all visits to physician offices, the patient was to
return for another visit at a specified time. The visit disposition in 25.1 percent of the visits was to return if needed,
while in 7.4 percent of the visits, the patient was referred to another physician. See Hsiao, C. J., Cherry, D. K.,
Beatty, P. C., & Rechtsteiner, E. A. (2010). National Ambulatory Medical Care Survey: 2007 summary. National
health statistics reports (No. 27, Table 27). Hyattsville, MD: National Center for Health Statistics.
Projecting the Supply and Demand for Primary Care Practitioners Through 2020
19 Public perceptions and expectations regarding appropriate use of health care services
and the ability of health care to improve health influence the public’s demand for services.
B. Estimate of PCP Demand in 2010
The typical projections methodology used in this study assumes supply equals demand in the
base year. This methodology was modified to account for unmet need in primary care HPSAs.
It is estimated that there were 205,000 primary care physicians in 2010. The estimated
shortfall of 7,500 primary care physicians needed to de-designate primary care HPSAs was
added,26 yielding a demand of 212,500 physicians in 2010. The current shortfall is assumed to
be for general practice, family medicine, and general internal medicine.27,28
Consistent with the projections methodology, the supply of NPs and PAs in 2010 is assumed to
be equal to the demand for these practitioners. Therefore, 2010 demand for NPs is set at
55,400 and 27,700 for PAs.
C. Estimating Demand in 2020
Drivers of the projected demand for primary care services in 2020 include population growth
and associated demographic changes. Drivers also include the expanded health insurance
coverage that will result from the implementation of the Affordable Care Act in 2014. Before
projections of future demand, a number of analyses were performed to understand the
components of demand for primary care services in the base year.
1. Baseline Patterns of Health Care Use
i. Data Sources
Current patterns of health care use and delivery provide a starting point for understanding
demand for primary care services. Using national data sources, the study estimates the
proportion of primary care clinician time spent providing care to different subsets of the
population in different health care delivery settings: (1) visits to practitioner offices and
community health centers; (2) visits to hospital/clinic outpatient, emergency departments; and
(3) hospital rounds. A small portion of care is provided in other settings (e.g., nursing homes
and home health).
Data sources for analyzing encounter rates by patient characteristics include the 2005 to 2007
NAMCS, 2005 to 2007 National Hospital Ambulatory Medical Care Survey (NHAMCS), and 2007
26For information on HPSA designation, see www.hrsa.gov/shortage.
27
Freed, G. L., & Stockman, J. A. (2009). Oversimplifying primary care supply and shortages. Journal of the
American Medical Association, 301(18), 1920–1922.
28
Shipman, S. A. (2010, February). Attempting to meet our nation’s pediatric workforce needs. Pediatric Annals,
39(2), 89–96.
Projecting the Supply and Demand for Primary Care Practitioners Through 2020
20Nationwide Inpatient Sample (NIS). 29 Rather than focusing on total encounters, the analysis
estimated the proportion of office-based services provided to each population defined by
seven age groups, sex, four race/ethnicity groups, and three insurance categories. 30 This usage
information, combined with estimates of the number of FTE primary care clinicians providing
office-based care (discussed later), forms the basis for constructing national practitioner-to-
population ratios.
Many physicians trained in primary care participate in patient care activities outside of office
visits—such as hospital rounds and ambulatory visits in clinics, hospital outpatient clinics,
emergency departments, and urgent care centers. The analysis utilizes patient diagnosis
codes and demographics found in the NIS (used to model hospital inpatient care) and the
NHAMCS (used to model hospital outpatient and emergency care) for its estimates. With these
data, the analysis estimates the patients most likely to be seen in the hospital by a family
practitioner or general internist, a pediatrician, or a geriatrician. This information, in
combination with estimates of the portion of physician time spent in hospital rounds and
hospital outpatient or emergency departments, informed the estimates of practitioner-to-
population ratios for inpatient care and for outpatient/emergency-based care.
Information from the following sources contributed to the estimate of the average proportion
of time physicians spend providing care in different settings:
• The Medical Group Management Association’s Physician Compensation and Production
Survey (2009 report based on 2008 data), which contains information on average volume
of services provided in each setting;
• The American Board of Internal Medicine’s Practice Characteristics Survey combined across
multiple years, which provides estimates of the proportion of physician time engaged in
different care activities; and
• AMA’s 2003 Physician Socioeconomic Statistics, which provides estimates of the amount of
time and services provided in different care delivery settings.
29
National Center for Health Statistics (NCHS), Division of Health Care Statistics. National Ambulatory Medical
Care Survey. Hyattsville, MD: Author. Available online at: www.cdc.gov/nchs/ahcd.htm. See also National Center
for Health Statistics, Division of Health Care Statistics. (n.d.). National Hospital Medical Care Survey. Hyattsville,
MD: Author. Available online at: www.cdc.gov/nchs/ahcd.htm and Agency Healthcare Research and Quality,
Healthcare Cost and Utilization Project. Nationwide Inpatient Sample. Rockville, MD: Author. Available online at:
www.hcup-us.ahrq.gov/nisoverview.jsp.
30
The age categories are 0 to 5, 6 to 17, 18 to 20, 21 to 44, 45 to 64, 65 to 74, and 75 years and older. The
race/ethnicity categories are non-Hispanic (NH) White, NH Black, NH other, and Hispanic. The insurance categories
are commercially insured under age 65, publically insured (with the age 65 and older population primarily consisting
of Medicare patients), and uninsured.
Projecting the Supply and Demand for Primary Care Practitioners Through 2020
21You can also read