Quarterly Energy Dynamics - Q3 2020 Market Insights and WA Market Operations - AEMO
←
→
Page content transcription
If your browser does not render page correctly, please read the page content below

Quarterly
Energy
Dynamics
Q3 2020

Market Insights and WA Market Operations
Important notice

PURPOSE
AEMO has prepared this report to provide energy market participants and governments with information on
the market dynamics, trends and outcomes during Q3 2020 (1 July to 30 September 2020). This quarterly
report compares results for the quarter against other recent quarters, focusing on Q2 2020 and Q3 2019.
Geographically, the report covers:
• The National Electricity Market – which includes Queensland, New South Wales, the Australian Capital
  Territory, Victoria, South Australia and Tasmania.
• The Wholesale Electricity Market operating in Western Australia.
• The gas markets operating in Queensland, New South Wales, Victoria and South Australia.

DISCLAIMER
This document or the information in it may be subsequently updated or amended. This document does not
constitute legal or business advice, and should not be relied on as a substitute for obtaining detailed advice
about the National Electricity Law, the National Electricity Rules, the Wholesale Electricity Market Rules, the
National Gas Law, the National Gas Rules, the Gas Services Information Regulations or any other applicable
laws, procedures or policies. AEMO has made every effort to ensure the quality of the information in this
document but cannot guarantee its accuracy or completeness.
Accordingly, to the maximum extent permitted by law, AEMO and its officers, employees and consultants
involved in the preparation of this document:
• make no representation or warranty, express or implied, as to the currency, accuracy, reliability or
  completeness of the information in this document; and
• are not liable (whether by reason of negligence or otherwise) for any statements or representations in this
  document, or any omissions from it, or for any use or reliance on the information in it.

VERSION CONTROL
 Version        Release date              Changes

 1              21 October 2020

© 2020 Australian Energy Market Operator Limited. The material in this publication may be used in
accordance with the copyright permissions on AEMO’s website.
Executive summary
     East coast electricity and gas highlights
     Wholesale electricity and gas market price decline continues
     •     Mainland National Electricity Market (NEM) spot electricity prices 1 declined by 45-48% compared to Q3
           2019, reaching the lowest Q3 level since 2014.
          −     Queensland’s quarterly average price of $32 per megawatt hour (MWh) represents its lowest Q3
                level since 2014, and the lowest NEM mainland quarterly price since Q2 2015.
          −     Drivers included a shift in offers from black coal-fired generators to lower prices, falling gas prices,
                increased variable renewable energy (VRE) output, and a 1.4% reduction in operational demand.
     •     Wholesale gas market prices reduced almost 50% compared to Q3 2019, reaching the lowest Q3 level
           since 2015. The Gas Supply Hub (GSH) price of $3.85 per gigajoule (GJ) was its lowest quarterly average
           since Q4 2015, while the Victorian price of $4.57/GJ was its lowest since Q1 2016. Drivers included:
          −     A continuation of comparatively low international oil and gas prices, which have influenced domestic
                gas market offers. Low Asian Japan Korea Marker (JKM) gas prices at the end of Q2 and into Q3
                2020 are inputs into the Australian Competition and Consumer Commission’s (ACCC’s) average
                netback price, which fell to $2.60/GJ, its lowest level since reporting commenced.
          −     A 5% reduction in east coast gas demand compared to Q3 2019, due to reduced levels of liquefied
                natural gas (LNG) export (-11 PJ), as well as lower gas-powered generation (GPG) (-9 PJ). Australia
                Pacific LNG (APLNG) recorded the main reduction in flows to Curtis Island for LNG export, with both
                its major customers declaring downward quantity tolerance for 2020 2.

     Reduced energy demand in Victoria
     •     In Victoria, a combination of strict COVID-19 restrictions and mild weather in the second half of the
           quarter resulted in a 90 MW average reduction in underlying electricity demand3 in Victoria compared
           to a 5 MW reduction for the remainder of the NEM. COVID-19 influenced the demand shape, with a
           significant reduction in the morning peak between 0600 and 0800 hrs, partially offset by small increases
           in daytime demand and a higher evening peak.
     •     Victoria’s gas demand profile was also affected, most noticeably on cold days with high heating
           demand. On those days the morning peak occurred two hours later in the day, and remained high
           during the day, although overnight demand was lower than in previous years.
          −     Additional operational and market measures, such as the use of the Dandenong LNG, were required
                to manage this increased daytime demand.

1
    Uses the time-weighted average which is the average of spot prices in the quarter and is directly comparable to the swap contract price in the wholesale
     market. The Australian Energy Regulator (AER) reports the volume-weighted average price which is weighted against demand in each 30 minute trading
     interval and is an indicator of total market costs in the quarter.
2
    Origin Energy, 2020 Full Year Results: https://www.originenergy.com.au/content/dam/origin/about/investors-
     media/presentations/200820_FY20_investor_pres_final.pdf.
3
    Underlying demand means all the electricity used by consumers, which can be sourced from the grid but also, increasingly, from other sources including
     consumers’ rooftop photovoltaic (PV) and battery storage.

© AEMO 2020 | Quarterly Energy Dynamics Q3 2020                                                                                                                3
Other highlights
• New minimum operational demand records were set in South Australia (379 megawatts [MW]) and
Victoria (3,073 MW)4, largely due to increased penetration of distributed photovoltaic (PV), with
installations continuing at record levels.
• Hydro generation declined to its lowest Q3 level since 2008, driven by dry Tasmanian conditions which
limited hydro output in the region.
• NEM-wide solar and wind curtailment increased to almost 6% of total VRE output. Increases were driven
by new North Queensland system strength arrangements (which were subsequently triggered by a
series of plant outages), as well as increased economic curtailment in response to negative spot prices
(which occurred at the highest quarterly level on record).
Western Australia electricity and gas highlights
• The WEM recorded two new all-time minimum demand records, with operational demand falling to
1,037 MW on Saturday 12 September and falling again to 999 MW the next day (136 MW lower than the
previous record set in Q1 2020).
• Growth in VRE output and distributed PV continued to displace coal-fired and gas-powered generation.
− Compared with Q3 2019, increases in distributed PV generation (+28 MW on average) drove lower
average operational demand (-23 MW).
− Combined increases in average generation from large-scale wind and solar (69 MW and 13 MW
respectively) and distributed PV displaced generation from coal (-40 MW) and gas (-64 MW).
• The Balancing Price cleared at the floor price of -$1,000/MWh on two occasions (for six Trading
Intervals). The only other occurrence of floor prices was for three Trading Intervals in Q3 2019.
• Between Q3 2019 and Q3 2020, increases in average Balancing Prices largely occurred during evening
peaks, with midday Balancing Prices remaining low.
• Gas consumption remained the same as Q3 2019, driven by relatively small changes in temperature,
while production decreased by 7% due to facility outages.
4
These records have since been broken in Q4 2020.
© AEMO 2020 | Quarterly Energy Dynamics Q3 2020 4Contents Executive summary 3 East coast electricity and gas highlights 3 Western Australia electricity and gas highlights 4 1. NEM market dynamics 6 1.1 Weather 6 1.2 Electricity demand 6 1.3 Wholesale electricity prices 10 1.4 Electricity generation 14 1.5 Inter-regional transfers 23 1.6 Power system management 25 2. Gas market dynamics 29 2.1 Gas demand 29 2.2 Wholesale gas prices 31 2.3 Gas supply 33 2.4 Pipeline flows 35 2.5 Gas Supply Hub 36 2.6 Pipeline capacity trading and day ahead auction 36 2.7 Gas – Western Australia 37 3. WEM market dynamics 39 3.1 Weather and electricity demand 39 3.2 Record Demand 40 3.3 Electricity generation 40 3.4 Wholesale electricity prices 42 3.5 WEM COVID-19 impacts 45 Abbreviations 48 © AEMO 2020 | Quarterly Energy Dynamics Q3 2020 5
1. NEM market dynamics
1.1              Weather
The weather over the quarter was warmer than average across all east coast capitals apart from Hobart
(Figure 1). Average minimum temperatures in Sydney and Melbourne were around 0.2°C above the 10-year
average, resulting in small reductions in heating requirements.
Tasmania experienced very dry conditions during the quarter, largely driven by below average rainfall in July
and September5, while rainfall in Victoria was also below average.
                 Warmer average mainland temperatures in Q3 2020
Average minimum temperature variance by capital city – Q3 2020 vs 10-year Q3 average

                1.0

                0.5
          °C

                0.0

               -0.5
                                 BRI                    SYD                     MEL                     ADL                HOB

                                            Q3 20 vs Q3 19                              Q3 20 vs 10yr average

Source: Bureau of Meteorology

1.2              Electricity demand
In Q3 2020, NEM average operational demand decreased by 313 MW (-1.4%) compared to Q3 2019, due to
increased distributed PV6 (+218 MW) and reduced underlying demand (-95 MW, Figure 2).
This year, record uptake of distributed PV during the COVID-19 pandemic7 has accelerated the declining
daytime demand trend. Compared to Q3 2019, New South Wales distributed PV output increased the most
on an absolute basis (+75 MW on average), while South Australia increased the most as a proportion of
underlying demand (2%, more than double the next highest region).

5
    Bureau of Meteorology 2020, Tasmania in July 2020: http://www.bom.gov.au/climate/current/month/tas/archive/202007.summary.shtml
6
    Increased distributed PV generation results in reduced operational demand because distributed PV is behind the meter
7
    Clean Energy Regulator 2020, Quarterly Carbon Market Report – June Quarter 2020:
     http://www.cleanenergyregulator.gov.au/DocumentAssets/Documents/QCMR%20June%20Quarter%202020.pdf

© AEMO 2020 | Quarterly Energy Dynamics Q3 2020                                                                                       6
With small changes in heating requirements compared to Q3 2019, changes in underlying demand were
mostly driven by the continuing impacts of the response to the COVID-19 pandemic:
• Victoria, with the strictest COVID-19 restrictions in place and mild weather in the second half of the
quarter, recorded the largest reduction in underlying demand (-90 MW on average), followed by
Queensland (-52 MW). Section 1.2.1 provides further details on the COVID-19 related impact on Victorian
electricity demand.
• South Australia’s underlying demand increased by 52 MW on average, driven by COVID-19 related
increases in residential heating, and higher industrial load.
• COVID-19 influenced the demand shape, with a significant reduction in the morning peak between
0600 hrs and 0800 hrs, partially offset by small increases in daytime demand and a higher evening peak.
NEM operational demand down 1.4%
Change in NEM-average operational demand by time of day (Q3 2020 versus Q3 2019)
400
200
0
Average change (MW)
-200
-400
-600
-800
Underlying demand Distributed PV Operational demand
-1000
00:30 02:30 04:30 06:30 08:30 10:30 12:30 14:30 16:30 18:30 20:30 22:30
Table 1 Average change in underlying demand, distributed PV, operational demand – Q3 20 vs Q3 19
Average MW Queensland New South Wales Victoria South Australia Tasmania
Operational demand -115 -89 -136 +20 +7
Underlying demand impact -52 -14 -90 +52 +9
Distributed PV impact -63 -75 -46 -32 -2
© AEMO 2020 | Quarterly Energy Dynamics Q3 2020 7Maximum and minimum demand
Table 2 outlines the maximum and minimum demands which occurred in Q3 2020. During the quarter, new
minimum demand records were set in South Australia and Victoria 8:
• Victoria’s new minimum demand record of 3,073 MW occurred at 1300 hrs on Sunday 6 September 2020,
and was 144 MW lower than the previous record set during Q4 2017.
− During this trading interval, distributed PV provided an estimated 1,408 MW of output (31% of
underlying demand), and mild conditions meant there was very little heating load.
− AEMO’s modelling suggests that COVID-19 related measures made a small contribution to setting this
new minimum demand record.
• South Australia’s new minimum demand record of 379 MW occurred at 1300 hrs on Sunday
13 September 20208, and was 79 MW lower than the previous record set during Q4 2019.
− Drivers were similar to the Victorian record, with distributed PV providing an estimated 923 MW of
output (71% of underlying demand).
− South Australian minimum demands have declined steadily since 2012 (Figure 3).
In addition, a new Q3 maximum demand record of 2,576 MW was set for South Australia at 1900 hrs on
7 August 2020, surpassing the previous record by 46 MW. Drivers of the new record included cold evening
conditions, as well a COVID-19 related estimated 83 MW increase in demand (largely residential).
Table 2 Maximum and minimum operational demand (MW) by region – Q3 2020 vs previous records
Queensland New South Wales Victoria South Australia * Tasmania
Max Min Max Min Max Min Max Min Max Min
Q3 2020 8,143 3,985 11,976 5,727 7,844 3,073 2,576 379 1,661 890
All Q3 8,212 2,972 14,289 5,112 8,351 3,601 2,530 574 1,790 792
All-time 10,044 2,894 14,744 4,636 10,576 3,217 3,399 458 1,790 552
South Australian minimum demand record set at 379 MW
1,200
1,000
800
MW
600
400
200
0
2012 2013 2014 2015 2016 2017 2018 2019 2020
8
These records have since been broken in Q4 2020. As at 20 October 2020, South Australia’s record minimum demand is 300 MW, while Victoria’s is
3,063 MW.
© AEMO 2020 | Quarterly Energy Dynamics Q3 2020 81.2.1 COVID-19 impact on Victorian electricity demand
During Q3 2020, Victoria was the NEM region most impacted by the COVID-19 pandemic, with stage 4
restrictions that came into effect on 5 August requiring many businesses to close. Key impacts on Victorian
demand included:
• Sectoral impacts – during Q3, Victorian large industrial demand continued the trend from Q2 and was
relatively flat. Commercial demand, however, was significantly reduced due to the stage 4 restrictions
(approximately -15%), which more than offset increased residential demand (~10-15%).
• Seasonality – as shown in Figure 4, the COVID-19 influenced change in underlying demand varied
considerably based on the prevailing season:
− During July 2020, cold winter conditions meant that increased daytime residential heating load more
than offset reduced commercial demand. This resulted in an 1.4% increase in underlying demand
compared to July 2019.
− Moving into September 2020, mild weather meant there was less need for residential heating, so the
reduction in commercial demand was the main driver of a 4% fall in underlying demand compared to
September 2019.
• Temperature sensitivity – during stage 4 restrictions, the increased residential proportion of demand
resulted in greater temperature sensitivity. As shown in Figure 5, during cold weather Victoria’s
underlying demand during the pandemic has been higher than pre-pandemic. Conversely, during mild
weather Victorian demand has been at lower levels than pre-pandemic.
COVID-19 reduces Victorian demand; largest impact in September
Change in Victorian-average underlying demand by time of day (Q3 2020 versus Q3 2019)
6%
4%
Average change (MW)
2%
0%
-2%
-4%
-6%
-8%
-10%
00:30 02:30 04:30 06:30 08:30 10:30 12:30 14:30 16:30 18:30 20:30 22:30
Jul Aug Sep
COVID-19 Victorian demand more temperature-sensitive (VIC demand at 1400 hrs)
7,000
Equivalent Months Pandemic Months
6,500
6,000
MW
5,500
5,000
4,500
9 11 13 15 17 19 21 23 25
Temperature (°C)
© AEMO 2020 | Quarterly Energy Dynamics Q3 2020 91.3 Wholesale electricity prices
Mainland NEM average spot electricity prices declined by 45-48% compared to Q3 2019 (Figure 6). Highlights
included:
• South Australia recorded its lowest Q3 average since 2011 ($40/MWh) while its September average of
$15/MWh was its record monthly low.
• Queensland remained the lowest-priced NEM region: its quarterly average price of $32/MWh represents
its lowest Q3 level since 2014, and the lowest NEM mainland price since Q2 2015.
• New South Wales quarterly average ($46/MWh) was the lowest Q3 since 2014.
• The largest reduction in prices by time of day was during the evening peak (down by up to $71/MWh at
1830 hrs) and to a lesser extent the morning peak (Figure 7). Drivers of lower evening peak prices
included:
− Lower-priced offers during the evening peak from GPG, black coal-fired generation, and hydro
generation, influenced by falling gas prices.
− Increased supply from brown coal-fired generation and wind generation during the peak evening
period (Section 1.4).
Drivers of the average spot price reductions compared to Q3 2019 included:
• Fewer unplanned outages of coal-fired generators in New South Wales and Victoria, coupled with a shift
in offers from black coal-fired generators to lower prices (Section 1.4.1). In particular, Mt Piper and Loy
Yang A power stations operated at significantly higher levels than in Q3 2019, with improved coal supply
at Mt Piper and the return to full output of unit 2 at Loy Yang A.
• Increased wind and solar generation, with new capacity driving average output increases of 355 MW.
• Reduced operational demand (-1.4%), with continued increases in distributed PV generation reducing
daytime demand (Section 1.2).
Lowest Q3 NEM prices since Q3 2014
Q3 average spot electricity prices by NEM region
120
2017 2018 2019 2020
100
80
$/MWh
60
40
20
0
QLD NSW VIC SA TAS
© AEMO 2020 | Quarterly Energy Dynamics Q3 2020 10Largest spot price reductions during the evening peak
Mainland NEM average Q3 spot prices by time of day
200
180
160
Average price ($/MWh)
140
120
100
80
60
40
20
0
00:00 02:00 04:00 06:00 08:00 10:00 12:00 14:00 16:00 18:00 20:00 22:00
Q3 2019 Q3 2020
1.3.1 Electricity future markets
During the quarter, NEM electricity futures contract prices traded on the ASX remained at comparatively low
levels compared to recent years. At the end of the quarter, calendar year (Cal) 2021 swap contracts averaged
$54/MWh across New South Wales and Victoria. South Australia recorded the largest decline, of $8/MWh to
finish at $50/MWh, with the decrease coinciding with new constraints on the Heywood interconnector
(Section 1.5) and record negative spot electricity prices in the state (Section 1.3.1). Queensland continued to be
the lowest priced state and finished the quarter at $40/MWh.
ASX Cal21 futures stabilise
ASX Energy – Cal21 swap prices by region – 7-day averages
$90
$80
$70
$60
$/MWh
$50
$40
$30
$20
$10
$0
NSW VIC QLD SA
© AEMO 2020 | Quarterly Energy Dynamics Q3 2020 111.3.2 Negative wholesale electricity prices
During Q3 2020, negative and zero spot prices9 occurred in 4.6% of trading intervals, surpassing the previous
record set in Q2 2020 (3.6%). The occurrence of negative spot prices was most prominent in South Australia
and Queensland, with both states reaching record levels. South Australia’s spot prices were negative 10.2% of
the time, around 4% higher than the previous record in Q3 2019. In Queensland, spot prices were negative
8.5% of the time compared to 4.5% in Q3 2019.
However, the impact of negative prices was less than in Q3 2019. South Australia’s quarterly average price
was lower by $6/MWh due to negative prices, compared to being lower by $8.2/MWh in Q3 2019. Similarly,
Queensland negative spot price impact this quarter was lower, $1.9/MWh compared to $2.7/MWh in Q3 2019.
The reduced impact of negative spot prices on the average price was due to the reduced occurrence of
highly negative prices (that is, prices below -$100/MWh).
Record quarterly negative spot prices in South Australia were driven by increased occurrences in September,
with negative spot prices occurring in 22% of the trading intervals (Figure 9). Drivers included:
• High VRE output – September 2020 was a particularly windy month, as grid-scale VRE exceeded
1,000 MW 47% of the time, compared to 31% in September 2019, and 65% of negative intervals occurring
during periods of high VRE output.
• Directed GPG – in December 2019, the Australian Energy Market Commission (AEMC) introduced a rule
change which removed intervention pricing when units are directed for system security purposes, with
this change (in most circumstances) leading to lower spot prices during directions10. On average, 139 MW
of GPG was directed during negative spot prices during the quarter.
• Reduced daytime demand – increased distributed PV output reduced daytime demand by 34 MW
compared to September 2019 levels, with 76% of negative price intervals occurring during this period.
• Interconnector constraints – Murraylink was binding at its limit more frequently and at lower levels than in
Q3 2019, due to a planned outage, as well as constraints which were invoked on 26 August (until its
outage) while oscillation issues were being investigated11. In addition, a newly introduced reduction in
Heywood’s import limit into Victoria (Section 1.5) further limited electricity transfers from South Australia
to Victoria, contributing to periods of South Australian oversupply.
Record negative price occurrences in South Australia and Queensland
Frequency of negative spot prices in South Australia and Queensland
25%
Negative price occurrence
20%
15%
10%
5%
0%
Nov
Nov
Jul
Jul
Jul
Jul
Sep
Sep
Sep
Sep
Jan
May
Jan
May
Jan
May
Jan
May
Mar
Mar
Mar
Mar
2019 2020 2019 2020
South Australia Queensland
9
Hereafter referred to as negative spot prices
10
When an intervention event brings on additional capacity and counteractions are not implemented, the prices produced by the what-if run will generally
be higher than those produced by the dispatch run. This is because the what-if run will continue to signal the price associated with the supply demand
balance as it was prior to the intervention, while prices in the dispatch run will generally be lower due to the addition of generation capacity.
11
See Market Notice 77189.
© AEMO 2020 | Quarterly Energy Dynamics Q3 2020 121.3.3 Price-setting dynamics
Figure 10 shows price setting results for Q3 2020 compared to recent quarters. Key outcomes included:
• Hydro’s price setting role across the NEM regions declined from an average 35% in Q3 2019 to 21% this
quarter, as hydro generation fell to its lowest level since 2008.
• Black and brown coal increased from a combined average of 38% last in Q3 2019 to 53%, mainly as black
coal shifted an average of 1,281 MW from higher-priced bands to prices below $40/MWh, and spot prices
reduced to levels in which brown coal-fired generation was the marginal unit (typically $0-$20/MWh).
• Grid-scale wind and solar set the spot price 3.3% of the time (combined), the highest level on record.
Hydro’s price setting role declined
Price-setting by fuel type – Q3 2020 versus prior quarters
100%
Percentage of time (%)
80%
60%
40%
20%
0%
Q4 19
Q4 19
Q4 19
Q4 19
Q4 19
Q3 19
Q3 19
Q3 19
Q3 19
Q3 19
Q1 20
Q1 20
Q1 20
Q1 20
Q1 20
Q2 20
Q2 20
Q3 20
Q2 20
Q3 20
Q2 20
Q3 20
Q2 20
Q3 20
Q3 20
QLD NSW VIC SA TAS
Black Coal Brown Coal Gas Hydro Other
Note: price setting can occur inter-regionally: for example, Victoria’s price can be set by generators in other NEM regions.
Figure 11 shows Queensland price setting results for Q3 2020 by time of day. Key outcomes included:
• With the increase in periods of oversupply leading to negative spot prices, grid-scale solar set
Queensland’s midday price around 30% of the time.
• Black coal set the price on average 67% of the time during the day in Q3 2020, while giving way to
grid-scale solar between 1000-1430 hrs (26%), thereafter mainly capturing two blocks 1430-1630 hrs (71%)
and 2130-0600 hrs (81%).
• GPG and hydro’s price setting roles were highest during the peak evening period at 1830 hrs.
Grid-scale solar sets Queensland’s midday price around 30% of the time
Price setting % of time by time of day and fuel type – Queensland Q3 2020
100%
80%
% of time price set
60%
40%
20%
0%
00:30 02:30 04:30 06:30 08:30 10:30 12:30 14:30 16:30 18:30 20:30 22:30
Black coal Brown coal Gas Hydro Solar Wind Other
© AEMO 2020 | Quarterly Energy Dynamics Q3 2020 131.4 Electricity generation
During Q3 2020, the NEM generation mix was shaped by Increased output brown coal and VRE
a combination of reduced operational demand, dry Change in supply – Q3 2020 versus Q3 2019
conditions, and increased supply from lower-priced 400
generation. Figure 12 shows the average change in 300
generation by fuel type compared to Q3 2019, and Figure 200
Average change (MW)
100
13 illustrates the change by time of day. 0
Compared to Q3 2019: -100
-200
• Average brown coal-fired generation rebounded from -300
its lowest quarterly average, driven by higher -400
-500
availability from Loy Yang A following the 2019
Black coal
Wind
Hydro
Distributed PV
Brown coal
Gas
Grid solar
extended outage of unit 2. In contrast, black coal
output declined to its lowest Q3 level since 2014
despite Mt Piper’s rebound following its coal supply
issues in 2019.
• Despite lower gas prices, average GPG output reduced by 436 MW, as it was less required to cover unit
issues at Loy Yang A and Mt Piper, and was displaced by VRE.
• Average hydro generation fell to its lowest Q3 output since 2008. The decline in Tasmanian hydro output
was driven by below average rainfall as the state experienced its second driest July on record12.
Table 3 NEM supply mix by fuel type
Quarter Black coal Brown coal Gas Hydro Wind Grid solar
Q3 2019 52.8% 15.6% 10.4% 8.5% 9.8% 2.6%
Q3 2020 51.9% 17.3% 8.6% 7.8% 11.1% 3.1%
Change -1.0% +1.7% -1.8% -0.7% +1.3% +0.5%
Reduced GPG, black coal and hydro across the day, increased VRE and brown coal
Change in supply – Q3 2020 versus Q3 2019 by time of day
2,000
1,500
1,000
Average change (MW)
500
0
-500
-1,000
-1,500
-2,000
00:00 02:00 04:00 06:00 08:00 10:00 12:00 14:00 16:00 18:00 20:00 22:00
Brown Coal Black Coal Gas Wind Hydro Solar Distributed PV
12
Bureau of Meteorology 2020, Tasmania in July 2020: http://www.bom.gov.au/climate/current/month/tas/archive/202007.summary.shtml
© AEMO 2020 | Quarterly Energy Dynamics Q3 2020 141.4.1 Coal-fired generation
Black coal fleet
During Q3 2020, average black coal generation reduced by 424 MW compared to Q3 2019. Results varied by
state, with average output from the New South Wales fleet increasing slightly (+23 MW), while the
Queensland fleet fell by 447 MW.
Average black-coal fired generation on outage (mostly planned) was 126 MW lower than Q3 2019, with fewer
outages in New South Wales (-509 MW) partially offset by increased outages in Queensland (Figure 14).
Fewer unplanned outages for New South Wales and Victorian coal-fired generators
Average black and brown coal-fired generation on outage by classification – Q3 2019 to Q3 2020
2,500
Planned
2,000
Unplanned
Average MW
1,500
1,000
500
-
Q319 Q419 Q120 Q220 Q320 Q319 Q419 Q120 Q220 Q320 Q319 Q419 Q120 Q220 Q320
NSW Black Coal QLD Black Coal VIC Brown Coal
The overall reduction in black coal-fired generation occurred despite a significant shift of offers into
lower-priced bands. Compared to Q3 2019, an average of 1,281 MW was shifted from higher-priced bands to
prices at or below $40/MWh (Figure 15). The AER will explore in more depth in its upcoming reports13 the
drivers of changes in black coal-fired generation bids.
Black coal-fired generation shifting offers to lower prices
NEM black coal-fired generation bid supply curve – Q3 2020 versus Q3 2019
100
90
Q3 2019 Q3 2020
80
Price ($/MWh)
70
60
50
40
30
20
10,000 10,400 10,800 11,200 11,600 12,000 12,400 12,800 13,200 13,600
Offers (MW)
13
Upcoming Wholesale Markets Quarterly Q3 2020, and Wholesale Electricity Market Performance Report 2020.
© AEMO 2020 | Quarterly Energy Dynamics Q3 2020 15In New South Wales, increased generation from Mt Piper (+598 MW) and Bayswater (+62 MW) more than
offset lower output from Liddell and Eraring (Figure 16). By station:
• Average output at Mt Piper Power Station increased to 1,032 MW, its highest Q3 generation since 2013.
Significantly higher output (+138% on Q3 2019 levels) was predominantly due to the easing of coal
supply constraints that severely impacted output in Q3 2019. This was reflected in its availability, with Mt
Piper’s average days on outage falling from 31 days in Q3 2019 to 3 days in Q3 2020.
• Increased outages (57% planned, 43% unplanned) at Liddell Power Station reduced output by 480 MW
on average, its lowest Q3 output since 2014. On average, Liddell units were out of service for 33 days
compared to 10 days in Q3 2019.
Average Queensland black coal output this quarter reduced to 5,056 MW, its lowest Q3 generation since
2014. Increased outages across all power stations apart from Kogan Creek and continued displacement by
solar and gas were the main drivers for lower output. By station:
• Planned outages at Callide Power Station and displacement by solar reduced coal output by 477 MW.
• Output at Kogan Creek Power Station increased by 575 MW on average, up from historically low levels in
Q3 2019. This was mainly due to no repeat of the major outage in Q3 2019.
Brown coal fleet
Average brown coal-fired generation increased by 317 MW compared to Q3 2019, mainly due to higher
availability at Loy Yang A, which led to a 447 MW output increase. This was partially offset by decreased
output at Loy Yang B (-35 MW) and Yallourn Power Station (-126 MW) due to increased outages – Yallourn
also had a high number of unplanned outages in Q3 2019. Yallourn Unit 1 has been on a planned
maintenance outage since 3 July 2020 and remained out of service at the end of the quarter.
Mixed results for coal-fired generators
Change in coal-fired generation – Q3 2020 versus Q3 2019
800
600
400
Mt Piper Kogan Creek
Loy Yang A
Average change (MW)
200
-
-200 Callide
Liddell
-400
-600 Eraring
Gladstone
-800
Rest of state
-1,000
-1,200
NSW QLD VIC
© AEMO 2020 | Quarterly Energy Dynamics Q3 2020 161.4.2 Hydro
Hydro generation declined to 1,726 MW on average, its lowest Q3 output since 2008, and 185 MW lower than
Q3 2019 (Figure 17). On a regional basis, compared to Q3 2019:
• Very dry conditions in Tasmania (Figure 18) coupled with low Victorian pool prices reduced Tasmania’s
hydro generation to its lowest Q3 output since 2008. Compared to Q2 2020, Tasmanian hydro generators
bid to conserve water, with generators shifting 258 MW of offers to above $50/MWh. Hydro Tasmania’s
storage levels remained comparatively low during the quarter, finishing at 41% compared to 48% in
Q3 2019, its lowest Q3 finish since 2016 (Figure 19).
• New South Wales hydro generation increased by 22 MW on average, with higher output from Upper
Tumut (+24 MW). Above average rainfall at Lake Eucumbene this quarter increased dam levels by 5% to
finish the quarter at 33%.
• Average hydro output in Queensland decreased slightly by 12 MW, with reduced output from Barron
Gorge and Kareeya (-27 MW combined) partially offset by increased Wivenhoe generation (+15 MW).
Lowest Q3 NEM hydro output since 2008
Average hydro generation by region (Q3s)
3,000
2,500
Generation (MW)
2,000
1,500
1,000
500
0
2008 2009 2010 2011 2012 2013 2014 2015 2016 2017 2018 2019 2020
TAS NSW VIC QLD
Dry Q3 conditions in Tasmania Tasmania storage levels remain low
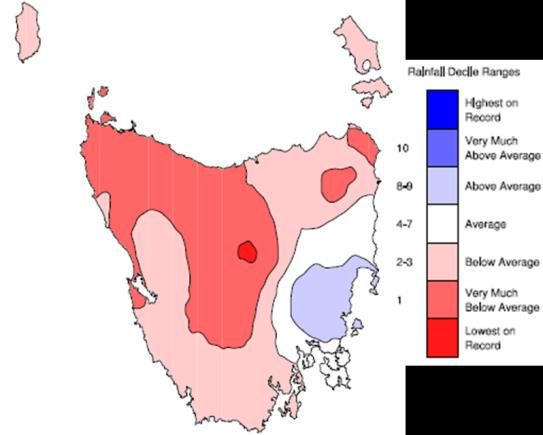
Tasmanian rainfall deciles – Q3 202014 Monthly Tasmanian water storage levels15
50
40
30
%
20
10
0
Nov
Apr
Jun
Jul
Oct
Aug
Sep
Dec
Jan
Feb
Mar
May
2016 2017 2018 2019 2020
14
Bureau of Meteorology 2020, Tasmanian Rainfall Deciles
15
Hydro Tas 2020, Energy Storage Historical Data: https://www.hydro.com.au/water.
© AEMO 2020 | Quarterly Energy Dynamics Q3 2020 171.4.3 Gas-powered generation
GPG decreased by 436 MW on average compared to Q3 2019 (Figure 20), due to reduced need to cover for
coal-fired generator outages (Mt Piper and Loy Yang A), displacement by VRE output, and reduced
operational demand. Of note, these GPG reductions occurred despite low spot gas prices (Section 2.2).
On a regional basis:
• New South Wales declined by 255 MW to its lowest Q3 average on record (107 MW). The decline was led
by EnergyAustralia’s Tallawarra (-182 MW), including a planned 19-day outage, as well as reduced need to
cover for Mt Piper outages (Mt Piper had its highest Q3 generation since 2013). Origin Energy's
Uranquinty declined 74 MW (despite its Eraring Power Station reducing slightly compared to Q3 2019).
• Queensland GPG continue to generate at higher levels, increasing by 98 MW on average compared to
Q3 2019, as gas prices remained low (Section 2.2). Queensland Q3 GPG generation reached its highest
Q3 output since 2015, with CleanCo’s Swanbank E leading the quarter on quarter increase (+156 MW).
• Victoria declined by 228 MW, led by EnergyAustralia’s Newport (163 MW) and Jeeralang (33 MW), mainly
due to fewer unplanned brown coal unit outages (Loy Yang A and Yallourn) and increased wind
generation.
• South Australia GPG reduced by 58 MW on average, despite increased operational demand and lower
local VRE output. Reduced GPG was largely a function of reduced net transfers into Victoria associated
with increased Victorian generation (Section 1.5).
− AGL’s Torrens Island reduced by 61 MW on average, which was more than offset by increases from its
newer Barker Inlet station (71 MW). Origin Energy’s Osborne reduced by 41 MW, with small reductions
across the remainder of the GPG fleet.
GPG falls in the southern regions
Change in GPG – Q3 2020 versus Q3 2019
200
Rest of state
150
100
Swanbank E
50
Average change (MW)
Barker Inlet
Tamar Valley
0
Jeeralang
Condamine Torrens Island
-50
Tallawarra Osborne
-100
Newport
-150
-200
Uranquinty
-250
-300
QLD NSW VIC SA TAS
© AEMO 2020 | Quarterly Energy Dynamics Q3 2020 181.4.4 Wind and solar
Compared to Q3 2019, quarterly average VRE output increased by 355 MW, with wind and grid-solar
contributing 250 MW and 105 MW, respectively. As new projects continued to ramp up to full output and Q3
typically being the windiest quarter of the year, this resulted in several grid-scale VRE records16 including:
• Highest grid-scale VRE share of NEM operational demand – NEM VRE output met 35% of NEM
operational demand at 1130 hrs on 22 September 2020.
• Highest VRE output on record – NEM VRE output reached 6,714 MW at 1100 hrs on 21 August 2020.
• Highest wind output on record – NEM wind output reached 5,198 MW at 1900 hrs on 22 August 2020.
• Highest grid-solar output on record – NEM grid-solar output reached 2,875 MW at 0930 hrs on 27
September 2020.
Wind generation reached a record quarterly high of 2,465 MW on average, surpassing the previous record
set in Q3 2019 by 11% (Figure 21). This record was a function of new capacity entering the system in the last
year – wind capacity factors were lower than in Q3 2019 due to lower wind speed during the first half of the
quarter and increased curtailment (Figure 22). By region:
• Victoria – increased generation (+118 MW) was predominantly due to the continued ramp up of recently
commissioned projects offsetting a 6% reduction in average quarterly wind capacity factors due to
curtailment and lower wind speeds.
• Queensland – continued ramp up of Coopers Gap wind farm resulted in a 132 MW average increase in
output, which more than offset the 25 MW decrease from Mount Emerald wind farm which continued to
be affected by Queensland system strength constraints (Section 1.6.2).
• Tasmania – despite two new wind farms since Q3 2019, average Tasmanian wind output only increased
marginally by 28 MW, due to a significant drop in wind speed in the region (capacity factors down 13%).
Record quarterly wind generation Lower wind capacity factors
Average wind generation by region – Q3 2019 to Q3 2020 Weighted average quarterly wind capacity factors by region (Q3s)17
3,000 60%
Average generation (MW)
2,500 50%
Capacity factor (%)
2,000 40%
1,500 30%
1,000 20%
500 10%
- 0%
Q3 19 Q4 19 Q1 20 Q2 20 Q3 20 NSW QLD SA TAS VIC
QLD NSW VIC SA TAS Q3 2019 Q3 2020
Average grid-scale solar generation was 689 MW this quarter, with the largest increase compared to Q3 2019
occurring in New South Wales (+64 MW). Five new projects commenced generation this quarter:
• New South Wales – Darlington Point Solar Farm (275 MW) and Limondale Solar Farm 1 (220 MW).
• Queensland – Warwick Solar Farm 1 and 2 (64 MW combined).
• Victoria – Kiamal Solar Farm – Stage 1 (200 MW).
16
Grid-scale VRE records are reported in half hourly time intervals. Some of these records have since been broken in Q4 2020.
17
Capacity factors of each project are weighted by installed capacity to derive the weighted average by state. Projects that have yet to reach full output by
Q3 2019 are excluded from calculation. Note: VWAP capacity factors include self-curtailment from wind farms.
© AEMO 2020 | Quarterly Energy Dynamics Q3 2020 19Higher output in New South Wales this quarter was driven by ramping up of installed capacity from previous
quarters and to a lesser extent by new capacity additions this quarter. In Queensland, there was a relatively
small increase in output (+25 MW) despite new capacity. This was a function of increased curtailment due to
negative prices and system strength constraints in North Queensland (Section 1.6.2).
With the declining spot wholesale electricity price (see Section 1.3), the volume weighted price received by
both wind and solar generation has fallen significantly in the last year. In Q3 2020, the average NEM volume
weighted average price (VWAP) for wind was $38/MWh while solar VWAP was $29/MWh, representing
reductions of around 50% from Q3 2019 levels.
Changes in VWAP were more pronounced on a regional basis, with the largest falls occurring in regions with
the highest level of negative prices. The South Australian solar VWAP declined to $23/MWh, 62% lower than
Q3 2019 levels. Notably, record low wholesale prices in September resulted in South Australian solar farms
having to pay $9.7/MWh to generate (Figure 23).
South Australia’s solar farms paid to generate in September
Grid-solar monthly volume weighted average price by region – July 2019 to September 2020
100
80
VWAP ($/MWh)
60
40
20
0
-20
Aug-20
Jul-19
Oct-19
Nov-19
Jun-20
Sep-20
Feb-20
Apr-20
Jan-20
Aug-19
May-20
Jul-20
Sep-19
Dec-19
Mar-20
QLD NSW VIC SA
1.4.5 NEM emissions
NEM emissions declined to the lowest Q3 level on record at 33.2 million tonnes of carbon dioxide equivalent
(MtCO2-e), while the emissions intensity fell to a new record low of 0.70 tCO2-e/MWh. Total emissions were
0.7 MtCO2-e higher than the previous quarter record low (32.5 MtCO2-e), although 1 MtCO2-e lower than Q3
2019. Key contributors to the record low emissions intensity – despite increased brown coal-fired generation –
included lower black coal-fired generation and increased VRE output.
Lowest NEM emission intensity on record
Quarterly NEM emissions and emissions intensity (Q3s)
50 1.0
Emissions (MtCO2-e)
40 0.8
Emissions Intensity
(tCO2-e/MWh)
30 0.6
20 0.4
10 0.2
0 0.0
2011 2012 2013 2014 2015 2016 2017 2018 2019 2020
Emissions Emissions Intensity
© AEMO 2020 | Quarterly Energy Dynamics Q3 2020 201.4.6 Storage
Batteries
NEM battery revenue declined to $6.1 million, its lowest level since Q4 2018 (Figure 25), driven by reduced
FCAS prices and outages of Hornsdale Power Reserve during commissioning of its expansion. Continuing
recent trends, the primary source of revenue for batteries remained FCAS, with energy arbitrage only
contributing 21% of total revenues.
Lower South Australian spot prices contributed to average energy arbitrage value for batteries reducing from
$55/MWh in Q3 2019, to $31/MWh in Q3 2020, with charging during negative spot prices unable to
completely offset the impact of lower evening peak prices.
Testing and commissioning of the Hornsdale Power reserve expansion was completed in early September,
increasing its energy capacity/storage capacity from 100 MW/129 MWh to 150 MW/193.5 MWh, as well as
increasing its capacity in the eight FCAS markets. This resulted in a 65% increase in its FCAS enablement for
the remainder of the month (Figure 26), and Hornsdale Power Reserve increasing its NEM-wide FCAS market
share from an average of 10% to 17% (Figure 27).
Lowest battery market revenue since Q4 2018
Battery revenue sources
Energy
70
Regulation FCAS
60
Contingency FCAS
50 Energy cost
Charge/pump (negative prices)
Revenue/cost ($million)
40
Net revenue
30
20
10
0
-10
Q1 Q2 Q3 Q4 Q1 Q2 Q3
2019 2020
© AEMO 2020 | Quarterly Energy Dynamics Q3 2020 21Hornsdale battery expansion increases FCAS Hornsdale battery captures 17% of
supply NEM-wide FCAS market share following
HPR daily average FCAS enabled expansion
HPR share of NEM-wide FCAS markets pre- and post-expansion
500
Pre expansion (Feb - Aug 2020)
400 35% Post expansion (13 - 30 Sep 2020)
Average (MW)
300 30%
25%
% Market share
200
20%
100
15%
0
10%
5%
0%
Raise 6s Raise 60s Raise 5min Raise Reg
Raise Raise Raise Raise Lower Lower Lower Lower
Lower 6s Lower 60s Lower 5min Lower Reg Reg 6s 60s 5min Reg 6s 60s 5min
Pumped hydro
Pumped hydro spot market net revenue in Q3 2020 was $5.5 million, 52% higher than Q3 2019. The driver of
this increase varied by region:
• In Queensland, higher pumped hydro spot revenue was a function of increased utilisation of Wivenhoe,
continuing the trend since its transfer into the CleanCo portfolio at the end of October 2019. In Q3 2020,
total pumping was 82 GWh, 131% higher than Q3 2019, representing the highest utilisation since Q2 2016.
This more than offset the impact of lower average energy arbitrage values, which decreased from
$86/MWh to $64/MWh.
• In New South Wales, pumped hydro spot market revenue increased despite a 53% reduction in
pumping compared to Q3 2019. This was due to average energy arbitrage values increasing from
$28/MWh to $42/MWh.
Pumped hydro net revenue higher in 2020 than 2019
Pumped hydro revenue sources
20
Revenue/cost ($million)
15
10
5
0
-5
-10
Q1 Q2 Q3 Q4 Q1 Q2 Q3
2019 2020
Energy Charge/pump (negative prices) Contingency FCAS Energy cost Net revenue
© AEMO 2020 | Quarterly Energy Dynamics Q3 2020 221.5 Inter-regional transfers
In Q3 2020, total inter-regional transfers were 3.2 TWh, a slight increase compared to Q3 2019 (Figure 29).
Total inter-regional transfers increased by 3% compared to Q3 2019
Quarterly inter-regional transfers
600 QLD NSW SA VIC
400
Average flows (MW)
200
0
-200
-400 Q3 19 Q2 20 Q3 20 Net
-600
-800 NSW VIC VIC TAS
Key changes compared to Q3 2019 included:
• Queensland to New South Wales – transfers south reduced by 137 MW on average, largely due to
outages reducing Queensland black coal-fired generation by 447 MW on average.
− Planned line works on the Muswellbrook – Tamworth 88 330 kilovolt (kV) lines for 32% of the quarter
left the Queensland to New South Wales Interconnector (QNI) on a single contingency, contributing
to a 190 MW reduction in average export capacity to New South Wales18.
− Despite this reduced export capacity, QNI was binding at its limit less frequently than in Q3 2019,
reducing from 28% to 24% of the time. This contributed to a narrowing of the average price spread
between the two regions, reducing from $21/MWh to $14/MWh.
• Tasmania to Victoria – reduced hydro generation in Tasmania (202 MW) as a result of dry conditions
reduced exports to Victoria (by 25 MW) and increased imports (by 136 MW). Net Q3 flows on Basslink
swung into the southerly direction for the first time since 2008 (Figure 30).
• South Australia to Victoria – increased brown coal generation (317 MW) and reduced Victoria demand
(136 MW) resulted in net Victorian imports from South Australia reducing by 54 MW on average.
− On 17 July 2020, Para No. 1 Static Var Compensator failed due to a transformer fire. A new constraint
was introduced to limit flows on Heywood into Victoria from 550 MW to 420 MW and will remain in
place until the transformer is replaced (estimated by 1 July 2021).
− Additionally, Murraylink was constrained from 26 August while oscillations were being investigated 19,
followed by a planned outage limiting all flows on Murraylink which commenced on 7 September
2020.
− Despite these limits, Heywood was binding less frequently than in Q3 2019, reducing from 31% to 16%
of the time. This contributed to a narrowing of the average price spread between the two regions,
reducing from $23/MWh to $11/MWh.
18
The AER will provide further analysis on the impact of the lower limits on the QNI and Heywood interconnectors on negative prices and price alignment as
part of its upcoming Q3 2020 Wholesale Markets Quarterly
19
See Market Notice 77189.
© AEMO 2020 | Quarterly Energy Dynamics Q3 2020 23• Victoria to New South Wales – increased Victorian generation (Figure 31), and reduced demand in
Victoria (-136 MW) contributed to a 129 MW swing in Victoria to New South transfers, resulting in net
flows of 47 MW into New South Wales.
Q3 net flows on Basslink swing southerly for the first time since 2008
Q3 flows on The Basslink Interconnector
500
400
Average Flows (MW)
300
200
100
0
-100
-200
-300
2006 2007 2008 2009 2010 2011 2012 2013 2014 2015 2016 2017 2018 2019 2020
TAS Imports TAS Exports Net
Increased supply in Victoria; decreases in all other regions
Change in regional supply – Q3 2020 versus Q3 2019
300
200
Average change (MW)
100
0
-100
-200
-300
VIC SA NSW TAS QLD
1.5.1 Inter-regional settlement residue
Inter-regional settlement residue (IRSR) was $33 million this quarter (Figure 32), representing a 47% decrease
from Q3 2019. IRSR remained low due to NEM-wide low prices and limited price volatility.
These results were driven by reductions in IRSR for Queensland to New South Wales (-$22 million) and South
Australia to Victoria (-$5 million). Decreased transfers on these interconnectors, as well as increased price
alignment between these regions, drove the IRSR reductions.
© AEMO 2020 | Quarterly Energy Dynamics Q3 2020 24IRSR reduced by 47% compared to Q3 2019
Quarterly positive IRSR value
140
120
100
$million
80
60
40
20
0
Q1 Q2 Q3 Q4 Q1 Q2 Q3
2019 2020
NSW-QLD QLD-NSW NSW-VIC VIC-NSW SA-VIC VIC-SA
1.6 Power system management
Total NEM system costs20 continued to trend downwards, decreasing from $62 million in Q2 2020 to
$50 million in Q3 2020, $28 million lower than Q3 2019 (Figure 33). By component:
• FCAS costs decreased to $35 million this quarter, $25 million lower than Q3 2019 and $10 million lower
than Q2 2020. Despite the decline, it remained the main contributor to system costs, accounting for 69%
of total costs. Section 1.6.1 provides details on FCAS.
• The cost of directing units to maintain system security decreased to $8 million this quarter despite
increased time on direction. Section 1.6.3 provides details on system security directions for the quarter.
• Estimated VRE curtailment costs21 increased to $8 million, 28% higher than Q2 2020. Section 1.6.2
provides details on VRE curtailment for the quarter.
System costs continued to decline
Quarterly system costs by category
350
FCAS
300 RERT
Directions
250
Curtailment
200
$million
150
100
50
0
Q1 Q2 Q3 Q4 Q1 Q2 Q3
2019 2020
20
In this report, NEM system costs refer to the costs associated with FCAS, directions compensation, RERT and VRE curtailment
21
Excludes economic curtailment. The cost of curtailed VRE output estimated to be $40/MWh of output curtailed.
© AEMO 2020 | Quarterly Energy Dynamics Q3 2020 251.6.1 Frequency control ancillary services
Quarterly FCAS prices and costs continued to decline, with Q3 2020 costs of $35 million. This was $10 million
lower than Q2 2020 and represented the lowest quarter since Q1 2018.
Compared to Q2 2020, average Regulation prices22 reduced by 22%, Contingency Raise prices reduced by
26%, and Contingency Lower prices increased by 37%. The increase in Contingency Lower prices was largely
driven by higher Queensland prices – these were due to local requirements resulting from power line outages
which left the QNI on a single contingency.
Contributors to price reductions in the Regulation and Contingency Raise markets included:
• Reduced market offers, which were influenced by:
− Expansions of existing supply – on completion of its 50% expansion in early September, Hornsdale
Power Reserve increased FCAS supply across all eight FCAS markets (see Section 1.4.6). In addition,
the two existing virtual power plants in South Australia increased their combined capacity from 3 MW
to 9 MW in the six Contingency FCAS markets.
− Return to the market of thermal units – during the quarter, several thermal units – including Bayswater
Unit 4, Darling Downs – returned to the FCAS markets after prolonged absences. This coincided with
increasing FCAS requirements in 2020 compared to 2019, unit upgrades, and implementation of the
Mandatory Primary Frequency Control rule change.
− A continuation of comparatively low energy prices, particularly in Queensland and South Australia
(raise FCAS market prices often move in line with energy prices, due to the opportunity cost of service
provision).
• Reduced Contingency Raise requirements – AEMO’s average Contingency Raise requirements
decreased by 6% compared to Q2 2020. This was largely a function of a decrease in the size of the
largest credible contingency, due to lower average output from Kogan Creek Power Station (which is
typically the largest credible contingency in the NEM).
Lowest FCAS costs since Q1 2018
Quarterly FCAS cost by market23
250
Regulation Contingency Raise Contingency Lower
200
150
$ million
100
50
0
Q1 Q2 Q3 Q4 Q1 Q2 Q3 Q4 Q1 Q2 Q3
2018 2019 2020
22
For simplicity, a time-average of the FCAS prices across each of the five regional markets used.
23
Based on AEMO Settlement data and represents preliminary data that will be subject to minor revisions.
© AEMO 2020 | Quarterly Energy Dynamics Q3 2020 261.6.2 VRE curtailment
During Q3 2020, 5.5% of NEM VRE output was curtailed (Figure 35). Key curtailment drivers included:
• Queensland system strength arrangements24 – in March 2020, system strength limits were introduced
in North Queensland which involved constraining the output of three generators25 in order to maintain
power system security. On 27 July 2020, an update to the constraint introduced the potential to limit
output from another nine solar farms 26.
− These constraints were binding more frequently this quarter (55% of the time compared to 16% in Q2
2020), resulting in 49 MW of curtailment on average, up from 5 MW in Q2 2020. Increased outages of
relevant Queensland black coal-fired units contributed to the constraints binding more often.
• Economic curtailment – the record frequency of negative spot prices contributed to an average of
50 MW of self-curtailment, up from 27 MW in Q3 2019. Increased occurrence of negative spot prices in
South Australia and Queensland (Section 1.3.1), particularly during the middle of the day, resulted in
higher VRE self-curtailment, with 70% of curtailment occurring between 0700 and 1900 hrs (Figure 36).
Queensland system strength constraint and negative prices drive increased VRE curtailment
Average NEM VRE curtailed by curtailment type
300 Other (network and constraints) 8%
SA system strength
Average VRE curtailed (MW)
Economic curtailment
VIC/NSW solar constraint 6%
200 SA-VIC separation
% curtailed
Qld system strength
4%
100
2%
0 0%
Q1 2019 Q2 2019 Q3 2019 Q4 2019 Q1 2020 Q2 2020 Q3 2020
Note: curtailment amount based on combination of market data and AEMO estimates27.
Curtailment predominantly occurred during the middle of the day
Average NEM VRE curtailed by fuel type and time of day – Q3 20
500
Average curtailment
400 Wind Solar
300
(MW)
200
100
0
00:00 02:00 04:00 06:00 08:00 10:00 12:00 14:00 16:00 18:00 20:00 22:00
Time
24
Only includes system normal constraints.
25
Mount Emerald Wind Farm, Haughton Solar Farm and Sun Metals Solar Farm.
26
For further details, see Market Notice 76455. For latest update, see Market Notice 77646. Updated Qld limit advice can be found here:
https://www.aemo.com.au/energy-systems/electricity/national-electricity-market-nem/system-operations/congestion-information-resource/limits-advice.
27
For further information on the curtailment calculation, see: www.wattclarity.com.au/articles/2020/06/not-as-simple-as-it-appears-estimating-curtailment-
of-renewable-generation/?utm_source=rss&utm_medium=rss&utm_campaign=not-as-simple-as-it-appears-estimating-curtailment-of-renewable-
generation.
© AEMO 2020 | Quarterly Energy Dynamics Q3 2020 271.6.3 Directions
During the quarter, AEMO continued to issue directions to GPGs in South Australia to maintain system
security in the region. Despite time on direction increasing from 18% in Q3 2019 to 20% in Q3 2020, total
directions costs for energy decreased from $9.4 million to $8 million (Figure 37).
Directions costs were slightly lower than Q3 2019 despite more time on direction
Time and cost of system security directions (energy only) in South Australia and Victoria
40 40%
30 30%
Cost ($m)
Time (%)
20 20%
10 10%
0 0%
Q1 Q2 Q3 Q4 Q1 Q2 Q3
2019 2020
SA Direction cost [LHS] VIC Direction cost [LHS]
SA Direction time [RHS] VIC Direction time [RHS]
Note: direction costs reported are preliminary estimates which are subject to revision.
This quarter, approximately 81% of direction costs were incurred in September, as record low South Australian
spot prices during the month (Section 1.3) meant GPG in the region frequently sought to de-commit from the
market for economic reasons.
Despite an increase in GPG directed this quarter (+5 MW), directions costs declined by $1.4 million compared
to Q3 2019. This was mainly due to the significant decrease in the 12-month 90th percentile spot price that is
used for compensating participants. On average, the 12-month 90th percentile spot price decreased by
$45/MWh to $98/MWh this quarter.
© AEMO 2020 | Quarterly Energy Dynamics Q3 2020 282. Gas market dynamics
2.1 Gas demand
Total east coast gas demand was 5% lower than Q3 2019, due to reduced demand across all three major
segments, representing the lowest Q3 gas demand since Q3 2017 (Table 4, Figure 38).
A total of 313 PJ flowed to Curtis Island for LNG export, a decrease of 11 PJ compared to Q3 2019 and a
decrease of 3 PJ compared to Q2 2020 (Figure 39). This is the lowest east coast LNG export since Q3 2018,
and coincided with low international oil and gas prices (Section 2.2.1). Australia Pacific LNG’s (APLNG’s) 12.5 PJ
reduction in flows to Curtis Island was the largest reduction, with both APLNG’s major customers declaring
downward quantity tolerance for 2020 28. There was also extended maintenance on all three LNG facilities
during the quarter, further contributing to the decrease.
During Q3 there were 78 LNG cargoes exported, down from 81 in Q3 2019. APLNG reduced from 31 to 29,
Queensland Curtis LNG (QCLNG) reduced from 29 to 28, while Gladstone LNG (GLNG) remaining steady at 21
cargoes respectively.
GPG demand decreased by 20% compared to Q3 2019, with reductions in South Australia, Victoria and New
South Wales, only partially offset by increases in Queensland and Tasmania. Drivers for reduced GPG are
discussed in Section 1.4.3.
Table 4 Gas demand – quarterly comparison
Demand (PJ) Q3 2020 Q2 2020 Q3 2019 Change from Q3 2019
AEMO Markets * 109.8 97.4 112.1 -2 (-2%)
GPG ** 37.2 33.2 46.7 -9 (-20%)
QLD LNG 313.4 316.6 324.0 -11 (-3%)
TOTAL 460.4 447.2 482.9 -22 (-5%)
* AEMO Markets demand is the sum of customer demand in each of the Short Term Trading Markets (STTMs), and the Declared
Wholesale Gas Market (DWGM), and excludes GPG in these markets.
** Includes demand for GPG usually captured as part of total DWGM and STTM demand. Excludes Yabulu Power Station.
Gas demand falls across all sectors
28
Origin Energy, 2020 Full Year Results: https://www.originenergy.com.au/content/dam/origin/about/investors-
media/presentations/200820_FY20_investor_pres_final.pdf.
© AEMO 2020 | Quarterly Energy Dynamics Q3 2020 29You can also read