Achieving the Paris Climate Goals in the COVID-19 era - F20 - Policy Briefing #2/2020 - F20 ...
←
→
Page content transcription
If your browser does not render page correctly, please read the page content below
F20 - Policy Briefing #2/2020
September 2020

             Achieving the Paris Climate
              Goals in the COVID-19 era
FOREWORD
How can the Paris Climate
Goals be achieved in the
COVID-19 era?
This policy briefing was written during the COVID-19 crisis, a
time of unprecedented challenges. Governments around the
world are preparing for the continued fallout from the pandemic,
while also developing economic stimulus packages to avoid a
collapse of national economies and global markets. Shocks
have been particularly hard in the fossil fuel sector, with the
IEA projecting a 9% drop in oil demand, 8% in coal and 5% in
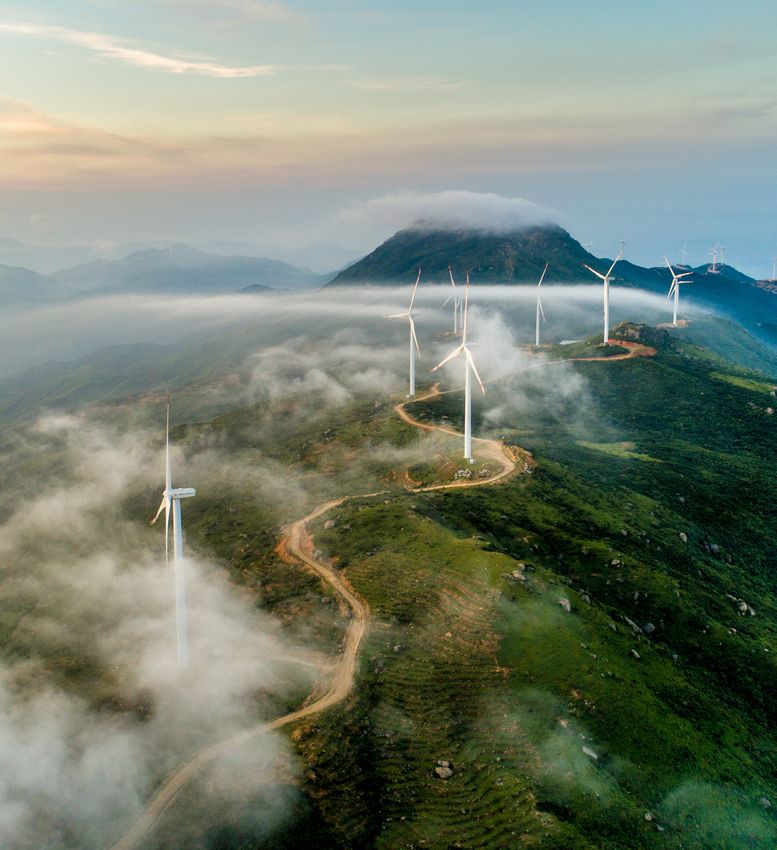
natural gas in 2020. Meanwhile, solar is expected to grow by 15%
and wind by 10%, with total CO2 emissions from the energy
sector falling by at least 8% in 2020. 1
As the world recovers from the COVID-19 pandemic, we have to
think carefully about the future that we want to create. The
recovery cannot be a return to ‘normal’ because the pre-COVID
world was not normal. It was, and still is, a time of crisis with
record global temperatures and loss of biodiversity. Instead, we
must prioritize a coordinated global response that helps solve
the climate crisis and makes our societies more resilient and
less destructive. Any stimulus based on a ‘business as usual’
approach could trigger the next global crisis.
The European Commission has recently pledged to put fighting
climate change at the heart of its 750 billion euro ($826.3 billion)
recovery plan. 2 This stimulus package and those to follow
must be invested in line with the 1.5°C limit of the Paris Cli-
mate Agreement and the Sustainable Development Goals
(SDGs). Failure to do so could lead to further environmental
degradation, severe flooding and drought, and risks to public
health from future vector-borne or zoonotic diseases.
F20 - Policy Briefing #2/2020
This executive briefing, produced in partnership with One
Earth and the University of Technology Sydney, sets out the
roadmap for a good (66%) likelihood of achieving the 1.5°C limit
and shows that doing so will save trillions of dollars in avoided
costs, allowing for a more rapid and sustainable economic
recovery following the COVID-19 pandemic.
1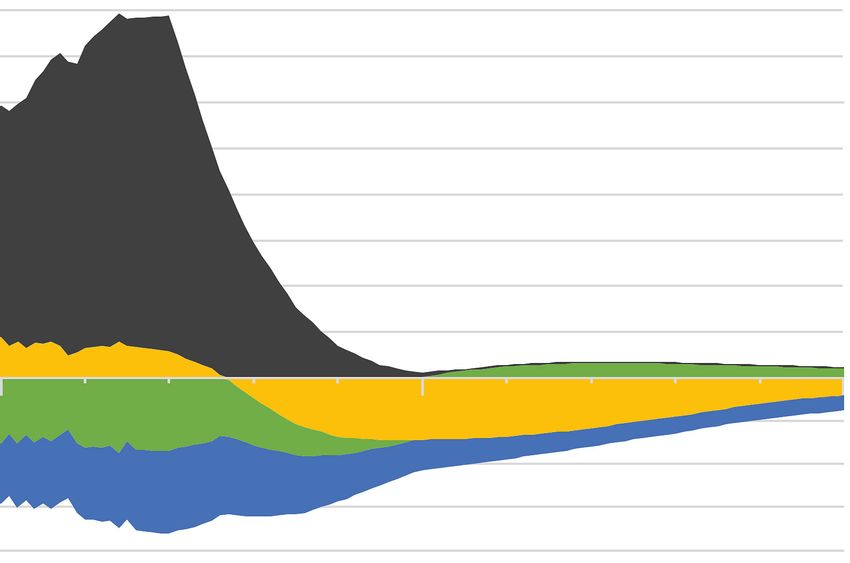
CONTENT

   F20 Policy Briefing:
Achieving the Paris Climate
 Goal in the COVID-19 era

 Overview: Below 1.5°C – A breakthrough
   roadmap to solve the climate crisis

                 page   3

       Top-level findings: Clean,
      renewable energy transition

                 page   6

         Regional and sectoral
        energy transition targets

                 page   11

    Top-level findings: Nature-based
         solutions and land use

                page    14
                                          F20 - Policy Briefing #2/2020

      Conclusion and thoughts on
        the role of foundations

                page    17

                                                2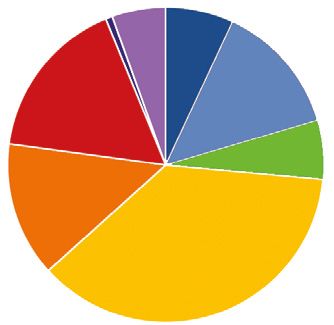
OVERVIEW

 Below 1.5°C - A breakthrough
     roadmap to solve the
        climate crisis                                                      The scenario to achieve the 1.5°C
                                                                            limit (LDF1.5C) is published in the
                                                                            book Achieving the Paris Climate
                                                                            Agreement Goals (APCAG). It is
                                                                            the culmination of a two-year
                                                                            collaboration with 17 leading sci-
In 2018, the IPCC made clear that the world must be kept below              entists at the University of Tech-
1.5°C global average temperature rise. Their special report Global          nology Sydney (UTS), two insti-
Warming of 1.5ºC showed that it becomes increasingly difficult to           tutes at the German Aerospace
solve climate change beyond this threshold, and every tenth of a            Center (DLR), and the University
degree increase in temperature risks multiplying impacts.3 Howev-           of Melbourne’s Climate & Energy
er, no model existed that shows how this ambitious target could be          College. The book was released
achieved using only existing and rapidly scalable solutions, with-          by the prestigious scientific pub-
out a risky overshoot of the 1.5°C limit. For this reason, some have        lisher Springer Nature and quick-
abandoned the 1.5°C goal or believe it can only be achieved through         ly became the most downloaded
large-scale implementation of risky and expensive technologies,             climate text in the publisher’s
such as bioenergy with carbon capture and storage (BECCS), direct           history, cited in over a dozen
air capture (DAC), or solar radiation management (SRM). These                        scientific papers.
technologies may play a role in the future, but they cannot be relied
upon to solve the current climate crisis.
Now, for the first time an advanced climate modeling framework,
published in the book Achieving the Paris Climate Agreement
Goals (APCAG), shows that it is possible to stay below 1.5°C with
widely available, rapidly scalable solutions.4 Furthermore, the 1.5C
model demonstrates:                                                          Why the 1.5ºC
                                                                             limit matters
We can meet all of      Nature-based solu-      The transition to
our energy needs        tions like forest       100% renewable
with 100% clean,        restoration are         energy will cost
renewable energy        crucial to removing     an additional $1.1
and energy effi-        carbon from the         trillion a year —
ciency measures,        atmosphere, mak-        far less than we are
using existing tech-    ing the 1.5°C limit     paying now for our      We are already seeing the devastating
nologies by 2050.       possible.               current fossil-fuel     consequences of the current 1°C in global
                                                                        average temperature rise above pre-
                                                based system.
                                                                        industrial levels — rapid glacial melting,
                                                                        rising sea levels in many coastal cities,
The APCAG 1.5C model is a breakthrough because it changes the           extreme storms, prolonged droughts, and
frame of discussion — the key question is no longer “can we?” It’s      intensified wildfires. And because
“will we?” Achieving 1.5°C is now a choice, not a wish. We don’t        temperature intensity varies across the
need to wait for novel technologies. There is a clear pathway to        world, we can glimpse a 1.5°C future
success with meaningful, effective solutions that can be imple-         today. Australia, with its recent unprece-
mented immediately. Moreover, achieving the 1.5°C limit will save       dented wildfires, is already at a regional
                                                                                                                        F20 - Policy Briefing #2/2020

trillions of dollars in avoided climate change impacts and will         average temperature rise of 1.5°C .5
allow for a more rapid and sustainable economic recovery follow-        Antartica is experiencing a rise of
ing the COVID-19 pandemic.                                              more than 3°C, resulting in much faster
                                                                        glacial melting than had been previously
                                                                        expected .6
                                                                        This briefing will set out a clear transition
                                                                        pathway to avoid the dangerous threshold
                                                                        of 1.5°C, including the actions, targets and
                                                                        timescales we need to hit.
                                                                                                                              3
What does the 1.5°C limit
look like in practice?
Here is the APCAG 1.5C scenario in one graph:
APCAG 1.5CClimate
APCAG 1.5C Climate Mitigation
Mitigation Scenario
Scenario
20 years to net-zero 392 GtCO2
(2018-2037) 1.5˚C (50%)
40 400
an
th
ro Cum
35 350
2037
2018
po u
ge la
30 ni tiv 300
2050: ce e
100% renewables m
25 iss 250
ion
Cumulative GtCO2
Fossil fuel 2030: 56% global
s 175 GtCO2
& cement renewable energy (2018-2075)
20 200
1.5˚C (66%)
Annual Emissions (GtCO2)
2020: Peak anthro-
pogenic emissions
15 150
Phase-out forest &
land use emissions
10 100
Land use 2037: Net-zero
change
92 GtCO2
CO2 emissions (2018-2100)
5 50
0 0
Land sinks Land restoration
-5
-10
Ocean sinks
Note: IPCC calls for a buffer of 100 GtCO2
-15
for Earth system feedbacks, lowering the
1.5˚C (>66%) threshold to 175 Gt CO2.
-20
2000 2010 2020 2030 2040 2050 2060 2070 2080 2090 2100
The APCAG 1.5C model achieves net zero annual CO2 emissions in approximately 20 years, from 2018-2037. The black area represents emissions from fossil fuels, which must decline by
more than half by 2030. The gold area represents emissions from land use, including deforestation, which declines and becomes a source of negative emissions in the late 2020’s through
forest restoration. The blue area represents natural ocean carbon sinks, which continue absorbing CO2 through the century. The green areas represent natural land carbon sinks, which
become a contributor of CO2 emissions in the second half of the century due to biosphere feedbacks. The blue dotted lines show the carbon budgets (commencing Jan. 1, 2018) for a 50%
chance (top line) and >66% chance (lower line) of staying below 1.5°C.
F20 - Policy Briefing #2/2020
The APCAG 1.5C scenario is summarized here in two main parts:
Clean, renewable energy transition Nature-based solutions and land use
Increasing energy efficiency measures and decarboniz- Protecting the world’s remaining natural carbon sinks,
ing global energy supplies through a transition to 100% ending deforestation and restoring forests; cutting
clean, renewable energy across all sectors – transport, methane emissions from agriculture in half, cutting
industry, and buildings/other – including electricity, nitrogen use by a third, and planting trees on croplands
heating, and liquid fuels. to absorb carbon dioxide.
4Societal benefits of
achieving the 1.5°C limit
The 1.5C model demonstrates that not only is it possible The vital nature-based strategies included in the model
to switch to 100% renewables for all energy uses, but that not only serve as a means to sequester carbon, but also
it will cost much less to operate compared to today’s to make ecosystems more resilient and to enhance biodi-
energy system while creating valuable social and eco- versity. This increases sustainable livelihoods in the
nomic co-benefits. It will improve public health world- developing world, offering improved water supplies,
wide by eliminating the air pollution associated with the reducing soil erosion, and providing higher quality crop
burning of fossil fuels, estimated to be the cause of 4.2 yields. Protecting and restoring nature also protects
million premature deaths per year.7 The renewable ener- human health by reducing the risk of zoonotic diseases
gy transition will also drive economic development, such as COVID-19 .8
providing 30 million people currently working in the
energy sector with permanent, good-paying jobs and
creating 12 million additional new jobs.
“
Scientists cannot fully predict the future, but advanced modeling
allows us to map the best scenarios for creating a global energy
system fit for the 21st century. And with momentum around the
Paris Agreement lagging, it’s crucial that decision-makers around
the world see that we can, in fact, meet global energy demand at a
lower cost with clean renewables.
”
DR. SVEN TESKE
CO-AUTHOR AND EDITOR AND RESEARCH DIRECTOR
F20 - Policy Briefing #2/2020
OF THE INSTITUTE FOR SUSTAINABLE FUTURES AT THE
UNIVERSITY OF TECHNOLOGY SYDNEY (UTS)
5FINDINGS ON ENERGY
Top-level findings:
clean, renewable
energy transition
In order to create a decarboniza-
tion model to achieve 1.5°C, the sci-
entists at UTS developed a sophis-
ticated computer simulation of
the world’s electrical grids — with
10 regional and 72 sub-regional
The APCAG 1.5C energy transition model calls for a rapid
energy grids modeled in hourly
decarbonization of final energy delivery (approximately
increments to the year 2050, along
8-10% per year), including both electricity and non-electri-
with a comprehensive assess-
cal energy carriers, such as direct solar heating and liquid
ment of available renewable re-
renewable fuels. Globally, total energy supply goes from
sources like wind and solar, min-
21% renewables in 2020 to 56% by 2030, 88% by 2040, and
erals required for manufacturing
100% by 2050. Some of the main implications of the model
of components, energy efficiency
for the way we generate and use energy include:
measures, and configurations for
meeting projected energy demand
and electricity storage for all
sectors through 2050.
1
The size of the global market for renewa-
ble power plants and energy storage and
dispatch will increase significantly. 2
Fossil fuels are rapidly phased
out, replaced by renewable
energy supplies.
Each of the three major energy end-use sectors – Trans-
portation, Industry, Buildings/Other – will be increasing-
ly electrified, meeting approximately 23% of total energy
demand in 2020, 38% in 2030, 52% in 2040, and 59% in
2050. Electricity generation from renewable, carbon-free
sources will rapidly scale up from 29% in 2020 to 73% by
Coal: global coal-fired emissions are reduced by 40% by
2030, 94% in 2040, and 100% by 2050. Nearly all of this
2025, 75% by 2030, and phased out by 2050, with electrici-
expansion is from renewables, with nuclear fission
ty needs met increasingly by solar, wind, and other
gradually phased out due to rising costs. The world
renewables.
market for energy storage (e.g. hydro-pumped storage
plants and batteries) and dispatch technologies and Oil: production volume is decreased by 30% by 2025, 58%
services will increase significantly. by 2030, and 4% annually after 2030, with transportation
increasingly electrified along with a ramp-up of sustain-
able liquid fuels.
F20 - Policy Briefing #2/2020
Gas: a gradual phase-out to allow the industry to transi-
tion to hydrogen and renewable heating sources, w ith
production decreasing by 0.2% per year to 2025, by 1% to
2030, and by 4% annually after 2030.
6Global Expansion of Renewables to Achieve the 1.5°C limit 2050 Energy Supply by Carrier
Global Expansion of Renewables to Achieve the 1.5C Goal
350,000
Renewable Heat & Fuel
5% Biofuel (5,693 PJ)
300,000 6% Syn Fuel (6,328 PJ)
Oil
7% H Fuel (6,849 PJ)
Direct E: 18% RE
13% RE District Heat (13,092 PJ)
250,000 12% H Heat/Process (12,258 PJ)
RE Fuels 8%
15% Geothermal Heat (15,381 PJ)
Final Energy Demand (PJ)
RE District
Hydrogen
20% Biomass Heat (20,310 PJ)
200,000 Geothermal 33% 22% Solar Heat (23,083 PJ)
Biomass
Direct E: 46% RE
Coal Direct E: 82% RE
Solar Heat
150,000 Renewable Electricity
Electricity: 94% RE
Hydro 5% H Electricity (7,189 PJ)
100,000
Electricity: 73% RE 5% Biomass Electricity (7,544 PJ)
Gas
59% 8% Hydropower (11,467 PJ)
Wind
2% Wave Power (2,708 PJ)
50,000 Electricity: 29% RE Solar CSP 33% Wind Power (49,578 PJ)
5% Geothermal Power (7,641 PJ)
Nuclear
12% Concentrated Solar (18,712 PJ)
Solar PV
30% Solar PV (45,314 PJ)
2015 2020 2025 2030 2035 2040 2045 2050
Coal, Oil, and Gas are gradually phased out as electricity demand is met increasingly through renewable power generation, while fossil fuel-based liquid fuels are replaced by renew-
able fuels. Fossil fuels required for building heat and industrial processes are also phased out as renewable solar, geothermal, and other forms of renewable heat are ramped up. In
2050, approximately 59% of total final energy demand is met by renewable electricity.
Global Electrification to Achieve the 1.5°C limit 2050 Energy Supply by Sector
Global Electrification to Achieve the 1.5C Goal: 2050 Energy Supply by Sector
350,000 Energy efficiency and Buildings/Other
demand reduction
Buildings/Other measures reduce total
consumption of final
33% Electric Power (51,288 PJ)
energy by approx.
300,000 290,000 PJ, versus the 31% Electric Heat (23,150 PJ)
33% electrification business-as-usual
scenario (540,000 PJ).
36% Direct Heat (42,430 PJ)
250,000 45% electrification
55% electrification
Final Energy Demand (PJ)
On-site energy Industry
200,000 Industry 46% 33% Electric Power (32,477 PJ)
25% Electric Heat/Process (24,400 PJ)
28% electrification
150,000 Electric power 42% Other Heat/Process (41,695 PJ)
40% electrification
51% electrification
F20 - Policy Briefing #2/2020
100,000 On-site energy
Transportation
Transportation 39%
50% Electric Power (18,839 PJ)
50,000
H
Electric power 18% Hydrogen Fuel (6,849 PJ)
2% electrification 18% electrification 45% electrification
On-board fuels
15% 32% Other fuels (12,022 PJ)
Electric power
2015 2020 2025 2030 2035 2040 2045 2050
All three sectors are increasingly electrified through 2050. Transportation moves from 2% electrification to 50%. Industry moves from 28% to 58%, with a large amount of heat/process
demand met through electrified heat in 2050. Electrification of the Residential/Other sector moves from 33% to 64%, with nearly half of heating demand met by electricity.
Note: Total energy demand is decreased through energy efficiency and demand reduction measures.
73
The transition to renewables
will be cheaper than our current
energy system.
The proposed energy transition outlined would require to prop up the fossil fuel industry, estimated at more than
an investment globally of an additional $1.1 trillion per $4.7 trillion in 2019 by the International Monetary Fund .9
year, factoring in approximately $400B/yr in savings Taxpayers are unwittingly funding the climate crisis,
from reduced fossil fuel extraction and processing in the and that needs to stop. The research tells us that we
2020’s, which grows to approximately $900B/yr savings could create a clean energy future for less than one-third
in 2030’s and $1.1T/yr savings in the 2040’s. While this of what we’re spending now, while improving health
represents a significant investment, it pales in compari- outcomes, energy access and sustainable livelihoods in
son to the vast subsidies governments currently provide both developed and developing countries.
4 5
The transition will Overall energy demand is
create more long-term energy greatly reduced through
sector jobs. efficiency measures.
Though a rapid transition in line with the 1.5°C target will Despite an increasing need for heat, power and transport
require significant investments, in the end it will contrib- as the global population grows, total energy demand will
ute positively to the recovery of the global economy, re- actually decrease in the 1.5C model – from 355,000 PJ in
ducing climate risk and pollution-related illness, while 2020 to 284,000 PJ in 2030, 257,000 PJ in 2040, and 253,000
increasing job opportunities in a new, clean economy. PJ in 2050. This is accomplished through an array of
The overall number of energy-sector jobs increases – with energy efficiency and demand reduction measures. Trans-
48.1 million energy jobs in 2025, 53.8 million energy jobs portation will become 75% more efficient than the BAU
in 2030, and 47.8 million energy jobs in 2050. The renewa- scenario due to electrification and reduction of powertrain
ble energy sector is projected to account for 86% of all losses for road vehicles, aerodynamic improvements for
energy jobs in 2025 and 89% in 2030, with solar PV having high-speed transport, and reduction of vehicle mass.
the greatest share, followed by biomass, wind, and solar Heating of buildings will become 40% more efficient,
heating. There will be a net increase in jobs in the 2020’s, accomplished through low-energy building codes and
F20 - Policy Briefing #2/2020
with the highest number of jobs being plant and machine retrofit programs that incentivize highly efficient building
operators and assemblers, followed by electricians, and envelopes, passive cooling and heating systems, low-tem-
technicians (including electrical, mechanical, civil, and IT perature heating networks, thermal sensors and automat-
technicians). The largest percentage increase will be ed controls. Buildings will increasingly use efficient heat
among laborers, engineers, electricians, and construction pumps for heating and cooling. Electricity usage will
trades. Jobs created in wind and solar PV alone will be become 50% more efficient, accomplished by increased
enough to replace all jobs lost in the fossil fuel industry. efficiency of lighting and other appliances as well as
greatly reduced losses from smarter power transmission
infrastructure and the phaseout of energy related to fossil
fuel extraction and processing.
86 7
Heating demand will be met The transportation sector will
largely through the use of on-site be increasingly electrified, but
or district heating sources such roughly half of transportation
as geothermal, solar heating, or needs will be met through liquid
sustainable biomass, as well as fuels such as hydrogen,
clean electricity. sustainable biofuels, or
synthetic fuels.
Globally, the electrification of heating for both industrial The electrification of transport will greatly increase –
and building sectors will increase from 2% in 2020 to 13% from less than 2% in 2020 to 18% in 2030, 45% in 2040, and
in 2030, 23% in 2040, and 30% in 2050. The remaining 50% electrification by 2050. A major increase in electric
heating demand will be met increasingly by direct renew- rail, a reduction in domestic aviation, and energy efficiency
able sources, scaling up from 20% in 2020 to 43% in 2030, measures reduce consumption by 60% from 2020 levels.
62% in 2040, and 70% by 2050. Geothermal and solar heat- Approximately 20% of vehicles will be powered by hydro-
ing will provide more than half of direct heating supply. gen, with the remaining 30% from carbon-neutral synthet-
Estimated investments in renewable heating technologies ic fuels and biofuels, which are well suited for aviation
to 2050 will amount to approximately $344 billion per and shipping needs. On a global level, internal combustion
year. The largest share of this investment would be for engines will be almost entirely phased out by 2050. In
heat pumps – approximately $5.7T total, followed by in- OECD regions, cars with internal combustion engines that
vestments in solar collectors and geothermal heat use. use oil-based fuels will be phased out by 2040, whereas in
Energy efficiency plays a major role by keeping consump- Latin America or Africa, for example, a small share of
tion relatively flat. internal combustion engine powered cars, fueled with
biofuels or synthetic fuels, will still be on the road but will
be gradually replaced by electric drivetrains.
F20 - Policy Briefing #2/2020
98
Not every region will move
at the same speed.
While global renewables will make up an average of 56% renewable sources by 2030, targets will vary by region.
APCAG takes a “common but differentiated” approach to solving the climate crisis, utilizing 10 Integrated Assessment
Modeling (IAM) regions to depict a global transition in which wealthier countries move more quickly, while developing
countries can proceed more gradually. For this reason, the model is disaggregated into regional targets that are specific
and actionable for each region:
2030 Regional v. Sectoral Renewable Energy Targets to Achieve 1.5°C
Electrifi-
Region Transport Industry Buildings Final Energy cation RE Power*
North
59% 62% 73% 65% 39% 84%
America
Latin
30% 77% 81% 67% 35% 91%
America
Europe 34% 39% 38% 56% 43% 74%
Africa 11% 63% 87% 68% 21% 73%
Middle East 13% 26% 39% 28% 30% 58%
Eurasia 22% 48% 47% 42% 27% 66%
India 34% 58% 82% 65% 39% 77%
China 31% 45% 65% 49% 63% 45%
Other Asia 21% 60% 83% 62% 33% 74%
OECD Pacific 42% 51% 53% 50% 48% 68%
WORLD 36% 54% 69% 56% 38% 73%
F20 - Policy Briefing #2/2020
* RE Power figures represent renewable shares of final electricity delivered to the end-user. See Chapter 8 in Achieving the Paris Climate Agreement Goals (2019) for shares of
renewable electricity generation and installed capacity.
10Below are the modeled targets and key findings
for each of the 10 IAM regions from 2020-2050:
OECD North America 1.5C RE Share 2020 2030 2040 2050
• An ambitious energy efficiency program is required.
• Wind and solar power generation will be the backbone Transport 6% 59% 96% 100%
of the power supply, supplemented by hydropower and
concentrated solar power (CSP). Industry 17% 62% 93% 100%
• There is a high potential for CSP in Mexico and the
southern USA. Buildings 16% 73% 98% 100%
• There is a high potential for offshore wind to power
the coastal regions, supporting the production of Final Energy 12% 65% 96% 100%
hydrogen and synthetic fuels for the transport sector.
• Post-2030 natural gas power plants will switch to Renewable 24% 84% 99% 100%
Power
renewable-produced methane and/or hydrogen,
reusing the natural gas infrastructure.
• Electromobility and hydrogen trucks and buses should
enter the market earlier and faster than other regions.
• Biofuels will bridge the gap, providing carbon-neutral
fuels until more powertrain technologies dominate
the vehicle market.
Latin America 1.5C
RE Share 2020 2030 2040 2050
• There is a high potential for efficiency measures and
large-scale renewable electrification of heat and
Transport 13% 30% 96% 100%
transportation thanks to rapid urbanization.
• There is a high overall potential for renewable energy
Industry 48% 77% 96% 100%
across all sectors, with the largest biomass potential of
any region.
Buildings 58% 81% 97% 100%
• The region also has a long-term deployment of
biofuels, especially in Brazil, where bioethanol for
Final Energy 39% 67% 96% 100%
transport is already competitive.
Renewable • The most important renewable technologies are solar
69% 91% 99% 100%
Power PV and onshore wind, followed by CSP (especially in
the Atacama Desert in Chile) and offshore wind.
E. Eurasia 1.5C RE Share 2020 2030 2040 2050
• Currently, the main energy carrier is natural gas,
followed by oil with renewables quite limited to date.
Transport 2% 22% 88% 100%
F20 - Policy Briefing #2/2020
• There are large energy resources in biomass, wind
power, solar PV, and also geothermal. Industry 9% 48% 75% 100%
• There is significant potential for energy efficiency
measures across all sectors. Buildings 13% 47% 79% 100%
• Challenges for this region include high heat demand,
large rural areas, major oil and natural gas reserves, Final Energy 9% 41% 79% 100%
as well as an uneven distribution of wealth.
Renewable 23% 66% 88% 100%
Power
11Below are the modeled targets and key findings
for each of the 10 IAM regions from 2020-2050:
Middle East 1.5C RE Share 2020 2030 2040 2050
• Despite current oil dependency, the Middle East can be
seen as a model solar and hydrogen region, with
Transport 1% 13% 84% 100%
massive solar potential and excellent conditions for
hydrogen production.
Industry 5% 26% 71% 100%
• Given very high transport demand, large scale electri-
fication is crucial in this region.
Buildings 7% 39% 84% 100%
• As water scarcity is a problem, there are opportunities
to combine large CSP plants with water desalination to
Final Energy 4% 28% 79% 100%
reduce the pressure on water supply systems.
• Scarce biomass must be limited to high-temperature Renewable 11% 58% 97% 100%
process heat where other renewable sources cannot be Power
used, leading to a high demand for hydrogen or
synthetic fuels.
Africa 1.5C
RE Share 2020 2030 2040 2050
• North Africa currently has a strong dependence on oil,
but vast solar potential and a high electrification rate.
Transport 2% 11% 56% 100%
Africa and Europe are technically in a good position to
form an economic partnership for solar energy
Industry 31% 63% 93% 100% exchange.
• Sub-Saharan Africa has low urbanization and a lack of
Buildings 81% 87% 98% 100% access to electricity for two-thirds of its people.
Modernizing traditional biomass use could lead to
Final Energy 57% 68% 90% 100% significant demand reduction due to the current
prevalence of inefficient cooking and heating methods.
Renewable 27% 73% 98% 100% • Africa has significant potential for most renewables,
Power
including biomass, hydro, geothermal, solar, and wind.
• A small share of internal combustion engine-powered
cars, fueled with biofuels or synthetic fuels, will still
be on the road, but will be gradually replaced by
electric drivetrains.
Non-OECD Asia 1.5C RE Share 2020 2030 2040 2050
• On average, 77% of Southeast Asia has access to
electricity, but this varies widely in the region.
Transport 4% 21% 85% 100%
Myanmar and Cambodia, for example, have 30%
F20 - Policy Briefing #2/2020
access while Singapore, Thailand, and Vietnam have
close to 100%. Industry 18% 60% 83% 100%
• In Southeast Asia, 46% of the population still relies on
traditional biomass. Buildings 61% 83% 91% 100%
• Even though the outlooks for individual countries
Final Energy 31% 62% 87% 100%
deviate widely from the average, the model accounts
for the full spectrum of renewable resources and
Renewable
technological development available across the region. 20% 74% 90% 100%
Power
12Below are the modeled targets and key findings
for each of the 10 IAM regions from 2020-2050:
India 1.5C RE Share 2020 2030 2040 2050
• India has limited CSP potential but possesses a large
potential for PV power generation.
Transport 1% 34% 91% 100%
• Wind power potential is expected to be limited by
land-use constraints, but the technical potential Industry 20% 58% 88% 100%
estimated from available meteorological data is large.
• Approximately 815 million people still rely on tradi- Buildings 60% 82% 96% 100%
tional biomass for cooking. Due to population and GDP
growth, increasing living standards and increasing
Final Energy 33% 65% 92% 100%
mobility, it is expected that overall energy demand
will increase significantly.
Renewable 23% 77% 96% 100%
• The nation has a large potential for energy efficiency Power
and electrification.
• Under the 1.5C Scenario, new renewables, mainly
wind, solar, and geothermal energy, will contribute
90% of the total electricity generation by 2050.
China 1.5C
RE Share 2020 2030 2040 2050
• Economic prosperity has been driven largely by coal
power, which provides over two-thirds of primary
Transport 3% 31% 91% 100%
energy supply today, but there is high renewables
potential, especially solar thermal power in the west,
Industry 12% 45% 79% 100% onshore wind in the north, and offshore wind in the
east and southeast.
Buildings 33% 65% 89% 100% • China has pledged to reduce CO 2 emissions before
2030 and already has ambitious renewables targets.
Final Energy 16% 49% 84% 100%
• The expansion of hydropower generation is currently
also seen as a major strategy.
Renewable 30% 63% 89% 100%
Power • Electrification of heating, manufacturing, and trans-
port in high-renewable areas is being encouraged,
including the use of renewable electricity for heating
to reduce the curtailment of wind, solar PV, and
hydropower.
• China’s solar PV and wind power markets are the
largest in the world and represent about half the global
annual market for solar PV and a third of the market
for onshore wind. Under the 1.5C scenario, the current
solar PV market doubles.
F20 - Policy Briefing #2/2020
13Below are the modeled targets and key findings
for each of the 10 IAM regions from 2020-2050:
OECD Pacific 1.5C RE Share 2020 2030 2040 2050
• While renewable energy resources are abundant in
Australia, they are limited across New Zealand, Japan
Transport 1% 42% 92% 100%
and South Korea.
• Following the accident at Fukushima and the imple- Industry 14% 51% 83% 100%
mentation of feed-in tariffs for renewable electricity,
the expansion rates for renewable energies, in particu-
lar PV, have risen sharply in Japan. Buildings 15% 53% 87% 100%
• Large distances across marine areas prevent physical
Final Energy 11% 50% 86% 100%
grid connections for power transmission between
countries.
Renewable 22% 68% 92% 100%
• Hydrogen and synfuels will be used for long-term Power
storage of renewable power and provide an option
for balancing the renewable energy supply across
borders.
• Cars with internal combustion engines using oil-
based fuels are phased-out by 2040 in the model.
FINDINGS ON LAND USE
Top-level findings:
Nature-based solutions and
land use
The APCAG 1.5C model is one of the first to combine Therefore, deforestation and other forms of land
energy decarbonization with large-scale natural resto- conversion will have to decline much more quickly. In
ration, delivering the carbon removal required to addition, reductions in methane and nitrogen will also
achieve the 1.5°C limit. Restoration of natural carbon need to be achieved in the agriculture sector. Without
sinks through forestry and land use pathways could nature-based solutions the 1.5°C limit is not possible,
remove a maximum of 513 GtCO2 by the end of the even with a rapid decline in fossil fuel emissions.
century. However, a significant portion of this would be
There are four main natural sequestration pathways
required to offset ongoing Agriculture, Forestry and
utilized in the model, divided into temperate and tropi-
Other Land Use (AFLOU) emissions, estimated to be
cal zones – reforestation, natural forest restoration,
F20 - Policy Briefing #2/2020
124 GtCO2 through 2100 in the APCAG model per SSP2,
sustainable forest management, and cropland afforesta-
which assumes a gradual phase-out of AFOLU emis-
tion (trees in croplands):
sions to 2080. Given political realities, realizing 100% of
the identified restoration potential is unlikely.
14Carbon Removal Potential of Land Restoration Pathways 2020-2100
Total Removal (GtCO2)
Trees on croplands (tropical)
189
Trees on croplands (temperate)
31 Sustainable forest mgmt (tropical)
12,000 71 Sustainable forest mgmt (temperate)
69
Reforestation (tropical)
85 Reforestation (temperate)
Carbon Dioxide Removal (MtCO2)
10,000 36
28 Forest restoration (tropical)
4 Forest restoration (temperate)
8000
Gas
6000
4000
Gas
2000
2015 2020 2025 2030 2035 2040 2045 2050 2055 2060 2065 2070 2075 2080 2085 2090 2095 2100
APCAG presents for the first time a statistical analysis (Monte Carlo) of the time horizons and potential cumulative carbon uptake for four major forest restoration pathways, divided in
temperate and tropical zones. The chart shows total potential carbon removal of 513 GtCO2 through these pathways, with a rapid deployment beginning in the 2020s.
Wilderness is vital Large scale reforestation
Wildlands cover approximately 50% of the Earth’s terres- The most important sequestration measure identified is
trial area and are vital to the world’s carbon cycle, seques- large-scale reforestation, particularly in the subtropics
tering as much as one-quarter of anthropogenic carbon and tropics. Under the 1.5C model, 300 Mha of land area is
emissions and storing approximately 450 gigatonnes of reforested in the tropics, and an additional 50 Mha is refor-
solid carbon.10 Preserving these intact lands and forests ested in temperate regions.
is key to maintaining our global carbon sinks, making the
Natural restoration
1.5°C limit possible.
The second most important pathway for carbon removal
An end to deforestation relies upon natural forest restoration or rewilding, increas-
Today, land use change accounts for more than 10% of ing carbon density within approximately 600 Mha of
global CO2 emissions, approximately 4 GtCO2 per year, existing forests. Reduced logging and better forestry
resulting largely from the clearing of forests for agricul- practices on managed forests also significantly contribute
tural land or other forms of development. Rapidly phasing to total carbon removal.
out the practice of deforestation would greatly increase
the chance of achieving the 1.5°C limit.
“
Citing a growing body of research, we show that using land restoration efforts to
F20 - Policy Briefing #2/2020
meet negative emissions requirements, along with a transition to 100% renewable
energy by 2050, gives the world a good chance of staying below the 1.5°C target.
”
MALTE MEINSHAUSEN
CO-AUTHOR AND FOUNDING DIRECTOR OF THE CLIMATE AND ENERGY COLLEGE AT THE UNIVERSITY OF MELBOURNE
15The role of agriculture
Even with a rapid transition to renewable energy and a large-scale deployment of natural carbon removal, it is still not
quite enough to achieve the 1.5°C limit. We must also reduce net emissions from the agricultural sector.
There are four priorities for agriculture:
1. Planting trees on croplands 2. Reducing livestock and meat consumption
Tree cropping – a strategy that uses tree The 1.5C model calls for a 50% reduction in methane
planting within croplands – can significantly emissions by 2030 (from approximately 400 to 200
increase carbon storage on agricultural MtCH4) mostly by reducing livestock and waste emis-
lands. The model estimates that planting sions. Today, roughly half of the world’s agricultural
trees on 400 Mha of cropland can achieve land is used to grow livestock feed and fuel crops.
approximately 30 GtCO 2 of carbon removal Reducing meat consumption is a key strategy both to
by 2100. solving climate change and increasing food security.
3. Reducing chemical use 4. Cutting waste
The climate model also calls for a reduction of nitrogen Roughly 30% of produce yields are wasted. Cutting food
emissions by about one-third (from approximately 7 to waste in half will reduce potential landfill emissions,
4.5 MtN20) mostly by reducing agrochemicals and while increasing crop yields and reducing the pressures
improving agricultural practices. that lead to deforestation.
Agroecology & other natural climate solutions
There is a growing body of scientific literature that looks at other natural climate solutions – from wetlands and
grasslands restoration to agroecological solutions like silvopasture, multistrata agroforestory, covercropping, mycor-
rhizal applications, and municipal composting. While the APCAG climate model did not factor in these solutions, they
do hold promise as a means to remove additional greenhouse gases, thereby further lowering global temperatures.
Future versions of the climate model will explore these potential solutions.
“
The model shows just how important our natural ecosystems are.
Nature is the missing key. While the renewable energy transition is
imperative to solving the climate crisis, it isn’t enough. Currently, wild-
lands and oceans absorb one-half of all our CO 2 emissions. As this
climate model shows, in order to keep global temperatures below 1.5°C,
we have to keep our natural carbon sinks intact, while
scaling up restoration efforts to achieve carbon removal.
”
F20 - Policy Briefing #2/2020
KARL BURKART,
MANAGING DIRECTOR OF ONE EARTH
16CONCLUSION
The 1.5C model presented
in Achieving the Paris
Climate Agreement Goals
is a major development in
our thinking about what is
possible if we mobilize
our resources today.
At a time when COVID-19 has transformed lives across the
world, we now get to choose how we will rebuild. Will we
continue to subsidize fossil fuels to the detriment of our global
climate system, or will we invest in a green future? We now
know that we don’t need to wait for new technologies or
solutions. We can choose to be prepared, to increase resilience,
and to unlock huge social and economic co-benefits as we
create a climate-friendly future.
F20 - Policy Briefing #2/2020
17The Role of Foundations
1 2 3
Advocate Fund national and subnational Invest to increase
for 1.5°C 1.5°C compliant models resilience
G20 countries are responsible for Foundations have a crucial role to Foundations should invest in line
80% of greenhouse gas emissions, play in funding cutting-edge sci- with the 1.5°C pathway, especially as
therefore it is their responsibility to ence that can inform and inspire the economic fallout from the
lead the transition. However, decision makers at all levels of COVID-19 epidemic threatens to
governments are often constrained government. The 1.5C model was unwind some of the momentum and
by politics and policies. Foundations philanthropically funded, and foun- progress made in the past few years.
can help fill leadership gaps by dations can help drive the next Investing in renewable energy
advocating for the 1.5°C limit and crucial step by funding national infrastructure and the conservation
increasing the ambition level in 1.5°C compliant models in their own and restoration of ecosystems will
Nationally Determined Contribu- countries, regions, and cities. help make societies more resilient to
tions (NDCs) for both energy and the threats of environmental degra-
land mitigation under the UN dation and climate change.
Framework Convention on Climate
Change.
“
Foundations and philanthropy can play a key role in these challenging times.
We need ‘all hands on deck’ and foundations represent an important cross sectoral
group. F20 convenes foundations and philanthropic institutions that are indeed
willing to take a stand in that regard. With more than 60 partners, mainly from the
G20 countries, the F20 platform can contribute to making our societies more resil-
ient and help shift G20 politics into that direction. F20 can also help to build bridges
between civil society, the business and the financial sector,
think tanks and politics.
”
STEFAN SCHURIG,
F20 SECRETARY GENERAL
F20 - Policy Briefing #2/2020
Learn more
If you would like to examine the complete 1.5°C model,
the book is available as a free download. Also feel free to
visit One Earth, for high-level explanations of the
various solutions pathways.
18REFERENCES
1 International Energy Agency (2020). Global Energy Review 2020.
Available at: https://www.iea.org/reports/global-energy-re-
view-2020
2 Abnett, Kate (2020). Factbox: Key climate spending in EU's 'green
recovery' plan. Reuters 27 May 2020.
Available at: https://uk.reuters.com/article/us-eu-budget-recovery-
climate-factbox/factbox-key-climate-spending-in-eus-green-recov-
ery-plan-idUKKBN2331RB
3 Intergovernmental Panel on Climate Change (IPCC) (2018). SR15 –
Special Report: Global Warming of 1.5 °C.
Available at: https://www.ipcc.ch/sr15/
4 Teske, Sven (Ed.) (2019). Achieving the Paris Climate Agreement
Goals – Global and Regional 100% Renewable Energy Scenarios
with Non-energy GHG Pathways for +1.5°C and +2°C.
Available at: https://www.springer.com/gp/book/9783030058425
5 Australian Government – Bureau of Meteorology (2020). Climate
change – trends and extremes.
Available at: http://www.bom.gov.au/climate/change/#tabs=Track-
er&%3Btracker=timeseries&%3BtQ=&area=aus&season=0112&ave_
yr=10&tracker=timeseries&tQ=graph%3Dtmean%26area%3Daus%-
26season%3D0112%26ave_yr%3D0
6 World Meteorological Organization (2020). New record for
Antarctic continent reported.
Available at: https://public.wmo.int/en/media/news/new-re-
cord-antarctic-continent-reported
7 World Health Organization (2016). Mortality and burden of disease
from ambient air pollution – Situation and trends.
Available at: https://www.who.int/gho/phe/outdoor_air_pollution/
burden_text/en/
8 Naicker, P.R. (2011). The impact of climate change and other factors
on zoonotic diseases.
Available at: https://www.researchgate.net/publication/287523149_
The_impact_of_climate_change_and_other_factors_on_zoonot-
ic_diseases
9 Coady, David; Parry, Ian; Le, Nghia-Piotr; Shang, Baoping – IMF
Working Paper (2019). Global Fossil Fuel Subsidies Remain Large:
An Update Based on Country-Level Estimates.
Available at: https://www.imf.org/en/Publications/WP/Is-
sues/2019/05/02/Global-Fossil-Fuel-Subsidies-Remain-Large-An-
Update-Based-on-Country-Level-Estimates-46509
10 Erb, Karl-Heinz et al. (2017). Unexpectedly large impact of forest
management and grazing on global vegetation biomass.
Available at: https://www.nature.com/articles/nature25138
F20 - Policy Briefing #2/2020
19F20 Head Office at the Environmental Foundation Michael Otto
Glockengießerwall 26 – 20095 Hamburg – Germany
info@foundations-20.org – www.foundations-20.org
This executive briefing was produced by F20 in partnership and based on research
led by University of Technology Sydney with support from One Earth.You can also read