Validating Gauge-based Spatial Surface Atmospheric Temperature Datasets for Upper Benue River Basin, Nigeria
←
→
Page content transcription
If your browser does not render page correctly, please read the page content below
Nigerian Journal of Environmental Sciences and Technology (NIJEST)
 www.nijest.com
 ISSN (Print): 2734-259X | ISSN (electronic): 2734-2603

 Vol 5, No. 1March 2021, pp 173 - 190

 Validating Gauge-based Spatial Surface Atmospheric
 Temperature Datasets for Upper Benue River Basin, Nigeria
 Salaudeen A.1,2,*, Ismail A.1, Adeogun B. K.1 and Ajibike M. A.1
 1
 Department of Water Resources and Environmental Engineering, Ahmadu Bello University Zaria, Nigeria
 2
 Department of Civil Engineering, Abubakar Tafawa Balewa University, Bauchi, Nigeria
 Corresponding Author: *asalaudeen@atbu.edu.ng

https://doi.org/10.36263/nijest.2021.01.0259
ABSTRACT
Like most other countries of Africa, one of the main problems threatening effective impact
modelling in Nigeria including Upper Benue river basin, dwells in lack of high-quality in-situ
observation datasets at appropriate spatiotemporal scales. Gridded meteorological variables can
serve as promising alternatives to in-situ measurements in data sparse regions, but then, require
validations to assess quantitatively their level of accuracies and reliabilities. As a consequence,
this study makes comparative analysis of two gauge-based, spatially interpolated surface
atmospheric temperature datasets with in-situ measurements in seven distinct meteorological
stations covering the period of 1982-2006. Correspondingly, spatial analysis and statistical
measures were used to assess the performances of the gridded datasets from the Climate Research
Unit (CRU) and the Climate Prediction Centre (CPC). Results from spatial distributions depict 8,
11 and 10 °C as observed minimum temperatures and 33, 36, 42 °C as observed maximum
temperatures over the Cameroon highland (Gembu), the Jos plateau and at the northern fringes of
the basin respectively. Consequently, both the CRU and CPC datasets captured remarkably well
the observed temperature gradients along the varying topography, though with differing margins.
The interannual variabilities indicate CRU dataset to better capture the signs and magnitudes of
the observed anomalies as compared to the CPC data. Moreover, the CRU data was noted to be
more outstanding in representing the observed features in seasonal temperature variations over
most stations. Also, the shapes of the probability density function (PDF) for both datasets in
minimum and maximum temperatures measured closely the shapes of the observed PDF. Trend
analysis suggests CRU datasets to better represent the warming and the cooling trends than the
CPC. Overall, the CRU datasets are the most outstanding in this study and is therefore preferred
for water resource application over the study area.

Keywords: Assessment, Upper Benue river basin, temperature, CRU, CPC

1.0. Introduction

The variations of near-surface air temperature are influential on agriculture, hydrology, energy and
ecosystems; as it is one of the key elements, which represent the state of the atmosphere (Adeniyi and
Dilau, 2015; Chen et al., 2014). Thus, understanding the climate systems of a region and their impacts
on the environment depends largely on accurate meteorological observations (Chen et al., 2014;
Akinsanola and Ogunjobi, 2014). The significant input from Africa continent to the global climate
system is well documented in literatures, yet, ground observation networks are non-existence in most
remote areas (Hassan et al., 2020), where they are needed for analysis. Even where they exist, the
datasets are usually characterized with gaps, limited and restricted accessibility and inadequate
spatiotemporal continuity and distributions (Piyoosh and Ghosh, 2016). This is particularly true for
most developing countries. This scenario is more poignant in Upper Benue river basin in the northeast
of Nigeria, considering the few number of gauging stations for the entire basin. Nevertheless,
advancement in computational technologies in recent decades has aided the availability of climate
datasets in digital forms over the entire globe (Daly, 2006), which serve as key input data for
computer models, particularly in water resource and environmental managements as well hydro-
climatological impact assessments.

Salaudeen et al., 2021 173
Nigerian Journal of Environmental Sciences and Technology (NIJEST) Vol 5, No. 1 March 2021, pp 173 - 190

The climate datasets have however, witnessed heavy usage within the scientific community, most
especially in data sparse regions. Though, the gridded datasets undergo rigorous quality control
checks before interpolations. Anyway, errors in datasets are functions of spatial variability of the
gauging stations. Therefore, river basins with insufficient meteorological stations and low spatial
variability are prone to large interpolation errors (Tanarhte et al., 2012). This explains the sole reason
why there is striking regional difference in the datasets, despite their correspondence in geographical
distributions and temporal trends (Chen et al., 2014; Burton et al., 2018; Hassan et al., 2020). It is
therefore imperative to validate them against ground reference observations, to ascertain their level of
accuracies and reliabilities, to avoid drawing erroneous scientific conclusions and defective decisions,
which may arise due to poor quality data.

Minimum and maximum temperatures and rainfall datasets are the most common meteorological
variables provided by most of the world’s meteorological organizations, owing to their dominant
influence on hydrology, meteorology and agrometeorology. In any case, precipitation datasets have
remained the most studied meteorological variable in recent literature, with less attentions being paid
to validation of the temperature products. Consequently, this study presents the inter-comparison of
the near-surface atmospheric temperature datasets (Collins, 2011) developed by the Climate Research
Unit (CRU) at the University of East Anglia and the Climate Prediction Centre (CPC)-Global Unified
Gauge-based Analysis with in-situ measurements to assess their skills in simulating changes in the
present climate systems (Fu et al., 2013).

Of the three available gridded datasets namely, gauge-based observations, reanalysis datasets and
satellite estimates; gauge-based observations provide relatively accurate and reliable measurements
(Hassan et al., 2020). This premised on the fact that they are products of geospatial interpolation of
ground-based measurements (Kanda et al., 2020). This accounts for the sole reason why it has been
widely used recently, as the basis for drawing scientific conclusions and management decisions.
Although the reanalysis products combine irregular measurements of climate data and models to
produce a synthesized estimate with uniform spatial distribution and temporal continuity (Sun et al.,
2018). They are however, widely used by scientists, but are considered non-observation data. The
satellite estimates are well known for adequate spatiotemporal scales, but contain random errors and
non-negligible biases (Kanda et al., 2020; Hassan et al., 2020). The fact that the land surface
temperatures are derived from satellite estimates through retrieval algorithms from the measured
radiant emitted from earth back into the space (Hooker et al., 2018; Kanda et al., 2020), exacerbates
the uncertainties.

Nonetheless, gauge-based temperature datasets have been validated in recent literature to suggest
probably the most credible datasets for a particular region. For example, Tang et al. (2010) inter-
compare a number of temperature datasets over China for 100 years period including CRU. Findings
from their study showed CRU to be in good concurrence with the Northern Hemisphere, Chinese and
Global series. Tanarhte et al. (2012) evaluated the performances of global and regional precipitation
and temperature datasets relative to ground observational data over the Middle East and
Mediterranean, and remarked that the global temperature datasets including CRU and CPC have good
skills in representing the observed pattern over all the sub-regions. In a similar study over Dehradun,
India, Piyoosh and Ghosh (2016) noted good correlation between CRU temperature dataset and in-situ
observations for different periods between 1901 and 2012. They further opined that the CRU captured
well the trends of the observed pattern both in magnitude and direction. Also, Nashwan et al. (2019)
examined the capabilities of three gauge-based observations including, CRU, CPC and Udel in
replicating the observed temperature patterns for the purpose of developing high-resolution
temperature datasets for the north central part of Egypt, and showed CPC-global to be most
outstanding of all. However, Kanda et al. (2020) compared seven gridded climate datasets with
ground observations over northwest Himalaya; they found out that interpolated temperature estimates
better represent the observed pattern than their corresponding precipitation datasets over the
mountainous region. The findings revealed CRU, ERA-I, PGF and Udel to outperform APHRODITE
at all zones. Furthermore, Hassan et al. (2020) analysed the annual cycle of three gridded climate
products such as; CRU, PGF and CFRS in terms of correlation and errors over Niger Delta region of
Nigeria for the common period of 1980-2005. Findings from their study recommended CRU data for
hydrological applications over the region owing to its least error and highest degree of
correspondence with the ground reference observational data.

174 Salaudeen et al., 2021
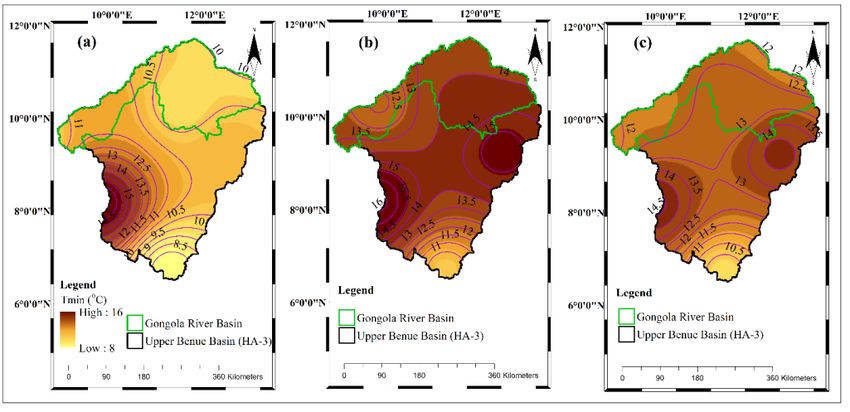
Nigerian Journal of Environmental Sciences and Technology (NIJEST) Vol 5, No. 1 March 2021, pp 173 - 190

Studies on atmospheric temperature in Upper Benue river basin is very limited despite its importance,
but over the larger Nigeria. Abatan et al. (2016) studied the trends in extreme daily temperatures
(Tmin and Tmax) for 21 stations distributed over the whole Nigeria. Adebayo and Yahya (2015)
assessed trends in mean monthly temperature in Savannah Sugar Plantation. Akinsanola and Ogunjobi
(2014) investigated variabilities in temperature and precipitation using records from 25 synoptic
stations over the whole country. Eludoyin et al. (2014) studied the changes in thermal conditions over
the entire Country through temperature and relative humidity. Weli et al. (2017) carried out statistical
analysis on minimum and maximum temperatures in Port Harcourt metropolis. Hassan et al. (2020)
inter-compared basic meteorological dataset including minimum and maximum temperatures and
precipitation in the Niger Delta with ground observational dataset for water resources management.
The whole of these studies focused on trend analysis and variability, except Hassan et al. (2020) who
evaluated the performances of the temperature data relative to ground observational dataset. However,
the study domain lies in the Niger Delta region. It is therefore clear that despite the potentials of the
Upper Benue river basin, studies to evaluate gridded temperature data in the basin does not exists,
which create significant research vacuum to be filled. The focus of this study therefore dwells on
validating gauge-based spatial interpolated atmospheric temperature dataset including; CRU and
CPC-global for the common period of 1982 -2006 over Upper Benue river basin for possible water
resource applications.

2.0. Materials and Methods

2.1. The study area
The Upper Benue river basin lies between the tropical rain forests of the southern Nigeria and the
Savannah of the north, comprising of four states in the northeast including; Adamawa, Bauchi,
Gombe and Taraba states as shown in Figure 1. Though, the basin cut across some other states,
notably; the Jos plateau, Yobe and Borno states. It is one of the twelve River Basin Development
Authorities (RBDA), with its administrative headquarters in Yola, Adamawa state; and at the same
time the hydrological area 3 (HA-3) out of the eight designated hydrological areas in Nigeria. The
basin encompasses an area of approximately 156,546 km2. The Jos plateau, the Cameroon highlands
and the Biu plateau, which form the western, the southern and the north-eastern boundaries, greatly
influence the basin’s micro-climate, owing to its varying topography.

 Figure 1: The study area

Three categories of climate are identified with the study area as; the northern Guinea savannah, the
Sudan savannah and the montane or highland climates. The northern Guinea savannah extents from
the Jos plateau to the southern region of the basin in Taraba state, and over an isolated portion of the
Biu plateau. The central and the northern fringes of the basin exhibit Sudan savannah climate.
Consequently, the montane climate is experienced over the Cameroun highlands (Eludoyin et al.,
Salaudeen et al., 2021 175
Nigerian Journal of Environmental Sciences and Technology (NIJEST) Vol 5, No. 1 March 2021, pp 173 - 190

2014), which lies at the southernmost part. Annual rainfall over the basin ranges from 700 mm to over
1800 mm (Federal Government of Nigeria, 2012), which contributes over 60.2 billion m3 to the total
annual flow of river Benue (Japan International Cooperation Agency (JICA), 2014). Essentially,
through the two major river systems; the Gongola, which lies on the right arm of Benue; and the
Donga, which is situated on the left arm. These two major tributaries are well known for the annual
runoff volumes they contribute to the Benue. They are rated as the largest and the second largest from
each arm respectively. The annual temperature of the basin is 26 °C, though it is lower on the plateaus
(Federal Government of Nigeria, 2012). The dry season extents from December to March which is
usually dry, with prevailing harmattan winds. The dwellers rely mainly on rain-fed agriculture. Thus,
agro as well as hydroclimatic studies for the region are crucial for sustainable agriculture and water
resource managements. In spite of these potentials, spatiotemporal distribution and continuity of in-
situ observational datasets is limited; and therefore, appeal for alternative sources of accurate and
reliable datasets, which can only be obtained through proper validations.

2.2. Datasets
The monthly minimum and maximum near-surface air temperature datasets consisting of seven
stations in and around Upper Benue river basin with 24 years records, covering the period of 1982-
2006, were procured from the Nigerian Meteorological Agency (NiMET), Abuja; although, the
datasets of Dadin Kowa, Gembu and Yola were obtained from the archive of the Upper Benue River
Basin Development Authority (UBRBDA), Yola. These serve as reference observations for the
evaluations. The geographical distributions of these stations are sparse and uneven over the basin
(Figure 1), owing to the few number of stations maintained by the agency in each state; although,
meteorological data are measured by some other organisations e.g. UBRBDA and some higher
institutions of learning. However, the datasets are in most cases characterised with gaps, which often
render them unsuitable for hydro-climatological impact assessments. Nonetheless, the stations are
sited at key locations over the basin, where measurements are most critical.

The Climate Research Unit (CRU TS3.10) datasets were developed at the University of East Anglia,
with major contribution from World Meteorological Organization. The data derived its sources mainly
from the Global Historical Climatology Network (GHCN-v2), monthly climate bulletin (CLIMAT)
(Tanarhte et al., 2012), Monthly Climate Data for the World (MCDW) and World Weather Records
(WWR) consisting of over 4000 stations globally (Akinsanola et al., 2016). They consist of gridded
climatological variables (Tmin, Tmax and prec) at 0.5° spatial resolutions at monthly scales covering
the entire global land surface from 1901-2014 (Harris et al., 2014; New et al., 2000). However, the
daily datasets of the CRU are available globally for the period 1970-2006, downloadable from
www.2w2e.com (Vaghefi et al., 2017). The dataset underwent stringent quality control checks
through an automated method (New et al., 2000). Anomalies are interpolated rather than the absolute
values of the data, which consequently produces high-quality estimates, with fewer biases (New et al.,
1999; Tanarhte et al., 2012). In any case, errors in datasets are functions of spatial variability of the
gauging station. Incidentally, regions with poor station coverage and high spatial variability are prone
to large interpolation errors (Tanarhte et al., 2012), which are noted to be prevalent in cold, dry and
mountainous areas. Nonetheless, temperature data produce estimates with better quality than their
corresponding precipitation datasets. The summary of the gridded datasets are shown in Table 1.

Table 1: Summary of selected global, spatially interpolated datasets
 Spatial Geographical Temporal
Dataset & Source Product Reference
 Resolution Coverage Resolution/Coverage
Climate Research Unit
(CRU) at the
University of East CRU TS 3.10 0.50 x 0.50 Global land Daily (1970-2006) (Vaghefi et al., 2017)
Anglia

Climate Prediction
Centre (CPC)-Global
unified gauge-based
 CPC-Global 0.50 x 0.50 Global land Daily (1979-Present) (NOAA/OAR/ESRL PSL)
analysis of daily
minimum and maximum
temperature

176 Salaudeen et al., 2021
Nigerian Journal of Environmental Sciences and Technology (NIJEST) Vol 5, No. 1 March 2021, pp 173 - 190

The Climate Prediction Centre gauge-based analysis of global daily minimum and maximum
temperature and precipitation product was initiated by the National Oceanic and Atmospheric
Administration (NOAA) Climate Prediction Centre. The product is freely available on 0.5°
latitude/longitude grids over the entire global land areas from 1979-present. The mandate is to
construct a set of unified climate datasets with improved quality and inter-product consistency to suite
a wide range of applications. In formulating the CPC-Global datasets, gauge reports from over 30,000
stations worldwide including Global Telecommunication System (GTS), Cooperative Observer
Network (COOP) and other national and international agencies, consisting of in-situ measurements
and satellite estimates were utilised (NOAA/OAR/ESRL PSL).

2.3 Methodology
The minimum and maximum air temperature climatology of two spatially interpolated datasets
including CRU and CPC were evaluated in this study relative to observed meteorological
measurements for 24 years period, covering 1982-2006 over the study domain. The study quantifies
the degree of pattern correspondence between the gridded datasets and ground reference observations
through temporal and geographical distributions and various parametric and nonparametric statistical
indices. They include: Probability density function (PDF) overlap, annual long-term temperature
anomaly, t’, Mann-Kendall test, MK, correlation coefficient, r, refined index of agreement (dref), mean
absolute error, MAE, and mean bias error, MBE.

The temporal distributions of the minimum and maximum temperature examine the annual cycle of
monthly climatology in all the stations. While, the geographical distributions compare each of the
gridded minimum and maximum temperature data over the entire basin with ground observations
using spatial description. The PDFs for the gridded observations and in-situ measurements were
computed for monthly minimum and maximum temperature in all the seven stations to determine the
probability of occurrence of any given data as demonstrated by (Perkins et al., 2007) through
MATLAB distribution fitting. The PDF has been widely used by earlier researchers to compare
between two climate datasets e.g. Maxino et al. (2008), Anandhi et al. (2019) and Kabela and
Carbone (2015). To quantify the area of overlap, which may reveal the degree of correspondence of
the two datasets, Perkins et al. (2007) proposed a metric known as Skill Score. This computes the
cumulative minimum value of the two distributions of each binned value defined as:

 = ∑ ( , ) (1)
 1

where Pm and Po are the modelled and observed probabilities in a given bin, and n is the number of
bins used in computing the PDF. Consequently, a bin size of 0.5° was chosen for both the minimum
and maximum temperature for these assessments.

A comparison of the spatially interpolated and the ground observation datasets was done through
long-term temperature anomaly, defined as:

 − ̅
 = (2)
 ̅

where T is the mean annual temperature of a given year and ̅ is the long-term average temperature,
with positive and negative anomalies indicating warmer and cooler conditions than the baseline period
respectively.

Also, Mann-Kendall test [Eq. 3a-3d)] was employed to examine trends in monthly time series of the
temperature datasets. This is a nonparametric statistic that has been used in earlier studies for trend
analysis in climate time series data due to its robustness (Akinsanola et al., 2017; Abatan et al., 2016;
Agyekum et al., 2018; Shiru et al., 2018; Jia et al., 2019; Mondal et al., 2018; Fu et al., 2013; Akande
et al., 2017). The method was therefore utilized in this study to assess the trends and the magnitude of
monthly time series data at 5 % significant level ( ). The test statistic Sm is given as:

Salaudeen et al., 2021 177
Nigerian Journal of Environmental Sciences and Technology (NIJEST) Vol 5, No. 1 March 2021, pp 173 - 190
−1
= ∑ ∑ ( − ) (3 )
=1 = +1
where x is the temperature variables and n is the number of observations. If − = , it then
follows that:
1 > 1
( ) = { 0 = 0 (3 )
−1 < 1
The standardized Sm is computed by equation of the form:
− 1
> 1
√ ( )
= 0 = 0 (3 )
+ 1
< 1
{ √ ( )
Reports have shown that for ≥ 25, the distribution of Sm statistic is assumed to be normally
distributed. This implies that the mean, = 0, and the variance is defined as:
( − 1)(2 + 5) − ∑ ( − 1)(2 + 5)
( ) = (3 )
18
t is the number of ties.
Basically, the null hypothesis is rejected, should yields result less or equal to the p-value.
In addition to the aforementioned, the correlation coefficient r (Eq. 4a-4b) was applied to quantify the
strength of association between the data distributions. This assesses the observed co-variation, and
generally lies in the intervals, −1 ≤ ≤ 1, where -1 shows negative association, +1 signifies positive
relationship, and 0 means no relationship of any kind between the two datasets.
1 − ̅ − ̅
= ∑ [( )( )] (4 )
−1
=1
1
, = √ ∑( , − ̅ , )2 (4 )
=1
The refined index of agreement ( ) weights errors and differences, which in turn prevents
exaggeration of squared values. It is given as (Willmott et al., 2012):
∑ =1| − |
1− , ℎ
2 ∑ =1| − ̅ |
∑| − | ≤ ∑| − ̅ |
=1 =1
= (5)
∑ =1| − |
− 1, ℎ
2 ∑ =1| − ̅ |
∑| − | > 2 ∑| − ̅ |
{ =1 =1
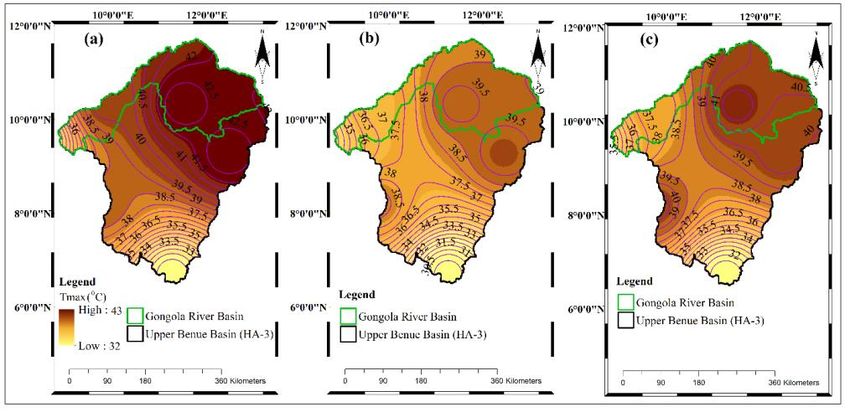
178 Salaudeen et al., 2021Nigerian Journal of Environmental Sciences and Technology (NIJEST) Vol 5, No. 1 March 2021, pp 173 - 190 Consequently, the commonly used error statistics such as; MAE (Eq. 6) and MBE (Eq. 7) were further utilized to quantitatively measure the errors between the observed and the gridded datasets. The MAE presents the magnitude of the mean difference between the measured and interpolated datasets, and varies between 0 and +∞. In any case, 0 value signifies a better score. The MBE demonstrates the degree of under- or overestimation of a model from observed values. It ranges between −∞ and +∞, with 0 value representing a perfect score. 1 = ∑| − | (6) =1 1 = ∑( − ) (7) =1 In Eqs. (4)-(7), and refer to modelled and observed data; ̅ and ̅ are the mean values of modelled and observed data; and define the standard deviation of the modelled and observed data; and n is number of observations. In the 95 % confidence interval of each index value was calculated through bootstrap approach as contained in (Pereira et al., 2018). Finally, it is to be noted that the point-pixel comparison between the datasets were undertaken in this study to avert errors which may arise as a result of gridding of the observed data (Wang et al., 2019). 3.0. Results and Discussion Two selected gridded, gauge-based, minimum and maximum temperature datasets namely; CRU and CPC are validated in this study relative to reference observation data for Upper Benue river basin between 1982 and 2006. These are presented on the annual and monthly timescales as the case may be. 3.1. Spatial distribution The spatial representations of the minimum annual minimum temperature and maximum annual maximum temperature for the 25 years period over Upper Benue river basin are shown in Figure 2 for the reference observational data, CRU and CPC. From the Figure (top row), it is clear that the observed minimum temperature is about 8°C over the Cameroon highland (Gembu),11°C over the Jos plateau and 10 °C at the northern fringes of the basin. Consequently, all the datasets captured remarkably well the observed temperature gradient along the varying topography, though with slight overestimation. However, in terms of magnitude, the CPC gives estimates which are closer to the observed values than the CRU dataset. It is to be noted that each of the two main seasons of the year vis-à-vis; dry and rainy seasons has its peculiar low temperatures, which are mainly controlled by (i) the dust-laden wind (the harmattan) driven by the tropical continental (cT) airmass from the Sahara Desert and, (ii) the tropical maritime (mT) airmass from the Atlantic Ocean which is associated with cloudiness and moist convection (Eludoyin et al., 2014; Abatan et al., 2016). While the high elevations of the eastern and north-central highlands are the driving factors for the low temperatures over the Mambila and the Jos plateaus, incidentally, the low temperature in the northern axis of the basin is induced by the harmattan wind, owing to its proximity to the Sahara Desert. Thus, this explains the sole reason why low temperature is recorded in this region. Salaudeen et al., 2021 179
Nigerian Journal of Environmental Sciences and Technology (NIJEST) Vol 5, No. 1 March 2021, pp 173 - 190

 Figure 2: Geographical distribution of temporal temperature datasets covering the period of 1982-
2006 with the top row illustrating the annual minimum temperature, and the bottom row representing
 the annual maximum temperature for (a) Observed (b) CRU and, (c) CPC.

The observed variations in the maximum annual maximum temperatures (Figure 2, bottom row) over
the study domain show a general increasing trend from south to north with marked peak values of 33,
36 and 42 °C respectively over Gembu, the Jos plateau and the northern fringes of the basin. The
gridded datasets have good representations of the observed trends, though with differing margins.
However, the CPC dataset captured reasonably well the observed pattern than the CRU in this regard.
The influence of inter-tropical discontinuity (ITD) on the microclimate of the basin is significant, as it
controls the spatial variability of climate over Nigeria as a whole, and even the West African
subregion. This is a region of trade-wind confluence which generates weak horizontal pressure
gradients as a result of contact between the cT and mT with consequent, weak wind at the surface.
Though, the Saharan heat-low (SHL) dominates the seasonal progression of air temperature over the
study domain. In any case, the seasonal evolution of the ITD aligns with the seasonal cycle of the
SHL. This accounts for high temperatures being experienced over this region, particularly, during the
month of April, as a result of low humidity, occasioned by dry continental air mass associated with
SHL.

3.2. Air temperature anomalies
The inter-comparison of the anomalies of surface air temperature across the seven meteorological
stations over the basin from 1982 to 2006 is shown in Figures 3 and 4 respectively. Figure 3 presents
the anomalies for minimum temperature, while Figure 4 indicates the maximum temperature
anomalies. Essentially, temperature anomaly measures the inter-annual variability in temperature and
allows assessments of the magnitude of deviation of gridded datasets from the observation.
Consequently, positive anomalies signify warmer conditions, while negative values depict cooler
conditions. The observed anomalies in minimum temperature show increasing trends in all the
stations except over Gembu where a decreasing trend was noticed. These conditions are well
replicated by the gridded datasets, although, they failed to capture the unique cooling condition over

180 Salaudeen et al., 2021
Nigerian Journal of Environmental Sciences and Technology (NIJEST) Vol 5, No. 1 March 2021, pp 173 - 190

Mambila plateau. Interestingly, the gridded datasets represent well the exceptional cooling conditions
of 1989 over all the stations, though, with varying magnitudes. Nevertheless, none of the datasets
systematically performed best over all the stations. The CRU dataset has improved skill in
representing the anomalies over Ibi, Jos and Maiduguri, while CPC dataset better reproduces the
anomalies over Bauchi and Yola. In any case, the gridded datasets have worst performance records
around Dadin Kowa and Mambila plateau.

The ability of the gridded datasets to skilfully replicate the inter-annual anomalies of the maximum
temperature are evaluated similar to the minimum temperature as represented in Figure 4. Here, the
CRU dataset better captures the signs and magnitudes of the observed anomalies as compared to the
CPC dataset. However, the CPC data reproduces the cooling trends in maximum temperature over
Mambila plateau to a very large extent. They signify a cooling trend in almost all the stations rather
than the warming trend noticeable in the reference observation data, thus, this is alien to the warming
trend reported in literature over West Africa including the Upper Benue river basin. It is therefore
evident that CRU outperformed CPC in this regard and better represents the observed anomalies.

Figure 3: Interannual variability of minimum air temperature anomalies of the reference observation
 data and CRU and CPC datasets over UBRB between 1982 and 2006

Figure 4: Interannual variability of maximum air temperature anomalies of the reference observation
 data and CRU and CPC datasets over UBRB between 1982 and 2006
Salaudeen et al., 2021 181
Nigerian Journal of Environmental Sciences and Technology (NIJEST) Vol 5, No. 1 March 2021, pp 173 - 190

3.3. Mean monthly annual cycle of surface air temperature climatology
The results of the evaluation of annual cycle of mean monthly climatology of air temperature are
shown in Figures 5 and 6 respectively, covering a 25 years’ period (1982-2006) over the study domain
for in-situ measurements and gridded temperature datasets. This presents the capability of the gridded
datasets to replicate the seasonal distribution and to demonstrate their skills in capturing the
amplitudes and phases of the observed minimum and maximum temperatures. The variations in mean
annual cycle of temperature exhibit a bimodal pattern with primary and secondary peak values
occurring in the months of April and October respectively everywhere in the basin, except over
Mambila plateau where the peak occurred much earlier in February due to early onset of rainy season.
This is influenced by the montane climate identified with this region. Consequently, the month of
August has a noticeable lowest day and night time temperature values. In any case, the maximum
nocturnal temperatures (Figure 5) are 24 °C in Bauchi, 25 °C around Dadin Kowa, Ibi and Maiduguri,
while Gembu and Jos have unique values of 16 and 18 °C respectively and 21 °C in Yola. The
highest daytime temperature values (Figure 6) are observed to be in consonant with the night
temperatures over the stations, thus, the temperature values at these stations are characterised by
diurnal variation with maximum ranging from 28 to 42 °C.

These observed features in seasonal temperature variations everywhere in the basin are well replicated
to a large extent by the gridded datasets, though with noticeable over- and underestimations. It is
worthy of note that the gridded datasets grossly overestimate the observed pattern over Gembu and
Yola which appear to be more in CPC dataset, suggesting CRU dataset to be more outstanding in this
regard.

 Figure 5: Mean monthly annual cycle of minimum temperature between 1982 and 2006

182 Salaudeen et al., 2021
Nigerian Journal of Environmental Sciences and Technology (NIJEST) Vol 5, No. 1 March 2021, pp 173 - 190

 Figure 6: Mean monthly annual cycle of maximum temperature between 1982 and 2006

3.4. Analysis of PDFs for minimum and maximum temperatures
The capabilities of the spatially interpolated temperature datasets to measure closely the distributions
of the observed minimum and maximum temperature data over the basin was evaluated using PDF
metric along with Perkin’s skill score. Figures 7 and 8 show comparison of observed and spatially
interpolated PDFs for minimum and maximum temperatures respectively; while, Figures 9(a) and (b)
indicate their corresponding PDF-based skill scores. The shapes of the gridded data’s PDFs for both
minimum and maximum temperatures measured closely the shape of the observed PDF, similar to the
findings reported by Perkins et al. (2007), Fu et al. (2013), and Anandhi et al. (2019). Although, the
deviations of the gridded datasets from observed data are substantial in Gembu and Yola for minimum
temperature, but have improved skill in replicating the observed maximum temperature. The CPC
PDFs closely match the observed PDFs over Bauchi and Maiduguri for minimum temperature, while
the CRU produced the best replica over Bauchi, Ibi and Jos plateau for maximum temperature.
The skill score in Figure 9(a) and (b) reveal the strength and weakness of the gridded datasets in
representing the observed PDFs. This generally varies from 0.6 to 0.9 for minimum temperature,
while the range in maximum temperature is between 0.5 and 0.9. The results from the skill score
agree with those obtained from the PDFs. Apparently, the CPC data skill scores are higher for
minimum temperature, while the CRU shows better performance for maximum temperature. In any
case, the CPC dataset is found to have best skill score and therefore appears to be most agreeable with
the reference observational data, hence it is considered to be most outstanding in representing the
distribution of the observed temperature over the entire study domain.

Salaudeen et al., 2021 183
Nigerian Journal of Environmental Sciences and Technology (NIJEST) Vol 5, No. 1 March 2021, pp 173 - 190

Figure 7: Probability density function for observed and gridded minimum temperature dataset

Figure 8: Probability density function for observed and gridded maximum temperature dataset

184 Salaudeen et al., 2021
Nigerian Journal of Environmental Sciences and Technology (NIJEST) Vol 5, No. 1 March 2021, pp 173 - 190

Figure 9: PDF- based skill score for (a) minimum temperature (b) maximum temperature

3.5. Analysis of Statistical Indices

In this section, the results from different statistical methods applied to the monthly minimum and
maximum temperature are presented for the seven weather stations in Upper Benue river basin to
further understand the performance of the gridded datasets. Figures 10 (a) and (b) present the MBE
for the minimum and maximum temperature respectively; while the MAE are shown in Figures 11 (a)
and (b) indicating the quantitative measure of the dataset. Likewise, the root mean square error,
RMSE, coefficient of correlation, r and, refined index of agreement, dref for the datasets are presented
in Table 2 and 3. MBE indicates the degree of over- or under-prediction of observation; while MAE
and RMSE are pointers to the overall performance of the gridded datasets; a high MAE signifies a
poor replica of observation, while a low MAE depicts good performance. This is also true for RMSE.
The r and dref measure the degree of correspondence between the modelled and observed data. The
use of dref for the evaluation in conjunction with r was primarily to strengthen the outputs, since the
results from dref are not influenced by the presence of outliers in datasets. In the main, the two datasets
are noted to have similar biases, though with varying magnitudes: positive bias for the minimum
temperature, while the maximum temperature has negative bias, with exception of few stations. On
the whole, the warm bias is most prevalent over Yola than other stations suggesting overestimation of
the observed minimum temperature. The magnitudes are more in CPC than the CRU datasets.
Conversely, the CRU dataset grossly underestimates the observed maximum temperature in
Maiduguri station, but nevertheless, the underestimations are more in CPC dataset than in CRU,
suggesting a better representation of the observed temperature values.

Figure 10: Mean bias error for (a) minimum temperature (b) maximum temperature

Further assessment using MAE and RSME indices demonstrate similar magnitudes of errors to those
obtained from MBE between the reference ground observation dataset and the gauge-based data.
Consequently, the CRU dataset records the lowest MAE and RMSE in most of the stations with the
exceptions of Bauchi, Gembu and Maiduguri for both minimum and maximum temperature, though
with narrow margins. However, Yola weather station depicts the highest MAE and RMSE and
turnout to be the worst of all stations for both datasets. Nevertheless, the CRU dataset appears to be
substantially better than the CPC owing its low error statistics.

Salaudeen et al., 2021 185
Nigerian Journal of Environmental Sciences and Technology (NIJEST) Vol 5, No. 1 March 2021, pp 173 - 190

Figure 11: Mean absolute error for (a) minimum temperature (b) maximum temperature

The proposed by Willmott et al. (2012) and demonstrated by Pereira et al. (2018) was used to
test the level of agreement of the datasets relative to the reference observations over the study domain.
The results obtained from the are similar to those from r. However, the range of values obtained
using are generally lower but yet credible enough to reveal the accuracy of the datasets. For
instance, the CRU and CPC datasets have r values that vary from 0.72 to 0.97 for minimum
temperature, and 0.61 to 0.92 for maximum temperature. Correspondingly, the dref generally range
between 0.50 and 0.89 for the gridded datasets for both minimum and maximum temperatures.
However, Yola station recorded exceptionally low dref of 0.46 and 0.37 respectively for CRU and
CPC. This range of values concurs with those obtained from r and therefore reveals the strengths of
the temperature products across the basin. Based on level of agreement with the ground reference
observations in terms of correspondence and low error value, CRU was found to be more reliable than
CPC.

The ability of the monthly gridded temperature datasets to measure closely the observed trends was
evaluated over Upper Benue river basin using Mann-Kendal rank statistics, . These are shown in
Tables 2 and 3 for the minimum and maximum temperatures respectively. During 1982-2006, the
observed temperatures in the basin depict statistically significant and nonsignificant warming trends at
5 % significance level over the stations. Nevertheless, over a significant cooling trend were recorded
for both minimum and maximum temperatures over Gembu. Separate reports indicating decreasing
trend in temperature over the montane climate zones in Nigeria are substantially available in literature
(e.g. Akinsanola and Ogunjobi, 2014; Abatan et al., 2016; Yusuf et al., 2017). However, Dadin Kowa
and Yola stations show decreasing trends for minimum and maximum temperatures respectively. The
warming trend is well replicated over most stations by the datasets. Nevertheless, CRU failed to
capture the warming trend over Ibi, Maiduguri and Yola for minimum temperature; while, CPC lacks
skill in depicting the warming trend over majority of the stations for maximum temperature. To a
large extent, the degrees of warming and cooling trends are in some cases over- and under-predicted
by the datasets. The findings on warming trend of temperature data over the study domain are well
supported by earlier studies (e.g. Eludoyin et al., 2014; Abatan et al., 2016; Ilori and Ajayi, 2020)
who separately reported statistically significant increasing trend in both minimum and maximum
temperature over most part of Nigeria.

 Table 2: Mann-Kendall rank statistic, τ, coefficient of correlation, r, refined index of agreement, dref
 and, root mean square error, RMSE for minimum temperature (°C).
 OBS CRU CPC CRU CPC CRU CPC CRU CPC
 Station
 τ r dref RMSE
 Bauchi 0.220** 0.073** 0.233** 0.959 0.964 0.874 0.886 0.917 0.858
 Dadin Kowa -0.084** 0.007** 0.500 0.832 0.683 0.749 0.677 2.418 3.126
 Gembu -0.450** 0.387 0.433 0.721 0.774 0.517 0.621 2.213 2.450
 Ibi 0.220** -0.040** 0.367** 0.950 0.901 0.846 0.733 0.787 1.227
 Jos 0.067** 0.048** 0.113 0.912 0.843 0.644 0.533 1.080 1.447
 Maiduguri 0.007** -0.017** 0.064** 0.920 0.969 0.765 0.868 2.313 1.417
 Yola 0.070** -0.023** 0.121 0.746 0.719 0.458 0.374 3.506 3.991
 ** significant at 95 % confidence interval

186 Salaudeen et al., 2021
Nigerian Journal of Environmental Sciences and Technology (NIJEST) Vol 5, No. 1 March 2021, pp 173 - 190

 Table 3: Mann-Kendall rank statistic, τ, coefficient of correlation, r, refined index of agreement, dref
 and, root mean square error, RMSE for maximum temperature (°C).
 OBS CRU CPC CRU CPC CRU CPC CRU CPC
 Station τ r dref RMSE
 Bauchi 0.533 0.327 -0.253** 0.911 0.838 0.832 0.756 1.196 1.734
 Dadin Kowa 0.487 0.360 -0.507 0.809 0.710 0.703 0.544 1.976 2.810
 Gembu -0.494 0.280** -0.440 0.607 0.789 0.624 0.717 2.156 1.690
 Ibi 0.019** 0.004** -0.176 0.961 0.840 0.466 0.707 0.784 1.840
 Jos 0.019** 0.037** -0.107 0.919 0.804 0.777 0.665 1.052 1.603
 Maiduguri 0.005** 0.021** -0.039** 0.806 0.907 0.601 0.810 2.692 1.503
 Yola -0.043** 0.004** -0.128 0.757 0.763 0.693 0.669 2.283 2.441
 ** significant at 95 % confidence interval

4.0. Conclusions

Adequate meteorological variables such as; temperature datasets needed for impact models are
lacking over Upper Benue river basin due to inadequate spatiotemporal continuity and distributions of
gauging stations as well as limited and restricted accessibility. Accordingly, we present in this study
the inter-comparison of two global, gauge-based gridded temperature datasets (CRU, CPC) with
ground-based reference observations to assess their skills in representing the present-day observed
temperature climatology. Results from spatial distributions of both minimum and maximum
temperatures show the gridded datasets to represent reasonably well the observed patterns. There are
markedly low temperatures over the Jos plateau and the Cameroon highland in the western and
southern peripheries of the basin due to high altitudes. Temperature increases exponentially as one
move towards the northern fringes of the basin. However, an exceptionally low temperature around
the northern axis during the harmattan period is well documented owing to its proximity to Sahara
Desert. By the way, the CPC dataset showed improved skill in replicating these observed features.
The interannual variability in both minimum and maximum temperatures show positive anomalies,
which signify warming trends in almost all the stations; except over Gembu, where a cooling trend
was noticed. The gridded datasets measured closely these observed conditions. However, CRU
datasets are noted to outperform the CPC data in this regard. Also, the annual cycle of mean monthly
temperature exhibits a bimodal pattern, with primary and secondary peaks occurring in the months of
April and October everywhere in the basin except over Gembu. In any case, the nocturnal temperature
variations range from 13 to 25 °C, while the diurnal temperature varies between 23 and 42 °C.
Overall, temperatures are lower over the Jos plateau and Cameroon highland with Maiduguri
recording the highest maximum temperature. Interestingly, the gridded temperature products show
good skills in capturing the observed amplitudes and phases, though with varying margins.

Results from PDF analysis reveal the shapes of the PDFs for the spatial interpolated datasets to
capture remarkably well those of the observed PDFs everywhere in the basin, although, substantial
difference exists over Gembu and Yola in minimum temperature. In any case, the dispersity was noted
to be higher in CPC than in CRU dataset. These findings were further corroborated by Perkin’s skill
scores for the PDFs which indicate good performance of the gridded datasets in the range of 0.6 to 0.9
and 0.5 to 0.9 for minimum and maximum temperatures respectively.

Further assessments indicate CRU to be substantial in this study as compared to CPC owing to its
lowest error magnitudes and higher degrees of pattern correspondence using statistical indicators as
MAE, MBE, RMSE, r and dref. Also, results from Mann-Kendall statistics suggest significant
warming trend for both minimum and maximum temperatures, except over the Cameroon highland
where a significant cooling trend was obvious. The CRU datasets reproduced these observed trends
with some degrees of accuracies, whereas CPC was dubious in replicating the observed warming
trends for maximum temperature over the entire study domain. In spite of the improved performance
of CRU over CPC in most stations, CPC was as well noted to outperform CRU in some stations.
Based on improved performance of CRU datasets over the study site, it is therefore deemed suitable
for impact models.

Salaudeen et al., 2021 187
Nigerian Journal of Environmental Sciences and Technology (NIJEST) Vol 5, No. 1 March 2021, pp 173 - 190

Acknowledgements
The financial support to the first author by the Federal Government of Nigeria through Tertiary
Education Trust Fund for Academic Staff Training and Development is greatly acknowledged. The
authors are grateful to the services that have operated the CRU and CPC.

References
Abatan, A.A., Abiodun, B.J., Lawal, K.A. and Gutowski, W.J. (2016). Trends in Extreme
Temperature over Nigeria from Percentile-based Threshold Indices. Int. J. Climatol. 36(6), pp. 2527-
2540.

Adebayo, A.A. and Yahya, A.S. (2015). Assessment of Climate Change in the Savannah Sugar
Project Area, Adamawa State, Nigeria. 15th International Academic Conference. Rome, pp. 19-28.

Adeniyi, M.O. and Dilau, K.A. (2015). Seasonal Prediction of Precipitation over Nigeria. J. Sci. Tech
(Ghana). 35(1), pp. 103-113.

Agyekum, J., Annor, T., Lamptey, B., Quansah, E. and Agyeman, R.Y.K. (2018). Evaluation of
CMIP5 Global Climate Models over the Volta Basin: Precipitation. Adv Meteorol. 2018, pp. 1-24.

Akande, A., Costa, A.C., Mateu, J. and Henriques, R. (2017). Geospatial Analysis of Extreme
Weather Events in Nigeria (1985–2015) using Self-organizing Maps. Adv. Meteorol. 2017, pp. 1-11.

Akinsanola, A.A., Ajayi, V.O., Adejare, A.T., Adeyeri, O.E., Gbode, I.E., Ogunjobi, K.O., Nikulin,
G. and Abolude, A.T. (2017). Evaluation of Rainfall Simulations over West Africa in Dynamically
Downscaled CMIP5 Global Circulation Models. Theor Appl Climatol. 132(1-2), pp. 437-450.

Akinsanola, A.A. and Ogunjobi, K.O. (2014). Analysis of Rainfall and Temperature Variability Over
Nigeria. Global Journal of Human-Social Science: B Geography, Geo-Sciences, Environmental
Disaster Management, 13(3), pp. 1-19.

Akinsanola, A.A., Ogunjobi, K.O., Ajayi, V.O., Adefisan, E.A., Omotosho, J.A. and Sanogo, S.
(2016). Comparison of Five Gridded Precipitation Products at Climatological Scales over West
Africa. Meteorol Atmos Phys. 129(6), pp. 669-689.

Anandhi, A., Pierson, D.C. and Frei, A. (2019). Evaluation of Climate Model Performance for Water
Supply Studies: Case Study for New York City. J. Water Resour. Plann. Manage. 145(8), pp. 3302-
3311.

Burton, C., Rifai, S. and Malhi, Y. (2018). Inter-comparison and Assessment of Gridded Climate
Products over Tropical Forests during the 2015/2016 El Nino. Philos Trans R Soc Lond B Biol Sci.
373(1760), pp. 1-10.

Chen, U.K.O.W., Chineke, C. and Nwofor, O. (2014). Comparative Analysis of Gridded Datasets and
Gauge Measurements of Rainfall in the Niger Delta Region. Res. J. Environ. Sci. 88(7), pp. 373-390.

Collins, J.M. (2011). Temperature Variability over Africa. J. Clim. 24(14), pp. 3649-3666.

Daly, C. (2006). Guidelines for Assessing the Suitability of Spatial Climate Data sets. Int. J. Climatol.
26(6), pp. 707-721.

Eludoyin, O.M., Adelekan, I.O., Webster, R. and Eludoyin, A.O. (2014). Air Temperature, Relative
Humidity, Climate Regionalization and Thermal Comfort of Nigeria. Int. J. Climatol. 34(6), pp. 2000-
2018.

Federal Government of Nigeria (2012). Annual Abstract of Statistics. National Bureau of Statistics
Abuja: www.nigerianstat.gov.ng.

188 Salaudeen et al., 2021
Nigerian Journal of Environmental Sciences and Technology (NIJEST) Vol 5, No. 1 March 2021, pp 173 - 190

Fu, G., Liu, Z., Charles, S.P., Xu, Z. and Yao, Z. (2013). A Score-based Method for Assessing the
Performance of GCMs: A Case Study of Southeastern Australia. J. Geophys. Res. Atmos. 118(10), pp.
4154-4167.

Harris, I., Jones, P.D., Osborn, T.J. and Lister, D.H. (2014). Updated High-resolution Grids of
Monthly Climatic Observations - the CRU TS3.10 Dataset. Int. J. Climatol. 34(3), pp. 623-642.

Hassan, I., Kalin, R.M., White, C.J. and Aladejana, J.A. (2020). Evaluation of Daily Gridded
Meteorological Datasets over the Niger Delta Region of Nigeria and Implication to Water Resources
Management. Atmos Clim Sci. 10(01), pp. 21-39.

Hooker, J., Duveiller, G. and Cescatti, A. (2018). A Global Dataset of Air Temperature Derived from
Satellite Remote Sensing and Weather Stations. Sci Data. 5, pp. 1-11.

Ilori, O.W. and Ajayi, V.O. (2020). Change Detection and Trend Analysis of Future Temperature and
Rainfall over West Africa. Earth Syst. Environ. 4(3), pp. 493-512.

Japan International Cooperation Agency (JICA) (2014). National Water Rresources Master Plan
2013. Federal Ministry of Water Resources (ed.) Volume 4. Abuja: Federal Government of Nigeria.

Jia, K., Ruan, Y., Yang, Y. and Zhang, C. (2019). Assessing the Performance of CMIP5 Global
Climate Models for Simulating Future Precipitation Change in the Tibetan Plateau. Water. 11(9), pp.
1771.

Kabela, E.D. and Carbone, G.J. (2015). NARCCAP Model Skill and Bias for the Southeast United
States. Am. J. Clim. Change. 04(01), pp. 94-114.

Kanda, N., Negi, H.S., Rishi, M.S. and Kumar, A. (2020). Performance of Various Gridded
Temperature and Precipitation Datasets over Northwest Himalayan Region. Environ. Res. Commun.
2(8), pp. 1-20.

Maxino, C.C., Mcavaney, B.J., Pitman, A.J. and Perkins, S.E. (2008). Ranking the AR4 Climate
Models over the Murray-Darling Basin using Simulated Maximum Temperature, Minimum
Temperature and Precipitation. Int. J. Climatol. 28, pp. 1097–1112.

Mondal, A., Lakshmi, V. and Hashemi, H. (2018). Intercomparison of Trend Analysis of
Multisatellite Monthly Precipitation Products and Gauge Measurements for River Basins of India. J.
Hydrol. 565, pp. 779-790.

Nashwan, M.S., Shahid, S. and Chung, E.S. (2019). Development of High-resolution Daily Gridded
Temperature Datasets for the Central North Region of Egypt. Sci Data. 6(1), pp. 1-13.

New, M., Hulme, M. and Jones, P. (1999). Representing Twentieth-Century Space–Time Climate
Variability. Part I: Development of a 1961–90 Mean Monthly Terrestrial Climatology. J. Clim. . 12,
pp. 829–856.

New, M., Hulme, M. and Jones, P. (2000). Representing Twentieth-Century Space–Time Climate
Variability. Part II: Development of 1901–96 Monthly Grids of Terrestrial Surface Climate. J. Clim.
13, pp. 2217–2238.

NOAA/OAR/ESRL PSL CPC Global Unified Precipitation data. From their Website at
https://PSL.NOAA.Gov/. Boulder, Colorado, USA.

Pereira, H.R., Meschiatti, M.C., Pires, R.C.D.M. and Blain, G.C. (2018). On the Performance of
Three Indices of Agreement: An Easy-to-use R-code for Calculating the Willmott Indices. Bragantia.
77(2), pp. 394-403.

Salaudeen et al., 2021 189
Nigerian Journal of Environmental Sciences and Technology (NIJEST) Vol 5, No. 1 March 2021, pp 173 - 190

Perkins, S.E., Pitman, A.J., Holbrook, N.J. and Mcaneney, J. (2007). Evaluation of the AR4 Climate
Models’ Simulated Daily Maximum Temperature, Minimum Temperature, and Precipitation over
Australia Using Probability Density Functions. J. Clim. 20, pp. 4356-4376.

Piyoosh, A.K. and Ghosh, S.K. (2016). A Comparative Assessment of Temperature Data from
Different Sources for Dehradun, Uttarakhand, India. J. Meteor. Res. 30(6), pp. 1019–1032.

Shiru, M.S., Shahid, S., Alias, N. and Chung, E.-S. (2018). Trend Analysis of Droughts during Crop
Growing Seasons of Nigeria. Sustainability. 10(871), pp. 1-13.

Sun, Q., Miao, C., Duan, Q., Ashouri, H., Sorooshian, S. and Hsu, K.-L. (2018). A Review of Global
Precipitation Data Sets: Data Sources, Estimation, and Intercomparisons. Rev Geophys. 56, pp. 79-
107.

Tanarhte, M., Hadjinicolaou, P. and Lelieveld, J. (2012). Intercomparison of temperature and
precipitation data sets based on observations in the Mediterranean and the Middle East. J. Geophy
Res. Atmos. 117(D12), pp. 1-24.

Tang, G., Ding, Y., Wang, S., Ren, G., Liu, H. and Zhang, L. (2010). Comparative Analysis of China
Surface Air Temperature Series for the Past 100 Years. Adv. Clim. Chang. Res. 1(1), pp. 11-19.

Vaghefi, S.A., Abbaspour, N., Kamali, B. and Abbaspour, K.C. (2017). A Toolkit for Climate Change
Analysis and Pattern Recognition for Extreme Weather Conditions-Case Study: California-Baja
California Peninsula. Environ. Model. Softw. 96, pp. 181-198.

Wang, G., Zhang, X. and Zhang, S. (2019). Performance of Three Reanalysis Precipitation Datasets
over the Qinling-Daba Mountains, Eastern Fringe of Tibetan Plateau, China. Adv. Meteorol. 2019,
pp.1-16.

Weli, V.E., Nwagbara, M.O. and Ozabor, F. (2017). The Minimum and Maximum Temperature
Forecast Using Statistical Downscaling Techniques for Port-Harcourt Metropolis, Nigeria. Atmo.
Clim. Sci. 07(04), pp. 424-435.

Willmott, C.J., Robeson, S.M. and Matsuura, K. (2012). A Refined Index of Model Performance. Int.
J. Climatol. 32(13), pp. 2088-2094.

Yusuf, N., Okoh, D., Musa, I., Adedoja, S. and Said, R. (2017). A Study of the Surface Air
Temperature Variations in Nigeria. Open Atmospheric Sci. J. 11(1), pp. 54-70.

Cite this article as:
Salaudeen A., Ismail A., Adeogun B. K. and Ajibike M. A. 2021. Validating Gauge-based Spatial Surface
Atmospheric Temperature Datasets for Upper Benue River Basin, Nigeria. Nigerian Journal of Environmental
Sciences and Technology, 5(1), pp. 173-190. https://doi.org/10.36263/nijest.2021.01.0259

190 Salaudeen et al., 2021
You can also read