Comments on Smith, Zidar and Zwick (2020) - Gabriel Zucman
←
→
Page content transcription
If your browser does not render page correctly, please read the page content below
Comments on Smith, Zidar and Zwick (2020)
Emmanuel Saez and Gabriel Zucman — May 14th , 2020.

    Smith, Zidar and Zwick (2020),3 henceforth SZZ, present estimates of US wealth inequality
using the same data (income tax returns) and methodology (income capitalization) as in Saez
and Zucman (2016), modifying the benchmark Saez and Zucman (2016) capitalization tech-
nique. They write that the rise in the top 0.1% wealth share is “half as large” as in Saez and
Zucman (2016). We identify two main flaws in the SZZ methodology. First, SZZ under-estimate
the interest-bearing assets of the wealthy because they assume the interest rate earned by the
rich is much higher than in the existing evidence. Second, the SZZ methodology under-estimates
billionaire equity wealth, because SZZ infer equity wealth based on dividend income despite the
fact that the wealthiest Americans often own equities that do not pay dividends. Because of
these two biases, the SZZ estimates are inconsistent with the 2016 level and the 2001-2016 rise of
top-end US wealth seen in the official Federal Reserve estimates (Survey of Consumer Finances,
Distributional Financial Account) and Forbes. According to the SCF (which by construction
excludes the Forbes 400) appended to the Forbes 400 list, a wealth tax at a rate of 2% above $50
million and 3% above $1 billion would have generated $202 billion in revenue in 2016. According
to SZZ the same wealth tax would have raised only $117 billion. Once the conceptually correct
interest rate is used to capitalize interest and the SZZ estimates are fixed to match the estimates
of billionaire wealth from Forbes, the SZZ estimates are virtually identical to the benchmark
Saez and Zucman (2016) series, generate the same amount of wealth tax revenue (namely $190
billion in 2016), and are reconciled with the Federal Reserve data. In addition to these problems
of substance, SZZ do not properly discuss previous work that asked the same question, used the
same data, applied similar key assumptions, and obtained similar results.

       SZZ modify the benchmark Saez and Zucman (2016) methodology in 2 main ways:

   1. First, in contrast to the benchmark Saez and Zucman (2016) series that assume constant
      interest rates by wealth group, SZZ assume that the rich have a much higher interest rate
      than the rest of the population. A similar assumption was implemented and investigated
      in supplementary series constructed in Saez and Zucman (2016, Appendix Tables B40,
      B41, B41b, and B41c, discussed pp. 549–551) and in Bricker et al. (2018).4

   2. Second, instead of the equal weights used in the benchmark Saez and Zucman (2016) series,
      SZZ put a very low weight (10%) on capital gains (vs. 90% on dividends) to estimate equity
      wealth. A similar assumption was implemented and investigated in supplementary series
   3
      “Top Wealth in the United States: New Estimates and Implications for Taxing the Rich,” 24 April 2020. A
previous version of these comments, which referred to the first draft of Smith, Zidar and Zwick (dated July 19,
2019), was circulated in February 2020. Except for fixing a mistake in the computation of wealth tax revenues
and slightly amending the interest income capitalization, the responses provided by SZZ (in Appendix J of their
revised draft) do not address the core issues raised in our comments. This note has been expanded and updated to
reflect the current SZZ draft (April 24, 2020) and to explain why the SZZ responses do not address our concerns.
    4
      Saez and Zucman (2016, Appendix Tables B40, B41, and B41b) construct series where the top 1% by total
income earn the 10-year Treasury yield. Bricker et al. (2018, Figure 4) construct series where the top 1% by
interest income earn the 10-year Treasury yield. SZZ assume the top 1% by interest income earn the 10-year
Treasury yield, as in Bricker et al. (2018, Figure 4), and add the assumption that the top 0.1% earn the Moody’s
Aaa corporate bond yield.

                                                       1
constructed in Saez and Zucman (2016, Appendix Tables B36, B37 and B37b discussed
pp. 534–535) that put a 0% weight on capital gains (vs. 100% on dividends).
These two changes explain virtually all the di↵erence between the benchmark Saez and
Zucman (2016) estimates and the SZZ estimates. Under the benchmark Saez and Zucman
(2016) methodology, the share of wealth owned by the top 0.1% richest adults rose from 6.5%
in 1978 to 18.6% in 2016 (+12.1 points). Under the modified methodology used by SZZ, the
share of wealth owned by the top 0.1% richest adults rose from 6.6% in 1978 to 14.3% in 2016
(+7.7 points). The di↵erent capitalization of interest explains the vast majority of the gap.5
The alternative assumptions favored by SZZ raise two main problems which had been iden-
tified by Saez and Zucman (2016), explaining why these alternative assumptions had not been
retained for their benchmark estimates. SZZ do not provide new data or theory to support the
case for switching to these alternative assumptions; their implicit justification for applying very
high interest rates at the top is conceptually wrong; and their methodological changes lead to
large inconsistencies with the other sources about top-end US wealth.
1. First, the high interest rate for the wealthy that SZZ assume is inconsistent with the
existing evidence in the datasets where both income and wealth are visible—matched
estates-income tax data data and the Survey of Consumer Finances (SCF). These data
show that the top 0.1% wealthiest Americans have an average interest rate much lower
than implied by the SZZ methodology. For instance, in 2016, Americans who died with
more than $20 million in wealth had an interest rate of 1.4%: for any $1 in interest in their
income tax return, they had $70 in bonds and other interest-bearing assets in their estate.
By contrast, in the SZZ methodology Americans with more than $20 million in wealth
are assigned an interest rate of 3.3% in 2016: for any $1 in interest in their income tax
return, SZZ assign them $30 in interest-bearing assets. As a result, SZZ under-estimate
the interest-bearing assets owned by the wealthy.
SZZ respond to this objection by pointing out that although the interest rate they assume
is much higher than the interest rate r of people at the top of the wealth distribution, it
is similar to the interest rate r̄ of people at the top of the interest income distribution.
So, which interest rate should conceptually be used to capitalize income when rates of
returns are heterogeneous and correlated with wealth, r or r̄? We formally demonstrate
below that the answer is r, and that using r̄, as SZZ do, generates large biases. The SZZ
methodology under-estimates top wealth shares by construction.
2. Second, estimating equity wealth based on dividend income does not allow one to capture
top-end wealth accurately, because the wealthiest Americans often own equities that do
5
SZZ implement 3 other changes relative to the benchmark Saez and Zucman (2016) methodology: (i) housing
wealth is estimated using state-specific property tax rates (instead of a single property tax rate in Saez and
Zucman, 2016); (ii) pensions are estimated using an age-group specific formula combining wages and pension
(instead of a single formula irrespective of age in Saez and Zucman, 2016); (iii) pass-through businesses are valued
by using formulas by industry of the type: wealth = a⇥profits+b⇥sales+c⇥assets (instead of a formula using only
profits in Saez and Zucman, 2016). These changes, while useful to provide a more granular picture of wealth, do
not materially a↵ect the level of top wealth shares or their trend, since pensions and housing wealth are small at
the top, and business assets turn out to be similar in size and distribution in SZZ as in the benchmark Saez and
Zucman (2016) series (see point 5.8 below). SZZ also include an estimate of unfunded defined benefit pensions in
2not pay dividends. For instance, 5 of the top 10 richest Americans—Je↵ Bezos (Amazon),
Mark Zuckerberg (Facebook), Warren Bu↵ett (Berkshire Hathaway), Sergei Brin (Alpha-
bet), and Larry Page (Alphabet), collectively worth more than $250 billion in 2016—were
the main shareholders of corporations that did not pay dividends in 2016. The SZZ
methodology assigns them a negligible amount of wealth relative to their true wealth. As
a result, SZZ under-estimate billionaire wealth by about 40%. In 2016, US billionaires
owned 3.0 trillion in wealth according to Forbes, 3.1 trillion in the benchmark Saez and
Zucman (2016) series, and 1.7 trillion according to SZZ. The benchmark Saez and Zuc-
man (2016) methodology is consistent with the evidence on billionaire wealth; the SZZ
methodology is not.
Because of these two biases, the SZZ estimates are inconsistent with the dynamic of top-
end wealth observed since the turn of the 21st century in the official Federal Reserve data on
wealth inequality—the Survey of Consumer Finances and the Distributional Financial Accounts.
According to the official Survey of Consumer Finances data, the top 1% wealth share rose 6.2
points between 2001 and 2016.6 According to the official Distributional Financial Accounts, the
top 1% wealth share rose 5.2 points over the same period. According to the benchmark Saez and
Zucman (2016) estimates, the top 1% wealth share (for adult individuals) rose 5.4 points.7 By
contrast, according to SZZ the top 1% wealth share rose only 1.4 points over the same period.
SZZ provide no evidence that the Federal Reserve over-estimates the rise of wealth inequality
since 2001.
The SZZ estimates are also inconsistent with the level of top-end wealth observed in the SCF,
the only publicly available dataset with micro-data on top-end wealth. As a result SZZ predict
wealth tax revenues that are much below those found using the SCF. Anyone can download
the public-use 2016 SCF micro-file—which by construction excludes the Forbes 400—append
the 2016 Forbes 400 list, and simulate the mechanical revenue from a wealth tax at rate of
2% above 50 million and 3% above 1 billion in 2016, assuming no tax avoidance. The result
is $202 billion. Using the benchmark Saez and Zucman (2016) methodology, the same wealth
tax would have generated a similar amount, $190 billion. According to SZZ however, the same
wealth tax would have raised only 117 billion (SZZ, p. 32). SZZ do not provide a logically
consistent explanation for this gap.
To summarize, we identify three main issues with SZZ, which the rest of this note discusses
in turn:
1. SZZ under-estimate the interest-bearing assets of the wealthy because SZZ assign them
too high interest rates.
2. The SZZ methodology, which almost fully ignores capital gains, is not appropriate to
capture billionaire wealth and delivers estimates equal to only 57% of Forbes.
3. The SZZ methodology fails to capture the level of top-end wealth recorded in the official
Survey of Consumer Finances and its 2001–2016 rise. As a result SZZ under-estimate
wealth tax revenues by almost 50%.
their measure of wealth (in contrast to Saez and Zucman 2016 who only include funded pension), which reduces
wealth concentration but does not a↵ect the level of top-end wealth nor wealth tax revenue estimates.
6
https://www.federalreserve.gov/publications/files/scf17.pdf box 3 pp. 10-11, Figure B.
7
Series following the benchmark Saez and Zucman (2016) methodology updated to 2016 are published in
31. The SZZ methodology under-estimates the interest-bearing assets of the wealthy
by construction. The SZZ methodology assumes that the wealthy earn a much higher in-
terest rate than the rest of the population. This assumption is inconsistent with the evidence
where one can observe both income and wealth, which shows that the wealthy in recent years
have earned a slightly higher, but not much higher, interest rate than the rest of the population.
SZZ defend their methodology by pointing out that top interest-income earners have a much
higher interest rate than average, and thus that it is justified to estimate wealth by applying
a high interest rate to top-interest income earners. We formally demonstrate below that this
argument is incorrect. Capitalizing income using the interest rate of top interest-income earners
delivers downwards biased estimates of top wealth shares by construction.
1.1. Evidence on the interest rate of the wealthy. Previous research has investigated how the
interest rate on interest-bearing assets varies with wealth in the US, using data where both
income and wealth can be observed: matched estates-income tax data, and the SCF. In both
datasets, the assumption of constant interest rates by wealth group appears reasonable until
2008–2009 but problematic after.
• Saez and Zucman (2016) match estates tax returns filed over the period 1997–2012 with
income tax returns the year before death (see Saez and Zucman p. 547–551, in particular
Figure V.B). They find interest rates of 3.0% on average over 2001–2008 for estates above
$10 million (close to the aggregate rate of 2.7% on average), but higher-than-average
interest rates at the top over 2009–2011 (2.2% for estates above $20 million vs. 1.4% on
aggregate, a di↵erence of a factor of 1.6).
• Bricker, Henriques & Hansen (2018, Table 1, col. 2) find similar patterns in the SCF:
interest rates for the top one percent richest households of 3.0% on average for the 2001,
2004, and 2007 SCF (close to the average SCF interest rate of 2.8% over these 3 years),
but higher-than-average interest rates at the top in 2010, 2013 and 2016 SCF (2.0% for
the top one percent wealthiest households vs. 1.5% on average in the SCF, a di↵erence of
a factor of 1.3).
SZZ successfully replicate these findings, update the series to 2016, and do not analyze any
new data source on the interest rate of the wealthy in the US.
Noting that an interest rate premium had appeared at the top after the Great Recession,
Saez and Zucman (2016) constructed supplementary series showing how the level, trend, and
composition of top wealth shares is a↵ected when higher interest rates—the 10-year Treasury
yield or the rate seen in matched estates-income tax data—are assumed at the top.8 Relatedly,
Bricker et al. (2018) analyzed how the Saez and Zucman (2016) benchmark estimates are
a↵ected when assuming that the top 1% by wealth (or the top 1% by total income, or the top
1% by interest income) earn the 10-year Treasury yield.
Replicating Bricker et al. (2018, section 4.3.2), SZZ assume that the top 1% by interest
income earn the 10-year Treasury yield.9 In addition, departing from earlier work, SZZ capitalize
Piketty, Saez and Zucman (2018), Appendix Tables II (tables E), and on http://WID.world.
8
Appendix Tables B40, B41, B41b in Saez and Zucman (2016) assign the 10-year Treasury yield to the top
1% by income; Appendix Table B41c assigns the interest premium seen in matched estates-income tax data to
the top 0.1% by wealth; the results are discussed in Saez and Zucman (2016, pp. 549-551).
9
Saez and Zucman (2016, Appendix Tables B40, B41, and B41b) construct series where the top 1% by total
4the interest income of top 0.1% interest-income earners with an even higher rate, the Moody’s
Aaa yield, which averaged 6.0% over 2000–2009 and 4.2% over 2010–2016.
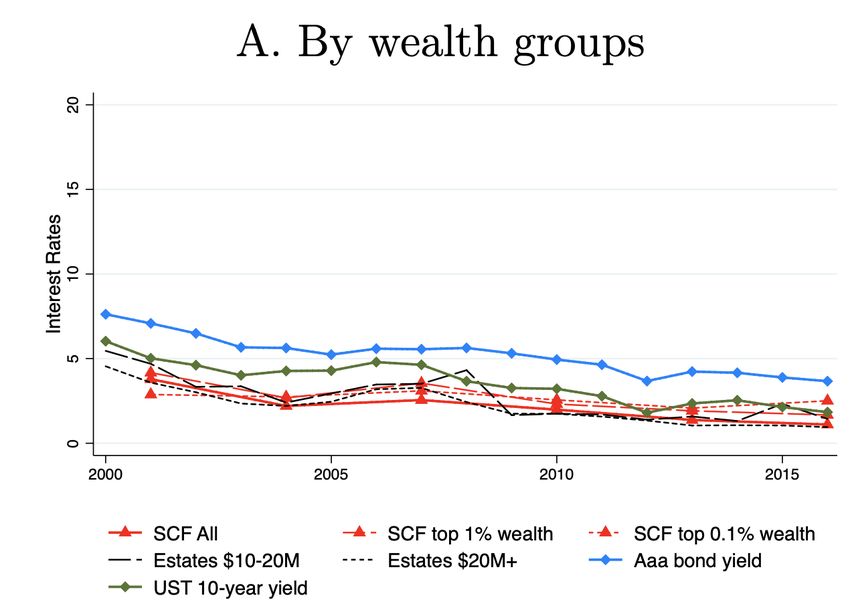
As shown by the figure below, over the 2001-2016 period, the Moody’s Aaa rate (plain red)
was always much higher than the interest rate for the top 0.1% richest people observed both in
matched estates-income tax data and in the SCF (dashed red), by a factor of 2.0 on average.
Similarly, the 10-year Treasury yield (plain blue) was always higher that the interest rate for
the next 0.9% richest people observed both in matched estates-income tax data and in the SCF
(dashed blue), by a factor of 1.5 on average. The top 0.1% wealthiest Americans in the SZZ
methodology (purple line) have an interest rate very close to the Moody’s rate, much higher
than the real-world top 0.1% wealthiest Americans.
Figure 6: Interest Rates Observed at the Top of the Wealth Distribution vs. Moody’s Aaa and
10-Year Treasury Yields
Moody's Aaa
8% SZZ top 0.1% by wealth
10-year Treasury
Estates $20m+
7% Estates $10m-20m
SCF top 0.1%
SCF next 0.9%
6%
Saez-Zucman aggregate
5%
4%
3%
2%
1%
0%
2000 2003 2006 2009 2012 2015
Source: Interest rates in matched estates-income tax returns taken from Saez and Zucman (2016, Appendix
Table C6b) for 2000–2011 and from SZZ Appendix Figure A.15 Panel A for 2012–2016. Interest rates in the
SCF are from Saez and Zucman (2019, Figure 3).
1.2. The SZZ methodology delivers biased top wealth shares by construction. SZZ justify the use
of a very high interest rate to capitalize interest income by noting that although the interest rate
income earn the 10-year Treasury yield, while SZZ rank by interest income. Bricker et al. (2018, Figure 4) rank
by interest income as SZZ.
10
SZZ also defend their approach in their appendix J by arguing that it is “more practically useful” to apply
heterogeneous returns to bins of interest income, since interest income is observable in the data and wealth is
not. But this argument conflates two issues—what is the conceptually correct r to apply, and how, practically,
to implement the capitalization method—and is also incorrect. Conceptually, as we show below, the interest rate
to apply is the interest rate of the wealthy. Practically, one can apply this rate to the wealthy by proceeding by
iteration. Using r̄ is neither correct conceptually, nor more practically useful than alternatives.
5they assume is much higher than the interest rate r of people at the top of the wealth distribution,
it is similar to the interest rate r̄ of people at the top of the interest income distribution. From
there, SZZ implicitly assume that using r̄ is the appropriate way to capitalize interest income
when returns are heterogeneous. They never formally demonstrate that capitalizing interest
using r̄ leads to unbiased estimates, or even informally discuss why this might be the case, or
what the biases with such a method might be.10
As we now demonstrate, using r̄ to capitalize interest income when interest rates are het-
erogeneous generates a first-order downward bias in top wealth shares.
To start with, note that the fact that top-interest income earners have a high interest rate
r̄ is unsurprising. It’s selection: people are in the top 0.1% of the interest income distribution
precisely because they have high interest rate. It’s also a consequence of measurement errors.
In the 2001 SCF, for example, the top 0.1% interest income earners have a 20% interest rate
(SZZ Figure A.15 Panel B)—an implausibly high rate due to data inconsistencies, such as mis-
classification of non-interest income as interest or under-reporting of interest-bearing assets.
The high interest rate observed at the top of the interest income distribution is a mechanical
consequence of idiosyncratic returns, whether these returns are real or reflect measurement
errors.
Let’s now prove that estimating the amount of interest-bearing assets by using r̄ generates a
large downwards bias in top wealth shares. Saez and Zucman (2016) formally discuss biases in
the capitalization method when returns are idiosyncratic (Section IV.A), biases when returns
are correlated with wealth (Section IV.B), and how theoretical biases change with multiple asset
classes. Building on this earlier work, we provide here a model that allows one to consider these
three issues simultaneously (details and proof are in the attached appendix A).
We assume that wealth is Pareto distributed at the top (above fractile p0 ) with Pareto
coefficient a. The goal is to estimate the share of wealth shp owned by those above fractile
p (where p > p0 , for example p =0.999). The true wealth of person i is Wi . It is split into
interest-bearing assets (share i of wealth) vs. other assets (share 1 i ). To focus on the issue
of interest capitalization, we assume that interest rates are heterogeneous while non-interest
bearing assets can be estimated perfectly. Let ri be the interest rate of person i. Interest
income of person i is ri i Wi . Let rc be the interest rate used to estimate wealth by capitalization.
Capitalized interest-bearing assets are i Wi ri /rc so that wealth estimated by capitalization is
Wic = (1 i + i ri /rc ) · Wi . Under regularity assumptions (namely, that the distributions of ri
and i conditional on wealth eventually converge at the top to uncorrelated distributions with
means r and ), the wealth share of those above fractile p estimated by capitalization, shcp , and
their true wealth share, shp , are related by the following formula:
1
shcp = shp · (E[(1 i + i ri /rc )
a
]) a (1)
To a first-order approximation, when the share of interest-bearing assets in wealth i is small
relative to 1, the ratio shcp /shp is equal to 1 (1 r/rc ) where r is the true average interest
rate of the wealthy and rc is the interest rate used for capitalization. To see this, note that
a a 1/a
for i small, (1 i + i ri /rc ) ' 1 + a i (ri /rc 1) and hence [E[(1 i + i ri /rc ) ]] '
1/a
[1 + a E(ri /rc 1)] ' 1 (1 r/rc ). When a is close to one (top heavy wealth), this is an
exact formula. Empirically, a ' 1.4 (wealth is highly concentrated) so that the approximation
is very accurate for in the empirical range of 0.2–0.4. Two conclusions follow:
1. Zero first-order bias requires using rc = r, i.e., requires using the average interest rate of
the wealthy, r, to capitalize interest.
62. If as done by SZZ, one capitalizes interest using the average interest rate of top p interest
earners, r̄, there will be a first order bias in the estimated top wealth shares. For example,
with = 0.25 and r/r̄ of 0.33, then shcp = 0.83 · shp .11 Instead of a true top 0.1%
wealth share of 18%, the SZZ methodology of capitalizing interest using r̄ delivers a biased
estimated top 0.1% wealth share of 15%. We provide more discussion and complete proofs
in Appendix A.
To illustrate the biases in the di↵erent methods used to capitalize interest, it is useful to plot
rc /rm , the interest rate used to capitalize interest at the top, divided by the macro interest rate
rm . The benchmark Saez and Zucman (2016) series use rc = rm . SZZ use rc = r̄ the Moody’s
Aaa rate, a rate which is 4.6 times larger than the average interest rate rm in 2016. In both
matched estates-income tax data and the SCF, the average interest rate of the wealthy, r, is
close to rm before the Great Recession, and averages around 1.4 times rm over 2008–2016.12
This calls for using rc = r = 1.4 ⇥ rm after the Great Recession, i.e., for increasing the interest
rate of the wealthy by a factor of around 1.4 compared to the benchmark Saez and Zucman
(2016) methodology.13 SZZ increase the interest rate of the wealthy by a factor of 4.6 in 2016.
Figure 7: Interest rate used for capitalization at the top divided by macro interest rate (rc /rm )
5
Smith, Zidar, Zwick (2020) (Moody's Aaa)
Estates >$10m
SCF top 1%
4 Saez and Zucman (2016), benchmark
Saez and Zucman (2016), June 2020 update
3
2
1
0
2000 2002 2004 2006 2008 2010 2012 2014 2016
Notes: Estates >$10m is the weighed average of the interest rate for estates above $20 million (with a weight
of 2) and estates between $10 million and $20 million (with a weight of 1) from Figure 1 above, divided by the
Saez-Zucman aggregate interest rate from Figure 1 above. SCF top 1% is the top 1% interest rate in the SCF
divided by the average interest rate in the SCF.
To sum up: When interest rates are heterogeneous and higher on average among the wealthy,
capitalizing interest income using the interest rate of top-interest income earners r̄, as SZZ do,
generates a large downward bias in estimated top wealth shares. Zero first-order bias requires
11
In 2016, r/r̄ = 0.3 in matched estates-income data and 0.5 in the SCF for the top 0.1% (SZZ Figure A.15).
12
For the top 0.1% in the SCF, r/rm is slightly higher (1.57). Top-end interest rates are noisy due to small
sample sizes, and interest rates in the SCF are upward biased, probably more so at the very top than on average
(biasing r/rm upwards), see point 5.5 below.
13
The June 2020 update of the Saez and Zucman (2016) will use rc = 1.4 ⇥ rm over 2008–2016.
7using r, the interest rate of the wealthy. Capitalizing interest using r instead of r̄ increases the
SZZ top 0.1% wealth share by 2.9 points in 2016, from 14.3% to 17.2%.14 This single adjustment
to the SZZ methodology closes 67% of the gap between SZZ and the benchmark estimates of
Saez and Zucman (2016) (top 0.1% wealth share of 18.6% in 2016), while being consistent with
the interest-rate di↵erential observed between the wealthy and less wealthy.
2. The SZZ methodology is not appropriate to capture top-end equity wealth and
delivers estimates of billionaire wealth much lower than Forbes. The SZZ method-
ology under-estimates top-end equity wealth, because SZZ infer equity wealth based primarily
on dividend income despite the fact that the wealthiest Americans often own equities that do
not pay dividends. As a result, the SZZ methodology generates only 57% of the wealth of
billionaires implied by Forbes.
2.1. The SZZ methodology fails to match the evidence on billionaire wealth. According to
SZZ (2020, p. 32) billionaires owned $1.7 trillion in wealth in 2016. According to Forbes, the
top 400 wealthiest Americans (who had wealth above $1.7 billion) owned $2.4 trillion in 2016.
Billionaires with more than 1 billion and less than $1.7 billion add close to an extra $600 billion,
for a total billionaire wealth of around $3 trillion.15 SZZ only capture 57% of that amount.
SZZ under-estimate billionaire wealth because their methodology is not appropriate to esti-
mate equity wealth (in non-pass through businesses), the key form of wealth at the top. SZZ
put a very low weight (10%) on capital gains (vs. 90% on dividends) to estimate equity wealth.
A similar assumption was implemented and investigated in supplementary series constructed in
Saez and Zucman (2016, Appendix Tables B36, B37 and B37b discussed pp. 534–535) that put
a 0% weight on capital gains (vs. 100% on dividends) and this assumption was found to under-
estimate top end wealth, because many of the wealthiest Americans are major shareholders of
companies that do not pay dividends (Amazon, Google, Facebook, Berkshire Hathaway, etc.).
Two examples illustrate the problem with the SZZ methodology. In 2016 the capitalization
factor for dividends plus capital gains is 40 in the SZZ methodology, which means that people
are assigned 36 times their dividends plus 4 times their capital gains in equity wealth. Someone
with 0 dividend gets 4 times his realized capital gains in equity wealth. According to SEC Form
4 public records, in 2016 Je↵ Bezos sold around 2 million Amazon stocks at a price of around
$700, resulting in up to 1.4 billion in capital gains. In the SZZ methodology, the implied equity
wealth is 4 ⇥ $1.4 billion = $5.6 billion. That same year, Bezos’s stake in Amazon was valued at
14
In 2016, the average interest rate of the wealthy in matched estates-income tax data r is 1.3%, the average
rate used by SZZ to capitalize the interest of the top 0.1% is the Moody’s rate rc = 3.7%, so that with = 0.25
there is a bias of 1 (1 r/rc ) = 0.83. Starting from the SZZ top 0.1% wealth share of 14.3%, getting rid of the
bias by setting rc = r increases the estimated top 0.1% wealth share to 14.3%/0.83 = 17.2%. Note that the bias
generated when using the interest rate of the top interest earners is larger than the bias of opposite sign generated
when using the homogeneous macro interest rate rm . Over 2008–2016, r/rm has averaged around 1.4, so that
with = 0.25, homogeneous capitalization leads to over-estimating top wealth shares by 1 (1 r/rm ) = 1.10.
15
There are two ways to arrive at the $600 billion number for non-Forbes 400 billionaire wealth. First, one
can make the classical assumption that the tail of the wealth distribution is Pareto distributed. As the average
wealth of the Forbes 400 in 2016 ($6.0b) was 3.5 times the threshold to belong to the Forbes 400 ($1.7b), the
corresponding Pareto parameter is a = 3.5/(3.5 1) = 1.4. Standard calculations imply that the wealth between
$1bn and $1.7bn is [(1.7/1)(a 1) 1] = 23.6% of the wealth above $1.7bn, i.e., $567 billion. Second, one can
look at SCF data: the public-use 2016 SCF file, which by construction excludes the Forbes 400, has $583 billion
in billionaire wealth (with by construction wealth below 1.7 billion).
8around $60 billion. To take another example, in 2016 Warren Bu↵ett disclosed he had adjusted
gross income of $11,563,931 in 2015. Assuming this all came from capital gains (as Berkshire
Hathaway does not pay dividends), the implied wealth in the SZZ model is $50 million. That
year, Bu↵ett’s stake in Berkshire Hathaway was worth about $60 billion.
Figure 8: Wealth of American billionaires in 2016 (Trillion of $)
3.5
3
2.5
2
1.5
1
0.5
0
Forbes + SCF Saez-Zucman (2016) Smith-Zidar-Zwick
Notes: Forbes + SCF is the estimate of billionaire wealth obtained by appending the Forbes 400 to the SCF,
which by construction excludes the Forbes 400. Saez-Zucman (2016) is the estimate from the Distributional
National Accounts microfiles of Piketty, Saez and Zucman (2018), which use the benchmark Saez and Zucman
(2016) method to estimate wealth. Both the SZZ and the Saez and Zucman (2016) estimates reported here are
at the tax unit level, conceptually comparable to the unit of observation for Forbes and SCF at the top.
As shown by the graph above, the benchmark Saez and Zucman (2016) capitalization method
captures close to 100% of the amount of billionaire wealth implied by Forbes. By contrast, the
SZZ methodology, which under-estimates top-end equity wealth, under-estimates billionaire
wealth by almost 2.
2.2. SZZ do not provide evidence that the Forbes 400 aggregate is wrong. In their Section 10.3.2
and appendix J, SZZ instead provide a biased overview of the literature on the reliability of
the Forbes ranking. They note that some billionaires have over-stated their wealth to Forbes—
but do not mention that Forbes misses some billionaires, since people above the Forbes 400
threshold but who do not appear in Forbes have been sampled by the SCF (Batty et al., 2019,
Appendix F). They note that private businesses are hard to value—but diversified portfolios
of stocks and bonds, for which there is no public information, are even harder to capture and
likely to be missed by Forbes. They refer to the Bloomberg billionaire index in their footnote
60—but do not mention that the Bloomberg index finds as much and sometimes even more
wealth at the top than Forbes. Even the small point on Pareto coefficients does not reflect the
9current state of knowledge. SZZ claim that the Forbes-400-based Pareto parameter of 1.4 in
2016 implies top 0.1%, top 1%, and top 10% wealth shares that line up more closely with their
preferred estimates of top shares than with the Saez and Zucman (2016) benchmark estimates.
However, the literature emphasizes that the Pareto approximation is only valid locally and that
the Pareto coefficient is not constant from billionaires down to the top 10% threshold; see, e.g.,
Blanchet, Fournier, Piketty (2017) and references therein.16
Forbes is certainly not perfect. However, to learn about the wealth of the richest American,
the Forbes approach of looking at ownership in large businesses to figure out the true wealth of
Je↵ Bezos, Mark Zuckerberg, Warren Bu↵ett, Sergei Brin, Larry Page, Elon Musk, Michael Dell,
etc., is obviously superior to trying to infer wealth from dividends that haven’t yet materialized.
Saez and Zucman (2016) opted for a method with a higher weight on capital gains precisely
because it did a better job at matching Forbes. The gap between SZZ and Forbes is the sign of
an issue in the SZZ methodology.
Correcting the SZZ estimates so that they match the aggregate billionaire wealth implied
by Forbes, without making any other correction, increases the SZZ top 0.1% wealth share by
1.7 points in 2016, closing 40% of the gap with the benchmark Saez and Zucman (2016) series.
To sum up, fixing two issues in the SZZ series closes 90% of the gap between the SZZ top
0.1% wealth share and the benchmark Saez and Zucman (2016) estimate:
• Using the conceptually correct interest rate to capitalize interest income increases the SZZ
top 0.1% wealth share from 14.3% to 17.2% in 2016.
• Matching the amount of billionaire wealth implied by Forbes further increases the SZZ
top 0.1% wealth share to 18.1%.17
These two adjustments close almost 90% of the initial 4.3 points gap with the benchmark
Saez and Zucman (2016) estimate of 18.6%. They also bring the SZZ top 0.1% wealth share
within less than 5% of the Saez and Zucman (2016) benchmark estimate (18.1 / 18.6 = 97%).
In both level and trend, the SZZ top 0.1% wealth share becomes almost identical to the Saez
and Zucman (2016) series.
3. The SZZ estimates are inconsistent with the level of top-end wealth observed in
the Survey of Consumer Finances, the only publicly available dataset with micro-data on
top-end wealth. As a result, SZZ predict wealth tax revenues that are much below those found
using the SCF. SZZ do not provide a logically consistent explanation for this gap.
3.1 SZZ find much less wealth in the top 0.1% (and hence potential wealth tax revenue) than ex-
isting sources. Anyone can download the public-use 2016 SCF micro-file—which by construction
excludes the Forbes 400—append the 2016 Forbes 400 list, and simulate the mechanical revenue
16
SZZ also claim that “in terms of the number of billionaires and their collective wealth, statistics from the
Forbes 400 fall in between our estimates and those from the equal-return approach of Saez and Zucman (2016),”
suggesting that the benchmark Saez and Zucman (2016) methodology delivers too high results for billionaire
wealth. However, as Figure 3 above shows, the benchmark Saez and Zucman (2016) methodology delivers an
estimate of billionaire wealth very similar to the one implied by Forbes, $3.14T in 2016. A close estimate ($3.27
trillion) can be obtained in the publicly available Distributional National Accounts micro-files of Piketty, Saez
and Zucman (2018), which are blurred at the top for confidentiality reasons.
17
Coming after the interest rate correction, the billionaire correction adds less than 1.7 points (namely, about
1 point), because the interest rate correction already increases billionaire wealth.
10from a wealth tax at rate of 2% above 50 million and 3% above 1 billion in 2016, assuming no
tax avoidance. The result is $202 billion. The code is below:
* Define path
global root "..."
cd "$root"
* Download and save SCF
copy "https://www.federalreserve.gov/econres/files/scfp2016s.zip" "scf.zip"
unzipfile "scf.zip"
use rscfp2016.dta, clear
keep networth wgt
save "scf"
* Append Forbes 400
copy "http://gabriel-zucman.eu/files/misc/forbes2016.csv" "forbes2016.csv"
import delimited "forbes2016.csv", delimiter(";") clear
keep networth
gen wgt = 1
append using "scf"
* Compute revenue of a wealth tax at 2% above 50 million and 3% above 1 billion
gen tax = 0.02 * max(0, networth - 5e7) + 0.01 * max(0, networth - 1e9)
sum tax [w = wgt]
local total = round(‘r(sum)’ / 1e9)
di "WEALTH TAX REVENUE IN 2016: ‘total’ BILLION"
WEALTH TAX REVENUE IN 2016: 202 BILLION
The same result can be obtained without running any code using the wealth tax calculator
published by Vox, which also uses the SCF appended to the Forbes 400.18
According to the SZZ methodology (SZZ, p.32), the same wealth tax, with the same as-
sumption about avoidance, would have raised only 117 billion in 2016. This is only 58% of the
SCF + Forbes estimate for the same year. As the figure below shows, this discrepancy is due to
the fact that SZZ have both less billionaire wealth than in Forbes + SCF (see point 2 above),
and less wealth for tax units with wealth between $50 million and $1 billion than in the SCF,
in both cases by a factor of 1.7. SZZ under-estimate the wealth of tax units with more than
$50 million by a factor of 1.7 compared to existing sources. By contrast, the benchmark Saez
and Zucman (2016) methodology is consistent with both the level of billionaire wealth found in
Forbes + SCF, and the level of wealth for tax units with net wealth between $50 million and
$1 billion seen in the SCF.
3.2. SZZ do not provide a logically consistent explanation for the di↵erence in top-end wealth
between their estimates and the SCF. SZZ (p. 42) suggest that the Survey of Consumer Finances
18
The Vox calculator rounds results to the nearest 10 billion, and so in 2016 it reports that a tax of 2% above
$50 million and 3% above $1 billion (with no avoidance) would have generated $200 billion.
11Figure 9: Wealth of tax units with net wealth above $50 million in 2016 ($ Trillion)
14
Wealth of tax units with more than
$1 billion
12
Wealth of tax units with more than
$50 million and less than $1 billion
10
8
6
4
2
0
Forbes + SCF Saez-Zucman (2016) Smith-Zidar-Zwick
Notes: This figure compares the amount of wealth owned by tax units with more than $50 million in net wealth
in 2016 according to three sources: the Survey of Consumer Finances supplemented by the Forbes 400, the
benchmark Saez and Zucman (2016) estimates, and SZZ. Saez and Zucman (2016) capture 90% of the wealth
of tax units with net wealth between $50 million and $1 billion recorded in the SCF, and 105% of the SCF
+ Forbes billionaire wealth. SZZ (2016) capture 61% of the wealth of tax units with net wealth between $50
million and $1 billion recorded in the SCF, and 57% of the SCF + Forbes billionaire wealth.
over-estimates top-end business wealth.19 Business assets would have to be over-estimated by
a factor of 3 to reconcile the SCF and SZZ estimates of top-end wealth. Instead of owning
business assets worth $6 trillion, families with net wealth above $50 million (slightly above the
top 0.1% threshold, $43.2 million in 2016) would have to own business assets worth only $2
trillion in 2016. SZZ do not provide evidence to support the notion that the business assets of
top 0.1% families are over-estimated by a factor of 3 in the SCF.
Moreover, this potential reconciliation is logically inconsistent. If the SCF over-estimates
the wealth of the top 0.1% by a factor of 1.7 because it over-estimates the business assets of
top-end families by a factor of 3, then the portfolio shares observed in the SCF are biased. The
shares of all-non-business assets in the portfolios of top 0.1% families must be multiplied by
1.7, while the share of business assets must be divided by 3 / 1.7 = 1.7. The SZZ methodology,
19
SZZ seem to hesitate between claiming that the SCF over-estimates top-end wealth, and claiming that their
results are consistent with the SCF. For instance on p. 42 SZZ write that “Our preferred series closely fits
the most comparable equal-split SCF series that makes all adjustments, trending similarly and matching the
levels of the top 1% and rising somewhat above the top 0.1% in the 2000s.” This assertion is impossible to
understand, given that the top 1% and top 0.1% “most comparable equal-split SCF wealth series” rise as much
as the benchmark Saez and Zucman (2016) equal-split series from 2001 to 2016, while the top 1% and top 0.1%
SZZ “preferred series” barely increase from 2001 to 2016. See point 5.2 below.
12however, is based on fitting the observed portfolio shares at the top-end in the SCF (and other
auxiliary moments in the SCF, such as 2001–2016 changes in portfolio shares, the interest rate
of the rich, etc.); see, e.g., SZZ Table 3. The argument that business assets are too high in the
SCF results in a logical contradiction: if the SCF over-estimates business assets, it does not
make sense to fit the portfolio shares observed at the top-end of the SCF.20
In brief, SZZ attempt to estimate the wealth of the top 0.1%, using the SCF and a method-
ology whose results imply that the SCF is fundamentally flawed when it comes to estimating the
wealth of the top 0.1%. More broadly, SZZ take as gospel auxiliary moments in the SCF that
are either mis-measured (such as top-end interest rates, see point 5.5 below) or not comparable
across sources (such as portfolio compositions, see point 5.9 below) while discarding the level of
wealth found in the SCF—which is what the SCF aims at capturing accurately.
To be sure, the SCF may over-estimate top-end wealth. Using the benchmark Saez and
Zucman (2016) methodology, a 2% wealth tax above $50 million and 3% above $1 billion would
have generated slightly less revenue than implied by the SCF + Forbes, 190 billion vs. 202
billion in 2016. The reason is that total net wealth in the SCF exceeds total net wealth in the
Financial Accounts, by about 10% (see Batty et al., 2019, Table 1). Saez and Zucman (2019)
take a conservative approach to estimate wealth tax revenues and re-scale the SCF so that the
SCF + Forbes aggregate matches the Financial Accounts total. This reduces the tax base by
10%–15% compared to the raw SCF + Forbes tax base. The notion that the SCF over-estimates
top-end wealth by a factor of close to 2, however, has no empirical basis.
4. Improper discussion of previous literature. SZZ do not adequately discuss the pre-
vious literature that asked the same question (how are the benchmark Saez and Zucman, 2016,
estimates of US wealth inequality a↵ected by returns heterogeneity?), used the same data, made
similar key assumptions, and obtained similar results. SZZ are not the first to investigate the
consequences of return heterogeneity for estimates of US wealth inequality based on income tax
data—a fact that their current draft fails to make clear.
4.1. Bricker et al. (2018). SZZ do not appropriately discuss the closely related work by Bricker
et al. (2018). Bricker et al. (2018) use income tax data, the income capitalization method, and
capitalize the interest income of the top 1% interest-earners using the 10-year Treasury yield.
Like Bricker et al. (2018), SZZ use income tax data, the income capitalization method, and
capitalize the interest income of the top 1% interest-earners using the 10-year Treasury yield.
Compared to Bricker et al. (2018), SZZ add the assumption that the top 0.1% by interest
earn an even higher interest rate, the Moody’s Aaa corporate bond yield. As shown by the
Figure below, the SZZ top 0.1% wealth share is close to the Bricker et al. (2018) estimate. The
reader of SZZ cannot know this, since although Bricker et al. (2018) are cited by SZZ, their
20
Even if the SCF over-estimates business assets and hence has biased portfolio shares, part of the SZZ Table
3 validation exercise could still have merit if the SCF has the correct level of interest-bearing assets at the top.
However, what is counted as interest-bearing assets in the SCF vs. in the Financial Accounts is di↵erent, so that
one should not aim at matching the SCF level of interest-bearing assets as SZZ do. In the Financial Accounts,
the interest-bearing assets owned through domestic hedge funds and private equity funds are recorded as interest-
bearing assets, whereas they are typically business assets in the SCF (e.g., for the funds’ general partners). This
turns out to matter quantitatively, because hedge fund and private equity fund managers play a prominent role
at the top of the wealth distribution, and these funds hold large amounts of interest-bearing assets. See point
5.8 below.
13methodology and quantitative results are never discussed.21
Figure 10: Top 0.1% wealth share: Bricker et al. (2018) vs. SZZ (2020).
20%
Bricker et al. 2018, Figure 14
18% (tax units)
16%
14% Smith-Zidar-Zwick (2020)
(tax units)
12%
10%
8%
6%
4%
2%
0%
2000
2001
2002
2003
2004
2005
2006
2007
2008
2009
2010
2011
2012
Notes: This figure compares the wealth owned by the top 0.1% richest tax units reported in Bricker et al. (2018),
Figure 14, obtained by applying the 10-year Treasury yield to interest income for tax units in the top 1% of the
wealth distribution, and the top 0.1% wealth share of SZZ among tax units. Both papers use the same data,
make similar assumptions and end up with similar results, with the lower level of the top 0.1% wealth share in
recent years due to the fact that SZZ apply an even higher interest rate than Bricker et al. (2018) for the top
0.1%.
After quoting Bricker et al. (2018) together with a paper about Norway, SZZ (p. 6) write that
“Our contribution is to build on these insights by implementing proposed adjustments in the tax
data and combining them with other first-order refinements to all other major asset categories.”
However, (i) Bricker et al. (2018) also implemented their insights in the US tax data, and
(ii) the “other first-order refinements” of SZZ, whether individually or taken altogether, have
a second-order e↵ect on the level, trend, and composition of top wealth shares.22 80% of the
di↵erence between the SZZ top 0.1% wealth share and the benchmark Saez and Zucman (2016)
estimate is due to the di↵erent capitalization of interest income, an issue thoroughly investigated
in previous work.
21
SZZ briefly allude to aspects of Bricker et al. (2018) in their footnote 40, failing to note that Bricker et al.
(2018) do not only focus on the top 1% but also investigate the implication of heterogeneous returns for the top
0.1% wealth share (see Bricker et al., 2018, figure 14), the main focus of SZZ.
22
As shown by SZZ Figure 14.B, the SZZ refinements of housing wealth increases top 0.1% wealth by 0.1
trillion in 2016 (0.15% of total wealth), reduces pension wealth by 0.2 trillion (0.3% of total wealth), increases
business wealth by 0.4 trillion (0.6% of total wealth, see point 5.8 below), and reduces public equity wealth by 1.0
trillion (1.4% of total wealth), for a total net e↵ect of -0.9% of total wealth. These adjustments are individually
and collectively second-order compared to the benchmark Saez and Zucman (2016) top 0.1% wealth share of
18.6% in 2016.
14As shown in point 1 above, using the Moody’s Aaa rate to capitalize top 0.1% interest in-
come is conceptually incorrect and generates large biases after the Great Recession. Using the
10-year Treasury yield to capitalize interest for the entire top 1%, as in Bricker et al. (2018),
makes the SZZ series virtually identical to Bricker et al.’s (2018, Figure 14) top 0.1% wealth
share.23
4.2. Heterogeneous returns series in Saez and Zucman (2016). SZZ do note mention that Saez
and Zucman (2016) constructed and discussed detailed appendix series showing how the level,
trend, and composition of top wealth shares are a↵ected when higher interest rates at the top
are assumed. Appendix Tables B40, B41, B41b in Saez and Zucman (2016) assign the 10-year
Treasury yield to the top 1% by income. Appendix Table B41c assigns the interest premium
seen in matched estates-income tax data to the top 0.1% by wealth. These series are discussed
pp. 549-551 of the published Saez and Zucman (2016) paper. The SZZ top 0.1% wealth share
tracks the top 0.1% wealth share in Saez and Zucman’s (2016) Appendix Table B41c, see Figure
below. SZZ misrepresent our work in their Section 10.1.1 (p. 35) by claiming these series were
constructed in subsequent work of ours—they were in fact constructed and discussed in our
original paper.24
SZZ also claim they “make a methodological contribution by clarifying how capitalization
works in practice and by emphasizing both heterogeneity and the concomitant uncertainty that
arises.” These issues were discussed in Saez and Zucman (2016), both conceptually and em-
pirically, e.g., in Section III.B.1 titled “How the Capitalization Technique Works,” Section IV
titled “Pros and Cons of the Capitalization Method”—including Section IV.A titled “Idiosyn-
cratic Returns,” Section IV.B titled “Returns Correlated with Wealth,” and Section IV.F, e.g.,
discussion starting with “to assess the quantitative implication of the interest rate di↵erential
seen in matched estates-income tax data...” SZZ contribute no new data source or theory to
these questions.
We shared all our programs and data infrastructure with SZZ. We welcome replications and
extensions of our work and put all our code online for that purpose. It is essential for scientific
progress, however, to clearly acknowledge prior work.
Saez and Zucman (2016, p. 550) called for monitoring the evolution of the interest rate
di↵erential observed in the post-Great Recession years (as few post-Great Recession years were
still available at the time of their study, which ended in 2012, making it hard to assess whether
the di↵erential observed in matched estates-income tax data post-2008 reflected statistical noise
or a real phenomenon) and to adjust the capitalization method accordingly if need be.25 The
matched estates-income data covering the years 2012–2016 have generally confirmed the presence
23
One small methodological di↵erence between SZZ and Bricker et al. (2018, Figure 14) is that for the purpose
of estimating the top 0.1% wealth share, Bricker et al. (2018) capitalize interest income ranking people by
wealth, while SZZ capitalize interest income ranking people by interest income. However, Bricker et al. (2018,
Figure 4) show that for a given assumption about the interest rate, ranking by interest income vs. ranking by
wealth makes virtually no di↵erence.
24
SZZ (p. 35) write: “Saez and Zucman (2019a) have subsequently acknowledged this approach introduces
bias and make an adjustment to the equal-returns specification by adopting a higher interest rate for their
top wealth group. Specifically, they scale down their top fixed income wealth estimate using the interest rate
di↵erential from estate taxes matched to income tax returns for estates above $20 million, which is closer to
the 10-year US Treasury rate (UST10) than to the Aaa rate we use,” failing to note that this adjustment was
implemented and discussed in our original paper published in 2016 (Appendix B41c series, discussed p. 550).
25
See Saez and Zucman (2016, p. 550): “We retain our baseline top 0.1% wealth share estimate because only
a few hundred non-married individuals die with estates above $20 million each year. As a result, there is likely
15Figure 11: Top 0.1% wealth share: series constructed in Saez and Zucman (2016) by assuming
interest rate heterogeneity vs. SZZ (2020) main series
20%
18%
16%
Saez-Zucman (2016)
14% Apendix Table B41c
(tax units)
12%
10%
8%
6% Smith-Zidar-Zwick (2020)
(tax units)
4%
2%
0%
1966
1968
1970
1972
1974
1976
1978
1980
1982
1984
1986
1988
1990
1992
1994
1996
1998
2000
2002
2004
2006
2008
2010
2012
Notes: This figure compares the share of wealth owned by the top 0.1% richest tax units reported in Saez and
Zucman (2016), Appendix Table B41c (series discussed in Saez and Zucman, 2016, p. 550) and the top 0.1%
wealth share of SZZ among tax units.
of an interest rate premium at the top. Over 2008–2016, the interest rate of estates above $10
million has been equal to around 1.4–1.5 times the macro interest rate on average, see Figure
2 above26 . SCF data show similar patterns, with r/rm of 1.36 on average for the top 1% over
2007–2016.27 These new data points call for a more moderate adjustment than the one proposed
in the Saez and Zucman (2016) Appendix Table B41c series that used r/rm = 1.6.
5. Other issues.
• 5.1. SZZ misrepresent their key finding in their abstract. They write: “We find that the
top 0.1% share of wealth increased from 7% to 14% from 1978 to 2016. While this rise is
significant noise in the annual series, making it difficult to make a precise and systematic inference of the true
interest premium at the top. Looking forward, should new evidence show that taxable returns rise or fall with
wealth, then it would become necessary to specifically account for this fact—and similarly when applying the
capitalization technique to other countries.”
26
For the 2012–2016 period, we use the interest rates reported by SZZ In their Figure A.15 Panel A. Young
wealthy decedents contribute to these estimates with a high weight, since estate data are weighted by the inverse
mortality rate by age and gender to be representative of the entire population—a valuable addition in SZZ
compared to Saez and Zucman (2016) who did not weight by the inverse mortality rate; see Saez and Zucman
(2016, pp. 549) and SZZ footnote 43. The weighted results happen to be similar to the unweighted results,
showing that young wealthy decedents have low returns like elderly decedents.
27
The interest rates in the top 0.1% in the SCF are slightly higher (r/rm = 1.57), but noisy due to small
sample sizes. Moreover, interest rates in the SCF are upward biased and probably more so at the very top than
on average (slightly biasing r/rm upwards), see point 5.5 below.
16half as large as prior estimates...” In fact, the true ratio is not half but 64%. From 1978
to 2016, the benchmark Saez and Zucman (2016) top 0.1% wealth share (for equal-split
adults) increases 12.1 points.28 From 1978 to 2016, the SZZ top 0.1% wealth share (for
equal-split adults) increases 7.7 points (= 64% of 12.1).29
• 5.2 The SZZ methodology does not capture the rise in top wealth shares recorded in both
the SCF and the Distributional Financial Accounts since 2001. Since the SZZ top 0.1%
wealth share is close to the benchmark Saez and Zucman (2016) series before 2001 and
only diverges from the early 2000s on,30 the inconsistency of SZZ with the available ev-
idence for the 2001–2016 period is problematic. According to the official SCF results,31
the top 1% wealth share has increased 6.2 points between 2001 and 2016 (6.7 points when
adding the Forbes 400 to the public-use SCF files). According to the official Federal Re-
serve Distributional Financial Accounts (based on the SCF, but anchored to the Financial
Accounts totals and available at the quarterly frequency instead of every 3 years), the top
1% wealth share has increased 5.2 points from mid-2001 to mid-2016. By contrast, the
SZZ top 1% wealth share has increased by 1.4 point only.32 SZZ do not discuss or provide
evidence that the Federal Reserve over-estimates the rise of inequality since 2001. In their
Sections (10.3.1 and 10.3.3) comparing their results to the Federal Reserve data, and in
their Appendix J, SZZ note that there are a number of conceptual di↵erences between
the Federal Reserve series and theirs (e.g., the unit of observation and the treatment of
defined benefit pensions). These conceptual di↵erences explain some of the SZZ vs. SCF
di↵erence in the level of the top 1% and top 0.1% wealth shares, but they do not explain
the large di↵erences in the 2001–2016 rise of these top shares.
• 5.3. SZZ provide an inconsistent treatment of unfunded defined benefit pensions. SZZ
include $1.9 trillion in unfunded defined benefit pension wealth in their series (SZZ, foot-
note 6 p. 8), 30% of the total amount of unfunded defined benefit pensions recorded in
the Financial Accounts ($6.5 trillion in 2016). However, when they compare their series
to the SCF, SZZ add all unfunded defined benefit pensions to the SCF ($6.5 trillion in
2016). Unfunded pensions have increased since 2001 (from $2.1 trillion in 2001, 22% of
national income, to 6.5 trillion in 2016, 40% of national income), and almost none of this
wealth goes the top. As a result, the comparison between the SZZ top wealth shares and
the SCF top wealth shares (adjusted to incorporate unfunded pensions) reported in Figure
A.16 are biased. The divergence between the SCF and SZZ (SCF top shares rise sharply
28
Series following the benchmark Saez and Zucman (2016) methodology updated to 2016 are published in
Piketty, Saez and Zucman (2018), Appendix Tables II (tables E), and on http://WID.world.
29
If one considers the period from 1978 to 2012 (the last year printed in Saez and Zucman, 2016), the ratio is
68%. If one considers the period from 1978 to 2014 (the last year printed in Piketty, Saez and Zucman, 2018),
the ratio is 65%. The ratio is never close to 50%.
30
Between 1978 and 2001, the SZZ top 0.1% wealth share rises 6.9 points vs. 8.0 points in the benchmark
Saez and Zucman (2018) series, starting from the same level in 1978.
31
By official SCF results, we mean the results as published in the Federal Reserve Bulletin, e.g., here box 3
pp. 10-11, Figure B. These official results are based on the internal-use SCF files, which slightly di↵er form the
public-use files.
32
Most of the di↵erence between the rise of inequality according to SZZ vs. the Federal Reserve comes from
the trend for the top 0.1%, not the next 0.9%. According to the official SCF results, the top 0.1% wealth share
has increased 4.0 points between 2001 and 2016 (5.0 points when adding the Forbes 400), vs. 0.9 point in SZZ.
The Distributional Financial Accounts do not report statistics for the top 0.1%.
17between 2001 and 2016 while the SZZ top shares barely rise) is even more pronounced
in actual facts than reported in Figure A.16. SZZ do not provide any justification for
including 1.9 trillion in unfunded defined benefit pensions (30% of the Financial Accounts
aggregate) in their series while including 100% of the Financial Accounts aggregate in
the SCF. In both cases the same source, Sabelhaus and Henriques Volz (2019), is cited.
Sabelhaus and Henriques Volz (2019) do not provide estimates for unfunded DB pensions
separately from funded DB pensions. The Saez and Zucman (2016) series do not include
unfunded defined benefit pensions (for the reasons discussed in Saez and Zucman 2016, p.
525–526).
• 5.4. After fixing the identified biases in the SZZ methodology and adopting a consistent
treatment of unfunded defined benefit pensions, the SZZ top 0.1% wealth share series
is identical to the benchmark Saez and Zucman (2016) estimate. For instance, starting
from the SZZ top 0.1% wealth share of 14.3% in 2016, removing the bias in the interest
capitalization adds 2.9 points and matching the evidence on billionaire wealth adds close
to an extra point, bringing the SZZ top 0.1% wealth share to 18.1% (see point 2 above).
Removing unfunded defined benefit pensions increases the top 0.1% wealth share to 18.6%,
identical to the Saez and Zucman (2016) estimate. Alternatively, starting from the Saez
and Zuman (2016) level of 18.6% and incorporating 1.9 trillion in unfunded defined benefit
pensions as in SZZ, the top 0.1% wealth share falls to 18.1%, identical to the SZZ estimate
corrected for interest and billionaires. Whether unfunded pensions are included in wealth
is immaterial for the level of top-end wealth and wealth tax revenues. Therefore, after
fixing the identified biases in the SZZ methodology, the SZZ series generate the same
amount of wealth tax revenue as the benchmark Saez and Zucman (2016) series, and are
reconciled with the Federal Reserve data on the level of top-end wealth.
• 5.5. SZZ put too much faith in the top-end interest rates seen in the SCF, which are
over-estimated by construction. Interest rates in the SCF are upward biased because
what is recorded as interest-bearing assets in the SCF only includes a fraction of interest-
generating assets. All the interest-generating assets of pass-through businesses (the bank
deposits, notes receivable, bonds, etc., owned by S-corporations and partnerships) generate
interest for their individual owners, because interest flows to their 1040, and respondents
are asked about interest as reported in their 1040. But these assets are typically counted
as business assets in the SCF—not as bank accounts, notes receivable, etc., owned by
households. Close to 30% of taxable interest income earned by households flows from
pass-through businesses in recent years,33 meaning that that SCF interest rates are over-
stated by a factor of 1.4 (and potentially more at the top where pass-through income is
33
In 2011, Cooper et al. (2016) report that about $22 billion was paid as taxable interest by partnerships
to individuals (around 7% of all partnership income paid to individuals is interest (Figure 8), and about 35%
of partnership income is paid to individuals (Figure 3), so out of a total of $895 billion in partnership income
in 2011 (p. 122), 0.07 x 0.35 x $895 = $22 billion was paid as interest to households). In addition, according
to IRS statistics, an extra $11 billion was distributed by S-corporations as interest, for a total of $33 billion in
pass-through interest income, i.e., 28% of the total taxable interest income in 1040s ($120 billion in 2011). A
negligible amount of pass-through interest income was tax-exempt (partnerships and S-corporations owned 80
billion in tax-exempt securities, generating about $3 billion in interest in 2011). Note also that S-corporations
plus partnerships owned about $3 trillion in interest-bearing assets (with some uncertainty as bonds cannot be
separated from equities), and S-corporations had an average interest rate of about 1% on their interest-bearing
assets, close to the macro aggregate rate.
18You can also read