BNP Paribas Moving forward - Fixed Income Presentation
←
→
Page content transcription
If your browser does not render page correctly, please read the page content below
BNP Paribas
Moving forward

  Fixed Income Presentation

                           Asia
                 September 2014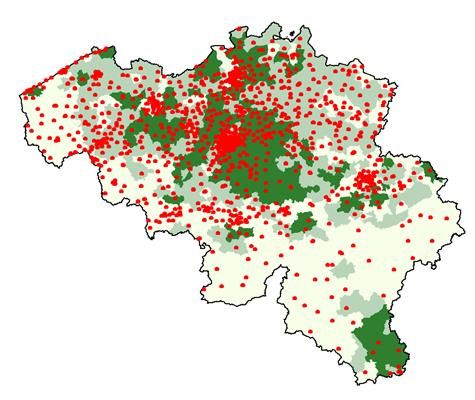
Disclaimer
Figures included in this presentation are unaudited. On 14 March 2014, BNP Paribas issued a restatement of its quarterly results for
2013 reflecting, in particular, (i) the adoption of the accounting standards IFRS 10 “Consolidated Financial Statements”, IFRS 11
“Joint Arrangements”, which has, in particular, the effect of decreasing the Group’s 2013 net income attributable to equity holders by
€14m, as well as the amended IAS 28 “Investments in Associates and Joint Ventures”; (ii) certain internal transfers of activities and
results made as of 1 January 2014, in the context of the medium-term plan, (iii) the application of Basel 3 which modifies the capital
allocation by division and business line and (iv) the evolution of allocation practices of the liquidity costs to the operating divisions in
order to align them to the Liquidity Coverage Ratio approach. Moreover, in order to ensure the comparability with the future 2014
results, pro-forma 2013 accounts have been prepared considering TEB group under full consolidation for the whole year. In these
restated results, data pertaining to 2013 has been represented as though the transactions had occurred on 1st January 2013. This
presentation is based on the restated 2013 quarterly data.
This presentation includes forward-looking statements based on current beliefs and expectations about future events. Forward-
looking statements include financial projections and estimates and their underlying assumptions, statements regarding plans,
objectives and expectations with respect to future events, operations, products and services, and statements regarding future
performance and synergies. Forward-looking statements are not guarantees of future performance and are subject to inherent risks,
uncertainties and assumptions about BNP Paribas and its subsidiaries and investments, developments of BNP Paribas and its
subsidiaries, banking industry trends, future capital expenditures and acquisitions, changes in economic conditions globally or in
BNP Paribas’ principal local markets, the competitive market and regulatory factors. Those events are uncertain; their outcome may
differ from current expectations which may in turn significantly affect expected results. Actual results may differ materially from those
projected or implied in these forward looking statements. Any forward-looking statement contained in this presentation speaks as of
the date of this presentation. BNP Paribas undertakes no obligation to publicly revise or update any forward-looking statements in
light of new information or future events.
The information contained in this presentation as it relates to parties other than BNP Paribas or derived from external sources has
not been independently verified and no representation or warranty expressed or implied is made as to, and no reliance should be
placed on the fairness, accuracy, completeness or correctness of, the information or opinions contained herein. None of BNP
Paribas or its representatives shall have any liability whatsoever in negligence or otherwise for any loss however arising from any
use of this presentation or its contents or otherwise arising in connection with this presentation or any other information or material
discussed.

                                                                                          Asia Fixed Income Presentation – September 2014      2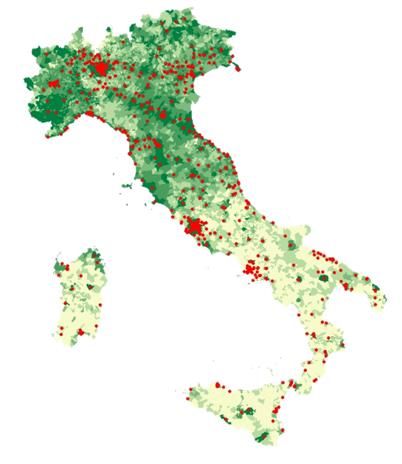
Group Results

Division Results

Development Plan Highlights

Appendix

                              Asia Fixed Income Presentation – September 2014   3
2Q14 Key Messages
€5,950m in 2Q14, of which:
One-off costs related to the comprehensive settlement with - Penalties*: €5,750m
U.S. authorities - Remediation plan: €200m
Net income, Group share: -€4,317m
Net income excluding exceptional items: €1.9bn**
Revenue stability in Retail Banking
Good growth in Investment Solutions Revenues of the operating divisions:
+4.0%*** vs. 2Q13
CIB up, very good performance
in Advisory and Capital Markets
Gross operating income growth +6.1%*** vs. 2Q13
Cost of risk down this quarter -16.8%**** vs. 2Q13
A rock-solid balance sheet
− Solvency in line with the 2014-2016 plan’s objectives Basel 3 CET1 ratio: 10.0%*****
− Very large liquidity reserve €244bn as at 30.06.14
− Sustained deposit growth in Retail Banking +4.5%**** vs. 2Q13
* Excluding amount already provisioned; ** Excluding one-off costs related to the comprehensive settlement with U.S. authorities and other exceptional items;
*** At constant scope and exchange rates, excluding exceptional items; **** At constant scope and exchange rates; ***** As at 30 June 2014, CRD4 (fully loaded)
Asia Fixed Income Presentation – September 2014 4Comprehensive Settlement with U.S. authorities
30 June 2014: comprehensive settlement* with the U.S. authorities regarding the review
of certain USD transactions involving parties subject to U.S. sanctions
Includes among other things the payment by BNP Paribas of a total of USD 8.97bn
(€6.6bn) in penalties
Given the amount already provisioned (USD 1.1bn or €798m), one-off cost of €5.75bn booked
this quarter
Remediation plan: two specific measures under implementation
All USD flows for the entire Group will be ultimately processed and controlled via the New York
branch
Creation of a Group Financial Security department in the US, as part of the Group Compliance
function, headquartered in New York
€200m in one-off costs related to the upcoming costs of the overall remediation plan
Impact on fully loaded Basel 3 CET1 ratio**: -100 bp in 2Q14
* See note 3.g in the first half 2014 consolidated financial statements; ** CRD4
Asia Fixed Income Presentation – September 2014 5Major Changes to the Group’s Internal Control System
Organisational alignment of all supervisory and control functions*
With the model of the Risk function and the General Inspection
Vertical integration of the Compliance and Legal functions
In order to guarantee their independence and their own separate funding
Creation of a Group Supervisory and Control Committee
Chaired by the CEO
Mission: provide cohesion and coordination of supervision and control actions
Bringing together bimonthly the Group managers from Compliance, Legal Affairs, Risks and
the Inspector General
Creation of a Group Conduct Committee
Positioning and monitoring policies in certain sensitive business sectors and countries
Positioning and monitoring the Group’s Code of Business Conduct
Including members who are qualified individuals from outside the Group
Review of the organisation and procedures launched
An international consulting firm to assist with the process
* Subject to consultation of employee representatives
Asia Fixed Income Presentation – September 2014 6Increasing Resources and Reinforcing Compliance and
Control Procedures
Continue to increase resources earmarked for compliance
Increase the staffing of the function, which is already up by over 40%
since 2009 (1,125 people in 2009, nearly 1,600 in 2013)
Improve internal control tools (for instance, new transaction filtering software)
Increase the number and expand the content of the Group’s employee training
programmes
Reinforce mandatory periodic procedures of customer portfolio reviews and
Know Your Customer
Strengthen controls performed by the General Inspection
Create a team specialised in compliance and financial security issues
Increase the frequency of the review of the main locations dealing in US dollars
Asia Fixed Income Presentation – September 2014 72Q14 Main Exceptional Items
2Q14 2Q13
Revenues
Introduction of FVA* (CIB – Advisory and Capital Markets) -€166m
Own credit adjustment and DVA (Corporate Centre) -€187m -€68m
Sale of Royal Park Investments’ assets (Corporate Centre) +€218m
Total one-off revenue items -€353m +€150m
Operating expenses
Simple & Efficient transformation costs (Corporate Centre) -€198m -€74m
Total one-off operating expenses -€198m -€74m
Costs related to the comprehensive settlement with U.S. authorities (Corporate Centre)
Amount of penalties (excluding amount already provisioned) -€5,750m
Upcoming costs related to the remediation plan -€200m
Total -€5,950m
Non operating items
Sale of BNP Paribas Egypt +€81m
Total one-off non operating items +€81m
Total one-off items -€6,501m +€157m
Impact of one-off items on the net income attributable to equity holders -€6,241m +€203m
* Funding Valuation Adjustment
Asia Fixed Income Presentation – September 2014 82Q14 Consolidated Group
2Q14 vs. 2Q14 vs. 2Q14 vs.
2Q14 2Q13*
2Q13 2Q13*
operating divisions
Revenues €9,568m -2.3% +4.8% +4.0%
Operating expenses -€6,517m +4.3% +4.1% +3.9%
Gross operating income €3,051m -13.8% +6.1% +4.3%
Cost of risk -€855m -18.1% -16.8% -16.2%
Costs related to the comprehensive
settlement with U.S. authorities -€5,950m n.a. n.a.
Pre-tax income -€3,600m n.a. +15.8% +11.4%
Net income attributable to equity holders -€4,317m n.a.
Net income attributable to equity holders
excluding exceptional items €1,924m +23.2%
Very good performance
excluding one-off items
* At constant scope and exchange rates, excluding exceptional items (see slide 8)
Asia Fixed Income Presentation – September 2014 92Q14 Revenues of the Operating Divisions
Investment
Retail Banking** CIB***
Solutions
+0.9%* * 2Q14 vs. 2Q13
changes
5,948 5,859 % at constant scope
€m +14.6%* and exchange rates
+5.0%*
2Q14
o/w Domestic +0.7%*
Markets**
2Q13
o/w
-0.5%*
+2.0%* +0.6%*
+0.1%* +1.2%*
+2.7%*
€m
FRB** BNL bc** BRB** Europe- BancWest** Personal Finance
Mediterranean**
Stability in Retail Banking and good growth in IS
Revenue growth at CIB
** Including 100% of Private Banking in France (excluding PEL/CEL effects), Italy, Belgium, Luxembourg, at BancWest and TEB;
*** Excluding exceptional items
Asia Fixed Income Presentation – September 2014 102Q14 Operating Expenses of the Operating Divisions
Investment
Retail Banking** CIB
Solutions
+0.8%* * 2Q14 vs. 2Q13
changes
3,633 3,577 % at constant scope
€m +11.9%* and exchange rates
+3.7%*
-0.5%*
2Q14
o/w Domestic
Markets**
2Q13
o/w
-0.9%*
-0.6%* -1.1%* +1.5%*
+6.7%* +3.7%*
€m
FRB** BNL bc** BRB** Europe- BancWest** Personal Finance
Mediterranean**
Effects of Simple & Efficient
Rise stemming from business growth at IS and CIB
** Including 100% of Private Banking in France (excluding PEL/CEL effects), Italy, Belgium, Luxembourg, at BancWest and TEB
Asia Fixed Income Presentation – September 2014 11Simple & Efficient
Cumulative recurring cost
savings
Continued the momentum throughout the entire Group €bn
1,336 programmes identified including 2,578 projects 1.6
of which 94% are already under way
Cost savings: €1,234m since the launch of the project
Of which €223m recorded in 2Q14
Reminder: €2.8bn annual target starting from 2016 One-off transformation
costs
€bn
Transformation costs: €198m in 2Q14 0.77
€340m in 1H14
Reminder: €770m target for the year
Realised Plan
Recurring cost savings in line with the plan
Asia Fixed Income Presentation – September 2014 12Variation in the Cost of Risk by Business Unit (1/3)
Net provisions/Customer loans (in annualised bp)
Group
Cost of risk: €855m
98 -€229m vs. 1Q14
58 -€189m vs. 2Q13
Overall stability since the beginning
of 2013
Impact of Greek sovereign debt impairment
CIB - Corporate Banking
Cost of risk: €51m
-€71m vs. 1Q14
-€72m vs. 2Q13
Cost of risk low this quarter
* Restated
Asia Fixed Income Presentation – September 2014 13Variation in the Cost of Risk by Business Unit (2/3)
Net provisions/Customer loans (in annualised bp)
FRB
Cost of risk: €103m
-€5m vs. 1Q14
+€15m vs. 2Q13
Cost of risk still low
BNL bc Cost of risk: €364m
Stable vs. 1Q14
+€69m vs. 2Q13
Cost of risk still high due to the
challenging environment
BRB Cost of risk: €15m
-€37m vs. 1Q14
-€28m vs. 2Q13
Cost of risk particularly low this
quarter
Asia Fixed Income Presentation – September 2014 14Variation in the Cost of Risk by Business Unit (3/3)
Net provisions/Customer loans (in annualised bp)
Europe-Mediterranean
Cost of risk: €50m
-€55m vs. 1Q14
154 -€12m vs. 2Q13
115 117 95 124
85 92
83 72 Decline in the cost of risk this quarter
Reminder of 1Q14: €43m provision
2011 2012 2013 1Q13 2Q13 3Q13 4Q13 1Q14 2Q14 due to the situation in Eastern
Europe
BancWest
Cost of risk: €16m
+€5m vs. 1Q14
+€4m vs. 2Q13
69 35 13 25 11 0 16 11 15 Cost of risk still at a very low level
2011 2012 2013 1Q13 2Q13 3Q13 4Q13 1Q14 2Q14
Personal Finance
Cost of risk: €249m
261 250 243 248 259 239 244
227 217 -€28m vs. 1Q14
-€44m vs. 2Q13
Decline in the cost of risk this quarter
2011 2012 2013 1Q13 2Q13 3Q13 4Q13 1Q14 2Q14
Asia Fixed Income Presentation – September 2014 15Financial Structure
Fully loaded Basel 3 CET1 ratio*: 10.0% as at 30.06.14 Basel 3 solvency ratio
(-60 bp vs. 31.03.14)
Of which costs related to the comprehensive settlement
with U.S. authorities: -100 bp
Of which 2Q14 results (excluding above costs) after taking into
account an annual dividend of €1.5 per share: +30 bp
Of which revaluation reserve appreciation: +10 bp
Fully loaded Basel 3 leverage ratio*
3.5% calculated on total Tier 1 capital**
Immediately available liquidity reserve: €244bn*** (€247bn as at 31.12.13)
Equivalent to over one year of room to manoeuvre in terms of wholesale funding
2014 MLT funding programme fully completed
A rock-solid balance sheet
* CRD4; ** Including the forthcoming replacement of Tier 1 instruments that have become ineligible with equivalent eligible instruments;
*** Deposits with central banks and unencumbered assets eligible to central banks, after haircuts
Asia Fixed Income Presentation – September 2014 16Medium/Long-Term Funding
2014 MLT wholesale funding Wholesale MLT funding structure
programme: €23bn breakdown as at 30.06.14: €141bn
€bn
Senior debt: €23.7bn realised** at mid-July 2014
Maturity: 4.8 years on average Tier One*: 8
Other subordinated
Mid-swap +51 bp on average debt: 12
Primarily senior unsecured
Of which 58% public issues and Senior secured: 32
42% private placements
Tier 2 issuance of €1.5bn with a 12 year maturity, Senior
with a repayment option after 7 years (12NC7), unsecured: 88
realised on 20 February 2014 (mid-swap +165bp)
2014 MLT funding programme placed in
the networks: €7bn
€8.3bn realised** at mid-July 2014
2014 MLT funding programme fully completed
* Debt qualified prudentially as Tier 1 recorded as subordinated debt or as equity;
** Including issues at the end of 2013 (€8.3bn) in addition to the €37bn issued under the 2013 programme
Asia Fixed Income Presentation – September 2014 171H14 Consolidated Group
1H14 vs. 1H14 vs. 1H14 vs.
1H14 1H13*
1H13 1H13*
operating divisions
Revenues €19,481m -1.4% +2.7% +1.9%
Operating expenses -€12,899m +1.4% +2.3% +2.8%
Gross operating income €6,582m -6.5% +3.4% +0.3%
Cost of risk -€1,939m -0.8% -3.7% -4.0%
Costs related to the comprehensive
settlement with U.S. authorities -€5,950m n.a. n.a.
Pre-tax income -€1,053m n.a. +6.0% +1.0%
Net income attributable to equity holders -€2,649m n.a.
Net income attributable to equity holders
excluding exceptional items €3,535m +12.3%
* At constant scope and exchange rates, excluding exceptional items (see slide 8 and first quarter 2014 results)
Asia Fixed Income Presentation – September 2014 18Group Results
Division Results
Development Plan Highlights
Appendix
Asia Fixed Income Presentation – September 2014 19Domestic Markets - 2Q14
Deposits
Business activity
+3.8%
Deposits: +3.8% vs. 2Q13, good growth in France, Belgium and at 296
Cortal Consors in Germany 285
PI
Loans: -0.8% vs. 2Q13, loan demand still weak LRB
Cash management: commercial successes in the wake of the BRB
transition to the European SEPA standard BNL bc
Ongoing digital innovation: development of Hello bank!,
e-Wallets and mobile payment solutions FRB
€bn
Revenues*: €3.9bn (+0.7% vs. 2Q13)
Cost/Income*
Good performance of Private Banking and Arval
Persistently low interest rate environment -1.7 72.6% BRB
Operating expenses*: -€2.4bn (-0.6% vs. 2Q13)
-0.6 63.3% FRB
Improvement of the cost/income ratio in France, Italy and Belgium 62.1% DM
-0.9
GOI*: €1.5bn (+3.1% vs. 2Q13)
-0.6 53.4% BNL bc
Pre-tax income**: €0.9bn (-4.4% vs. 2Q13) Var. in p.p.
Good overall performance
Continuous improvement of the cost/income ratio
* Including 100% of Private Banking, excluding PEL/CEL effects; ** Including 2/3 of Private Banking, excluding PEL/CEL effects
Asia Fixed Income Presentation – September 2014 20French Retail Banking - 2Q14
Deposits
Business activity +4.7%
Deposits: +4.7% vs. 2Q13, strong growth in current accounts
Loans: -1.3% vs. 2Q13, demand for loans still low
Launch of Préférence Clients 2016: a new customer relationship model with
10 service commitments, improved capacity to offer advisory services and
new branch formats
Private Banking: rise in assets under management (€81bn, +8.4% vs. 2Q13), €m
unrivalled #1 ranking
Growth of factoring and market share gains in cash management
Innovation: launch of Mobo, France’s 1st mobile banking payment solution Factoring outstandings
Revenues*: -0.5% vs. 2Q13 +10.4%
Net interest income: +2.5%, effect of the growth in current accounts
Fees: -4.7%, decline in certain processing fees due to regulatory changes**
Operating expenses*: -1.0% vs. 2Q13
Continuing impact of operating efficiency measures €bn
Pre-tax income***: €484m (-2.4% vs. 2Q13)
Resilient revenues
Improvement of operating efficiency
* Including 100% of FPB, excluding PEL/CEL effects; **Certain processing fees (commissions d’intervention) capped starting on 1st January (Banking Law);
*** Including 2/3 of FPB, excluding PEL/CEL effects
Asia Fixed Income Presentation – September 2014 21BNL banca commerciale - 2Q14
Off balance sheet savings
Business activity (Life insurance outstandings)
Deposits: -7.9% vs. 2Q13, decline on the corporate segment focused on +19.2%
the most costly deposits
Loans: -2.3% vs. 2Q13, continued slowdown on the corporate and small
business segments, loans held up well on the individual segment
Off balance sheet savings: good asset inflows in life insurance and
mutual funds
Product innovation: success of the new payment and credit card offer €bn
(net production > 80,000 cards in 1H14, x2 vs. 1H13)
Revenues*: +0.1% vs. 2Q13 GOI*
Net interest income: +1.1% vs. 2Q13, favourable structural effect on +0.8%
deposits but impact of the decline in volumes
Fees: -1.8% vs. 2Q13, lower fees from loans but good performance of
off balance sheet savings
Operating expenses*: -0.5% vs. 2Q13
Effect of operating efficiency measures
€m
Pre-tax income**: €1m (-98.6% vs. 2Q13)
Cost of risk increased due to a challenging environment
(+23.4% vs. 2Q13)
Continuing adaptation in a still challenging environment
* Including 100% of Italian Private Banking; ** Including 2/3 of Italian Private Banking
Asia Fixed Income Presentation – September 2014 22Belgian Retail Banking - 2Q14
Business activity Deposits
Deposits: +5.5% vs. 2Q13, good growth in current and savings accounts +5.5%
Loans: +1.3% vs. 2Q13, growth in loans to individual customers,
loans to SMEs held up well
Developing digital banking: nearly 800,000 downloads of the Easy Banking
application for iPhone/iPad and Android since launch in mid-2012,
of which > 210,000 in 1H14
€bn
Revenues*: +2.1% vs. 2Q13
Net interest income: growth in line with increased volumes
Fees up slightly
GOI*
Operating expenses*: -1.0% vs. 2Q13 +11.9%
Branch network and workforce adaptation
Impact of the increase in systemic taxes
Improvement of operating efficiency in line with Bank for the Future
Pre-tax income**: €186m (+31.0% vs. 2Q13)
€m
Cost of risk particularly low this quarter
Very good performance
Continuing improvement of the operating efficiency
* Including 100% of Belgian Private Banking; ** Including 2/3 of Belgian Private Banking
Asia Fixed Income Presentation – September 2014 23Europe-Mediterranean - 2Q14
Deposits*
Business activity
Deposits: +11.1%* vs. 2Q13, up in most countries, strong increase in Turkey +11.1%
Loans: +11.3%* vs. 2Q13, rise in particular in Turkey
Good development in cash management and Private Banking
(in particular growth of assets under management in Turkey to €3.5bn,
or +34%* vs. 30.06.13)
€bn
Revenues**: +2.7%* vs. 2Q13
Impact of regulatory changes in Algeria and Turkey since 3Q13***
+9.7%* vs. 2Q13 excluding this impact and revenue growth in all countries Loans*
Operating expenses**: +6.7%* vs. 2Q13
+11.3%
Effect in particular of the bolstering of the commercial setup in Turkey in 2013
(opened 15 branches vs. 2Q13)
Pre-tax income****: €119m (-4.3%* vs. 2Q13)
€bn
Strong sales and marketing drive
* At constant scope and exchange rates; ** Including 100% of Turkish Private Banking; *** New regulations on charging fees for overdrafts in Turkey and foreign exchange
fees in Algeria (-€37m impact this quarter); **** Including 2/3 of Turkish Private Banking
Asia Fixed Income Presentation – September 2014 24BancWest - 2Q14
Deposits
Strong business activity
+6.4%
Deposits: +6.4%* vs. 2Q13, strong rise in current and savings
accounts
Loans: +6.0%* vs. 2Q13, continued strong growth in corporate and
consumer loans
Private Banking: +32% increase in assets under management vs.
30.06.13 ($7.9bn as at 30.06.14) $bn
Revenues**: +1.2%* vs. 2Q13 Loans
Rise in volumes being offset by low interest rate environment
+6.0%
Operating expenses**: +3.7%* vs. 2Q13
Increase in regulatory costs***
Impact of the strengthening of the commercial setup (Private
Banking) partially offset by savings generated by streamlining the
network (34 branch closures in 1 year) $bn
Pre-tax income****: €178m (-6.0%* vs. 2Q13)
Dynamic sales and marketing activities
* At constant scope and exchange rates; ** Including 100% of Private Banking in the United Sates; *** Including CCAR; **** Including 2/3 of Private Banking
Asia Fixed Income Presentation – September 2014 25Personal Finance - 2Q14
Recent events Consolidated outstandings
On 25 July, bought out Galeries Lafayette’s stake (50%) in LaSer following the +3.6%**
exercising of their put option: LaSer now wholly-owned; Personal Finance now
the #1 specialty player in France
Strategic partnership with Commerzbank* in Germany renewed until 2020:
continued development in the largest consumer lending market in the
euro zone
€bn
Revenues: +0.6%** vs. 2Q13
+1.4%** vs. 2Q13 excluding non recurring items
Business growth in line with the business development plan and rise in
outstandings in all regions, in particular in Germany, Belgium and Operating income
Central Europe
+17.6%**
Operating expenses: +1.5%** vs. 2Q13
Increase in line with growth in the business
Pre-tax income: €263m (+18.2%** vs. 2Q13)
Decrease in the cost of risk this quarter
€m
Good contribution of associated companies
Sharp rise in income
* Joint venture in which BNP Paribas Personal Finance has a 50.1% stake; ** At constant scope and exchange rates
Asia Fixed Income Presentation – September 2014 26Investment Solutions
Asset Flows and Assets under Management - 1H14
Assets under management*
Assets under management*: €883bn as at 30.06.14 €bn +2.5 -1.2 TOTAL
+3.5% vs. 31.12.13; +5.2% vs. 30.06.13 +26.7
Performance effect on the back of the favourable evolution Foreign Others
exchange
in equity markets and interest rates effect
Net asset flows: +€1.6bn in 1H14 +1.6 883
Asset Management: slight overall asset outflows, positive asset Net asset Performance
inflows in bond funds 854 flows effect
Wealth Management: slight asset inflows driven in particular by
Asia (Hong Kong, Singapore), France and Italy 31.12.13 30.06.14
Insurance: significant asset inflows in Italy, France and Assets under management*
Asia (Taiwan) at 30.06.14
Wealth
Securities Services: commercial successes and continued Insurance: 190
Management:
business development 295
Real Estate
Won a significant mandate: custody and administration of Services: 19
Generali Group’s assets in Europe (~€180bn in assets)
Acquired Banco Popular's depositary banking business in Spain
(~€13bn in assets)
€bn
Asset Management: 380
Rise in assets under management
* Including assets under advisory on behalf of external clients and distributed assets
Asia Fixed Income Presentation – September 2014 27Investment Solutions - 2Q14
Revenues by business unit
Revenues: €1,660m (+5.0%* vs. 2Q13)
+5.0%*
Insurance: +8.1%* vs. 2Q13, good progress in France and
Italy, strong growth in international protection insurance 1,593 1,660
WAM**: +2.3%* vs. 2Q13, growth in Real Estate Services Insurance
and Asset Management Wealth and Asset
Management
Securities Services: +5.9%* vs. 2Q13, rise in the number of
transactions and assets under custody €m Securities Services
Operating expenses: €1,105m (+3.7%* vs. 2Q13)
Insurance : +6.8%* vs. 2Q13, in line with continued growth Pre-tax income
in the business internationally
+9.2%*
WAM**: +3.0%* vs. 2Q13, impact of business development 603
investments (Wealth Management, Asset Management) 563
Securities Services: +2.4%* vs. 2Q13, due to business
growth
Pre-tax income: €603m (+9.2%* vs. 2Q13)
€m
Good overall performance,
driven by Insurance and Securities Services
* At constant scope and exchange rates; ** Asset Management, Wealth Management, Real Estate Services
Asia Fixed Income Presentation – September 2014 28Corporate and Investment Banking - 2Q14
Revenues by Equities & Advisory
Fixed Income
Revenues: €2,398m excluding FVA* business unit Corporate Banking
(+14.6%** vs. 2Q13) €m
FVA* introduction
One-off impact this quarter of the introduction of FVA* 2,470 2,337 2,232
2,114 2,043 2,074
Advisory & Capital Markets: +22.4%** vs. 2Q13,
strong growth both in the Fixed Income and Equities &
Advisory businesses
Corporate Banking: +2.9%*** vs. 2Q13, driven by strong
growth in Asia
Operating expenses: €1,550m (+11.9%*** vs. 2Q13) Pre-tax income
Impact of the growth in the Advisory & Capital Markets €m
business
Continued investment in business development plans
2014-2015 interim adaptation costs: €10m related
primarily to new regulations (CCAR,…) this quarter
Pre-tax income: €661m (+28.3%*** vs. 2Q13)
Good overall performance
* Funding Valuation Adjustment (-€166m); ** At constant scope and exchange rates, excluding the impact of the introduction of FVA; *** At constant scope and exchange rates
Asia Fixed Income Presentation – September 2014 29Corporate and Investment Banking
Advisory and Capital Markets - 2Q14
Revenues: €1,539m excluding FVA (+22.4%* vs. 2Q13) 1H14 bond issuance
rankings**
Situation more upbeat in Europe as a result of the ECB’s
By volume
announcements #1
#1
VaR still at a very low level (€36m) #2
#3
Fixed Income: €986m excluding FVA (+22.1%* vs. 2Q13)
Good activity in the rate and credit businesses (with a weak basis of
comparison in 2Q13), forex business in progress with a good
performance in Asia
Sustained bond issues: ranked #1 for corporates bonds in euros and
#8 for all international corporate bonds**
Equities & Advisory: €553m (+22.9%*** vs. 2Q13)
Still a good drive in equity derivatives, both with respect to flow
business and structured products
5
At this stage, marginal impact of the first transfers of RBS’s derivatives
portfolios
Joint Bookrunner
Growth in the M&A business and in equity issues, ranked #1 for equity €12.1bn Advised Vivendi
USD-EUR on the sale of SFR
linked in EMEA in the first half of the year****
Senior Notes €17bn
Pre-tax income: €269m (+11.2%** vs. 2Q13) April 2014 Closing under way
Good performance of Advisory & Capital Markets
* At constant scope and exchange rates, excluding the impact of the FVA introduction; ** Source: Thomson Reuters 1H14;
*** At constant scope and exchange rates; **** Source: Dealogic 1H14
Asia Fixed Income Presentation – September 2014 30Corporate and Investment Banking
Corporate Banking - 2Q14
1H14 rankings
Business activity EMEA syndicated loans*
Ranked #1 for syndicated financing in Europe* with leading By volume
positions in the Media-Telecom, Metal & Mining and #1 #1 #1 #1 #1
Utility & Energy sectors
Overall stability of client loans (€107bn) vs. 1Q14,
growth in Asia and in the Americas, decline in Europe
Development of international cash management with several
new significant mandates and growth in deposits
Revenues: €859m (+2.9%** vs. 2Q13)
Fees up (+5% vs. 2Q13)
Client deposits
Strong growth in Asia Pacific with a rise in the Trade Finance business
and a good level of fees +16%
Growth in the Americas and weak business in the EMEA region
(subdued economic environment and slowdown in the Energy &
Commodities sector)
Average
Pre-tax income: €392m (+43.9%** vs. 2Q13) outstandings
€bn
Decline in operating expenses and the cost of risk this quarter
Effects of the business development plans
in Asia and in cash management
* EMEA, source: Dealogic 1H14; ** At constant scope and exchange rates; *** Restated
Asia Fixed Income Presentation – September 2014 31Group Results
Division Results
Development Plan Highlights
Appendix
Asia Fixed Income Presentation – September 2014 32Five Major Strategic Priorities for 2016
1. Enhance Client Focus and Services
Individual customers: prepare the retail banking of the future
Develop digital innovations
Hello bank! in Germany, Belgium, France and Italy:
target of 1.4m customers in 2017
Launch of new online payment solutions: PayLib in France,
Sixdots in Belgium, … which include value-added services for
consumers and businesses
e-business at Personal Finance, roll out of the digital offering at
International Retail Banking (IRB)
Adapt the branch network Customer contact by channel
Preference Client programme in France,
Bank for the Future in Belgium and Matin in Italy
Internet, Mobile
Differentiated and complementary branch formats & Telephone
Expanding the customer relation: omni-channel, mobile,
in real-time and multi-domestic
ATM
Continue to grow Private Banking at a fast pace leveraging
the Domestic Markets and IRB networks Branch
Develop relationship with entrepreneurs
Asia Fixed Income Presentation – September 2014 33Five Major Strategic Priorities for 2016
1. Enhance Client Focus and Services
Corporates: leverage our European and global organisation
One Bank for Corporates: a network of 216 business centres A unique network for
corporate clients
A presence in 75 countries
Cash management: #1(1) position strengthened in Europe 55
Continue to roll out Originate to Distribute approach 61
Bolster debt platforms (in particular High Yield) 32 7
37 24
Institutional clients: implement a more coordinated approach
Closer cooperation between the capital market businesses, # Business centres (One Bank for Corporates)
Securities Services and Investment Partners
Design new customer solutions
Pool operating platforms
(1) Source: Greenwich
Asia Fixed Income Presentation – September 2014 34Five Major Strategic Priorities for 2016
2. Simple & 3. Efficient
Simple: simplify our organisation and how we operate
A management priority
Clarify roles and responsibilities in order to speed up the decision-making process
Improve teamwork through digital tools
420 initiatives launched
Cumulative recurring cost
Efficient: continue improving operating efficiency savings
€bn
Rapid start-up in 2013
Cost savings (€0.8bn), transformation costs (€0.66bn)
Plan revised upward and extended to 2016
€2.8bn in savings a year starting in 2016
€2.0bn in transformation costs over 3 years One-off transformation
Distribution of savings by 2016 costs
€bn
Retail Banking (63%), CIB (24%), Investment Solutions (13%)
Asia Fixed Income Presentation – September 2014 35Five Major Strategic Priorities for 2016
4. Adapt Certain Businesses to their Economic and Regulatory Environment
BNL: continue adapting to the economic environment
Develop digital banking, adapt the branch formats Cost/income ratio(1)
and grow the private banking customer base
Focus the commercial approach to corporates on
value added segments (export companies, …)
Leveraging in particular on a differentiated offering
compared to the competition
Continue improving operating efficiency
Shared platforms between various business units
Improve the cost of risk from 150 bp in 2013
toFive Major Strategic Priorities for 2016
4. Adapt Certain Businesses to their Economic and Regulatory Environment
Capital Markets: adapt to the new regulatory environment
Client driven activities, strategic in the new Transformation of the industry
environment
Leverage leading positions in a context of Demand for
electronic
disintermediation of credit OTC
execution
Derivatives
exchange on
derivatives
Differentiate the product offering and industrialise flow clearing
organised
platforms
product processes
Capital &
Capitalise on our strengths in bespoke derivatives Initial margin liquidity
constraints
Improve operating efficiency (C/I ratio: -9 pts by 2016)
Pre-tax RONE >20%(1) by the end of 2016 Financing of corporates
via capital markets(3)
2013 bond issuance rankings(2)
Ranking by volume #1 #1
#3
#8
#10
(1) Basel 3; (2) Source: Thomson Reuters 2013;
(3) Source: McKinsey Global Institute – Financing outstandings of non financial companies (% equities and bonds at the end of 2012)
Asia Fixed Income Presentation – September 2014 37Five Major Strategic Priorities for 2016
4. Adapt Certain Businesses to their Economic and Regulatory Environment
Investment Partners: a strategic business for the Group
Relaunch asset gathering: +€40bn net by 2016 in
the value added segments
Capitalise on recognised asset management quality
3 priority areas for business development
Institutional clientele: strengthen recognition by
leading international consultants and increase
assets under management by winning new Global workforce network
mandates
Asia Pacific and emerging markets platforms:
Europe: 61%
increase the volume of assets under management 15 countries
in growth markets and increase cross-selling
worldwide
Asia Pacific: 26%
Americas: 9%
Distribution networks (retail and private banking 10 countries
6 countries
clientele): create one of the 3 biggest distribution
platforms in continental Europe Rest of the world: 4%
4 countries
A profitable core business
Limited capital consumption
Asia Fixed Income Presentation – September 2014 38Five Major Strategic Priorities for 2016
5. Successfully Implement Business Development Initiatives
Asia Pacific: a region for the Group to develop business
Growth targets adapted to each
One of the best positioned international banks
country
Presence in 14 countries of which 12 with a full
banking licence
~8,000 employees at CIB and Investment
Solutions Beijing
Tokyo
Seoul
Expand the organisation in a fast growing region Shanghai
Bolster the commercial set up geared toward Hanoi
Taipei
multinational companies and local large and Mumbai Hong-Kong
medium-sized businesses Bangkok Manila
Grow the Group’s presence in order to expand Kuala Lumpur
resource gathering Singapore
Jakarta
Forge new partnerships especially in insurance
and consumer credit
Grow revenues in Asia to over €3bn(1) by 2016 Growth in most business units
2013, a year that met expectations: Targeted growth
revenues at €2.5bn vs. €2.0bn in 2012 (+24.4%) Regional hub
Sydney
Auckland
(1) CIB and Investment Solutions
Asia Fixed Income Presentation – September 2014 39Five Major Strategic Priorities for 2016
5. Successfully Implement Business Development Initiatives
CIB - North America: consolidate our presence in a major market
A sizeable regional platform for CIB CIB North America’s 2013 revenues
Breakdown by business line
~3,000 professionals; more than 2,000 clients
9 locations in the USA and Canada Fixed Income: 37%
Corporate Banking: 36%
A strong and diversified CIB franchise (#10 USD
domestic bonds, #10 US syndicated loans, …)
A comprehensive distribution platform with product
sales teams and a dedicated investor coverage
Develop business with large corporates and Equity & Advisory: 27%
institutional clients; strengthen relations with
investor clients Develop synergies with
BancWest
Accompany US corporates and investor clients
to Europe and European clients to the US
Adapt the business model to changes in market
infrastructure
CIB
Business development initiatives with BancWest
to expand cross-selling
Asia Fixed Income Presentation – September 2014 40Five Major Strategic Priorities for 2016
5. Successfully Implement Business Development Initiatives
Germany: a target for our development in Europe
An organisation covering
First European economy all client segments
Strong export capability mainly to the other
European markets, a large pool of competitive and Retail:
CORTAL CONSORS
sizeable international companies Hamburg
LEASING SOLUTIONS
A diversified organisation covering all client
Bremen BNPP FACTOR
Braunschweig Berlin ARVAL
segments Duisburg Essen
Düsseldorf Leipzig
12 businesses, ~3,500 employees Köln
IS:
Frankfurt
REAL ESTATE
A global growth initiative fostering cross-selling Trier-Saarbrücken Nürnberg
SECURITIES SERVICES
CARDIF
across all segments Stuttgart INVESTMENT PARTNERS
WEALTH MANAGEMENT
München
Substantially increase deposits of individuals with CIB
Hello bank!
Strengthen our positioning on the corporate client Revenues
segment €bn
+8% CAGR
Speed up the process of developing strong
positions in specialised business units
Build a long-term franchise
Asia Fixed Income Presentation – September 2014 41Five Major Strategic Priorities for 2016
5. Successfully Implement Business Development Initiatives
Turkey: continue our medium-term business development
A growing market TEB branch network
# branches
Sizeable population (76m inhabitants)
186 7 # business centres
Still low banking penetration rate Istanbul
Karadeniz Bölgesi
A comprehensive and adapted set up
Marmara Bölgesi Erzurum
Ankara 30 1 14
62 1
Doǧu Anadolu
9th largest Turkish retail bank(1) Izmir
Ege Bölgesi
Iç Anadolu Bölgesi
Bölgesi
75 3 Diyarbakir
566 branches, ~11,000 employees 79 2 Güneydogu Anadolu Bolgesi
Adana
23 1
A multi-business presence fostering cross-selling Akdeniz Bölgesi 70 2
Growth effort focused on higher potential clients
Retail and SME: first class digital offering, Revenues
Wealth Management deployment, mass affluent €bn
>+15% CAGR
Corporates: One Bank for Corporates model roll out,
CIB products offer deployment, increased cross-selling
with Leasing
Grow revenues to over €1.6bn in 2016 vs. €1.1bn in
2013 (>+15% CAGR)
Improve the cost/income ratio by 7 pts by 2016
(1) In terms of customer loans, as at 31.12.13
Asia Fixed Income Presentation – September 2014 42Five Major Strategic Priorities for 2016
5. Successfully Implement Business Development Initiatives
Continue the development of specialised businesses that are leaders in their sector (1/2)
Insurance: continue business development
2016
Presence in 37 countries, 11th largest insurer in Europe(3) 2013(1)
targets
Forge partnerships and continue pursuing growth in Asia Revenues €2,136m >+4%(2)
and South America
RONE 19.2% 20%
Grow the share of protection products
Improve operating efficiency
Securities Services: leverage strong positions to generate
growth 2016
2013(1)
Presence in 34 countries, ranked #1 in Europe and #5 worldwide targets
Capitalise on opportunities stemming from the new regulatory Revenues €1,409m +7%(2)
framework
RONE 42.0% 45%
Develop product and customer coverage synergies with CIB
Step up the pace of organic growth and increase operating
efficiency
(1) Restated; (2) CAGR; (3) Eurozone
Asia Fixed Income Presentation – September 2014 43Five Major Strategic Priorities for 2016
5. Successfully Implement Business Development Initiatives
Continue the development of specialised businesses that are leaders in their sector (2/2)
Personal Finance: leverage its recognised expertise
Presence in 20 countries, #1 in consumer lending in Europe 2016
2013(1)
targets
Continue international business development and strategic
partnerships Revenues €3,693m +2.5%(2)
Speed up the roll out of the digital offering, automobile financing, RONE 28.6% 35%
protection insurance and savings
Improve operating efficiency
Ambitious business development plans for
Arval, #3 in Europe: grow the fleet with increased cross-selling in
the Group and develop business in high potential markets
Leasing Solutions, European leader in equipment leasing:
develop activity in targeted countries in Europe
Real Estate Services, #1 provider in Europe of real estate
services to corporates: reinforce leading positions across Europe
(1) Restated; (2) CAGR
Asia Fixed Income Presentation – September 2014 44Conclusion
Very significant impact of one-off items this quarter
Major changes to the Group’s compliance and control system
Good performance of operating divisions
A rock solid balance sheet
Development plan investments starting to bear fruit
Asia Fixed Income Presentation – September 2014 45Group Results
Division Results
Development Plan Highlights
Appendix
Asia Fixed Income Presentation – September 2014 46Improving Confidence Towards Europe
10-yr government yields
(in %) OMT announced
14 « Euro is irreversible »
(M. Draghi)
FR
12
GER
10 BE
SP
8
IT
PT
6
4
2
0
04/12 06/12 08/12 10/12 12/12 02/13 04/13 06/13 08/13 10/13 12/13 02/14 04/14 06/14 08/14
Lower Government yields across the board,
especially for peripheral countries
Asia Fixed Income Presentation – September 2014 47New European Banking Framework
Recovery and
Adoption of a single Implementation of
Resolution Directive
rule book (Capital the fiscal pact
and Deposit
Requirement transferring fiscal
EU Regulation) based balance monitoring
Guarantee Scheme
Directive adopted by
28 on Basel 3 proposals to the EU
European Parliament
2H11 1H12 2H12 1H13 2H13 1H14
OMT(1) Creation of the Single Single
“Euro is
EZ Euro zone programme permanent Supervisory Resolution
irreversible”
crisis announced by €500bn ESM(2) Mechanism Mechanism
18 (Draghi)
ECB facility voted voted
The three pillars of the Banking Union decided in 2013 are being rolled out
Single Supervisory Mechanism (SSM) voted in October 2013 and applicable this year end
Single Resolution Mechanism (SRM) voted in April 2014, to be fully effective January 2016
Deposit Guarantee Scheme voted in April 2014, to be transposed by July 2015
“Comprehensive Assessment” of banks’ balance sheets
ECB preparing to take on new banking supervision tasks
Process in its final phase: join-up of AQR and Stress test end of September
Results to be announced by ECB in the 2nd half of October
Banking Union is now well on track in the Euro area
(1) Outright Monetary Transactions; (2) European Stability Mechanism
Asia Fixed Income Presentation – September 2014 48Eurozone Current Accounts Balance
Current accounts balance
% of GDP
4
EZ
2
IT
0
BE
-2 FR
US
-4
UK
-6
2007 2008 2009 2010 2011 2012 2013
The Eurozone compares favorably with other major areas
Source: Eurostat
Asia Fixed Income Presentation – September 2014 49Public Finances
Public debt Public deficit
130 As % of GDP As % of GDP
120 US 0
110 -2
100 EZ
EZ -4
90 UK UK
80 -6 US
70 -8
60
50 -10
40 -12
2006 2007 2008 2009 2010 2011 2012 2013 2006 2007 2008 2009 2010 2011 2012 2013
The Eurozone has taken measures
to improve its public finances
Source: Eurostat, BNPP estimates
Asia Fixed Income Presentation – September 2014 50Situation of the Eurozone Economy
Real GDP growth
(annual % growth rate)
6
US
4
UK
2
EZ
0
-2
-4
Impact of austerity
measures on EZ growth
-6
-8
2006 2006 2007 2007 2008 2008 20092009 2010 2010 2011 2011 2012 2012 2013 2013 2014
1Q14
Delayed recovery of Eurozone economy
due to the impact of austerity measures
Source: Eurostat
Asia Fixed Income Presentation – September 2014 51Macroeconomic Trends of Domestic Markets
Public and household debt(1) Gross household savings rate(2)
% GDP 223 % Gross Disposable Income
182
160 160 178
138 150 45
105 16.1% 15.0%
58 92 14.4% 12.8% 12.4%
56 65 Households
58
133 118 Public 6.2%
80 94 102 95 90 3.8%
Germany France Belgium Eurozone Italy UK USA Germany Belgium France Eurozone Italy UK USA
Strong presence in wealthy Domestic Markets
(1) 2013; (2)2013, 2012 for Eurozone, last available figure (Source: Ameco)
Asia Fixed Income Presentation – September 2014 52Geographic and Business mix
2013 Revenues 2013 Allocated equity(1)
by geography by operating division
RoW: 3% Investment Solutions
Turkey: 3% 15%
APAC: 7%
North America: 10% CIB
29%
Europe Retail
77% 56%
4 domestic
markets: ~62%
A diversified business model
with a significant presence in Europe
(1) Basel 3
Asia Fixed Income Presentation – September 2014 53Universal Bank Business Model (1/2)
A universal bank business model that demonstrated its resilience during the crisis
Client centric businesses
Cross-selling at the core of the model
Good risk diversification
Individual Corporates Institutional
customers clients
4 domestic markets (France, Italy, Belgium and Luxembourg)
Diversified International Retail Banking networks
Retail Banking
27 million Retail networks clients and 1 million corporates
Risk diversification
Personal Finance: #1 in consumer credit in Europe
Cross-selling
Fixed Income: #1 all bonds in euros, #8 all international bonds
GECD: Top 3 European Equity Derivatives
CIB
Corporate Banking: #1 for syndicated financing in Europe
Cash Management: #1 in Europe, #4 Global Provider
Wealth Management: #3 in Europe
Investment Partners: #6 European Asset Manager
Investment Solutions
Insurance: #11 in Europe
Securities Services: #1 in Europe, #5 worldwide
Cross-selling and risk diversification at the heart of the model
Asia Fixed Income Presentation – September 2014 54Universal Bank Business Model (2/2)
Cross-selling at the heart of the model Cross-selling between CIB &
BNL (revenue evolution)
Strong development in Italy of cross-selling following BNL’s acquisition in 2006… Rebased
+23% CAGR
Private banking: market share x2 (~3% in 2008 to ~6% in 2013)
Cash management: marginal player before 2006, #1 in 2013(1)
Syndicated loans: #7 in 2007, #3 in 2013(2) 100
Corporate Finance (M&A): from #15 in 2005 to #5 in 2013(3)
…and also in Belgium after Fortis’ acquisition in 2009
Private banking: from #7 in 2009 to #1 in 2013 2009 2013
Consumer finance outstandings: +68% between 2009 & 2013(4)
Corporate Finance (M&A): from #10 in 2007 to #1 in 2013(3) Cross-selling between CIB-SF(5)
& Fortis (revenue evolution)
Roll out of the model in International Retail Banking
Rebased
+18% CAGR
Good risk diversification
100
By sector of activity: no sector representing more than ~5% of Group’s total gross
commitments(6)
By business: no single business line weighing more than 14% of RWAs 2009 2013
By geography: over 70% of revenues outside France with the highest
concentration in North America and Belgium/Luxembourg at 14% of revenues
(1) Source: Euromoney survey; (2) Source: Dealogic, by volume; (3) Source: Thomson Reuters; (4) Alpha Credit average outstandings; (5) Specialised Financing; (6) Inc. Retail
Asia Fixed Income Presentation – September 2014 55Domestic Markets at a Glance
4 domestic networks: ~4,000 branches 3 specialised businesses
~12m retail clients and 300,000 private banking clients with leading positions in
1.2m small businesses and 100,000 corporate clients Europe
FRB A rich 138m inhabitants market
2,139 branches
7.6m clients
#1 in Europe
BRB
908 branches
3.6m clients
BGL #1 in France and Italy
40 branches
0.25m clients
BNL
890 branches Retail Banking networks and related business lines
#1 in Europe by revenues
2.5m clients Specialised businesses: PI, Leasing and Arval
A unique position to develop
the first Multi-Domestic European Bank
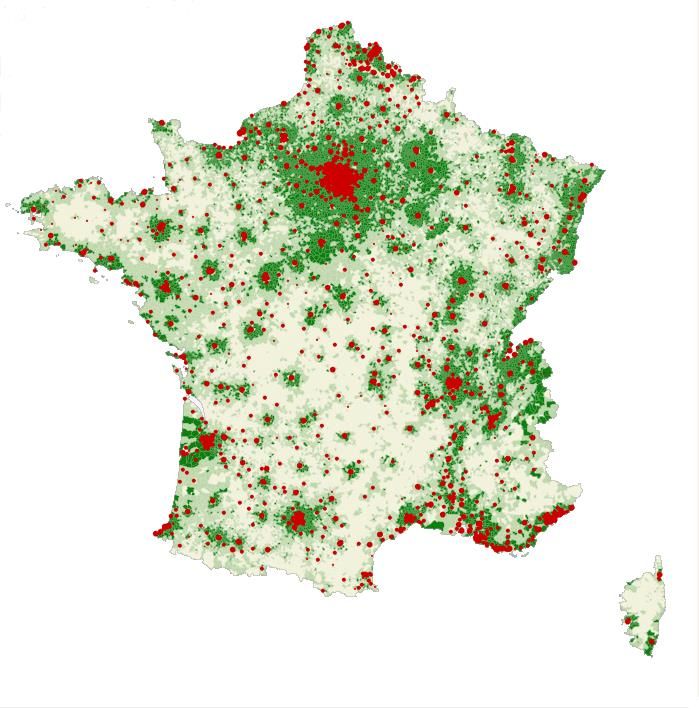
Asia Fixed Income Presentation – September 2014 56Focus on Domestic Markets (1/2)
Branch Networks Distribution
French RB
Branches
Average household income
< 25 000 €
25 000 € - 32 000 €
> 32 000 €
BNL bc Belgian RB
Average household income
< 12 000 €
12 000 € - 15 000 € Average household income
< 27 000 €
15 000 € - 17 000 €
27 000 € - 30 000 €
17 000 € - 20 000 €
> 30 000 €
> 20 000 €
Mostly positioned in wealthier areas
Asia Fixed Income Presentation – September 2014 57Focus on Domestic Markets (2/2)
Key Drivers
Individual customers: anticipating new bank relationship Branch formats
changes
Develop digital innovations
EXPRESS CONSEIL PROJETS
Adapt the branch network with new formats
Corporates: leverage our European and global organisation ADVISORY FULL
(One Bank for Corporates, cash management,…)
Private Banking: continue to grow at a fast pace
OPEN BNL FULL
Leveraging on up-streaming potential and focusing on
entrepreneurs and corporates
BNL: continue adapting to the economic environment Cost/income ratio(1)
76%
Focusing the commercial approach to corporates on value 76% 75%
74% 73%
added segments (export companies, …), leading to significant 74%
71%
BRB
70% 70%
risk reduction 68%
69% BRB excl. bank
67% levies and taxes
66% 66% FRB
FRB: reinforce commercial drive by capitalising on areas of 66%
63%
66% 65% 65%
strength 60%
59% 56% 55%
58%
BNL
BRB: improve cost/income ratio thanks to the impact of the
2007 2008 2009 2010 2011 2012 2013
network reorganisation and managerial streamlining
Continuing to improve efficiency in all the networks
(1) Historical data, including 100% of Private banking, excluding PEL-CEL effect
Asia Fixed Income Presentation – September 2014 58One Bank for Corporates
A unique network for corporate clients
Domestic Networks
Corporate Banking Europe
61 International Retail Banking
55 # 116 Business centres 1
1
32 1 1
7 1 2 3 9
6
16 1 1 1
37 1 1
28 1
16 1
1
5
1 17
24
# Business centres
One Bank for Corporates: a network of 216 business centres, o/w 116 in Europe
A presence in 75 countries
Cash management: #1(1) position strengthened in Europe
A leading position with corporates in Europe
(1) Source: Greenwich
Asia Fixed Income Presentation – September 2014 59BNP Paribas: a Recognised Player in Asia Pacific
Benchmark vs. European peers in Asia(2)
An already sizeable footprint
APAC revenues
€bn
Total Group Revenues (FY 2013 in bn€)
Presence in 14 countries (12 full banking licences) CIB & IS (FY 2013)
BNP Paribas HSBC
More than 8,000 employees(1)
24 business centres ideally positioned to serve Deutsche bank
Asian clients’ needs in the region and globally Barclays
UBS
European and US clients in Asia
Stanchart
Crédit Suisse
Large CIB and Investment Solutions presence
Significant franchises in cash management, trade,
capital markets and diversified services to investors APAC Revenues in CIB & IS as % of FY 2013 Total Group Revenues
A strong and diversified client base
24 business centres
~2,000 corporate clients, ~700 MNCs(3)
Beijing
~700 investors and >5,000 private banking clients Seoul
Tianjin
Tokyo
Successful long-lasting partnerships New Delhi Shanghai
Kolkata
China: Bank of Nanjing, Haitong Securities Ahmedabad
Mumbai Hyderabad Guangzhou Taipei
Taichung
Pune Bangalore Bangkok Hong
Korea: Shinhan Financial Group Chennai Kong
Ho Chi
Kuala Lumpur Minh City
State Bank of India, Taiwan Cooperative Bank Singapore
Jakarta
One of the best positioned international banks Melbourne
Sydney
(1) Excluding partnerships; (2) Disclosed figures in companies reports 2013, Deutsche bank 2013 estimates based on 2012 breakdown; (3) Multinational Companies
Asia Fixed Income Presentation – September 2014 60Roadmap for BNP Paribas in Asia Pacific
Growth targets adapted to each country
Continue to reinforce our footprint
Better anchored in Asian economies, enlarging
our Asian customers client base
Serve more the subsidiaries of our MNC clients Beijing
Tokyo
Seoul
Develop relations with investors and asset owners in
Asia and sell Asian markets in the rest of the world Shanghai
Taipei
Leverage partnerships to access retail customers
Mumbai Hong-Kong
Targeted approach Bangkok Manila
Ho Chi Minh City
Specific focus: local corporates with international Kuala Lumpur
needs, financial institutions and wealthy individuals Singapore
Jakarta
Specific focus on China, India and Indonesia
on top of our current hubs (HK, Singapore)
Growth in most business units
Cross-selling at the heart of the plan Targeted growth
Between CIB and Investment Solutions and within Regional hub
different Group businesses Sydney
Auckland
Strengthening platforms to build future development
Asia Fixed Income Presentation – September 2014 61APAC plan: Where do we stand in December 2013?
Generate over €1bn additional revenues by 2016(1) CIB & IS revenues
+24.4% in 2013, with strong growth in all CIB and €bn
key achievements for Investment Solutions +24.4%
Strengthen the workforce (~+1,300 staff in 3 years)
~+400 net increase of FTEs in 2013
Grow financed assets (>50% in four years) 2012 2013 2016
with parallel increase in deposits gathering
Strong growth of both commercial assets and deposits Commercial assets and deposits(2)
thanks to a complementary mix of businesses
€bn
+19%
+24%
Development of new partnerships in 2013
China: Bank of Nanjing (consumer finance and leasing),
Bank of Beijing (insurance) and Geely (car financing)
Insurance: several partnerships signed in Korea and in
Vietnam
2012 2013 2012 2013
Assets Deposits
A strong first year in the execution of the plan
(1) Vs. 2012; (2) Corporates, Wealth Management and Securities Services (excluding wholesale deposits)
Asia Fixed Income Presentation – September 2014 62Selectively Reinforcing our Footprint
Enlarge our footprint in Asian economies 2013 CIB client revenues
Leverage and deepen the existing strong franchises Local corporates: 42%
with large Asian corporates Local financial
institutions: 39%
Pearl River Delta initiative in China, aiming at
export-based Guangdong corporates
Launching a local corporate banking effort in specific
areas in India (Mumbai, Delhi), backed by stable deposits
Launch of a dedicated initiative in Indonesia to increase
business with local corporate clients Non-Asian clients: 19%
Roll out One Bank for Corporates in Asia India initiative
350 new clients on-boarded in 2013 Rebased
+89% +110%
A team of more than 50 professionals in main locations,
dedicated to MNCs
Regional account managers to support clients which have
a regional structure (e.g. regional treasury centre)
Focus on corporate banking needs (cash management,
trade, flow hedging solutions) 2012 2013 2012 2013
Assets Deposits
Asia Fixed Income Presentation – September 2014 63You can also read