Investor Presentation Munich - Dr Immo Querner, CFO 23/24 September 2019
←
→
Page content transcription
If your browser does not render page correctly, please read the page content below
Investor Presentation
Munich
Dr Immo Querner, CFO
23/24 September 2019

Agenda

       I    CMD: Group Strategy

      II CMD: Group Financials

      III 6M 2019 results

2   Investor Presentation Munich, Dr Immo Querner, 23/24 September 2019
I   CMD: Group Strategy   II   III

    Key messages

           We strengthen: entrepreneurial culture, B2B focus and portfolio diversification

           We develop: enhanced capital management, focused divisional strategies and digital transformation

           We commit to …

                       an increased RoE of ≥ 800bps above risk-free

                      annual EPS growth ≥ 5% on average

                       35% to 45% payout of IFRS earnings with DPS at least stable y/y

    Note: Targets are relevant as of FY2019. EPS growth CAGR until 2022 (base level: original Group net income Outlook of ~EUR 850m for 2018). The risk-free rate is defined as the 5-year rolling average of the 10-year German
    Bund yield. Targets are subject to large losses staying within their respective annual large-loss budgets as well as no major turmoil on currency and/or capital markets

3   Investor Presentation Munich, Dr Immo Querner, 23/24 September 2019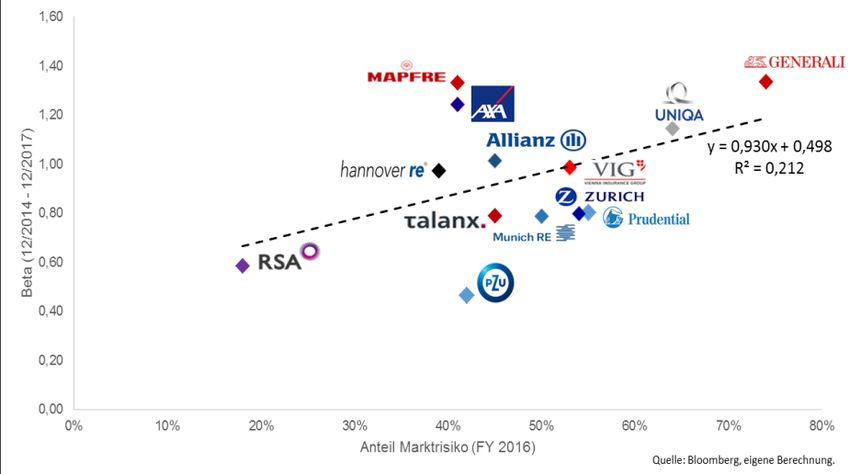
I   CMD: Group Strategy   II   III

    Strengthen and develop – Turning our roots into a foundation for future success

                                   Strengthen                                          Develop

              1       Entrepreneurial culture                             1   Enhanced capital management

              2       B2B focus                                           2   Focused divisional strategies

               3      Diversified portfolio                               3   Digital transformation

                            Traditionally different

4   Investor Presentation Munich, Dr Immo Querner, 23/24 September 2019
I CMD: Group Strategy II III
Strengthen
We approach the VUCA world from a position of strength
Volatility Uncertainty Complexity Ambiguity Our answer: reinforcing our strengths
War for Wave of
talent consolidation
Low-interest 1 Entrepreneurial culture
rate Digital
environment platforms
Autonomous Hybrid
driving customers
VUCA 2 B2B focus
Alternative
capital Consumer
Consumer behaviour
protection
Long soft
3 Diversified portfolio
cycles Disruption by
Regulation start-ups
5 Investor Presentation Munich, Dr Immo Querner, 23/24 September 2019I CMD: Group Strategy II III
1 Strengthen – Entrepreneurial culture
Our entrepreneurial culture as basis for continued growth and cost leadership
Decentralised
business structure Innovation
power
Clear responsibilities – International
with transparency best-practice sharing and
and consequence digital mindset
Entrepreneurial
culture
Cost leadership Strong profitable
growth > 6x higher
In 3½ out of 4 divisions business growth than
(compared to peers) peers
Note: Business growth defined as GWP CAGR for 2013-2017. Talanx Peer group consists of Allianz, AXA, Generali, Mapfre, Munich Re, Swiss Re, VIG and Zurich (throughout this document if not stated
differently)
6 Investor Presentation Munich, Dr Immo Querner, 23/24 September 2019I CMD: Group Strategy II III
1 Strengthen – Entrepreneurial culture
Entrepreneurial culture – Basis for cost leadership and profitable growth …
Cost leadership in 3½ out of 4 divisions > 6x higher business growth than peers
Cost ratio advantage (net) of divisions compared to GWP CAGR 2013 – 17 (in %)
peer Ø (2013 – 17) (in %-pt)
Industrial Retail Retail
Lines
Reinsurance
International Germany
Talanx Best Peer Ø Peers
x
4.1
Bancassurance
6.0
3.3 2.3
2.6
0.8
Peer Ø
0.6
-1.4
HDI P/C
HDI Life
Note: Retail International vs. largest peers in core markets (GWP-weighted on
2013-17 average). Bancassurance: cost advantage vs. median of European
insurances in McKinsey cost benchmarking with >60% banking distribution
channel
Source: S&P Global Ratings, Global Reinsurance Highlights, MPSS database,
McKinsey; own analysis
-8.6 Note: Peer average GWP-weighted. Own calculations based on Annual Reports
7 Investor Presentation Munich, Dr Immo Querner, 23/24 September 2019I CMD: Group Strategy II III
1 Strengthen – Entrepreneurial culture
… leading to #7 market position in Europe
115 years of successful HDI/Talanx history Talanx ranked at #7 in Top 10 European insurers
GWP 2018, in EURbn
2018
EUR 35bn GWP #1 96.3
1903 #2 77.8
1997
Establishment HDI
as Haftpflichtverband EUR 6bn GWP #3 66.7
der deutschen Eisen-
und Stahlindustrie #4 53.2
#5 49.1
#6 46.0
1966 2012 #7 34.9
Establishment Talanx IPO
Hannover Re #8 32.4
#9 32.3
#10 31.8
Note: Prudential data based on earned GWP
8 Investor Presentation Munich, Dr Immo Querner, 23/24 September 2019I CMD: Group Strategy II III
2 Strengthen – B2B focus
Our unique B2B customer focus positions us well
Industrial clients Mid-market
Leading partner of Leading provider in
90% of DAX members Germany
B2B Focus –
>80% of GWP
in B2B business
Bancassurance Reinsurance Leading reinsurer
Leading position in
Germany and selected #4 player by size -
CEE (Poland, Hungary) #1 by RoE among main
~5.000 insurance clients
competitors
9 Investor Presentation Munich, Dr Immo Querner, 23/24 September 2019I CMD: Group Strategy II III
3 Strengthen – Diversified portfolio
Our diversified portfolio as basis for proven earnings resilience
Germany Emerging
Strong international High share of markets
footprint growth markets
26%
33%
74% 67%
Mature
International international markets
Diversified
portfolio
Primary Insurance Life
Non-Life Primary Insurance
Retail
Germany 18%
Balanced Favourable 11%
capital-efficient
Non-capital-
business mix product mix 8% efficient
16% 53% 60% 21%
Retail 13% Life
International
Reinsurance
Reinsurance
Industrial Lines
Note: All figures refer to GWP 2017 of Talanx Group; growth market split refers to international portfolio only
10 Investor Presentation Munich, Dr Immo Querner, 23/24 September 2019I CMD: Group Strategy II III
Strengthen
Outcome – Proven earnings resilience backing our sustainable payout policy
Sustainable earnings and payout policy Dividend yield
Talanx IFRS net income and dividend (per share)
903 4.3%
769
732 734 703
672
626 CAGR DPS
1.45
1.40 2012-18
1.35 5.5% p.a.
1.30
1.25
1.20
1.05
2012 2013 2014 2015 2016 2017 2018
Talanx Group net income (in EURm) Dividend per share (EUR)
Dividend yield on
2018 average share price
Note: Net income of Talanx after minorities, after tax based on restated figures as shown in annual reports
2012–2018; all numbers according to IFRS
11 Investor Presentation Munich, Dr Immo Querner, 23/24 September 2019I CMD: Group Strategy II III
Strengthen
Outcome – In the past, Talanx with strong track record and favourable risk-return profile…
RoE above peer average Favourable risk-return profile
Ø return on Average Return on Equity compared to peers (2001-2017)
Ø RoE Adj. Ø RoE
tangible assets
Ø Peers
+0.5%pt 14
High RoE
13 Low Volatility
+0.6%pt 13.8% 13.3%
+0.7%pt 12
11
Average RoE in %
10.9% 10.3% Talanx
9.6% 10
8.9%
9 Ø Peers
8
7
6 Low RoE
High Volatility
50
12 10 8 6 4 2 0
Talanx Ø Peers Talanx Ø Peers Talanx Ø Peers Average standard deviation RoE in %
Note: All figures 2012-2017.
Adj. average RoE: own calculation based on the ratio of net income (excl. minorities) and average shareholders’
equity excluding average unrealised gains & losses based on available peer data. Average return on tangible asset:
own calculation based on the ratio of net income (excl. minorities) and average shareholder’s equity excluding
average goodwill and average other intangible assets Note: Own calculations. RoE based on the ratio of net income (excl. minorities) and average
Peer group: Allianz, Munich Re, AXA, Zürich, Generali, Mapfre, VIG, Swiss Re shareholders’ equity
Source: Financial reports of peers, FactSet and own calculations Source: RoE 2001-2010 KPMG; 2011-2017 annual reports
12 Investor Presentation Munich, Dr Immo Querner, 23/24 September 2019I CMD: Group Strategy II III
Develop
…however, cautious valuation of Talanx ex Hannover Re
Market cap development
EURbn
10
Talanx Hannover Re (Talanx stake)
9
8
7
6
5 P/E ratio P/B ratio
4
3 Ø Peers 10.4 1.1
01/10/2012 01/10/2013 01/10/2014 01/10/2015 01/10/2016 01/10/2017 01/10/2018
Valuation
Implicit market cap Talanx ex Hannover Re stake multiples Talanx 10.1 0.9
EURbn Talanx ex
1.8 0.1
4
Talanx ex Hannover Re (implicit value)
Hannover Re
3
2
1
0.6
0
01/10/2012 01/10/2013 01/10/2014 01/10/2015 01/10/2016 01/10/2017 01/10/2018
Note: Multiples as of 9 September 2019 and based on sell-side estimates as collected by Talanx. The P/E ratio refers to the 2019E median for EPS, the P/B ratio refers to the 2019E shareholders’ equity
13 Investor Presentation Munich, Dr Immo Querner, 23/24 September 2019I CMD: Group Strategy II III
Develop
Talanx’s ambition – Three areas to develop
Strengthen Develop
1 Entrepreneurial culture 1 Enhanced capital management
2 B2B focus 2 Focused divisional strategies
3 Diversified portfolio 3 Digital transformation
Traditionally different
14 Investor Presentation Munich, Dr Immo Querner, 23/24 September 2019I CMD: Group Strategy II III
Develop
Talanx’s ambition 2022
Group
1 Enhanced capital management
2 Focused divisional strategies
Industrial Lines Retail International Retail Germany Reinsurance
Clean-up Fire and Delivery on KuRS targets
Top 5 in core markets Reinsurance focus
growth in Specialty and growth in SME
3 Digital transformation
15 Investor Presentation Munich, Dr Immo Querner, 23/24 September 2019I CMD: Group Strategy II III
1 Develop – Enhanced capital management
Our Capital Management Strategy
Enhanced Capital Management Mid-term ambition
Attractive dividend
Sustainable dividend growth 1 payout ratio with DPS 35-45%
Stringent capital allocation to y/y at least stable
How to spend it
support profitable organic growth
Disciplined M&A approach 2 Stringent capital manager RoE ≥ CoE
Upstream of
Reduce local excess capital 3 ~350m
excess capital
Increase cash upstream
How to get it
Bundling reinsurance at Group
level 4 Increase remittance ratio 50-60%
Note: Target dividend coverage ratio (available cash fund divided by target dividend level)
is ~1.5-2 times actual dividend
16 Investor Presentation Munich, Dr Immo Querner, 23/24 September 2019I CMD: Group Strategy II III
1 Develop – Enhanced capital management
How to spend it – Allocate capital to support profitable organic growth
Return on Equity / GWP
14 Retail International
12
+19%
GWP CAGR 2012–2017, EURbn
10
Reinsurance
8 Consequent and efficient capital
Industrial Lines allocation in high RoE business…
6
+43%
4
+21%
2
… supports strong and profitable
0 growth
0 2 4 6 8 10 12 14 16 18
-2 -6%
-4
Retail Germany
-6
Average Return on Equity (2012-2017, %)
Note: Bubble size: attributed equity capital 2017 in m EUR; figures in bubbles refer to change in attributed equity
excl. minorities (2017 vs. 2012)
17 Investor Presentation Munich, Dr Immo Querner, 23/24 September 2019I CMD: Group Strategy II III
1 Develop – Enhanced capital management
How to spend it – Disciplined M&A approach
Our M&A criteria Disciplined M&A activity (since 2011)
Focus on non-life 250
214 Targets screened
Non-binding bids
Group RoE-enhancing 75
submitted
Binding bids
26
submitted
EPS-accretive
Transactions
14
concluded
Note: “EPS-accretive” refers to an increase of Talanx’s earnings per share
18 Investor Presentation Munich, Dr Immo Querner, 23/24 September 2019I CMD: Group Strategy II III
1 Develop – Enhanced capital management
How to get it – Reduce local excess capital and increase cash upstream
Reduce local excess capital Increase cash upstream to Talanx Group
Solvency ratio (%) Illustrative Ø 5-yr remittance ratio (2013-17)
IFRS Group net income Remittance from affiliated companies
~EUR 350m
100% 100%
upstream potential
identified
New target level
over the cycle
Local ~50-60%
Target
Level 43%
Sub 1 Sub 2 Sub 3 Sub 4 Sub … Ø 5-yr 2013-17 Target level
19 Investor Presentation Munich, Dr Immo Querner, 23/24 September 2019I CMD: Group Strategy II III
1 Develop – Enhanced capital management
How to get it – Bundling reinsurance at Group level to leverage diversification
Bundling reinsurance at Group level
Illustrative
Reinsurance market
Retrocession
+EUR 50m net income
Holding Impact
steady state p.a
(Reinsurance licence)
Industrial Retail Retail
Lines Germany International
20 Investor Presentation Munich, Dr Immo Querner, 23/24 September 2019I CMD: Group Strategy II III
2 Develop – Focused divisional strategies
Industrial Lines
Stock take Focus and mid-term ambition
Bring CoR in Fire to well
Customer focus and claims
below 100% until 2020
management
Leading (“20/20/20”)
International Programmes
Focus Continue profitable foreign
Cost leadership growth
Growth initiative in Specialty
Drive digital transformation
Profitability in Fire business –
Balanced Book not sufficient
Lagging
Untapped growth potential in RoE Ambition 8-10%
foreign markets and in Specialty
21 Investor Presentation Munich, Dr Immo Querner, 23/24 September 2019I CMD: Group Strategy II III
2 Develop – Focused divisional strategies
Retail International
Stock take Focus and mid-term ambition
Entrepreneurial culture and digital Focus on top 5 positions in
leadership 5 core markets
Leading
Strong track record in M&A Disciplined organic and
Focus
Cost leadership inorganic growth with focus
on profitability
Leveraging digital leadership
Top 5 position not yet achieved in
all core markets
Lagging
Dependency on Poland, Brazil and RoE ambition 10-11%
Italy results
22 Investor Presentation Munich, Dr Immo Querner, 23/24 September 2019I CMD: Group Strategy II III
2 Develop – Focused divisional strategies
Retail Germany
Stock take Focus and mid-term ambition
Leading player in Bancassurance
Experienced employee benefits Delivery on KuRS targets
Leading until 2021
player
Focus
Strong B2B position for P/C SME Growth initiative in SME
Drive digital transformation
Cost level
Lagging (HDI P/C and Life)
RoE ambition 7-8%
Legacy IT systems
23 Investor Presentation Munich, Dr Immo Querner, 23/24 September 2019I CMD: Group Strategy II III
2 Develop – Focused divisional strategies
Reinsurance
Stock take Focus and mid-term ambition
Cost leadership Focus on reinsurance
Top profitability Maintain competitive (cost)
Leading
Consistent underwriting approach advantage
Focus
Efficient tailor-made solutions Solution-oriented innovative
reinsurer
Drive digital transformation
Profitability of US mortality
Lagging
business ≥ 10%
RoE ambition
Note: RoE target of ≥900bps + risk-free
24 Investor Presentation Munich, Dr Immo Querner, 23/24 September 2019I CMD: Group Strategy II III
3 Develop – Digital transformation
Digitalisation@Talanx – Clear focus to extend our digital value proposition
Our footprint Key success factors Our focussed approach
“Get bundled“ “Get skills”
Data as "new
Talanx focus
currency"
− Commercial services
− Artificial
(e.g. Cyber)
Prevention & services Intelligence
− Mobility
B2B beyond protection Eco- Data − Behavioural
(80%) systems analytics Economics
People &
Mindset
Data skills &
IT-system readiness IT systems
B2C “Get ready”
(20%)
“One-click journey” Legacy management
Digital and efficient processes
Note: Commercial services and mobility represent ~50% of insurer-relevant ecosystems (McKinsey)
25 Investor Presentation Munich, Dr Immo Querner, 23/24 September 2019I CMD: Group Strategy II III
3 Develop – Digital transformation
Digitalisation@Talanx – Divisions drive digitalisation as top management priority
Selected examples for digitalisation in divisions
“Get bundled“ Artificial Intelligence “Get skills”
Eco- Data
systems analytics
People &
Mindset Behavioral Economics
IT systems
HDI
Robotics “Get ready”
Further details in divisional presentations
26 Investor Presentation Munich, Dr Immo Querner, 23/24 September 2019I CMD: Group Strategy II III
3 Develop – Digital transformation
Digitalisation@Talanx – Group fosters digital mindset leveraging our entrepreneurial culture
International
best-practice sharing Selective partnerships and
Digital mindset
(Best Practice Lab) investments, e.g.
Established entrepreneurial culture
Simple divisional structure with clear responsibility and accountability
Relative performance counts
Pull culture with high degree of peer collaboration
27 Investor Presentation Munich, Dr Immo Querner, 23/24 September 2019I CMD: Group Strategy II III
Mid-term ambition – Raising the target level for Group profitability
Return on equity EPS growth Dividend payout ratio
35% - 45%
Targets
of IFRS earnings
≥ 800bp ≥ 5% Sustainable
High level of above risk-free rate Profitable on average p.a. DPS at least
& attractive
profitability growth stable y/y
payout
Constraints
Strong capitalisation Market risk limitation (low beta) High level of diversification
Market risk ≤ 50% of targeted 2/3 of Primary Insurance
Solvency II target ratio 150 - 200%
Solvency Capital Requirement premiums from outside Germany
Note: Targets are relevant as of FY2019. EPS CAGR until 2022 (base level: original Group net income Outlook of ~EUR 850m for 2018). The risk-free rate is defined as the 5-year rolling average of the 10-year German Bund yield.
Targets are subject to large losses staying within their respective annual large-loss budgets as well as no major turmoil on currency and/or capital markets
28 Investor Presentation Munich, Dr Immo Querner, 23/24 September 2019Agenda
I CMD: Group Strategy
II CMD: Group Financials
III 6M 2019 results
29 Investor Presentation Munich, Dr Immo Querner, 23/24 September 2019I II CMD: Group Financials III
1 Enhanced capital management
Our Capital Management Strategy
Enhanced Capital Management Mid-term ambition
Attractive dividend
Stringent capital allocation to 1 payout ratio with DPS 35-45%
support profitable organic growth y/y at least stable
How to spend it
Sustainable dividend growth
Disciplined M&A approach 2 Stringent capital manager RoE ≥ CoE
3 Upstream of
Reduce local excess capital excess capital
~350m
Increase cash upstream
How to get it
Bundling reinsurance at Group
level 4 Increase remittance ratio 50-60%
Note: Target dividend coverage ratio (available cash fund divided by target dividend level)
is ~1.5-2 times actual dividend
30 Investor Presentation Munich, Dr Immo Querner, 23/24 September 2019I II CMD: Group Financials III
1 Enhanced capital management
How to spend it – Stringent capital allocation to support profitable organic growth
Capital steering matrix & KPIs Beta drivers
IFRS net income
RoE =
IFRS Ø equity RoE hurdle rate Cost of Equity RoE(6M 2018) ≥ Minimum hurdle rate ≥ CoE
10.0% rfG+ 800 bps
According to market- 7.2%
≈ 8.8%
800bps above risk- risk exposure,
Group free according to ≥ reflected in Group Illustrative
Group strategy beta
β
CoE =
1.6
rf + β x ERP + frictional cost
1.4
Σ Divisions ≥ Group Σ Divisions ≥ Group 1.2
1
0.84
Depending on 0.8
divisional risk 0.6
Divisional exposure, reflected 0.4 100%
≥ via adjusted Group
90%
Divisions 80%
target RoE 0.2 70%
60%
Beta 0
50%
40%
10% 30%
20% 30% 20%
40% 50% 60% 70% 10%
CoE = 80% 90% 100%
rf + βadj. x ERP + frictional cost
Note: RoE based on IFRS 4. Cost of Equity benchmark 7.2% - 7.6% confirmed e.g by PWC (Cost of Equity Insurance Companies,
Germany 2018), AonBenfield ("The Aon Benfield Aggregate", 12/2016) and most recent Swiss Re Sigma (4/2018) Note: Calculation for FY 2018
31 Investor Presentation Munich, Dr Immo Querner, 23/24 September 2019I II CMD: Group Financials III
1 Enhanced capital management
Beta-blockers to prevent abnormal (“risk off”) heart rhythms/attacks
Prudent market risk Moderate leverage
53% Market risk share ≤ 50% Senior & subord. debt leverage: Continuously
Mean peers
Significantly below core = 24% moderate leverage
peers σ σ headroom Roughly in line with
45% Resulting in a peers, leverage
considerably low beta corridor gives
-3% +3%
additional headroom
Avg. Peers Talanx 6% 10% of EUR 1bn
12%
Leverage 11%
Market risk
position 12%
13%
share Significant leverage
leeway of EUR 4bn
(50/50 hybrid and
70% 66%
senior debt capacity)
Potential to support
capital optimisation at
divisional and/or
Avg. Peers Talanx
subsidiary level
Equity Subord.debt
Share market risk (FY 2016) Senior debt Pensions
Source: Bloomberg, own calculation Source: Company reports, own calculation, figures as of 30 June 2018
32 Investor Presentation Munich, Dr Immo Querner, 23/24 September 2019I II CMD: Group Financials III
1 Enhanced capital management
Ongoing trend of narrowing spreads supported by Talanx’s conservative low-beta profile
Credit spread development
Trading spread in bps between Talanx EUR 500m (2042) 30NC10 8.37% and peers
120
100 Low market risk reflected in
1 constantly declining spreads
(relative position)
80
Issuance of EUR 750m (2047)
30NC10 at 2.25%
60 (~+25bp spread vs. Allianz)
Efficient timing of capital management
2
actions
40
20
Narrowing spreads result in reduced
3
0 future funding and/or refinancing cost
-20
Note: Credit spreads are calculated as spreads over the 6M swap curve. Seniority: Lower Tier 2.
Equally weighted peer group consists of Allianz (2022, 5.625%), AXA (2023, 5.125%), Generali (2022, 10.125%), Munich Re
(2022, 6.25%) and Zurich (2023, 4.25%)
33 Investor Presentation Munich, Dr Immo Querner, 23/24 September 2019I II CMD: Group Financials III
1 Enhanced capital management
How to spend it – Aspirational steering with RoE ambition ≥ CoE
Consistent and
Cost of Equity calculation more ambitious target setting
Risk-free Group beta Adjustment Market-risk Frictional CMD 2017
(FX exposure + 5yrsØ x factor x premium + cost = CoE ambition
Ambition Comments
weighted)
750bp + ≥ 800bp + Talanx ≤ sum-of-the-parts
Group 1.9% 1.00 7.2% risk freeG risk freeG creating value!
0.9% 8-10% “20/20/20”,
Industrial Lines 1.07 ~6.5% 8% Speciality etc.
“Tapering” guarantee burden;
Retail Germany 0.8% 0.84 2.48 4.0% 2.0% ~11% 6-7% 7-8% shifting Life to P/C; more capital-
efficient and biometric business
3.8% 10-11% FX mix & goodwill allocation;
Retail Intern. 1.26 ~10% 9% growth & capital management
1.2% ≥ 10% In line with Hannover Re’s
Reinsurance 0.66 ~5.5% n/a minimum RoE target
Note: The adjustment factor is determined by two factors: the capital adequacy ratio of the division relative to the Group and the divisional share of market risk relative to the Group. An equal position as the overall Group would
result in a figure of “1.00”. A higher share of capital market risks than the overall Group and lower divisional capital adequacy ratios than the overall Group would result in adjustment factors above 1. All numbers relate to a
Shareholder Net Asset (SNA) view. All calculations for FY 2018
34 Investor Presentation Munich, Dr Immo Querner, 23/24 September 2019I II CMD: Group Financials III
1 Enhanced capital management
How to get it – Increase cash upstream and reduce local excess capital
Ø Remittance ratio Mid-term capital upstream potential
New target ambition Excess capital after local constraints (in EURm):
over the cycle
~250 ~350
50-60%
Volatility +1/4 ~1x dividend
of cash
43%
contribution
p.a.
Strengthen
cash pool to
~100
support payout
ratio
2018– 17
Ø 2013 NewTotal
mid-term 2018 2019 – 2022 Total
ambition
Note: Local constraints reflect e.g. local supervisor, withholding tax
35 Investor Presentation Munich, Dr Immo Querner, 23/24 September 2019I II CMD: Group Financials III
1 Enhanced capital management
How to get it – Bundling reinsurance at Group level
New reinsurance structure Stringent implementation
Talanx AG will become exclusive reinsurer for all treaty
cessions in P/C segments. Talanx AG to act as the risk
Reinsurance market
carrier and pooling vehicle
Increased cash generation and liquidity flow at Group
Pass-through retro Group self-retention level
(mainly Industrial Lines) covers
Optionality for capital relief transactions
Talanx AG 15 September 2018 1 July 2019
Net EUR 300m - 400m BaFin application for Initial underwriting
Gross ~EUR 750m reinsurance licence LatAm business
Lender notification Enlargement of retro
coverage
By-laws
Industrial Retail Retail
1 January 2019 1 January 2020
Lines Germany International
Initial renewal of Talanx- 80% of target operating
Re-cell corporate portfolio model implemented
Cession “steady state”: Cession “steady state”: Cession “steady state”: (incl. retro structure)
EUR ~475m EUR ~20m EUR ~255m Full cession of 100%
business to Talanx AG
(incl. Industrial Lines)
36 Investor Presentation Munich, Dr Immo Querner, 23/24 September 2019I II CMD: Group Financials III
1 Enhanced capital management
How to get it – Bundling reinsurance at Group level
Key value driver/benefits Mid-term ambition
Technical Increased retention by gearing Talanx
Asset income Reduced future funding costs
profits AG’s idle solo funds and use of Group
diversification
Target solo SII-CAR of >300% acc. to
standard model and only marginal SCR
~ 1/5
~ 1/5
Group impact
Asset
income Enlarged assets under management
(AuM) and related income due to
increased Group retention +EUR 50m
+Δ AuM steady state EUR ~0.65bn net income
steady state p.a.
Rating
increase Credit rating improvement for Talanx AG ~ 3/5
expected (currently A- vs. A+ of operating
carriers) resulting in reduced future Technical profits
funding costs
Note: Initially very low marginal tax burden due to (potentially written-off) tax losses carried
forward, subject to normal loss frequency, unchanged reinsurance structures and no disruptions
on currency, capital or reinsurance markets
37 Investor Presentation Munich, Dr Immo Querner, 23/24 September 2019I II CMD: Group Financials III
2 Asset Management
Strong AM lines of defence and stringent sustainability strategy
Ensuring low beta & protection of shareholders’ equity ESG strategy and approach
Ampega Investments ESG
Central risk management of ~99% of Group’s assets Sustainability Strategy
Group-wide limit and threshold system, derived from TERM (Talanx
Enterprise Risk Model)
Human rights Environmental Anti-
I Credit Risk Metric II Market Risk Metric & labour protection corruption
standards Phasing-out of
Daily measuring & monitoring Weekly measuring and thermal coal
Reflecting credit quality, duration monitoring
and diversification Limits and thresholds for
Limits & thresholds for divisions divisions and single issuers
and single issuers
Responsible Investment Talanx’s investment
committee guidelines
Intro Pre-deal Post-deal SCR
of Murex MX.3: check: monitor: approximation
integrated front-to- limit compliance ongoing limit within TERM ESG screening conducted by
back solution for all trades compliance
Application filed for UN Principles
Basis for value-at-risk computation and limit controlling for Responsible Investment
38 Investor Presentation Munich, Dr Immo Querner, 23/24 September 2019I II CMD: Group Financials III
2 Asset Management
Investment strategy unchanged – portfolio continuously dominated by strongly
rated fixed-income securities
Investment portfolio Fixed income portfolio Credit VaR & Macaulay duration
as of 30 Jun 2019: EUR 118.7bn as of 30 Jun 2019: EUR 106.8bn
22% AAA 9.2
Currency Asset Breakdown Breakdown 1%
split allocation by type by rating
7% AA+
2% 3% 11.5
9%
1% 22%
24% 6% AA
4% 11.0
9% AA-
14% 6% 10.2
68%
29% 10% A+
6% 5.3
22%
90% 8% A
7% 5.8
9% A-
11% 5.9
46% 42%
21% BBB+
32% 44% 5.6
or lower
7% Not rated
19% 2.9
Euro Fixed income Government Bonds AAA
securities Market Value Average Macaulay
Non-Euro Corporate Bonds AA
Credit VaR duration (in years)
Equites Covered Bonds A
Other Other BBB & below
Note: Positions without external ratings (esp. funds and equity investments) shown as not rated.
Credit VaR metric particularly depends on maturity and specific loss default assumptions
39 Investor Presentation Munich, Dr Immo Querner, 23/24 September 2019I II CMD: Group Financials III
2 Asset Management
At the end of QE – (Corporate and sovereign) spread risks may be the top challenge
5% Exposure Risk provision
4.32% (in %) (in EURm)
4% 100% 80
3% 80%
CVaR by 60
share of 2%
issuers 60%
1% 40
40%
0% IFRS 9 No material defaults in
0% 20% 40% 60% 80% 100% 20
20% assets managed by
Expected Ampega Investments
credit loss
0% 0
6% model Stage 1 Stage 2 Stage 3 e.g. Steinhoff, Carillion
simulation & Toys“R”Us
5% Expected Expect. “Marked-
49% 1-year loss until to-model”
Other
loss maturity
4%
Corporate
default rate 3% Exposure 97% 3% 0%
& 10% Business
Services ∑
distribution 2% ECL loss
14% Retail
45m 67m 9m 121m
allowance
1%
Ø
ECL
27% Oil & Gas quota
5bp 2.27% 65.42% 0.12%
0%
2008 2010 2012 2014 2016 2018
40 Investor Presentation Munich, Dr Immo Querner, 23/24 September 2019I II CMD: Group Financials III
2 Asset Management
Infrastructure Investments – Investing while improving the overall risk profile
Building up our infrastructure portfolio…. …while de-risking the investment portfolio
in EUR bn
2.5 Commitments 3rd-party commitments Change in %pts
New commitments Exits / refinancings
2.0
AAA +2.5
1.5
~3 EUR bn
1.0
0.5 AA -0.4
0.0
-0.5 A -0.1
-1.0 Simultaneous decline
+125 - 175 bps premium in CVaR from 4.6% to
Yield over tenor/ratings
4% BBB- BBB- equivalent liquid BBB -1.3 4.3% of AuM
corporate bonds indices
2.9% BBB- BBB- BBB BBB-
3% AA
BBB
BBB- A+I II CMD: Group Financials III
2 Asset Management
Talanx Asset Management – Drive digitalisation as top management priority
Selected examples for digitalisation in Ampega investments
“Get bundled” Portfolio Management
“Get skills”
Digitalisation
Interactive
enables wealth and asset client reporting
managers to grow customer Eco- Data
base and AuM to increase systems analytics Strategic
efficiency, e.g.: allocation tool
People &
Mindset
Digital workflows
&
data transformation
IT systems
BI Real Estate System
State of the art integrated technical platform “Get ready”
42 Investor Presentation Munich, Dr Immo Querner, 23/24 September 2019I II CMD: Group Financials III
3 Excursion – Solvency II Update
Development of Group capitalisation
Solid capitalisation (Regulatory view) Limited stress impact
209%
in EURm
Target range
160 23 (22) (362)
388 77
SII Ratio
CAR SII 31.12.2018
31.12.2017
Solvency 8,647 8,724 8,724 8,724 8,522 8,523 Interest rate 1
8,259 8,259 Interest rate +50bps + 4%pts
Capital +50bps
Required Interest rate - 1
Interest rate -50bps - 7%pts
50bps
Credit spread 2 - 14%pts
Credit spread +50bps
+50bps
NatCat event
NatCat event - 3%pts
200%
Target 206% 207% 204% 203% 209%
186% Equity markets
range 171% Equity markets +30bps + 2%pts
+30%
150%
Equity markets - 2%pts
Equity markets -30bps
Solvency -30%
Capital
Ratio
2015 2016 2017 Q1 6M 9M FY
2018 2018 2018 2018 1 Interest rate stresses based on non-parallel shifts of the interest rate curve based on
Economic EIOPA approach
View 253% 264% 271% 275% 269% 270% 273% 2 The credit spreads are calculated as spreads over the swap curve (credit spread
(BOF CAR) stresses include simultaneous stress on government bonds)
Note: Regulatory view without transitional
43 Investor Presentation Munich, Dr Immo Querner, 23/24 September 2019I II CMD: Group Financials III
3 Excursion – Solvency II Update
Retail Germany Life: Robust capitalisation despite further decline in interest rates
Solvency ratios: Retail Germany Life
FY 2018 6M 2019
254% incl.
220% 452% 392% transitional
227%
202%
200%
Retail Germany Life CARs in 6M 2019
1
affected by decrease in interest rates
180% 177%
HDI
160%
171% 2 Capital position remains robust
140%
145%
120%
100%
Bancassurance Retail Germany Life
Note: Numbers show weighted average of single CARs; if not otherwise stated all figures are based on
regulatory view without transitional
44 Investor Presentation Munich, Dr Immo Querner, 23/24 September 2019I II CMD: Group Financials III
3 Excursion – Solvency II Update
Future model change may well result in 10%-point SII ratio improvement
Internal Model changes & outlook
Strong increase in SII ratio (+10%pts) due to
2017 2018E 2019E
1 successful model updates in 2017 with subsequent
phasing of positive impact
Own Own Own
SCR SCR SCR
Funds Funds Funds
OpRisk
(Hannover Re)
-2.7% +1%
Further reduction in market risk share by approx.
OpRisk 2 1%pt due to relative increase in SCR OpRisk
(Primary Group)
Asset correlation
coverage et al.
Pensions -1.2% 0%
Dynamic & static
volatility adj. (P/C) Expected impact from OpRisk improvements on SII
Counterparty
default
+9%-pts ~+1%-pts
RITA
+8%pts
Nucleus
Aggregate -3.9% 1%
2017 2019 2020-2021
Combined +10.5%pts
CAR impact Baseline: SCR = EUR 8.3bn; EOF = EUR 17.0bn
Note: Risk modelling planned to be changed to tail VAR approach
45 Investor Presentation Munich, Dr Immo Querner, 23/24 September 2019I II CMD: Group Financials III
3 Excursion – Solvency II Update
Preliminary results in line with 2017 home-specified stress test
SII ratio (HDI Group)
EIOPA stress scenarios w/o transitional incl. transitional
Basis: 206% Basis: 253%
Swap rates 10y EUR -80bp Preliminary! Subject to Groupwide calculation of three
1
Market Government bonds: -10-35bp final regulatory validation 1 combined stress scenarios on a
Corporate bonds & MBS -20 to -70bp
shocks Equities -16%
best effort basis
Yield curve
UFR 2.04% ~170%
down ~130
Insurance %
15% Longevity shock
shocks Stress results in line with 2017
Swap rates 10y EUR +80bp “home-specified” stress test
2 Market Government bonds: +110-190bp - European credit crisis (Italian euro
shocks Corporate bonds & MBS +190-325bp
2
exit): ~120%
Yield curve Equities -40%
- Global Pandemic: >150%
up ~120 ~170%
20% Lapse shock - Earthquake New Madrid (USA): ~140%
Insurance 2% claims inflation %
shocks 0.24% general inflation
3 In one of 17 years
Above regulatory required limit in
Simultaneous occurrence of: 3 yield curve stress scenarios
Four European windstorms
~240%
NatCat ~190% even without transitional
Two CEE floods
Two earthquake scenarios
(in Italy & Monaco)
Note: SII solvency ratios for all three stress scenarios without transitional
46 Investor Presentation Munich, Dr Immo Querner, 23/24 September 2019I II CMD: Group Financials III
3 Excursion – Solvency II Update
Preparing for IFRS 9 & 17 – Two steps forward, one step back: project on track
Top issues IFRS 9 &17 IFRS 9 IFRS 17
PAA default choice for primary non-life
Data management / Implementation
Murex MX.3 roll-out Dynamic specification and IT implementation
IT capabilities in various IT
German back-office implementing well
(source) systems
established accounting engine SAP IA
The “new normal”
Interaction between FVPL and Premium Determination of Solo entity RA target
Higher P&L
Allocation Approach (PAA) critical Risk Adjustment Inter-company-neutral consolidation of RAs
volatility
ECL driven acceleration (RA) Approach Disclosure of implicit Group confidence level
KPI overhaul
New controls to be implemented Reinsurance assets
New processes & Particular the net position of cedents
Intensive exchange between IFRS 17 and & related
interfaces Improvement by standard setter needed
IFRS 9 (joint impact assessments) mismatches
Comprehensive fast-close
Stochastic Reduced discretionary top-side adjustments
SII features can (partially) be re-used Handling reserving
calculations for life Reserving in interim reporting considering
Volatility adjuster/illiquid spread consistent buffer (non-life)
(incl. CSM) risk budgets remains unaffected
bottom-up interest rate curve
47 Investor Presentation Munich, Dr Immo Querner, 23/24 September 2019I II CMD: Group Financials III
3 Excursion – Solvency II Update
Advanced implementation
Clear IFRS 9 &17 programme roadmap New KPI framework considering IFRS 9 & 17 “go live”
Q1 2018 Q4 2018 Q4 2019
Programme Start IFRS 9/17: Group Hand-over to
IFRS 9 standards defined line organisation
Group
Return
1 on Equity
Q2 2017 Q2 2018 Q2 2019 Q2 2020 Payout Earnings
2 ratio 3 per share
Programme Start Final Draft of IFRS 1st combined 2nd combined
IFRS 17 17 guidelines IFRS9 / IFRS17 IFRS9 / IFRS17
Impact Impact
Assessment Assessment &
Divisions
1st live/dry run
Comprehensive
1 EBIT-margin 2 RoE
Hurdle of 96%
likely to be revised
Project fully on track and already passing from design to
1 implementation 3
Combined ratio
4
Retention
5
Combined ratio
(Non-Life) rate (Life)
Not in favour of any delay in the IFRS 17 application
Change
2 (e.g. due to late endorsement)…,but quick-fix of top 6 Growth of insurance revenues 7 of CSM 8 CSM of new business
(replacing GWP growth) (replacing new business margin)
flaws, such as outward reinsurance
Note: Comprehensive RoE = (Net income + ΔOCI + ΔCSM) / (Ø Equity + CSM)
48 Investor Presentation Munich, Dr Immo Querner, 23/24 September 2019I II CMD: Group Financials III
Summary
Key messages
Stringent and capitalistic performance management to support profitable organic growth
Initiatives to stream up EUR 350m of local excess capital and to increase the remittance ratio
Bundling reinsurance at Group level providing an upside of roughly EUR 50m in net income in
the steady state
Clear commitment to maintain the defensive low-beta investment profile
Considerate use of model changes suggests mid-term SII-upside
49 Investor Presentation Munich, Dr Immo Querner, 23/24 September 2019Agenda
I CMD: Group Strategy
II CMD: Group Financials
III 6M 2019 results
50 Investor Presentation Munich, Dr Immo Querner, 23/24 September 2019I II III 6M 2019 results
Good 6M 2019 results
Strong GWP growth of 11.2% y/y (curr.-adj. +10.1%) – all segments contributing
Both retail divisions drive EBIT improvement – Positive one-off in L/H Reinsurance
“20/20/20” above original target – Industrial Lines 2019 CR outlook of ~100% unchanged
6M 2019 Group net income of EUR 477m (+9.4% y/y) – Group RoE at 10.4%
FY 2019 Group net income outlook raised to “more than EUR 900m”
51 Investor Presentation Munich, Dr Immo Querner, 23/24 September 2019I II III 6M 2019 results
6M 2019 results – Key financials
Further profitable growth
EURm 6M 2019 6M 2018 Delta Comments
Gross written premiums (GWP) 20,864 18,760 +11% Strong growth momentum continues. GWP +10% curr.-adj.
Net premiums earned 15,917 14,435 +10%
Net underwriting result (708) (748) +5%
t/o P/C 226 272 (17%)
t/o Life (934) (1,021) +9%
Net investment income 1,986 2,007 (1%) Decrease of extraordinary investment result (ZZR-driven)
Other income / expenses (34) (47) +28%
Both retail divisions continue to drive EBIT increase.
Operating result (EBIT) 1,244 1,212 +3%
EUR 100m capital gain from Viridium in L/H Reinsurance
Financing interests (94) (84) (12%)
Taxes on income (293) (357) +18%
Net income before minorities 858 771 +11%
Non-controlling interests (380) (334) (14%)
EBIT improvement and lower tax ratio result in 9% bottom-
Net income after minorities 477 437 +9%
line increase
Combined ratio 97.5% 96.7% +0.8%pts
Tax ratio 25.4% 31.6% (6.2%)pts
Return on equity 10.4% 10.0% +0.4%pts Well above the (800 bps + risk-free rate) minimum target
Return on investment 3.3% 3.5% (0.2%)pts
Note: The minimum RoE target (of 800 bps + 5-year average of 10-year Bund yields) is expected to be
8.3% for FY 2019
52 Investor Presentation Munich, Dr Immo Querner, 23/24 September 2019I II III 6M 2019 results
Large loss budget underutilised, primary business with slight overshoot
Net losses Talanx Group Retail ∑ Primary
in EURm, 6M 2019 (6M 2018)
Industrial Lines Retail Germany
International Insurance
+ Reinsurance = Talanx Group
Flood Santo Andre, Brazil [Mar.] 31.5 0.5 32.0 32.0
Storm Eberhard, Central Europe [Mar.] 4.7 7.4 2.7 14.8 16.6 31.4
Flood Queensland, Australia [Jan.-Feb.] 4.4 4.4 25.9 30.3
Hailstorm Jörn, Central Europe [Jun.] 7.5 12.8 20.3 20.3
Flood “Middle West”, USA [Mar.-Apr.] 13.0 13.0 13.0
Earthquake Chile, South America [Jan.] 0.6 0.6 10.5 11.1
Sum NatCat 61.1 (24.0) 20.2 (11.9) 3.8 (0.1) 85.1 (40.4) 53.0 (42.4) 138.1 (82.8)
Fire/Property 70.2 70.2 55.9 126.2
Aviation 1.9 1.9 24.7 26.6
Marine 10.0 10.0 6.8 16.8
Sum other large losses 82.1 (107.2) 0.0 (0.0) 0.0 (0.0) 82.1 (107.2) 87.5 (50.9) 169.6 (158.1)
Total large losses 143.2 (131.2) 20.2 (11.9) 3.8 (0.1) 167.2 (147.7) 140.6 (93.3) 307.8 (241.0)
Pro-rata large loss budget 138.8 12.0 4.0 157.3 369.5 526.8
FY large loss budget 277.6 24.0 8.0 314.6 875.0 1,189.6
Impact on CR: materialised large losses 10.5%pts (10.6%pts) 2.8%pts (1.7%pts) 0.2%pts (0.0%pts) 4.4%pts (4.1%pts) 2.4%pts (1.8%pts) 3.2%pts (2.8%pts)
Impact on CR: large loss budget 10.2%pts (10.5%pts) 1.7%pts (1.7%pts) 0.2%pts (0.2%pts) 4.1%pts (4.2%pts) 6.2%pts (6.8%pts) 5.4%pts (5.7%pts)
Note: Definition "large loss": in excess of EUR 10m gross in either Primary Insurance or Reinsurance. No additional 6M 2019 Primary Insurance large losses (net) in Corporate Operations
53 Investor Presentation Munich, Dr Immo Querner, 23/24 September 2019I II III 6M 2019 results
Combined Ratios
Talanx Group Industrial Lines Retail Germany P/C Retail International Reinsurance P/C
2019 2018 2019 2018 2019 2018 2019 2018 2019 2018
6M 97.5% 96.7% 102.3% 102.3% 98.7% 99.0% 95.2% 94.6% 96.7% 95.7%
Q2 98.1% 96.5% 101.9% 102.3% 98.1% 98.9% 95.6% 94.2% 97.6% 95.5%
ex KuRS
investments: 96.3%
(6M 2018: 96.7%) Poland
2019 2018
Mexico 6M 91.7% 94.8%
TUiR Warta
Q2 92.8% 94.8%
2019 2018
6M 91.9% 86.6%
6M 97.1% 94.6% TU Europa
Q2 92.7% 84.6%
Q2 97.3% 95.2%
Brazil
Chile Italy Turkey
2019 2018
2019 2018 2019 2018 2019 2018
6M 97.1% 96.8%
6M 98.1% 94.8% 6M 90.0% 89.9% 6M 108.5% 103.9%
Q2 96.9% 95.2%
Q2 99.4% 99.4% Q2 88.5% 87.0% Q2 107.7% 104.9%
Note: Visual highlights only core markets plus Italy for Retail International. Turkey 6M 2019 EBIT of EUR 4m (+264% y/y)
54 Investor Presentation Munich, Dr Immo Querner, 23/24 September 2019I II III 6M 2019 results
6M 2019 – Both retail divisions and Viridium effect drive EBIT improvement
EBIT
(12%) +43% +6% +3% +3%
growth
27
9
37 Consolidation
in EURm
Corp. Op.
(30)
(9)
Non-recurrence of
positive consolidation
effects from 6M 2018
Conservative reserve
1,212 build-up for Talanx AG’s 1,244
captive reinsurance
activities
30 Jun 2018 Industrial Lines Retail Germany Retail Reinsurance Corporate 30 Jun 2019
reported International Operations incl. reported
Consolidation
Note: Numbers may not add up due to rounding.
55 Investor Presentation Munich, Dr Immo Querner, 23/24 September 2019I II III 6M 2019 results
Segments – Industrial Lines
EURm, IFRS 2019 2018
Gross written premiums (GWP) Operating result (EBIT) Net income
+20% (12%) (22%)
3,483 +40% 78 +24%
2,898 69 53 (15%)
42
1,187 849 33 27 19 22
6M Q2 6M Q2 6M Q2
Retention rate in % Combined ratio in % RoE in %
52.6 58.9 45.8 55.5 102.3 102.3 101.9 102.3 3.4 4.6 3.0 3.9
6M Q2 6M Q2 6M Q2
6M 2019 GWP up 20.2% (currency-adj.: +18.7%); Large losses of EUR 143m after 6M 2019, slightly 6M 2019 tax ratio of 31.5% higher than in 6M 2018
adjusted for Specialty transfer effect (EUR 457m in above budget (EUR 139m) and prior-year level of (27.8%) due to smaller EBIT contribution from
6M 2019 and EUR 246m in Q2 2019, both before EUR 131m. Positive run-off result in 6M 2019 of lower tax operations. BEAT tax impact slightly
growth), GWP was up 4.4% in 6M 2019, and up EUR 32m, thereof EUR 26m in Q2 2019 (6M 2018: higher
10.9% in Q2 2019 y/y EUR 43m; Q2 2018: Eur 73m)
‟20/20/20” improvements written already ahead of
Increase in NPE smaller (+10.7%) given the initially Q2 combined ratio of 101.9% includes 0.8%pt for year-end target. Ambition level raised to come back
high cession of Specialty business to Hannover Re above-budgeted large losses to profitability
As a consequence, divisional self-retention of Combined ratio of Fire business was 109% in Divisional CR targets of ~100% in 2019 and below
52.6% down vs. 6M 2018 (58.9%); also some 6M 2019, materially down from ~120% in 6M 2018 100% in 2020 unchanged
dampening effect from reinstatement premiums and ~140% in FY 2018
paid in Q1 2019 From Jan 2019, other result includes recognition of
administrative costs for Specialty business formerly
booked in Reinsurance (EUR 10m in 6M 2019)
56 Investor Presentation Munich, Dr Immo Querner, 23/24 September 2019I II III 6M 2019 results
“20/20/20” initiative ahead of plan
“20/20/20” initiative update
Cumulative monthly price increase in Fire on renewed business: Improvements written already ahead
contracted vs. target from 1 Jan 2018 to 1 August 2019
of year-end target
20.7% Ambition level raised to come back to
18.9% 20.0% profitability
17.0%
Ahead of plan
Claims experience in Fire market
requires higher percentage increase
Impact on gross premium base so far
~EUR 110m , or -12% of Fire business
(net effect)1
Price increases from March 2019 level
(17.0%) to August 2019 (18.9%) will
Jan Feb Mrz Apr Mai Jun Jul Aug Sep Okt Nov Dez Jan Feb Mrz Apr Mai Jun Jul Aug Sep Okt Nov Dez Jan
18 18 18 18 18 18 18 18 18 18 18 18 19 19 19 19 19 19 19 19 19 19 19 19 20
further improve CR of Fire in H2 2019
20% Target Price increase as of current month Price increase written but not yet effective
Note: Premium base defined as total premiums on 28 Feb 2019 minus dropped business. Price increase data include both premium increases and premium-equivalent measures.
1 Excluding effects of new business, de-risking (reduction of consortial shares), changes on existing business (mostly changes of sums insured) and currencies.
57 Investor Presentation Munich, Dr Immo Querner, 23/24 September 2019I II III 6M 2019 results
Segments - Retail Germany Division
EURm, IFRS 2019 2018
Gross written premiums (GWP) Operating result (EBIT) Net income
+2% +43% +46%
3,327 3,262 125 72 +36%
+4% +30% 50
88 37
1,442 1,394 65 50 28
6M Q2 6M Q2 6M Q2
Retention rate in % EBIT margin in % RoE in %
94.2 93.7 93.9 93.6 5.2 3.7 5.2 4.1 5.8 4.0 5.8 4.4
6M Q2 6M Q2 6M Q2
Gross and net premiums growth in Q2 and 6M Significant EBIT growth in both P/C (+16.4% y/y in Tax rate down slightly to 36.5% for 6M 2019 from
2019 y/y in both P/C and Life businesses Q2 2019, +37.4% in 6M 2019) and Life (+40.2% in 37.8% in 6M 2018. Higher than normalised level
Q2 2019 and +46.8% in 6M 2019) due to higher tax rate on investment results from
GWP in P/C up 7.6% y/y in Q2 2019,
consolidated alternative assets
up 2.0% in 6M 2019 Total KuRS costs of EUR 23m in 6M 2019 (24m in
6M 2018) with P/C EBIT impact of EUR 19m EBIT increase reflects two accounting-driven one-
Net premiums earned up 4.4% in Q2 2019 y/y,
(EUR 18m) offs of net positive EUR 9m in Life business in
up 2.9% in 6M 2019
Q2 2019
Well on track to deliver at least EUR 240m EBIT in
2021 as targeted, despite growing investments into
various digital initiatives
58 Investor Presentation Munich, Dr Immo Querner, 23/24 September 2019I II III 6M 2019 results
Segments - Retail Germany P/C
EURm, IFRS 2019 2018
Gross written premiums (GWP) Net investment income Operating result (EBIT)
+2% +23% +37%
1,042 1,022 55 54
44 +10% 40 +16%
+8%
26 23 25 22
260 242
6M Q2 6M Q2 6M Q2
Retention rate in % Combined ratio in % EBIT margin in %
95.0 94.3 93.9 93.8 98.7 99.0 98.1 98.9 7.4 5.6 6.6 6.0
6M Q2 6M Q2 6M Q2
6M and Q2 2019 GWP increase driven by business Combined ratio impacted by KuRS costs of EBIT impact of KuRS costs with EUR 19m in
with SMEs (Fire, MultiRisk) and self-employed EUR 18m in 6M 2019 (16m in 6M 2018). Adjusting 6M 2019 largely unchanged vs. 6M 2018 (18m)
professionals for these, combined ratio decreased to 96.3%
(6M 2018: 96.7%), also reflecting the decline in the
Motor business: 4.8% decline induced by price
attritional loss ratio
increases in 6M 2019 (43% of GWP); increase in
Q2 2019 y/y due to higher portion of contracts 6M 2019 net return on investment increased to
renewable during the year compared with 2.7% (from 2.2% in 6M 2018), due to higher income
competitors; focus is on profitability from real estate and unrealised gains on derivative
instruments in special funds
Lower loss ratio also helped to achieve technical
result of EUR 7.2m (up from EUR 2.5m in Q2 2018)
59 Investor Presentation Munich, Dr Immo Querner, 23/24 September 2019I II III 6M 2019 results
Segments - Retail Germany Life
EURm, IFRS 2019 2018
Gross written premiums (GWP) Net investment income Operating result (EBIT)
+2% (18%)
922 +47%
2,285 2,240 +3% 753 (19%) 71 +40%
1,181 1,152 353 433 48 40 28
6M Q2 6M Q2 6M Q2
Retention rate in % Return on investment in % EBIT margin in %
93.7 93.4 93.9 93.6 3.1 3.9 2.9 3.7 4.2 2.9 4.5 3.4
6M Q2 6M Q2 6M Q2
Increase in single premium business in Q2 and 6M Net investment income down both in Q2 and 6M, As previously, change in ZZR allocation was P&L
2019 across carriers and in biometric risk protection driven by lower extraordinary gains (EUR 84m in neutral
business more than offset decrease in regular 6M 2019 vs. EUR 253m in 6M 2018) due to regime
EBIT increase reflects two accounting-driven one-
premiums shift in Zinszusatzreserve (ZZR) under German
offs of net positive EUR 9m in Life business in
GAAP (HGB) in 2018
Increase in net premiums earned in Q2 2019 by Q2 2019
4.4% y/y Allocation of EUR 113m under HGB in Q2 2019
was higher than in Q1 2019 (EUR 61m) due to
further decrease in interest rates; total ZZR as of 30
June 2019 at EUR 3.6bn; FY 2019 ZZR formation
currently expected above 2018 level (EUR 301m)
Ordinary investment income in 6M 2019 nearly
stable at EUR 724m (EUR 727m in 6M 2018)
60 Investor Presentation Munich, Dr Immo Querner, 23/24 September 2019I II III 6M 2019 results
Segments - Retail International
EURm, IFRS 2019 2018
Gross written premiums (GWP) Operating result (EBIT) Net income
+6% +6% +3%
3,154 2,963 85 83
+5% 146 138 +3%
+8%
1,537 1,467 73 68 43 42
6M Q2 6M Q2 6M Q2
Retention rate in % Combined ratio in % RoE in %
92.1 91.7 93.2 92.1 95.2 94.6 95.6 94.2 8.5 8.4 8.3 8.4
6M Q2 6M Q2 6M Q2
6M GWP grew by 6.5% (curr.-adj. +9.2%); negative Q2 and 6M combined ratio in P/C up y/y due to Tax rate slightly lower at 25.7% in 6M 2019 due to
currency impact mainly in Turkey and Brazil change in cost allocation from 1 Jan 2019 and increased profit portion of Polish business
(positive impact in Mexico) further build-up of reserve redundancies
6M ordinary investment result up 14% y/y to EUR
Europe +7.1% to EUR 2,291m (two thirds of Lower loss ratios in Motor in Turkey and Italy, 165m, driven by higher asset volumes in Italy and at
increase from single premium Italian Life business, higher loss ratio in Chile (NatCat and negative run- Warta
mainly in Q1 2019), and LatAm +6.2% to off result in Liability), admin cost improvements in
We expect the acquisition of Ergo Sigorta in Turkey
EUR 863m, driven by motor business in Mexico Mexico and Chile
to close in the near future
6M P/C increased by 5.2% (curr.-adj. +9.2%), 6M 6.2% EBIT increase driven by Europe (+14.7%
strongest contributions from Mexico, Warta and to EUR 134m; absolute increase almost entirely
Brazil (currency-adjusted); growth rates reflect very earned by Warta P/C with significant percentage
strong increases in 6M 2018 at Warta P/C increases in Turkey); Latin America up 18.7% to
EUR 34m (gains in Mexico and Brazil more than
offsetting decrease in Chile)
61 Investor Presentation Munich, Dr Immo Querner, 23/24 September 2019I II III 6M 2019 results
Segment - Reinsurance
EURm, IFRS 2019 2018
Gross written premiums (GWP) Operating result (EBIT) Net income (excl. minorities)
+3%
+17% 943 917 +17%
11,694 +2% 329 281 +27%
9,985 +15% 182
491 481 142
5,321 4,640
6M Q2 6M Q2 6M Q2
Retention rate in % Combined ratio P/C in % RoE (excl. minorities) in %
90.6 91.3 90.9 91.4 96.7 95.7 97.6 95.5 14.7 13.9 15.3 14.3
6M Q2 6M Q2 6M Q2
GWP up by 17.1% (currency-adj. +14.5%) in 6M 6M 2019 EBIT up by 2.9% y/y, supported by 6M 2019 net income attributable to Talanx
2019, growth driven by EUR 1,380m, or 21%, positive one-off effect in Life / Health business in shareholders up by +17% y/y
increase in P/C Q2 2019 (Viridium, EUR 100m); adjusted for
Return on equity for 6M 2019 at 14.7%
Viridium, 6M 2019 EBIT decreased by 8%
Net premiums earned are up by +12.1% on a (+0.8%pt vs 6M 2018), well above minimum target
reported basis and by +10.0% on a currency- Net large losses of EUR 141m in 6M 2019 well
adjusted basis below pro-rata budget of EUR 370m
Retention ratio slightly down to 90.6% in 6M 2019 Ordinary investment income increased by 9.7%,
total investment income by 15.5% (including
Viridium)
Assets under own management up by 6% vs.
Dec 2018 to more than EUR 44bn
62 Investor Presentation Munich, Dr Immo Querner, 23/24 September 2019I II III 6M 2019 results
Net investment income
EUR m, IFRS 6M 2019 6M 2018 Change Q2 2019 Q2 2018 Change Comments
5% increase in ordinary investment income in
Ordinary investment income 1,778 1,687 +5% 908 836 +9% 6M 2019 supported by 7% rise in assets
thereof current interest income 1,399 1,329 +5% 707 654 +8% under own management
thereof income from real estate 156 132 +19% 86 69 +25%
More than three quarters of increase from
Extraordinary investment income 246 334 (27%) 135 119 +14% interest income despite further decline of
Realised net gains / losses on investments 268 420 (36%) 184 156 +18% interest rates
Remaining increase in ordinary investment
Write-ups / write-downs on investments (96) (79) (21%) (58) (37) (56%) income mainly from real estate, offsetting
Unrealised net gains / losses on investments 73 (6) +1,276% 9 (0) +8,334% decrease in private equity
Investment expenses (125) (120) (4%) (65) (61) (7%) Realised net investment gains include
EUR 100m one-time Viridium gain in L/H
Income from assets under own management 1,898 1,901 +0% 978 893 +9%
Reinsurance in Q2
Interest income on funds withheld and contract EUR 152m net decrease in realised net
87 106 (19%) 19 52 (63%)
deposits investment gains in 6M 2019 (despite Viridium
gain) was driven by EUR 187m decrease in
Income from investment contracts 1 (0) +1,366% 1 0 +647% ZZR-induced capital gains
Total: Net investment income 1,986 2,007 (1%) 998 945 +6%
Assets under own management 118,738 110,756 +7% 118,738 110,756 +7%
Net return on investment1 3.3% 3.5% (0.2%)pts 3.3% 3.3% +0.0%pts
Net ordinary return on investment2 3.3% 3.3% +0.0%pts 3.3% 3.1% +0.2%pts
1 Net return on investment: Annualised income from assets under own management dividend by average assets under own management
2 Net ordinary return on investment: Annualised ordinary investment income net of investment expenses divided by average assets under own management
63 Investor Presentation Munich, Dr Immo Querner, 23/24 September 2019I II III 6M 2019 results
Changes in equity
Shareholders‘ equity
Comments
in EURm 793 Shareholders’ equity rose to EUR 9,617, which is
EUR 904m, or 10%, above the level of Dec 2018 and
EUR 55m, or 0.6% above 31 March 2019
Strong increase in OCI continues to be caused mainly by
477 positive effect of decreasing interest rates on bond values
Book value per share
(367)
9,617
in EUR Change
31 Dec 30 June
2018 2019
2,077.00 Abs. %
8,713 1,600.00 1,710.00
Book value per share 34.47 38.04 3.57 +10.4
Excl. goodwill 30.28 33.82 3.54 +11.7
31 Dec 2018 Net income after Dividend Other 30 Jun 2019
minorities paid in May 2019 comprehensive
Note: Figures restated on the basis of IAS 8 income
Shareholders’ equity materially up, primarily reflecting increased bond values
64 Investor Presentation Munich, Dr Immo Querner, 23/24 September 2019You can also read