NIBC COVERED BOND PRESENTATION - August 2020
←
→
Page content transcription
If your browser does not render page correctly, please read the page content below

NIBC COVERED BOND
PRESENTATION

August 2020

                    1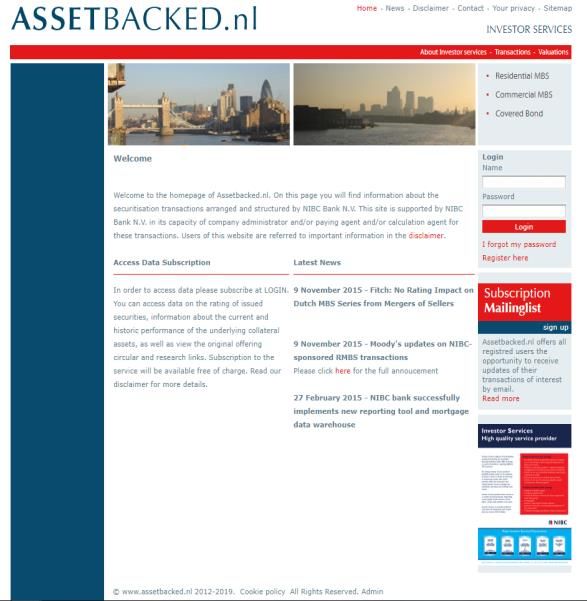
EXECUTIVE SUMMARY
                                            ▪ Focused mid-market corporate and retail franchise with differentiated approach

                                            ▪ Net profit of EUR 3 million in H1 2020 (EUR 83 million in H1 2019)

                                            ▪ Net interest margin of 1.85% in H1 2020 (1.89% in 2019)
           NIBC
                                            ▪ Impairment ratio of 0.95% in H1 2020 (from 0.29% in 2019)

                                            ▪ Cost-to-income ratio at 54% in H1 2020 (44% in 2019)

                                            ▪ Solid capital position, with fully-loaded CET 1 ratio at 18.5% and leverage ratio of 7.3% at half year 2020

                                            ▪ AAA/AAA (S&P/Fitch) rated Conditional Pass-Through Covered Bonds

                                            ▪ Law-based programme, registered with the Dutch Central Bank
   Covered Bond                             ▪ Favorable regulatory treatment
    Programme
                                            ▪ Documented minimum overcollateralisation of 15%

                                            ▪ Cover pool of prime Dutch residential mortgage loans

                                            ▪ Total residential mortgage book of EUR 9.0 billion1

                                            ▪ Despite Covid-19 the Dutch housing market remains resilient: NPLs remain low and credit loss expenses at half year
Mortgage Business                                2020 were EUR 5 million

                                            ▪ Origination via independent intermediaries, underwriting criteria fully controlled by NIBC

                                            ▪ In-house arrears and foreclosure management

1: Excludes buy-to-let exposure of EUR 0.8 billion                                                                                                                 2
TABLE OF CONTENTS
1. NIBC BUSINESS AND FINANCIAL UPDATE HALF YEAR 2020 4
2. DUTCH HOUSING AND MORTGAGE MARKET 26
3. RETAIL CLIENT OFFERING AND ASSET QUALITY 29
4. CONDITIONAL PASS-THROUGH COVERED BOND PROGRAMME 34
APPENDIX I
COVID-19: OVERVIEW OF
SELECTED POLICY MEASURES
FOR BANKS

                    38
APPENDIX II
MORTGAGE BUSINESS AT
NIBC

                       40
APPENDIX III
MAIN UNDERWRITING
CRITERIA

                    43
APPENDIX IV
ASSET COVER TEST

                   46
APPENDIX V
CONDITIONAL PASS-THROUGH
SCENARIOS

                      48
APPENDIX VI
INVESTOR REPORTING AND
LEGAL FRAMEWORK

                    50
3NIBC BUSINESS AND
FINANCIAL UPDATE
HALF YEAR 2020
4HALF YEAR PERFORMANCE
Performance significantly impacted by COVID-19 in first half of 2020
MEDIUM-TERM
METRICS OBJECTIVES H1 2020 COMMENTS
▪ Net profit in H1 2020 of EUR 3 million
Return on Equity
10 - 12% 0.3%
(Holding) ▪ We reiterate the AGM statement from April 2020 that the medium-
term objective of a ROE between 10-12% is not expected to be
achieved in 2020 due to the impact of the COVID-19 pandemic
Cost-to-income
< 45% 54% ▪ Fully-loaded cost-to-income ratio of 54% at stable operating
(Holding)
expenses
CET 1 ▪ Improvement of the CET 1 ratio in H1 2020 to 18.5%, displaying a
≥ 14% 18.5% significant buffer above minimum SREP requirements
(Holding)
▪ Following the ECB recommendation, NIBC will not pay an interim
Dividend pay-out
dividend in 2020
≥ 50% 0%
(Holding)
Rating
BBB+ BBB+ Negative Outlook
(Bank)
.
Note: Financials for NIBC Holding as of H1 2020, unless otherwise stated
Rating reflects S&P’s long-term issuer credit rating on NIBC Bank 5OUR RESPONSE TO COVID-19
First priority to safeguard health of our staff and families and to ensure business continuity
Our People Our Business Our Clients
▪ Almost all staff working from home since 16 ▪ Since beginning of March, Business Continuity ▪ Prudently extending credit to businesses of all
March 2020 in a fully remote working Plan (BCP) in place, headed by CFO/CRO with sizes for working capital and general corporate
environment initially (bi)-daily update calls, currently set to a purposes
weekly schedule
▪ Since July NIBC is gradually and in a safe manner ▪ Client relief such as 90-day grace period for
(keeping 1.5m distance, maximum number of ▪ Strong focus on liquidity management leading to mortgage payments
people in the office, A- and B- teams, etc) an increase of NIBC’s liquidity buffers to EUR ▪ Increased monitoring of portfolios on a name-by-
facilitating working at our offices again 4.1bn in H1 2020 name basis, offering tailor-made solutions for
▪ Skeleton staff at office locations to ensure ▪ Active monitoring of the development of our existing clients where necessary
continuity – taken special measures into account retail savings. Currently, no wholesale ▪ Cautious client origination on corporate client
transactions planned nor needed
▪ Intensified communication to all staff with regular side; focus on portfolio management, also using
Corona news releases, periodic video updates by ▪ Regular contact with various regulators and the tools of our partner OakNorth
an ExCo member Dutch Banking Association
▪ Early payment of the annual € 600 euro per ▪ Cost deep-dive to reduce monthly run-rate,
employee to spend on work facilities at home including stopping of marketing campaigns,
reductions of external staff, reprioritising (large)
▪ Regular updates to management on (possible)
infected staff projects
6FOCUSED TRANSFORMATION
Continued rebalancing of our portfolios towards more resilience
NIBC PORTFOLIO TRANSFORMATION SINCE 2018 COMPOSITION NIBC’S COMMENTS
CLIENT OWN BOOK ASSETS ▪ The deliberate reduction of certain asset classes - as
H1 2020 vs.
in EUR billion H1 2020 FY 2018 FY 2018 indicated in the Capital Market Update in Q4 2018 -
FY 2018 continued in H1 2020
Energy 0.7 0.8 -20%
Shipping 0.9 1.4 -35% ▪ Total client assets - including originate-to-manage -
Financial sponsors & Leveraged Finance 1.0 1.4 -29% increased by 13% since 2018
Commercial Real Estate 1.1 1.3 -14% ▪ Clients assets for NIBC’s own book declined by 2%,
Fintech & Structured finance 1.3 1.0 25% displaying continued rebalancing towards a higher
52% 19.1bn 48%
Infrastructure 1.6 1.6 -2% share of retail and other granular asset classes:
Mid Market Corporates 1.3 1.5 -10% • Decreased exposure in the cyclical sectors
Total corporate loans (drawn & undrawn) 7.9 9.0 -13% Shipping, Energy and Leveraged Finance by EUR
Beequip and other lease receivables 0.6 0.4 33% 1.0 billion (-29%)
Investment loans 0.2 0.2 -28% • Growth in more granular exposures in Fintech &
Equity investments 0.3 0.2 26% H1 2020 Structured Finance (+25%)
Total corporate client assets 8.9 9.9 -10%
• Growth of new higher margin businesses such
Owner-occupied mortgage loans 9.0 8.6 5%
as leasing incl. Beequip (+33%) and Buy-to-Let
Buy to Let mortgages 0.8 0.6 19% (+19%)
Total retail client assets 9.8 9.2 6%
▪ Strong growth of the retail originate-to-manage
OTM Retail client assets 5.6 2.4 133%
48% 18.6bn 52%
offering by EUR 3.2 billion to EUR 5.6 billion
OTM Corporate client assets 1.0 0.9 21%
Originate-to-manage assets 6.7 3.3 104% Retail client
assets
Corporate
client assets 7COMPOSITION OF NIBC’S TOTAL ASSETS
Result of continued rebalancing
NIBC’S TOTAL ASSETS CORPORATE LOANS COMMENTS
▪ Diversified portfolio: of NIBC’s total assets
3% 2% of EUR 22.2bn at half year 2020:
1%
5% 3% 4% • 11% is in ‘liquid means’ (governments
29% & central bank)
5%
2% • 46% in residential mortgage loans
4%
46% 11%
6%
5%
3%
Corporate loans Governments & central bank Commercial Real Estate Energy
Other financial institutions Residential mortgage loans Financial Sponsors & Leveraged Finance Fintech & Structured Finance
Equity investments Lease Receivables Infrastructure Mid Market Corporates
Derivatives Other Shipping
8CORPORATE CLIENT OFFERING
Progressing with rebalancing strategy
CORPORATE LOAN ORIGINATION REBALANCING THE PORTFOLIO FACTS AND FIGURES
SELECTIVE ORIGINATION ACTIVELY MANAGED CORPORATE NET PROMOTOR SCORE (NPS)
RWA
0.6bn 8.9bn 35%
In EUR bn
C+
1
▪ Growth in Leasing with Beequip (+14%)
3.7 ▪ Reduced exposures in Energy, Shipping and
Leveraged Finance by nearly EUR 0.3bn /PRIME
3.0
(compared to EOY 2019)
▪
22
Continued focus of margin over volume 1
0.6
2018 2019 H1 2020
1 FY 2019 score, survey not updated for H1 2020
9RETAIL CLIENT OFFERING
Strong mortgage origination results in market share of 4%
MORTGAGE LOAN ORIGINATION GROWTH CLIENTS
STRONG ORIGINATION MARKET SHARE ORIGINATION ▪ Number of clients +7% since FY 2019
▪ Total number of clients 121k
2.2bn 4% ▪ Number of clients -2% since FY 2019
▪ Total number of clients 306k
MORTGAGE LOAN PORTFOLIO LOW RISK PORTFOLIO FACTS AND FIGURES
In EUR bn 15.4
14.0 ▪ Strong growth OTM portfolio from EUR 4.3
7.8
billion to EUR 5.6 billion NIBC DIRECT
11.6 5.6
4.3 ▪ Total OTM mandates increased to EUR 8.8 billion CUSTOMER SURVEY
2.4 ▪ Growth in the Buy-to-let portfolio of 7% SCORE SAVINGS1
0.6 0.7 0.8
8.6 9.0 9.0 ▪ 66% loan to value on own book residential
8.0
NIBC DIRECT
mortgage portfolio
CUSTOMER SURVEY
2018 2019 H1 2020 ▪ Retail savings increased in H1 2020 by 1.5% to
Owner-occupied Buy-to-let Originate-to-manage EUR 9.6 billion SCORE MORTGAGES1
1 FY 2019 score, survey not updated for H1 2020
10SUSTAINABILITY EMBEDDED IN OUR STRATEGY
The way we do business
IT BEGINS WITH US INTEGRATED BUSINESS APPROACH STRONG SUSTAINABILITY RATINGS
▪ 100% renewable electricity ▪ Embedded in NIBC’s business strategy ISS OEKOM
across all locations & the way we do business
▪ Significant reduction in use of
gas for heating and cooling
▪ Robust sustainability policy
framework
C+ / Prime
▪ 25% of employees commute by ▪ Integrated risk management
bicycle SUSTAINALYTICS
▪ Comprehensive reporting
22
OWN OPERATIONS COMMUNITY ENGAGEMENT
MSCI
▪ 6 NGO’s operating from NIBC’s
headquarters
▪ Focus on SCR activities which directly
AA
benefit our communities
Carbon Neutral in Head office 100% ▪ Sustainability challenges in the NIBC REPRISK
own operations Co2-neutral Talent Program
▪ High engagement among employees AAA
11OUR STRATEGIC PRIORITIES
Continuous evolution of client franchise, expertise and propositions
1 ▪ Progressing well with the execution of the rebalancing strategy, reducing
exposure in highly-cyclical sectors
Further optimisation of capital structure ▪ Strong mortgage origination across all tenors
and diversification of funding
▪ Stable funding costs at 71bps
▪ Strong CET 1 ratio of 18.5%
▪ Strong liquidity buffers of EUR 4.1 billion to 6 2 Focus on growth of asset portfolio in core markets
address COVID-19, including merger AG into NV ▪ Continued (+14% in H1 2020) growth in Beequip
▪ Continued (+7% in H1 2020) growth in Buy-to-Let
▪ Off-balance growth of mortgage portfolios of EUR 1.3
billion (+30%)
Ongoing investment in people, culture
and innovation 5 3 Diversification of income
▪ Executed 3 Employee experience surveys re Covid-19 ▪ Increased total OTM mandates for mortgages in H1
▪ Complemented our ‘working from home’ policy with a 2020 by 35% from EUR 6.5 billion to EUR 8.8 billion
seamless transition to online training and development
▪ Additional attention spent to vitality next to regular
focus (a.o. Virgin Pulse Global Challenge) 4
▪ Expanded successful initiative of ‘Flying Goalies’:
temporary assignments in other parts of organization Building on existing agile and effective organisation
▪ Election of deal of the quarter and topic of the quarter ▪ Strategic investments in fintechs continue
based on engagement (shares and likes) in social media ▪ Permanent and increased focus on ‘Know-Your-Customer’ (KYC) and Anti-Money
Laundering results in further strengthening of processes on both sides of the business
on track 12BLACKSTONE OFFER LAUNCH
Timetable until closing
Publication of Offer Paulus de Wilt, CEO and Chairman of the Managing Board of NIBC: “We are excited to announce an
Memorandum important next step for the future of our company with the launch of the Offer today. As we navigate
▪ 7 August 2020 unprecedented times, we are proud that we have been able to continue our dynamic and agile
approach that allows us to successfully capitalize on evolving market opportunities across our corporate
Commencement Acceptance client franchise where we focus on niche, underserved or granular markets as well as in our retail client
Period franchise where we have a strong foothold in the Dutch mortgage market. With Blackstone, NIBC will
▪ 10 August 2020 have a strong partner to support our strategy through the current challenging environment and
Publication H1 2020 Results continue to seek to innovate through new avenues of growth, including our recent partnerships with a
▪ 13 August 2020 number of Fintech companies and our evolving Originate-to-Manage product”
Qasim Abbas, Senior Managing Director, Blackstone: “Blackstone shares the Managing Board’s and
EGM Supervisory Board’s vision to further strengthen NIBC’s position as a leading European niche banking
▪ 7 October 2020 player and create long-term value for all stakeholders. Reaching this deal in a challenging environment
is testament to our commitment and confidence in NIBC as well as the potential of the business, and we
look forward to an exciting journey ahead.”
Closing Acceptance Period
(unless extended)
Dick Sluimers, Chairman of the Supervisory Board of NIBC: “It is with great satisfaction that we
▪ 19 October 2020
announce this important milestone for NIBC today. The Supervisory Board has closely monitored global
developments that evolved over the past months, thoroughly reviewed and assessed the Offer and in
light of its fiduciary duties, considered the interests of all stakeholders. The Offer provides minority
Acceptance Period Potential extension shareholders with a fair cash price and a certain delivery of the 2019 Final Dividend, while at the same
time facilitating an exit for JCF. NIBC is appreciative of the support and stewardship it has received from
its controlling shareholder JCF for over 15 years and the collaborative effort of JCF and its
Subject to declaration of no objection (DNO) DNB/ECB
representatives to grow NIBC into the business it is today. NIBC is also grateful for the support of
Reggeborgh since the IPO. Blackstone will provide further support for NIBC’s strategy and a solid basis
to secure the long-term interests of NIBC, our employees, deposit holders and clients”
13FINANCIAL RESULTS
HALF YEAR 2020
14INCOME STATEMENT
Net profit under pressure from COVID-19
INCOME STATEMENT PROFIT AFTER TAX AND RETURN ON EQUITY COMMENTS
IFRS 9 IFRS 9 H1 2020 ▪ Profit after tax and return on equity are significantly
vs negatively impacted by the COVID-19 pandemic
H1 2020 H1 2019 H1 2019 13.6%
Net interest income 208 209 0% ▪ This impact is mainly reflected in:
Net fee and commission income 19 19 0% 11.8%
10.8% • credit loss expenses of EUR 84 million, including
Investment income 5 16 -69%
9.7% a management overlay of EUR 20 million
Other income (17) 7 -343% 11.4%
Operating income 215 251 -14% • negative fair value movements of EUR 15 million
Personnel expenses 55 57 -4% 7 on retained positions of North Westerly CLOs
Other operating expenses 49 47 4% 44
Depreciation and amortisation 3 3 0%
• lower investment income
Regulatory charges 10 9 11% ▪ On the other hand stable net interest income and
Operating expenses 117 116 1% 0.7% net fee & commission income support the P&L
Net operating income 98 135 -27% 194
173 ▪ Operating expenses are also in line with HI 2019,
Impairments of assets 84 21 300% 0.3%
Tax 5 25 -80% which is the balance of:
83
4
Profit after tax 9 89 -90%
3
• decreased expenses from the discontinuation of
Profit attributable to non-controlling
shareholders
6 6 0% our capital market activities, partially offset by:
2018 H1 2019 2019 H1 2020
Profit after tax attributable to • higher expenses from the increase of personnel
3 83 -%
shareholders of the company Non-recurring
Profit after taxprofit Profit after tax profit
Non-recurring
in Beequip and Lendex and for projects
Return on equity Return on equity ex. non-recurring • Operating expenses include non-recurring
expenses amounting to EUR 5 million with
respect to the merger with NIBC Bank
Deutschland AG and the Blackstone offer
15PORTFOLIO VOLUMES AND SPREADS
Continued focus on building a more granular portfolio while decreasing cyclical exposures
CORPORATE LOAN SPREADS & VOLUMES RETAIL ASSET SPREADS & VOLUMES COMMENTS
3.45% 3.58% ▪ Corporate client assets:
3.28%
4.94% 4.96%
4.84% • Own book corporate client assets decreased in
2.36% 2.30% H1 2020 by EUR 1 billion to EUR 8.9 billion
2.21%
2.99%
2.70%
2.96% • The decrease is across all sectors, with the
1.88% exception of an increase in the lease portfolio
2.77% 2.73% 1.74%
2.52% 1.53% and a stable structured finance portfolio, further
2018 2019 H1 2020 2018 2019 H1 2020 supporting the rebalancing of the portfolio
Portfolio spread Origination spread Portfolio spread Beequip Portfolio spread Origination spread BtL • The rebalancing was accompanied by an
Origination spread owner-occupied increase in the average portfolio spread to
2.73%, mainly driven by a further increase of the
9.9 9.9 8.9 average origination spread to 2.96%
0.2 0.3 9.7 9.8
0.2 0.2 0.3
9.2
0.7 0.8 • OTM assets increased by 35% driven by the
0.4 0.6
0.5 0.2 issued North Westerly VI transaction in H1 2020
0.6
▪ Retail client assets:
8.6 9.0 9.0 — The own book portfolio of mortgage loans
9.0 8.9
7.9 5.6 increased in 2020 to EUR 9.8 billion
0.9 1.0 4.3
0.8 2.4 — Buy-to-let increased by 7% to nearly EUR 0.8
2018 2019 H1 2020 2018 2019 H1 2020
billion at improved origination spreads
— OTM assets increased by 30%, with Lot
Corporate loans Lease receivables Investment loans
Owned Occupied Buy-to-Let Originate-to-Manage Hypotheken - introduced in February 2020 -
Originate-to-Manage Equity investments
already contributing to this development
16NET INTEREST INCOME
Stable net interest income and cost of funds
NET INTEREST INCOME NET INTEREST MARGIN & FUNDING SPREAD COMMENTS
(EUR million)
▪ Net interest income of EUR 208 million is in line with
H1 2019
▪ The limited decrease of the net interest margin is
caused by an increase in interest-bearing assets,
2.11% 2.10% mainly reflecting the impact of the decision to
2.06%
2.01% maintain higher liquidity buffers
▪ These higher liquidity buffers result in approximately
427 426 1.84% EUR 2 million higher interest expenses
1.88% 1.89% 1.85%
▪ Financial markets have seen volatility in the spread
levels for financial institutions…
▪ …but active liquidity management and selective use
of the various funding instruments have resulted in a
209 208 stable funding spread for NIBC
0.73% 0.72% 0.71% 0.71%
2018 H1 2019 2019 H1 2020 2018 H1 2019 2019 H1 2020
Net interest margin Net interest margin ex. IFRS 9 Funding spread
17NET FEE AND COMMISSION INCOME
Focus on originate-to-manage is paying off
NET FEE AND COMMISSION INCOME COMMENTS
(EUR million)
▪ Total fee income remained stable at the H1 2019 level
51 ▪ The composition however has changed, with a 71% increase in OTM-mortgage loan
fee income mirroring the increase of the related assets under management
3
▪ Fee income from lending activities decreased on the back of subdued origination of
40
corporate loans in H1 2020
11
4
11
15
19 19
10 4
1
7
10 12
1
15 6 2
7 3
4 2
2018 H1 2019 2019 H1 2020
OTM Loans Lending related fees M&A OTM mortgage loans Brokerage
18INVESTMENT INCOME
Subdued, but positive performance on a decreased portfolio
EQUITY INVESTMENT PORTFOLIO BY TYPE H1 2020 EQUITY INVESTMENT PORTFOLIO H1 2020 COMMENTS
▪ Investment income is sensitive to the sentiment in
H1 2020 2019 the equity markets and is therefore volatile quarter
Direct Investments to quarter, especially in light of the COVID-19
Strategic 37 54 pandemic
Client 96 100 14% ▪ Investment income decreased significantly
Other 21 36
compared to H1 2019, but still displayed a positive
30%
Indirect Investments result of EUR 5 million:
Fund 37 54
• Negative (unrealised) revaluation results were
Strategic 96 100 displayed on a portion of the investment
EUR 271m
portfolio, partially offsetting:
Total 271 303
35% • Positive results mainly related to the successful
13%
(partial) exits of two investments closed in H1
2020, leading to an addition realised positive
8% result of EUR 4 million in H1 2020
▪ The decrease of the portfolio contributed to a
decrease in RWA in H1 2020
Direct Strategic Direct Client Direct Other
Indirect Strategic Indirect Fund
19OPERATING EXPENSES
Fully loaded cost/income ratio absorbing regulatory expenses
EVOLUTION OF OPERATING EXPENSES COST/INCOME RATIO COMMENTS
▪ In H1 2020 operating expenses were stable
compared to H1 2019
239 237 54% • This includes in H1 2020 non-recurring
9
expenses of EUR 5 million related to the
9
Blackstone offer and the merger of NIBC Bank
52% Deutschland AG with NIBC Bank N.V.
• Excluding these non-recurring items operating
expenses decreased by 3%
45% ▪ Decreased expenses from the discontinuation of our
117 44%
capital market activities were partially offset by
230 228 5
higher expenses from the increase of personnel in
43% Beequip and Lendex and for projects
42%
▪ The higher expenses for projects included expenses
112
amounting to EUR 6 million in H1 2020 for the
remediation of observations from the IMI
▪ The cost/income ratio increased in H1 2020. As
2018 2019 H1 2020 2018 2019 H1 2020 operating expenses are relatively stable, this is a
direct reflection of the reduced operating income
Non-recurring expenses Operating expenses Cost/income ratio Cost/income ratio ex. non-recurring
20CREDIT LOSS EXPENSE
Significant increase of credit loss expense
DEVELOPMENT OF CREDIT LOSS EXPENSE AND COST OF RISK KEY FIGURES ASSET QUALITY COMMENTS
1.89% H1 2020 2019 2018
▪ Credit loss expense and cost of risk are significantly
Impairment coverage ratio 34% 33% 30% higher than in 2019
0.73% 0.63% Non-performing loan ratio 3.0% 2.4% 2.8% ▪ Total credit loss expense in H1 2020 of EUR 83
0.95% million includes a management overlay of EUR 20m
Exposure corporate arrears > to the credit loss allowance
90 days 1.6% 1.2% 2.7%
0.33% 0.29% ▪ This overlay is based on an additional review by
Exposure residential mortgage NIBC and ensures that the credit loss allowance
5
3 loans arrears > 90 days 0.2% 0.1% 0.2%
sufficiently reflects the macroeconomic
83 circumstances NIBC faces and the uncertainties
LtV Dutch residential
54
mortgage loans 66% 68% 72% these bring for the expected credit loss estimation
49
▪ This overlay is not allocated to individual exposures
LtV BTL mortgage loans 53% 52% 52%
▪ The management overlay reflects an upward
2018 2019 H1 2020 adjustment to the ECL allowance for corporate
loans of EUR 15 million and for residential
mortgages of EUR 5 million
Credit loss expense Other credit losses ▪ Credit loss expense of EUR 83m can be broken
Cost of risk Impairment ratio down into EUR 78 million for corporate and EUR 5
million for retail
21
Cost of risk = annualized credit loss expense and other credit losses divided by average RWAs
Impairment ratio = annualized credit loss expense divided by average assets loans & mortgagesCREDIT LOSS EXPENSE
Increase in stage 1 and stage 2 allowances
Coverage ratios stage 1 and stage 2 exposures COMMENTS
▪ Following the regular process (so before including the management overlay
H1 2020 2019
described on the previous slide), stage 1 and 2 ECL allowance decreased in the
Stage 1 Stage 2 Stage 1 Stage 2
corporate loan portfolio, as various movements and effects have offset each other
Loans ▪ Upward pressure from the deteriorated economic situation and the macro-
Carrying value 5,435 677 6,135 680 economic scenarios have been offset by downward movements mainly related to
ECL Allowance 7 26 8.8 15.2 the decreased portfolio
Coverage ratio 0.1% 3.8% 0.1% 2.2% ▪ For both the lease receivables and mortgage portfolios limited increases were
recorded in stages 1 and 2 ECL allowance:
Lease receivables
Carrying value 499 36 442 33 • For lease receivables this development is in line with a growing portfolio and
ECL Allowance 2 1 1 0 deteriorating economic environment
Coverage ratio 0.4% 2.8% 0.2% 0.0% • For the mortgage portfolio (pre-management overlay) the impact from positive
developments in the Dutch house market partially offset the negative impact of
Mortgage loans adjusted macro-economic scenarios
Carrying value 9,934 223 9,915 120
ECL Allowance 6 1 1 0
Coverage ratio 0.1% 0.4% 0.0% 0.0% ▪ The management overlay reflects an upward adjustment to the ECL allowance in
stages 1 and 2 for corporate loans of EUR 15 million and for residential mortgages of
Total EUR 5 million, reflecting continued COVID-19 uncertainty
Carrying value 15,868 936 16,492 832
ECL Allowance 15 28 11 15
Coverage ratio 0.1% 2.9% 0.1% 1.8%
22FUNDING PROFILE DOMINATED BY LONG MATURITIES
Redemptions wholesale funding in H2 2020 and 2021 mainly related to TLTRO II
FUNDING COMPOSITION COMMENTS
▪ Funding profile continues to benefit from:
• A diversified funding composition
8%
16% Shareholders equity • The weighted average tenor of our wholesale funding of 6.4 years at 30 June 2020
Retail funding
6% ▪ Maturing wholesale funding:
Secured (wholesale) funding
5% H1 2020 • Funding transactions of EUR 0.8 billion maturing in H2 2020 include TLTRO of EUR 0.5
ESF deposits billion and a short-term floating rate note of EUR 0.3 billion
43%
TLTRO
• Funding transactions of EUR 0.8 billion maturing in 2021 include TLTRO of EUR 0.5
22% Unsecured (wholesale) funding billion
• TLTRO repayments can be ‘rolled-over’ through the issuance of new TLTRO
▪ NIBC is eligible to draw under the TLTRO-III facility, enabling it to not only replace maturing
MATURING FUNDING AS OF 1/7/2020 TLTRO-II transactions under the new facility but also draw additional funds if needed
▪ In H1 2020 NIBC issued an EUR 200 million fixed rate senior non-preferred transaction with
In EUR billion 2020 2021 2022 2023 2024 a maturity of four years, as a tap on the outstanding 2024 transaction, increasing the
Covered bonds - - 0.5 - - transaction to a EUR 500 million benchmark size
Other secured funding 0.5 0.5 0.1 0.6 - ▪ NIBC’s liquidity position is strong:
Senior unsecured 0.3 0.3 0.5 0.8 0.5 • NIBC decided to increase liquidity buffers in H1 2020 to EUR 4.1 billion
Subordinated - - - - - • Stable liquidity ratios at levels of 270% (LCR) and 124% (NSFR)
Total: 0.8 0.8 1.1 1.4 0.5
23
Financials for NIBC Holding per 30 June 2020CAPITAL POSITION
Strong solvency ratios
CET 1 DEVELOPMENT IN 2019 COMMENTS
▪ NIBC’s strong capital position is reflected in a CET 1 ratio of 18.5% at H1
2020, displaying an improvement from 17.1% at year-end 2019
▪ The increase is mainly driven by the addition of retained 2019 profit to our
capital and by developments within our Corporate client offering
▪ In H1 2020, RWA of the corporate assets decreased due to limited loan
-0.2% 0.3% 18.5% origination as from the lockdown, high (p)repayment levels and the
0.2% 0.5%
0.6% decreased volume of equity investments
17.1%
8,841 8,538
7,805
22.0% 21.8%
20.5%
2.1% 2.1%
1.4% 2.1% 1.2%
1.3%
18.5% 17.1% 18.5%
31 December Eligible 2019 Sale equity Repayment Increase in Other 30 June 2020 2018 2019 H1 2020
2019 profit investments corporate loan NPE movements
CET 1 ratio Tier 1 Tier 2 RWA
portfolio
24CAPITAL POSITION
Increased buffer above minimum requirements
CAPITAL RATIOS COMPARED TO REQUIREMENTS EXCL. P2G COMMENTS
CET 1 Own Funds
▪ NIBC’s management buffer has further grown as a result of the supervisory
permission to temporarily operate below some requirements (CCB, P2G
and LCR) to weather the current COVID 19 challenging market conditions
21.8%
▪ Our CET 1 capital displays at H1 2020:
18.5% • approximately EUR 385m capital in excess of our 14% CET1 medium
term objective
13.8% • a management buffer of 9.6% (approximately EUR 820m) above the
SREP CET 1 requirement level of 8.9%
2.5% 11.3%
• an even higher management buffer above SREP post temporary ECB
8.9% 3.3% 3.3% measures and the application of these measures by DNB to Dutch LSIs
2.5% 6.4%
1.9% 1.9%
8.0% 8.0%
4.5% 4.5%
Minimum CET 1 H1 Min. level Minimum Own Funds Min. level
SREP 2020 Covid-19 SREP H1 2020 Covid-19
requirement measures requirement measures
CET 1 Own Funds
Pillar 1 P2R CCB
25
As from 2019, non-eligible profits attributable to the shareholders are no longer added to regulatory capital
Minimum level Covid-19 measures is indicated by ECB and DNBDUTCH HOUSING AND
MORTGAGE MARKET
26DUTCH HOUSING AND MORTGAGE MARKET
DUTCH HOUSING AND MORTGAGE MARKET ECONOMIC GROWTH AND UNEMPLOYMENT IN THE NETHERLANDS2
▪ The Netherlands contains 7.8 million dwellings, of which 4.5 million are owner 8
occupied 6
4
▪ Confidence in the housing market is at a level of 95 in July 2020, having reached
Percentage (%)
2
its low in December 2012 at 51 and a peak in November 2016 at 121 1 0
▪ The Dutch housing market remains tight, as a result of a structural housing -2 2013 2014 2015 2016 2017 2018 2019 2020
-4
shortage and lagging supply of new development
-6
▪ Proven resilience during the credit crisis -8
✓ Flexible labour market and strong social services safety net -10
✓ High payment morale, supported by central credit registration system (BKR) and
GDP growth year-over-year Unemployment rate
efficient legal system
AVERAGE MORTGAGE RATE3 AND HOUSE PRICE INDEX4 HOUSE SALES DEVELOPMENT4
150 8 250
140
Index (2015 = 100)
Percentage (%)
6 200
130
Thousands
150
120 4
110 100
2
100 50
90 0
2008 2009 2010 2011 2012 2013 2014 2015 2016 2017 2018 2019 2020 -
2013 2014 2015 2016 2017 2018 2019 2020
Average mortgage rate (RHS) House price index (LHS)
Rolling 12-month housing sales
1: Source: Vereniging Eigen Huis. Monthly measurement of the Dutch homeowners association for the consumer confidence related to the housing market
2: Source: Statistics Netherlands (CBS), seasonally corrected figures 27
3: Source: Dutch Central Bank . Total weighted average interest rate of new residential mortgage contracts
4: Source: The Netherlands’ Cadastre, Land registry and Mapping AgencyEVOLUTION OF DUTCH MORTGAGE LENDING STANDARDS
• New mortgages need
to be fully amortizing
for tax benefits • Interest deductibility • Interest deductibility
51.0% 50.0%
• Code of conduct • Changes to interest
enforced deductibility • NHG max EUR 245k • NHG max EUR 245k
• Interest deductibility
• NHG max EUR 350k • NHG max EUR 290k; • Max LTV 103% • Max LTV 101% 49.0%
only amortizing loans • NHG max EUR 290k
eligible
• Max LTV 105%
2011 2012 2013 2014 2015 2016 2017 2018 2020-
2019
2023
• Interest deductibility
2020 46.0%
• NHG max EUR 320k • Interest deductibility • European Mortgage • Interest deductibility • NHG max in 2020
51.5% Credit Directive active 49.5% EUR 310k
• Max LTV 106%
• NHG max EUR 265k • Interest deductibility • NHG max EUR 265k • Tax deductibility to
• 50.5% decrease further by
Max LTV 104% • Max LTV 100%
3% per annum to
• NHG max EUR 245k
37.05% in 2023
• Max LTV 102%
28RETAIL CLIENT OFFERING
AND ASSET QUALITY
29RETAIL CLIENT OFFERING
INTRODUCTION GEOGRAPHIES
▪ Strong franchise across the Netherlands, Germany and Belgium with more than 9.0 EUR billion
400,000 clients Owner occupied mortgage loans
▪ Mortgages are sold through partnerships with intermediaries, where NIBC sets all 4.8 EUR billion
Savings
underwriting criteria
▪ Multi-track approach: mortgages for our own balance sheet as well as for multiple 1.1 EUR billion
Savings
originate-to-manage mandates from institutional investors
▪ Non-value adding activities are outsourced (mid- and back-office services) to 3.7 EUR billion
specialized mortgage servicing companies, such as Stater and Quion Savings
▪ Arrears and foreclosure management performed in-house at NIBC Figures for half year 2020
SAVINGS BALANCE NIBC DIRECT (EUR BLN) RETAIL CLIENT OFFERING ASSETS (EUR BLN)
15.4
14.1
9.5 9.6
8.9
1.0 1.1 11.6
0.9 5.6
4.3
3.9 3.7 2.4
4.1
0.7 0.8
0.6
3.9 4.6 4.8 8.6 9.0 9.0
2018 2019 H1 2020 2018 2019 H1 2020
Netherlands Germany Belgium Owner occupied Buy-to-let Originate-to-manage
30RETAIL CLIENT OFFERING
MORTGAGE LOANS
▪ Total mortgage origination reached EUR 2.2bn in H1 2020, resulting in a market share of 4%
▪ Our on-balance portfolio increased EUR 0.1 bn to EUR 9.8bn1 and the OTM portfolios grew by EUR 1.3bn in H1 2020
▪ OTM mandates increased to EUR 8.8bn; the total OTM portfolio reached EUR 5.6bn at half year 2020
▪ fee generating initiative leading to income diversification
▪ strengthening our client franchise, as it enables NIBC to be active across maturities and sub-segments
▪ Growth in buy-to-let portfolio of 7%, resulting in a total of EUR 0.8bn at half year 2020
▪ The mortgage loan portfolio displays a solid performance with credit loss expenses of EUR 6 million in H1 2020
ORIGINATION (EUR BLN) RETAIL ASSET SPREADS
3.4 3.7 3.45%
3.58%
3.28%
2.0 2.2
1.8 2.36% 2.30% 2.21%
1.5
1.6 1.7 1.88%
1.74%
0.7 1.53%
2018 2019 H1 2020 2018 2019 H1 2020
Portfolio spread Origination spread BTL Origination spread owner occupied
Own book Originate to manage
1: Includes EUR 0.8bn buy-to-let mortgages 31RETAIL CLIENT OFFERING
COMMENTS
▪ Since 2016, when NIBC closed its first originate-to-
Owner-occupied Buy-to-let manage (OTM) mandate for residential mortgage
loans, NIBC has offered institutional investors the
NHG Non-NHG opportunity to invest directly in Dutch residential
mortgages
▪ Together with our OTM partners we are able to offer
30 year OTM OTM Not offered mortgage loans across all tenors and with or without
Fixed NHG (national mortgage guarantee) in an efficient
terms 20 year OTM OTM NIBC Not offered manner
▪ With the launch of “Lot Hypotheken” in February
10 year NIBC NIBC NIBC 2020 NIBC has expanded its OTM platform. This new
label aims to outperform on processes and
consumer experience, while focusing on
5 year NIBC NIBC NIBC sustainability
▪ The Buy-to-Let segment is a growing market and
Floating Not offered Not offered Not offered represents an attractive risk/return for NIBC
32DUTCH MORTGAGE LOANS
ARREARS >90DAYS INDEXED LOAN-TO-MARKET VALUE
Weighted-average LTIMV: 66% (H1 2020)
29%
0.5%
24%
21%
20%
18%
17%
17%
17%
17%
16%
15%
15%
15%
14%
0.2% 0.2%
12%
12%
12%
12%
10%
10%
10%
10%
9%
9%
8%
8%
0.1%
7%
7%
5%
2%
1%
1%
2017 2018 2019 H1 2020 NHG 100%
2017 2018 2019 H12020
33CONDITIONAL PASS-THROUGH
COVERED BOND PROGRAMME
34COVERED BOND PROGRAMME
SUMMARY OF THE COVERED BOND PROGRAMME KEY BENEFITS
Robust Structure
NIBC set up a robust Covered Issuer: NIBC Bank N.V.
✓ Hard obligation for NIBC to redeem the bond at
Bond Programme, benefitting
Double recourse: expected maturity (no optionality)
from a conditional pass- Guarantor: Bankruptcy remote Covered Bond Company (CBC)
through structure ✓ Recourse on CBC in case of NIBC default
Ratings: AAA/AAA (S&P/Fitch)
Collateral: Prime Dutch residential mortgage loans1 ✓ LCR eligible (bucket: L1) and favourable regulatory
Regulatory:
treatment
Documented minimum
15%
OC:
✓ De-linkage from issuer rating: a downgrade of the
Derivatives: None
Stable Ratings: issuer rating does not directly affect the covered
bond ratings
Asset monitor: EY
REGULATORY Index: ✓ iBoxx eligible
Law based, registered with the Dutch Central
Format:
Bank
✓ No swap counterparties
✓ Back-up administrator
Regulated status: UCITS and CRD compliant
Robust Structure: ✓ External account banks
✓ External sub-services
Label: ECBC Covered Bond Label ✓ Live cash flows
1: Owner-occupied residential mortgages only; buy-to-let mortgages are not eligible collateral for the cover pool 35COVERED BOND PROGRAMME: CONDITIONAL PASS-THROUGH STRUCTURE
TRANSACTION STRUCTURE WHAT HAPPENS IF THE CONDITIONAL PASS-THROUGH MECHANISM IS TRIGGERED?
▪ NIBC as issuer has a hard obligation (no option) to repay the covered bonds at ▪ Cash-flows received by the CBC are used to pay down the relevant outstanding
scheduled maturity date covered bonds
▪ Conditional pass-through structure addresses refinancing risk and ensures an ▪ The CBC attempts to sell a randomly selected part of the cover pool every 6
orderly wind-down of the Cover Pool in case of issuer default, avoiding the risk months. The sale is only carried out when the proceeds are sufficient to redeem
of a fire sale the relevant bonds at par
▪ If the pass-through mechanism is triggered, the respective series become pass- ▪ The Amortisation Test is not allowed to deteriorate
through covered bonds
CONDITIONAL PASS-THROUGH EXPECTED INCREASE OF OC IN PASS- COMPARISON COVERED BOND
MECHANICS THROUGH SCENARIO (PER 6 MONTHS)1 STRUCTURES
45%
Issuer Event of No Bullet Hard Bullet
Default Maturity 40%
Covered Bonds
35%
Yes 30%
25%
Amortisation Pass Bullet 20% Soft Bullet Extension
Test Maturity Covered Bonds Period
15%
Insufficient
Fail funds at
10%
maturity 5%
All CB’s Relevant CB 0% CPT Covered Extension Period
converted to converted to Bonds
Pass-Through Pass-Through
1: Assuming all bonds in pass-through mode, 5% CPR and no losses 36COVERED BOND PROGRAMME: TRANSACTION STRUCTURE
In a covered bond structure
Sub-servicers
payments to investors on the
bonds are guaranteed by the Principal
CBC. For this guarantee a NIBC
Investors
pool of Dutch prime Issuer Interest + Principal
residential mortgages is
segregated in the CBC NIBC
Servicer
Cover Pool
Guarantee
Monthly cash flows from the
borrowers are transferred to
the CBC without first
touching NIBC’s balance NIBC CBC
Collection Foundation Security Trustee
sheet Principal & Mortgage Guarantor Pledge of Receivables
Interest
Principal & Mortgage
Interest
Borrowers
37APPENDIX I
COVID-19: OVERVIEW OF
SELECTED POLICY MEASURES
FOR BANKS
38COVID-19
Overview of selected policy measures for banks
The Coronavirus (COVID-19) is having a significant impact on the global MEASURES WITH RESPECT TO CAPITAL
economy. Governments and other policy makers have taken serious ▪ Implementation start date Basel IV delayed from 2022 to 2023
measures to support the economy. This slide provides a high level ▪ Accelerated application (initially on 1/1/2021) of P2 requirements being able
overview of the measures taken by ECB/SSM/EBA/DNB/Basel to be partially met by capital instruments that do not qualify as CET 1 capital,
Committee towards the banking sector albeit that at least 56.25% must comprise of CET 1, 18.75% of AT1 and 25% of
Tier 2 instruments
In general banks are temporarily allowed to operate at lower levels
▪ Banks may temporarily operate below the Pillar 2 Guidance (P2G) and the
of capital and liquidity than normal
capital conservation buffer (CCB)
▪ Temporary postponement (for as long as necessary) of the introduction of the
MEASURES WITH RESPECT TO FUNDING AND LIQUIDITY floor on the AIRB risk weighting for Dutch mortgage loans
▪ In addition to the Asset Purchase Programme (APP) ECB announced in March ▪ Flexibility in prudential treatment of exposures backed by public support
2020 the EUR 750bn ‘Pandemic Emergency Purchase Programme’ (PEPP) measures and/or subject to eligible moratoria
▪ Relaxation of TLTRO III conditions and implementation of additional LTROs. The ▪ Recommendation urging banks not to pay out any dividends until 1 October
TLTRO III operation between June 2020 and June 2021 offers 3-year funding at a 2020. SSM informally confirmed there is currently no plan to suspend
rate of -0.75% if banks maintain current lending levels to euro area non- additional Tier 1 or Tier 2 payments
financial corporates and households (excluding loans for house purchases) MEASURES ON OPERATIONAL RELIEF
▪ Banks may temporarily operate below the required 100% level of the liquidity
▪ In general adjustment of prudential timetables, processes and deadlines
coverage ratio (LCR)
▪ DNB will - on a case-by-case basis - offer temporary relaxation to LSIs of asset
encumbrance limits
The measures support banks to focus on co-operating with its clients
to weather the challenging market conditions due to COVID-19
39
Most of the measures mentioned above were taken by the various European authorities after which DNB has taken comparable measures for Dutch LSI’sAPPENDIX II
MORTGAGE BUSINESS AT
NIBC
40MORTGAGE BUSINESS AT NIBC BANK
NIBC BANK’S MORTGAGE BUSINESS
▪ NIBC has outsourced its origination to independent intermediaries and its standard servicing activities to a third party. This has created a highly standardised and efficient
business model
▪ Special servicing is performed in-house to ensure tailor-made solutions to optimise recoveries
▪ NIBC Bank has a dedicated team to manage the relationship with the servicers and to monitor the quality of their servicing. A major emphasis is put on quality control
and on ensuring that all processes remain ISAE 3402 compliant
IN-HOUSE PERFORMANCE OF CORE ACTIVITIES OUTSOURCING OF STANDARDISED ACTIVITIES
▪ Origination: ▪ Origination is done via dedicated independent intermediaries
▪ NIBC Bank sets the underwriting criteria ▪ The underwriting criteria are highly standardized and hard coded in the
▪ Deviations from underwriting criteria can only be made when accepted by systems of the servicers
NIBC Bank ▪ Intermediaries can only originate mortgages that meet the underwriting
▪ Servicing: criteria
▪ The arrears management is performed in-house to ensure tailor-made ▪ Standard servicing activities are outsourced to specialized mortgage servicers
solutions to optimize recoveries STATER and Quion:
▪ Payments
▪ Administration
▪ First contact point for clients
41MORTGAGE BUSINESS AT NIBC BANK
BASIC PRINCIPLES ARREARS MANAGEMENT
▪ In 2006 NIBC Bank decided to take the arrears and foreclosure management in-house since NIBC Bank was confident that it could decrease arrears and losses via a result based approach.
▪ Employees have no insight into whether a loan has been securitized or transferred to the CBC or not.
▪ NIBC Bank uses the Salesforce CRM system in which the focus is on the client situation and performance is closely monitored through reporting and dashboards on a daily basis.
▪ Team Early (which is part of Special Servicing) tries to get in contact with the borrower to make a payment arrangement and indicates the financial situation. Special Servicing Mortgages (SSM)
will follow up or step in depending on the situation.
NIBC Early NIBC Special Servicing
Arrears of max 2 months All clients in arrears with life events1 or arrears > 2 months
EARLY SPECIAL SERVICING MORTGAGES
▪ During the 1st month arrears clients receive (if necessary) up to 4 letters and 5 calls. ▪ Specialized team including 1 account manager with extensive experience in (mortgage)
▪ Outbound calls within 6 days after first arrear is determined. credit management. Educated in restructuring mortgage loans.
▪ Mandate is maximum of two payment arrangements. ▪ Goal is to find the best structural solution; assess the situation and determine whether the
▪ Over 90% of new arrears recover within the first 2 months. problems are temporary or structural.
▪ Track and trace to get in contact with the client through multiple channels (e.g. Chamber of ▪ Client retention: preventing credit losses and meeting our duty of care.
Commerce, social media). ▪ Termination of the loan: limiting losses by maximizing foreclosure proceeds.
▪ Determine nature of problems (e.g. life events 1). ▪ Maximizing post-foreclosure proceeds.
▪ When arrear is indicated as incidental by Early the client can do a payment at once or a
simple arrangement is setup with the client.
▪ When client faces (temporary) financial hardship the client is allocated to the SSM team.
1: Life events: divorce, deceased, unemployment (because of incapacity)
42APPENDIX III
MAIN UNDERWRITING
CRITERIA
43MAIN UNDERWRITING CRITERIA
LAWS AND REGULATIONS AFFORDABILITY
▪ NIBC complies with: ▪ Steady income: Income is derived from the salary slip and proof of employment
▪ “Wet op het Financieel Toezicht” (WFT). Dutch Law or a so-called determination of income from paid employment
▪ Code of Conduct of Dutch Bankers Association (2013). The code concerns e.g. (‘Inkomensbepaling Loondienst’) executed by the intermediary based on data
minimum requirements to the borrower. from the Employee Insurance Agency (‘UWV’). In case of self-employed
▪ Temporary Rule of Mortgages. These guidelines concerns regulations to borrowers, a statement of income is drawn up by a certified calculation agent.
income and maximum loans and are yearly set by the government. ▪ Comply or Explain: a predetermined test is available (comply), but allows
▪ GDPR (General Data Protection Regulation). European Law, NIBC and Stater deviation if well-justified by the lender (explain). NIBC Direct origination only
are compliant to the requirements of the GDPR as applicable per May the 25 th concerns Comply.
2018. ▪ Actual interest rate: is taken into account unless the fixed rate term is under 10
years. In case of shorter terms a pre-determined rate is used or the loan must be
totally repaid at the end of the fixed rate term (only by annuity or linear).
▪ LTI: Loan-To-Income is maximized in line with the Code of Conduct. Calculations
are based on guidelines from the NIBUD (An independent institute focused on
household expenses).
44MAIN UNDERWRITING CRITERIA LOAN AND COLLATERAL CREDIT HISTORY AND FRAUD ▪ Maximum loan amount: EUR 1.000.000. Loans above EUR 750.000 are treated as ▪ Bureau for Credit Registration (BKR): Credit history is checked at BKR, ‘negative’ an overrule. BKR-registrations which are allowed by NHG can be done without overrules. All ▪ Maximum loan-to-Value: 100% and in case of energy saving facilities (EBV) 106%. the other ‘negative’ BKR registrations must be handed to the overrule desk. The ▪ NHG hurdle: EUR 310.000,- excl. EBV or EUR 328.600 incl. EBV BKR registration must be cured. Specific criteria and surcharges are used by the ▪ Non-NHG mortgages with loans above 80% of the Market Value are required to be overrule desk. covered by a mortality insurance. ▪ Stichting Fraudebestrijding Hypotheken (SFH): Fraud is checked at SFH which is ▪ The mortgage loan is secured by a first ranking mortgage right or a first and located at the BKR office and coordinated by the Dutch Banking Association. sequentially higher ranking mortgage right(s) over real estate, an apartment right ▪ A check is performed to verify the borrower’s identity. or a long lease (“erfpacht”) situated in the Netherlands. ▪ Kadaster (National Property Register): Additionally, a Kadaster check is ▪ The property value is determined by a recent valuation report (
APPENDIX IV
ASSET COVER TEST
46ASSET COVER TEST
Covered Bond Asset Cover Tests Minimum Cover Pool
Outstanding Bonds Test Outcome Higher of Asset Cover Test
LTV Cut-off +
other haircuts EUR 3.3bn1
110%1
1 x
Asset Percentage:
EUR 3.0bn 2 EUR 3.1bn x EUR 3.5bn
97.5%
3
Minimum OC:
15%
EUR 3.5bn
1
To meet the CRD requirements the LTV cut-off is included: For each mortgage receivable any amount
exceeding 80% of the indexed market value of the underlying collateral is not taken into account.
Other haircuts are also included.
2
Following their analysis the rating agencies communicate a minimum asset percentage. The amount
of bonds relative to the amount of assets cannot exceed this percentage.
3
An additional feature not present in most other Dutch programmes is the 15% minimum OC, which
is a hard commitment irrespective of changing environment or rating agency opinions. By Dutch law
the minimum nominal OC is set at 5%.
1: This amount differs every month based on the characteristics of the mortgages in the portfolio. In July 2020, the cover ratio was 110.07%. 47APPENDIX V
CONDITIONAL PASS-THROUGH
SCENARIOS
48CONDITIONAL PASS-THROUGH SCENARIOS
Conventional covered bonds: A combination of three events: bank default, sale of the pool not
possible and breach Amortisation test results in the following four scenarios:
1: The bank redeems the 2: The bonds are 3: If part of the cover pool 4: If in addition, the pool
bond at scheduled redeemed at maturity with cannot be sold to redeem deteriorates and the
maturity cash and sale of part of the the bonds at par, all bonds Amortisation test is
pool. Principal test holds to accelerate and the pool has breached, all bonds
protect later maturing to be sold, which may accelerate and the pool has
bonds result in a loss on the to be sold, which may
bonds result in a loss on the
bonds
Bond I Bond I Bond I Bond I
outstanding
outstanding
outstanding
outstanding
Bond II Bond II Bond II Bond II
time time time time
Conditional Pass-Through Covered bonds: A combination of three events: bank default, sale of the pool
not possible and breach Amortisation test results in the following four scenarios:
1: The bank redeems the 2: The bonds are 3: Pass-through is triggered 4: If in addition, the pool
bond at scheduled redeemed at maturity with at maturity if proceeds deteriorates and the
maturity cash and sale of part of the from sale of part of the Amortisation test is
pool. Amortisation test pool are not sufficient to breached, all bonds
holds to protect later redeem the bond in full become pass-through
maturing bonds bonds
Bond I Bond I Bond I Bond I
outstanding
outstanding
outstanding
outstanding
Bond II Bond II Bond II Bond II
time time time time
49APPENDIX VI
INVESTOR REPORTING AND
LEGAL FRAMEWORK
50COVERED BOND PROGRAMME: INVESTOR REPORTING
INVESTOR REPORTING FOR COVERED BONDS
▪ Best in class reporting of NIBC originated and/or NIBC serviced
transactions via www.assetbacked.nl
▪ Following a European Covered Bond Council (ECBC) initiative, the
Covered Bond Label was introduced in 2012
▪ NIBC covered bonds carry the Covered Bond Label and reporting is
done according to the (Dutch) National Transparency Template and the
(worldwide) Harmonised Transparency Template
▪ Free registration (details treated confidentially) and optional
subscription to automated e-mail service (new uploads are
automatically sent to recipients inbox)
▪ Investor queries via website and investor.services@nibc.com
▪ Investor reports always timely available, including full performance
information, portfolio split and bond information
51DUTCH LEGAL FRAMEWORK AND DACB
DUTCH LEGAL FRAMEWORK FOR COVERED BONDS
▪ The Dutch Covered Bond Decree is in place since 1 July 2008. As per 1 January 2015 the legislation has been upgraded and engrained at all three levels of legislation
including the highest Law on Financial Supervision (“WFT”)
▪ The main aim of the new legislation is to increase transparency and protection for investors. It is less principle based and more rule based. Amongst other, the following
is included:
▪ Obligation to be UCITS as well as CRR compliant. No ABS as eligible assets allowed.
▪ Specific definition of Covered Bonds as a product and description of the structure
▪ Role of the Dutch Central Bank (DNB) more described, including enhanced supervisory powers
▪ Minimum OC of 105% nominal and 100% according to Article 129 CRR
▪ 6 month liquidity reserve required
▪ Minimum reporting requirements towards investors
▪ NIBC, ING, ABN AMRO, Rabobank, De Volksbank, Van Lanschot, Achmea, Aegon and Nationale Nederlanden have their Covered Bond programmes registered with the
Dutch Central Bank
DUTCH ASSOCIATION OF COVERED BOND ISSUERS
▪ As a result of the strong growth of the Dutch covered bond market, in January 2011 the Dutch issuers decided to establish the Dutch Association of Covered Bond issuers
(DACB)
▪ Aim of the DACB is to strengthen the market and product offering of Dutch covered bonds through e.g. improving transparency, standardisation and general promotion
▪ The DACB was consulted in the making of the new regulations. More information can be found on www.dacb.nl
52Notes to the presentation
Parts of this presentation contain inside information within the meaning of article 7 of Regulation (EU) No
596/2014 (Market Abuse Regulation). This public announcement does not constitute an offer, or any
solicitation of any offer, to buy or subscribe for any securities in NIBC Holding N.V.
Forward-looking Statements
This presentation may include forward-looking statements. All statements other than statements of historical
facts may be forward-looking statements. These forward-looking statements may be identified by the use of
forward-looking terminology, including but not limited to terms such as guidance, expected, step up,
announced, continued, incremental, on track, accelerating, ongoing, innovation, drives, growth, optimising,
new, to develop, further, strengthening, implementing, well positioned, roll-out, expanding, improvements,
promising, to offer, more, to be or, in each case, their negative or other variations or comparable
terminology, or by discussions of strategy, plans, objectives, goals, future events or intentions. The forward-
looking statements included in this presentation with respect to the business, results of operation and
financial condition of NIBC Holding N.V. are subject to a number of risks and uncertainties that could cause
actual results to differ materially from such forward-looking statements, including but not limited to the
following: changes in economic conditions in Western Europe, changes in credit spreads or interest rates, the
results of our strategy and investment policies and objectives. NIBC Holding N.V. undertakes no obligation to
update or revise any forward-looking statement to reflect events or circumstances that may arise after the
date of this release.
53You can also read