A Class of Our Own 2021 FIRST QUARTER INVESTOR PRESENTATION

Page created by Laura Gordon
 
CONTINUE READING
A Class of Our Own 2021 FIRST QUARTER INVESTOR PRESENTATION
A Class of Our Own

          2021 FIRST QUARTER
          INVESTOR PRESENTATION
A Class of Our Own 2021 FIRST QUARTER INVESTOR PRESENTATION
Disclaimer

This presentation contains forward-looking statements within the meaning of          Forward-looking statements set forth herein speak only as of the date hereof,
Section 27A of the Securities Act of 1933, as amended, or the Securities Act, and    and we expressly disclaim any obligation or undertaking to update or revise any
Section 21E of the Securities Exchange Act of 1934, as amended, or the               forward-looking statement contained herein, to reflect any change in our
Exchange Act. Such forward-looking statements include, without limitation,           expectations with regard thereto, or any other change in events, conditions or
statements concerning our business and growth strategies, investment,                circumstances on which any such statement is based, except to the extent
financing and leasing activities and trends in our business, including trends in     otherwise required by law.
the market for long-term, triple-net leases of freestanding, single-tenant
                                                                                     THIS PRESENTATION CONTAINS HISTORICAL PERFORMANCE INFORMATION
properties. Words such as “expects,” “anticipates,” “intends,” “plans,” “likely,”
                                                                                     REGARDING STORE CAPITAL, AS WELL AS OTHER COMPANIES PREVIOUSLY
“will,” “believes,” “seeks,” “estimates,” and variations of such words and similar
                                                                                     MANAGED BY MEMBERS OF OUR SENIOR EXECUTIVE TEAM. SUCH PAST
expressions are intended to identify such forward-looking statements. Such
                                                                                     PERFORMANCE IS NOT A GUARANTEE OF FUTURE RESULTS.
statements involve known and unknown risks, uncertainties and other factors
which may cause our actual results, performance or achievements to be                This presentation contains references to our copyrights, trademarks and service

materially different from the results of operations or plans expressed or implied    marks and to those belonging to other entities. Solely for convenience,

by such forward-looking statements. Although we believe that the assumptions         copyrights, trademarks, trade names and service marks referred to in this

underlying the forward-looking statements contained herein are reasonable, any       presentation may appear without the “© “ or “TM” OR “sm” Symbols, but such

of the assumptions could be inaccurate, and therefore such statements included       references are not intended to indicate, in any way, that we will not assert, to

in this presentation may not prove to be accurate. In light of the significant       the fullest extent under applicable law, our rights or the rights of the applicable

uncertainties inherent in the forward-looking statements included herein, the        licensor to these copyrights, trademarks, trade names and service marks. We do

inclusion of such information should not be regarded as a representation by us       not intend our use or display of other companies’ trade names, copyrights,

or any other person that the results or conditions described in such statements      trademarks or service marks to imply a relationship with, or endorsement or

or our objectives and plans will be achieved. Furthermore, actual results may        sponsorship of us by, any other companies.

differ materially from those described in the forward-looking statements and         Definitions and footnotes for data provided herein are provided in the
may be affected by a variety of risks and factors including, without limitation,     appendix section of this presentation.
the risks described in our Annual Reports on Form 10-K, quarterly reports on
                                                                                     Unless otherwise indicated, data provided herein is as of March 31, 2021.
form 10-Q, and current reports on form 8-K.

2021 First Quarter Investor Presentation                                                                                                                                   2
A Class of Our Own 2021 FIRST QUARTER INVESTOR PRESENTATION
Contents

                                           4    STORE CAPITAL SNAPSHOT

                                           5    A CLASS OF OUR OWN

                                                     Our Asset Class. Our Market. Our Customers.

                                                     Our Business Model. Our Capital Structure.

                                                     Our Contract Quality.

                                                     Our External Growth, Internal Growth and Risk Adjusted Returns.

                                                     Our Portfolio. Our Investment Diversity. Our Top Ten Customers.

                                                     Our Investment Pipeline Activity.

                                                     Our Long Lease Terms and Superior Origination Platform.

                                                     Our Growth and Performance.

                                                     Our Corporate Responsibility: Commitment to All Stakeholders.

                                                     Highlights of Our Asset Class.

                                           25   APPENDIX (Important Supporting Information)

                                                     Dividend Growth and Protection. Portfolio Management Impact on Growth.

                                                     Portfolio Management Performance.

                                           29   FINANCIAL INFORMATION

                                           37   COVID-19 UPDATE

                                           39   DEFINITIONS AND FOOTNOTES

2021 First Quarter Investor Presentation                                                                                      3
A Class of Our Own 2021 FIRST QUARTER INVESTOR PRESENTATION
STORE Capital Snapshot

              NYSE: STOR; Profit-Center Real Estate; Baa2/BBB/BBB
                                                                          “We founded STORE
                                                                          based on a unique
                       ~30-year Successful Leadership Track Record        asset class of profit-
                                                                          center real estate. Our
                     $9.0B Equity Market Cap; $10.0B Gross Assets         focus on STORE
                                                                          Properties enables us
                                                                          to provide tailored
                     Sector Low 24% Unencumbered Asset Leverage           financing solutions to
                                                                          our targeted group of
                                                                          middle-market and
          2,656 Properties & 522 Leading National & Regional Tenants      larger customers,
                                                                          which results in the
                                                                          creation of value for all
             Sector-leading Diversity – Tenant, Industry & Geography
                                                                          our stakeholders.”

              STORE has a deep base of high-quality generalist and real   Mary Fedewa, CEO
                           estate dedicated stockholders

  2021 First Quarter Investor Presentation                                                            4
A Class of Our Own 2021 FIRST QUARTER INVESTOR PRESENTATION
STORE: A Class of Our Own
   STORE (stȯr): Single Tenant Operational Real Estate, or profit-center properties, is a real estate investment asset class
   distinguished by three payment sources which, combined with “table stakes”, enable net lease contract superiority to the
   underlying credit quality profile of the tenant.

                The Power of Profit Center Real Estate                                The “Table Stakes”
                     Single Tenant Operational Real Estate                    Ingredients Essential to the Asset Class
                     (An Important Third Payment Source)                           (Ensuring Contract Seniority)

                       Unit-Level Profitability
                               Unique to STORE

                           Corporate Credit
                           & Property Value
                    All real estate investors have this

  2021 First Quarter Investor Presentation                                                                                     5
A Class of Our Own 2021 FIRST QUARTER INVESTOR PRESENTATION
Broad-Based Market Need
   Creating stakeholder value begins with meeting broad-based needs and adding value to our customers.

      Nearly 200,000 Companies in STORE’s Target Market with ~26,000 Contacts in Proprietary Prospecting Database

      Rated
    Companies
                                   STORE’s                                               Small
                                                                                       Companies
                                   Target Market*

                                       *Companies with over $10MM in annual revenue.

                                                                                Do They Need Us?

                                                                                Are Institutional REITs the Best Capital Source?

                                                                                Can We Add Value?

                                                                                Fulfill our four Table Stakes?

                                                                                Direct Customer Relationships                          ~80% of Acquisitions

                                                                                Primary Lease Terms                                            Longer
    Opportunity                   Approx. same size as the
       to be                         world’s 4th largest                        Leasing Rationale                                  Capital Efficiency & Flexibility
     selective                           economy
                                                                                Triple Net Leases                                         Virtually Always

                                                                                Lease Form                                                      Ours

 2021 First Quarter Investor Presentation                                                                                                                             6
A Class of Our Own 2021 FIRST QUARTER INVESTOR PRESENTATION
STORE Tenant Profile

                                             STORE’s Customer Revenue Distribution1

       % of Total Rent & Interest                             25%

                                               17%                          19%                                   18%

                                                                                               11%
                                    7%
               3%

           $1B

       Market-Leading National and Regional Companies                               STORE’s Tenant Metrics

                                                                             ~73% of customers have revenues over $50 million

                                                                             Weighted average tenant revenues ~$815 million

                                                                             2019 Tenant revenue growth of >12%2

                                                                             Employ ~2.5m workers3

                                                                             Operate ~36,000 locations in 50 states4

                                                                             Repeat customers about one-third of new business

                                                                             Wtd. Avg. Tolerable Sales Fall-off: ~40%5

  2021 First Quarter Investor Presentation                                                                                      7
A Class of Our Own 2021 FIRST QUARTER INVESTOR PRESENTATION
STORE Delivers a Leading Net Lease Business Model
    STORE’s investor returns are foremost delivered by a strong corporate business model resulting in consistent and
    predictable performance.

        The Seven Net Lease Business Model Variables                          STORE's Historical Rank

                                                                                                        “The many measures of our
        1. Beginning Lease Yield                                                    Highest             success are reflective of our
                                                                                                        business model which has
                                                                                                        been tested and perfected
        2. Contractual Lease Escalations                                         Top Quartile           through our years of real
                                                                                                        estate investing. Our efforts
        3. Operating Profit Margin                                             Second Quartile          have resulted in a high
                                                                                                        quality and diverse
                                                                                                        investment portfolio which is
        4. Spread Between Lease Yield and Borrowing Cost                            Highest             maintained by our skilled
                                                                                                        portfolio management and
                                                                                                        servicing teams to deliver
        5. Spread Between Investment AFFO Multiple and Traded AFFO Multiple      Top Quartile
                                                                                                        consistent results.”

        6. Ability to Accretively Recycle Asset Sales Proceeds                   Top Quartile           -- Mary Fedewa, CEO

        7. Low Dividend Payout Ratio                                            Second Quartile

  2021 First Quarter Investor Presentation                                                                                              8
A Class of Our Own 2021 FIRST QUARTER INVESTOR PRESENTATION
STORE Stands Apart with a Fortress Balance Sheet
  “We have always believed in the power of the right-side of our balance sheet to lower our cost of capital and manage
  interest rate and investment risk. Uniquely having two means of investment-grade term borrowing is key to our balance
  sheet leadership.” – Catherine Long, CFO

                     Baa2/BBB/BBB Unsecured Term Borrowings                                                             AAA & A+ STORE Master Funding
                         Rated by Moody’s, S&P and Fitch Ratings                                                       Dedicated Asset-Backed SecuritiesConduit
                                                   A-/BBB+                STORE’s
                 Select Ratios                                                                   Able to maintain constant leverage enabling superior unsecured debt ratios
                                                 Net Lease Avg1     Unencumbered Assets2
   Debt/EBITDA                                        ~5x                     3.5x               Complete portfolio management flexibility

   Unencumbered assets/unsecured debt                 ~3x                     4.2x               Provides borrowing diversity & prepayment flexibility

   Debt service coverage                              ~5x                     7.0x               Non-recourse with minimal covenants

                  ~64% of assets @ 24% leverage (vs cost)                                                          ~33% of assets @ ~63% leverage
          About half the leverage of AAA-rated Master Funding notes,                                          45% Leverage to AAA & 25% More Leverage to A+
       STORE has among the lowest unencumbered asset ratio of any REIT.                                      Offers added credit support to unsecured noteholders.

                            Annual Cash Flows Compare Favorably to a Well-Laddered Debt Maturity Schedule

     $600

     $400                                                                                                                                                                Median
                                                                                                                                                                          debt
                                                                                                                                                                        maturities

     $200

        $0
              2016   2017   2018   2019   2020
                                                       Avg   2021     2022     2023    2024   2025    2026      2027    2028   2029    2030 2031-33 2034      After
                                                      Rate 3 2.4%      5.0%     5.1%   4.7%    4.2%   4.1%      4.4%    4.5%    4.6%   2.8%    N/A     4.0%       N/A
                                          4
                                                     Free Cash Flow and Proceeds from property sales
                                                     Debt Maturities
                                                     Debt is prepayable 24 months prior to maturity

  2021 First Quarter Investor Presentation                                                                                                                                           9
A Class of Our Own 2021 FIRST QUARTER INVESTOR PRESENTATION
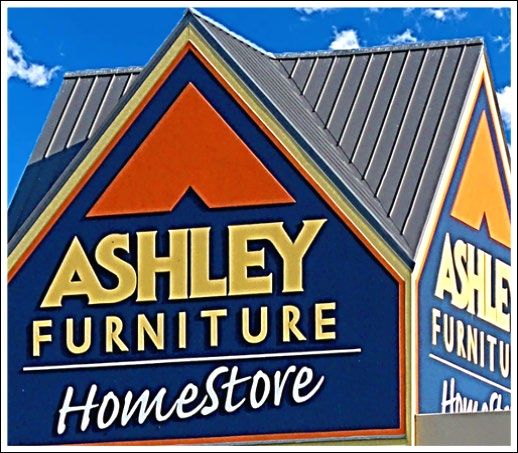
Creating Superior Contracts
            Our asset class allows for the creation of an investment-grade portfolio.

                                                                           Profit center real estate, as measured                                     Moody’s RiskCalc (EDF)
                                                                            by the STORE Score, improves the
                                                                               credit profile of our portfolio.                                       STORE Score 1
                          20%
                                                                           Median EDF               Median STORE Score
   % of Rent & Interest

                          15%

                          10%

                          5%

                          0%
                                   NR   C/D       B3          B2          B1      Ba3    Ba2      Ba1     Baa3      Baa2   Baa1   A3     A2      A1      Aa3    Aa2    Aa1     Aaa

                            Median Unit-Level Fixed Charge Coverage                                           STORE’s contracts remain strong with Median EDF and Median STORE
                                                                                                               Score remaining consistent with Q4 at Ba3 and Baa3, respectively.
            2.18            2.15    2.18   2.20        2.15        2.12        2.02   2.10   2.17

                                                                                                              STORE’s focus on unit-level profitability has remained unchanged with
                                                                                                               median contract coverage consistently over 2.0x.

           1Q19             2Q19    3Q19   4Q19    1Q20        2Q20         3Q20      4Q20   1Q21             The STORE Score is conservative, not accounting for qualitative credit
                                                                                                               enhancements or capital stack seniority.

  2021 First Quarter Investor Presentation                                                                                                                                              10
Business Model Leadership: External Growth
   Our business model delivers higher returns on equity with high margins of safety.

                                                                         Marginal Equity Return1

          11.5%

                                 9.7%                  9.4%                  9.4%
                                                                                                   8.8%
                                                                                                                          8.3%                  8.2%
                                                                                                                                                                      7.6%

       ¹ Information based on YTD 4Q 2020 reported results. For companies where the year-to-date lease rate on new acquisitions is not disclosed, the formula assumes a lease
       rate of 7.0%. Same Store NOI growth used as a proxy for contract lease escalator where the latter is not disclosed. For companies where neither is disclosed, the formula
       assumes a lease escalator of 1.5%. EBITDA margin is based on revenue less reimbursed property expenses and straight-line rent. Marginal interest rate is based on the
       current spread on unsecured debt outstanding over the 10-year treasury.

  2021 First Quarter Investor Presentation                                                                                                                                         11
Business Model Leadership: Internal Growth
   STORE leads in internal growth, from accretive property sales to contractual rent increases to low dividend payout ratios.

     Estimated Gross Internal Growth1

            Annual Rent              AFFO per Share                                              AFFO Growth from
              Growth                    Growth                                               Reinvested Free Cash Flow
                      1.0%               1.40%
                                                                                            AFFO Dividend Payout Ratio
                      1.3%               1.82%
                                                                                      65%         70%          75%       80%
                      1.5%               2.10%
                                                                                     3.49%       2.98%         2.46%     1.94%
                      1.8%               2.52%
                      2.0%               2.79%                                                AFFO Per Share Growth

                                                                                                                                 Our leading focus
                                          AFFO Growth from Reinvested Property Sale Proceeds                                     on internal growth
                                                      Portion of Beginning Portfolio Sold                                        is designed to
                                                  1%                 2%               3%                 4%              5%      enable STORE to
                             20bps               0.0%               0.1%             0.1%               0.2%             0.2%    realize attractive
   Sale Cap Rate vs
    Reinvestment
       Cap Rate

                             40bps               0.1%               0.2%             0.3%               0.3%             0.4%
                                                                                                                                 and consistent
                             60bps               0.1%               0.3%             0.4%               0.5%             0.6%
                                                                                                                                 AFFO per share
                             70bps               0.2%               0.3%             0.5%               0.7%             0.8%
                                                                                                                                 growth no matter
                                                                                                                                 the size of our

                                                             = >5%                                                               balance sheet.

  2021 First Quarter Investor Presentation                                                                                                            12
Contract Stability and Risk-Adjusted Returns
   With historic gross returns for STORE of ~10% versus ~7% for that of real estate leased to investment-grade tenants, STORE
   has a ~43% margin of safety.

                                             STORE’s Market                  Investment-Grade Tenants

                                                    Lease Yield + Escalators = Gross Return

                                             ~8% + 2% = ~10%                       ~6% + 1% = ~7%

                                         Contract Quality: Stable          53%-73% Non-IG in 10-20 Years

                                                  Actual Great Recession Performance

             Margin of
            Safety: 43%
                                                                    Between 2003 and 2012,
                                                                    including the Great
                                                                                                           MATERIAL
                                                 13.3X              Recession, a prior

                                                                                                        ALPHA
                                                                    portfolio created by
                   vs.                           MARGIN             STORE principals
                                                   OF               materially outperformed
                                                 SAFETY             returns from property
                                                                    leased to investment
                                                                                                           CREATION
                                                                    grade tenants.
           Cumulative
          Losses: 3.24%

  2021 First Quarter Investor Presentation                                                                                      13
Portfolio At A Glance
   Industry leading growth and consistency.

                                                                                                                                  As of March 31,

                                                                                                                      2021             2020           2019

                                                             Investment portfolio subject to Master Leases*1           94%              92%            91%

                                             Stakes
                                             Table
                                                             Average investment amount / replacement cost (new)2       80%              81%            81%

                                                             Locations subject to unit-level financial reporting3      99%              98%            98%

                                                             Proportion of portfolio from direct origination          ~80%             ~80%           ~80%
                                               Origination
                                                             Contracts on STORE’s form4                                96%              96%            94%

                                                             Weighted average annual lease escalation5                1.9%             1.9%           1.8%

                                                             Weighted average remaining lease contract term         ~14 years        ~14 years      ~14 years

                                                             Investment property locations                            2,656            2,552          2,334
                                               Diversity

                                                             States                                                     49               49             50

                                                             Customers                                                 522              491            447

                                                             Industries in which our customers operate                 117              113            109

                                                             Occupancy6                                               99.6%            99.5%          99.7%
                                             Management

                                                             Properties not operating but subject to a lease7         2.0%             2.2%           1.3%
                                              Portfolio

                                                             Investment locations subject to a ground lease8          0.9%             0.8%           0.9%

                                                             Median unit FCCR / 4-wall FCCR9                        2.2x / 2.7x      2.2x / 2.6x    2.2x / 2.6x

                                                             Contracts rated investment grade10                       ~72%             ~75%           ~75%

  2021 First Quarter Investor Presentation                                                                                                                        14
Diversification Across Industry Groups
  STORE’s focus is on creating a granular portfolio with non-correlated diversity.

                                                                                                                                            1
                                                                                                    Building      % Base Rent and Interest
                                                                                         # of        Sq. Ft.           As of March 31,
                                    Customer Industry Groups                          Properties (in thousands)   2021      2020     2019
                                    Res ta ura nts - Ful l Servi ce                      358         2,474        7.6%      9.0%    10.8%
                                    Res ta ura nts - Li mi ted Servi ce                  373         1,003        4.6%      5.0%     5.5%
                                    Ea rl y Chi l dhood Educa ti on                      249         2,655        6.0%      6.0%     5.7%
                                    Hea l th Cl ubs                                      88          3,068        5.0%      5.4%     5.3%
                                    Automoti ve Repa i r a nd Ma i ntena nce             187         1,009        4.8%      4.8%     3.8%
                                    Movi e Thea ters                                     37          1,881        3.7%      3.9%     4.8%
                                    Pet Ca re                                            183         1,717        3.6%      3.4%     3.5%
                                    Beha vi ora l Hea l th                               73          1,308        3.2%      2.8%     1.9%
                                    Lumber & Cons tructi on Ma teri a l s                124         5,638        3.1%      2.8%     2.9%
                                                                                                                                                SERVICE
                                    Fahmill y Enterta
                                                l     i nment                            37          1,529        3.0%      3.9%     3.9%
                                    Medi ca l a nd Denta l                               123         1,267        2.9%      2.8%     2.4%       Located near target
                                    El ementa ry a nd Seconda ry School s                15           799         2.8%      1.4%     1.4%       customers. Not
                                    Equi pment Sa l es a nd Lea s i ng                   51          1,301        2.0%      1.8%     1.2%       readily available
                                    Whol es a l e Automobi l e Aucti on                   8           428         1.2%      1.3%     1.3%
                                                                                                                                                online. Broad array
                                    Logi s ti cs                                         23          1,876        1.2%      1.2%     0.6%
                                                                                                                                                of everyday
                                    Meta l a nd Mi nera l Mercha nt Whol es a l ers      26          2,152        1.0%      0.9%     1.1%
                                    Al l Other Servi ce (21 i ndus try groups )          194         11,848       8.3%      8.4%     8.3%       services.
                                    Total Service                                       2,149        41,953       64.0%    64.8%    64.4%       (~64%)

                                                    Service industries account for more than
                                                       half of U.S. Employment and GDP.

  2021 First Quarter Investor Presentation                                                                                                                            15
Diversification Across Industry Groups (continued)

                                                                                                   Building      % Base Rent and Interest1

                                                                                        # of        Sq. Ft.           As of March 31,
                               Customer Industry Groups                              Properties (in thousands)   2021      2020     2019
                               Furni ture                                               66          3,847        4.3%      5.3%     5.6%
                               Fa rm a nd Ra nch Suppl y                                42          4,220        4.1%      4.5%     4.4%     RETAIL
                               Recrea ti ona l Vehi cl e Dea l ers                      29          1,216        2.1%      1.9%     1.5%     Internet resistant.
                               Hunti ng a nd Fi s hi ng                                  9           758         1.7%      1.8%     2.1%
                                                                                                                                             High experiential & service
                               Us ed Ca r Dea l ers                                     27           296         1.7%      1.7%     1.3%
                               Home Furni s hi ngs                                      11          1,262        1.2%      1.1%     0.7%     components.
                               New Ca r Dea l ers                                        9           273         0.7%      0.7%     0.7%     Located in retail corridors.
                               Al l Other Reta i l (11 i ndus try groups )              44          1,792        1.7%      1.8%     2.1%
                                                                                                                                             (~17%)
                               Total Retail                                             237         13,664       17.5%    18.8%    18.4%

                               Meta l Fa bri ca ti on                                   93          11,076       5.0%      4.4%     4.0%
                               Food Proces s i ng                                       21          2,754        2.4%      2.1%     0.5%
                               Pl a s ti c a nd Rubber Products                         20          3,186        1.8%      1.6%     2.4%     MANUFACTURING
                               Automoti ve Pa rts a nd Acces s ori es                   20          3,537        1.5%      1.0%     1.1%
                                                                                                                                             Strategically located in
                               Furni ture Ma nufa cturi ng                              12          2,980        1.3%      1.3%     1.9%
                               Aeros pa ce Product a nd Pa rts                          23          1,736        1.1%      0.8%     0.9%     industrial parks near
                               El ectroni cs Equi pment                                 11          1,006        1.0%      1.2%     1.4%     customers.
                               Al l Other Ma nufa cturi ng (16 i ndus try groups )      70          7,684        4.4%      4.0%     5.0%
                                                                                                                                             Broad array of industries
                               Total Manufacturing                                      270         33,959       18.5%    16.4%    17.2%
                                                                                                                                             providing everyday necessities.

                               Total Portfolio                                         2,656        89,576       100%     100%      100%     (~19%)

  2021 First Quarter Investor Presentation                                                                                                                                     16
Top 10 Customers1 Represent ~18% of Base Rent and Interest

                                 % Base Rent        # of      STORE Capital
                                 and Interest2   Properties   Customer

                                                              Spring Education Group (formerly Stratford School and Nobel Learning Communities) is the largest pure play US platform focused
   1                                3.0%            27        on preschool and K-12 education. Spring’s diversified collection of brands operates over 230 schools in 18 states & D.C. The
                                                              company is owned by Asia-based investment firm, Primavera Capital.

                                                              Fleet Farm Group dba Fleet Farm is a full-service merchant with more than 45 locations in four mid-western states, offering a broad
   2                                2.4%             9        assortment of goods from hunting gear to lawn, garden and farm supplies. The company is owned by the private equity firm KKR &
                                                              Co since 2016. In 2018 the store name was changed from Mills Fleet Farm to Fleet Farm.

                                                              Great Outdoors Group operates retail locations under the Bass Pro Shops and Cabela’s monikers, offering outdoor gear and apparel
   3                                1.8%            10        in an immersive setting. These two iconic brands, combined, operate approximately 170 retail and marine centers. Both concepts are
                                                              market leaders and highly respected within their respective niche of outdoor products.

                                                              Cadence Education is an Apax Partners private equity owned company and is one of the premier early childhood educators in the
   4                                1.8%            49        United States, operating more than 200 private preschools and elementary schools as members of the Cadence Education Family of
                                                              Schools across the country.

                                                              Dufresne Spencer Group is a top 20 operator in the ~$60 billion US furniture retailing industry and the largest Ashley’s Furniture
   5                                1.7%            25        HomeStore licensee with 123 stores. DSG is backed by a seasoned management team with a strong operating history and garnered
                                                              an investment from Ashley Corporate in December 2017.

                                                              U.S. LBM Holdings, founded in 2009, is a collection of leading building material distributors across 30 states with more than 250
   6                                1.6%            57        locations. The company serves as a critical link in the building materials supply chain, supplying more than 60,000 stock keeping
                                                              units (“SKUs”) for custom homebuilders and specialty contractors. US LBM was acquired by Bain Capital in 2020.

                                                              CWGS Group (NYSE:CWH), dba Camping World, is the nation’s largest retailer of recreational vehicles, RV accessories and RV-related
   7                                1.6%            20        services operating over 170 locations. The company's Good Sam organization and family of programs and services uniquely enables
                                                              them to connect with their customers as stewards of the RV enthusiast community and lifestyle.

                                                              AMC Entertainment (NYSE:AMC), is the largest movie exhibition company in the world with over 1,000 theatres and 11,000 screens
   8                                1.4%            14        across the globe, AMC operates among the most productive theatres in the United States’ top markets, having the #1 or #2 market
                                                              share positions in 21 of the 25 largest metropolitan areas of the United States.

                                                              Zips Holdings is one of the largest car wash operators in the US with 200 locations across 17 states in the South, Southeast and
                                                              Mid-Atlantic. The Company is owned by founder, Brett Overman who partnered with Equity Investment Group and Britton Hill
   9                                1.3%            42        Partners and in 2020 received an additional investment from Atlantic Street Capital to help facilitate continued growth.

                                                              Loves Furniture is an 18-unit operator in the Midwest that combines a personalized shopping experience with a wide variety of
                                                              quality and stylish products for every budget. Loves offers a variety of store formats selling furniture & mattresses as well as flooring,
   10                               1.3%            16        home accents & bedding essentials. Loves is backed by Texas-based US Assets.

                                   17.9%           269        TOTAL TOP 10 CUSTOMERS

  2021 First Quarter Investor Presentation                                                                                                                                                                 17
Investment Pipeline Activity
    STORE’s emphasis is on Service, Manufacturing and Select Retail sectors having high potential for long-term relevance.

                    Pipeline Velocity During Q1 2021                                        Pipeline Sector Distribution
                                                                                                  as of 03/31/2021
    $18
    $16
    $14                                                                                           Gyms 1% Storage 4%
                                                                                 Education 4%                      Auto Maintenance 7%
    $12
               Starting           New          Deals         Ending       RV/Auto Dealers 9%
    $10        Pipeline                                      Pipeline                                                      Entertainment 6%
                                 Deals        Passed /
     $8        $12.4B            Added         Closed        $12.4B
                                                                         Restaurants
                                 $2.4B         $2.4B
     $6                                                                      8%

     $4
     $2
     $0                                                                                          Our pipeline
                                                                                              continues to mirror               Other
                                                                                                                               Service
                                                                                Specialty       STORE’s current                 15%
                               Opportunity Size                                   Med
                                                                                  11%
                                                                                                   portfolio.

     Profit Center Real Estate Market Size:              $3.9 Trillion
                                                                                                                      Other
                                                                                                                      Retail
     Number of Target Market Companies:                    200,000                          Manufacturing              14%
                                                                                                21%

     Our Target Contact Database:                         ~26,000

     Our Existing Customers:                                 522

  2021 First Quarter Investor Presentation                                                                                                    18
Sector Leading Long Lease Terms and Low 5-Year Maturities
            STORE’s direct origination of long lease terms means low lease rollover risk.

                                                                                Leases Expiring Next 5 Years1
                             40%

                             35%
   Percentage Of Portfolio

                             30%

                             25%

                             20%

                             15%     2021       2022     2023       2024      2025

                             10%

                             5%

                             0%
                                    STOR               Essential           4 Corners      Agree        Spirit        NNN             Realty Inc    VEREIT

                                                  STORE’s Direct Origination Platform Creates Consistent Lease Duration2
                             20
  Lease Duration (years)

                             15

                             10

                              5
                                   18Q3          18Q4              19Q1         19Q2       19Q3       19Q4        20Q1        20Q2          20Q3     20Q4
                                          Realty Inc          Spirit           Agree       NNN        4 Corners      VEREIT           Essential    STOR

  2021 First Quarter Investor Presentation                                                                                                                  19
The Gold Standard in Origination Platforms
                                 STORE’s direct origination platform creates consistent lease cap rates and duration.

                                            16%
                                                     STORE is a Leader in Direct Origination                                                                   Most Diversified
         Lease Intangibles / Total Assets

                                                     Lease Intangibles vs. Total Assets1                                                                        Tenant Base
                                            14%
                                            12%
                                                                                                                                                             (% Top 5 Tenants, based on
                                            10%
                                                                                                                                                                   annual rent 2)
                                            8%
                                            6%
                                            4%
                                            2%                                                                                                                     STORE     11%
                                            0%
                                                         STOR        NNN    Essential 4 Corners           Spirit    Realty Inc    VEREIT        Agree                SRC     12%

                                                                                                                                                                    EPRT     13%

                                            9.75%
                                                         STORE is a Leader in Lease Duration & Gross Returns                                                       VEREIT     17%
 (Initial Cap Rate Plus Contract Bumps)

                                                         Lease Durations vs. Gross Cap Rates3
     Weighted Avg. Gross Cap Rate

                                            9.25%
                                                                                                                                                                     NNN      21%

                                            8.75%
                                                                                                                                                                        O     21%
                                            8.25%
                                                                                                                                                                     ADC      23%
                                            7.75%
                                                                                                                                                                     FCPT           79%
                                            7.25%
                                                    11          12         13            14          15            16        17            18           19
                                                                                Weighted Average Lease Duration (in years)

               2021 First Quarter Investor Presentation                                                                                                                                   20
Growth and Performance
   STORE excels at providing consistently high stockholder returns.

           Acquisition and Disposition Volume ($MM)1                                               NOI, AFFO and Net Income ($MM)2
                                                                                                        $655                $672
                    $1,689                                                              $537
  $1,626
                                                                                                           $458                $463
                                                                                            $378
                                     $1,086
                                                                                                                  $285
                                                                                                 $217                                $213
                             $429                                                                                                           $172       $178
           $228                               $261    $264             $271                                                                     $120        $125
                                                                              $141                                                                 $63
                                                              $21                                                                                              $55

     2018                 2019              2020        Q1 2020         Q1 2021            2018            2019                2020           Q1 2020           Q1 2021
                             Acquisitions      Dispositions                                                    NOI      AFFO          Net Income

        STORE Annual Shareholder Return Performance                                                      Per Share Annual Growth
                  2015       2016      2017          2018      2019       2020
                                                                                                        $2.25
  STOR            12.6%      11.0%     10.6%         14.0%     36.7%      -3.4%          AFFO:
                                                                                         4.2%
  S&P 500         1.4%       12.0%     21.8%         -4.4%     31.5%      18.4%                         $1.75

  RMZ             2.5%       8.6%      5.1%          -4.6%     25.8%      -7.6%
                                                                                                        $1.25
                                                                                      DIVIDENDS:
                                                                                         6.4%
     STORE Cumulative Shareholder Return Performance
                                                                                                        $0.75
              Six Year Five Year Four Year Three Year Two Year One Year
                                                                                         NET
  STOR            13.0%      13.1%     13.6%         14.6%     14.9%      -3.4%                         $0.25
                                                                                       INCOME:
                                                                                         4.3%                        2015     2016     2017       2018   2019    2020
  S&P 500         12.8%      15.2%     16.0%         14.2%     24.8%      18.4%
                                                                                                                     AFFO             Dividends          Net Income
  RMZ             4.4%       4.8%      3.9%          3.5%      7.8%       -7.6%      Compound Annual
                                                                                     Growth Rate

                                                                                                                                                                          21

 2021 First Quarter Investor Presentation                                                                                                                                      21
Corporate Responsibility: Our Commitment to All Stakeholders
    Our definition of success: making a positive difference for our stakeholders.

  Environmental, Social,
  Governance (ESG) ratings                                      7*                                   3*                                     2*

  reported by Institutional                    Environmental                           Social                             Governance

  Shareholder Services (ISS)
  provide insight for
  investors on how                                             STORE seeks to deliver stable, predictable, investment-grade stockholder
                                             Stockholders      performance and superior Market Value Added.
  companies perform in key
  areas of sustainability.
                                                               STORE real estate capital solutions enable improved customer wealth
                                              Customers        creation and increased workforce and leadership opportunities.
  STORE Capital’s ISS
                                              Employees        STORE promotes employee opportunity, education, engagement and diversity.
  Quality Score ratings
  compare favorably to our
                                                               STORE provides opportunities to professional, supplier and service vendors
                                              Suppliers
  peers in the net lease                                       to prosper through fair business practices and dependable engagements.

  sector.
                                                               STORE contributes to our community and many communities across the country
                                             Communities       through our multiple investments and associated career opportunities.

  *’1‘ represents the highest quality and                      STORE works to promote and improve environmental conscientiousness
  lowest risk.                               Environment       through our attention to and promotion of environmental stewardship.

  2021 First Quarter Investor Presentation                                                                                                       22
Corporate Responsibility at the Forefront in 2020
    STORE’s commitment to sustainability, community, social responsibility and governance was reinforced this past year.

                                                  Hosted Annual Two-Day Customer Event
                                                  New recognition for customers who developed exceptional environmental,
                                                  sustainability, and social responsibility programs of their own. Acknowledged the
                                                  efforts of customers who developed and instituted the use of biodegradable plastics
                                                  and established innovative employee engagement practices.

                                                  Enhanced Corporate Governance
                                                  Added new independent director, Tawn Kelley, a seasoned executive in the real
                                                  estate finance industry, to the board. Independent directors comprise 78% of the
                                                  Board; women represent 33%.

                                                  Provided Customer Pandemic Resources
                                                  Created COVID-19 resource center to serve our middle market tenants, with
                                                  online resources and a dedicated internal team to help them navigate the
                                                  various lending programs.

                                                  Published first ever Corporate Responsibility Report
                                                  To view the report, visit https://www.storecapital.com/wp-
                                                  content/uploads/STORE_Capital_2020_Corporate_Reponsibility_Report.pdf

                                                   Hosted 2020 Virtual Externship
                                                   A professional development program for students who were adversely
                                                   impacted by the pandemic that are interested in finance and real estate.

                                                      124      Participants                             Countries
                                                                                                5

                                                       54      Colleges / Universities          20      STORE Presenters

                                                       22      States                         ~ 50%     Minority Participants

  2021 First Quarter Investor Presentation                                                                                              23
A CLASS
                                                                           OF OUR OWN

                                     1.    A Class Of Our Own – STORE Properties

                                     2.    Consistent and Effective Business Model

                                     3.    Strong Internal Growth by Design

                                     4.    Fortress Balance Sheet

                                     5.    Direct Origination, Delivering Superior Returns

                                     6.    Long Lease Terms, Low Renewal Risk

                                     7.    Extensive Portfolio Diversity

                                     8.    Highly Liquid & Granular Portfolio Assets

                                     9.    A Demonstrated Commitment To All Our Stakeholders

2021 First Quarter Investor Presentation                                                       24
APPENDIX

     2021 FIRST QUARTER
     INVESTOR PRESENTATION
Strong Protected Dividend Growth
    STORE has posted strong dividend growth and protection.

                         50%
                                                             STORE’s Dividend Per Share Growth1
                         45%
                         40%
   Our dividend
                         35%
       growth is
                         30%
     the highest         25%                                                                             5-Year Compound Growth
 among our net           20%
                                                                                                                STOR   6.3%
                                                                                                                  ADC  5.5%
  lease peers…..         15%                                                                                     FCPT  5.5%
                                                                                                                    O  3.8%
                         10%
                                                                                                                 NNN   3.6%
                          5%
                          0%
                                             2015           2016           2017            2018               2019                2020

                          100%
                                                                      AFFO Payout Ratio2
                           95%
                           90%
         …and our
                           85%
        dividends
                           80%
       are among
                           75%
         the most
                           70%
        protected.
                           65%
                           60%
                                     18Q3     18Q4   19Q1      19Q2     19Q3      19Q4   20Q1     20Q2        20Q3      20Q4

  2021 First Quarter Investor Presentation                                                                                               26
Portfolio Management Impact on Growth
    Actively managing the portfolio creates accretive internal growth and demonstrates liquidity for STORE assets.

                           STORE’s Asset Sales Have Added                                               STORE’s Asset Sales Have Been
                               To Our Internal Growth                                                   At Gains Over Our Original Cost
                                   2016   2017    2018     2019     2020     Avg
                                                                                      Property Sales Type           2016    2017   2018   2019   2020    Avg
   Disposition Cap Rate
                                   7.5%   7.6%    7.1%     7.5%     7.4%     7.4%
   (Occupied Property Sales)

   Acquisition Cap Rate            7.9%   7.8%    7.9%     7.8%     8.1%     7.9%     Opportunistic                 20%      21%   20%    19%    19%     20%

   Spread                          0.4%   0.2%    0.8%     0.3%     0.7%     0.5%
                                                                                      Strategic                     0%       8%    5%     7%     2%      4%
   Percent of Portfolio Sold       1.9%   5.0%    3.7%     5.6%     2.7%     3.8%

   Internal Growth
                                   0.2%   0.2%    0.5%     0.3%     0.1%     0.3%     Property Management           -6%      -9%   2%     -28%   -33%   -15%
   Contribution
                                   2016   2017    2018     2019     2020     Total
                                                                                      Total Gain/(Loss) vs. Cost    10%      5%    10%    5%     (8%)    5%
   Revenue Accretion ($000's)      $512   $852    $2,519   $1,831   $540    $6,254

                                                 STORE is a Leader in Profitable Asset Sales1 Activity
                                                              ADC          FCPT      NNN          O         STORE

               $1,400
    MILLIONS

               $1,200
               $1,000
                $800
                $600
                $400
                $200
                   $-
                        2016                        2017                             2018                                  2019                         2020

  2021 First Quarter Investor Presentation                                                                                                                     27
Portfolio Management Performance (through December 31, 2020)
       Average annual portfolio performance on more than $11 billion of investments since 2011 inception.

5.0%
4.5%                                                                                                                                             Shareholder
                                                                                                                                                   Internal
4.0%                                                                                                                                               Growth
                                                                                                                                                 (Leveraged)
3.5%                                                                    (0.37%)
                                         +0.06%                                                                                                      ~5%
3.0%                                                                                                 (0.32%)
              Beginning
2.5%       Internal Growth                                                                                               Ending Internal
                                                                                                                            Growth
2.0%
               +3.6%
1.5%                                                                                                                        +3.0%
1.0%
0.5%
0.0%

                                         PORTFOLIO                   PROPERTY                     PROPERTY                      INTERNAL GROWTH
         INTERNAL GROWTH
                                        MANAGEMENT                  MANAGEMENT                   MANAGEMENT                       (UNLEVERAGED)
          Growth by design
                                     Ability to realize gains    Ability to manage losses      Work in Process (WIP)                   3.0%
        Annual Rent                Avg. Rent Related to
                                                                 Resolved                     Unresolved                         Growth Adjusted for
        Increase           +1.9%   Property Sales     ~1.04%
                                                                 Credit Events   ~(1.28)%     Credit Events   ~(0.32)%           Equity Capitalization
        Reinvested                 Avg. Cap Rate
        Cash Flow1         +1.7%   Spread             ~0.67%     Recovery (~71%) ~+0.91%                                            (~60% at cost)
                                                                                                                             Shareholder Internal Growth
        Base Int. Growth   +3.6%   AFFO Impact          ~0.06%   Net Credit Loss   ~(0.37)%   WIP Drag        ~(0.32)%            (Leveraged) ~5%

         STORE’s table stakes and proactive portfolio management result in margins of safety and delivers a high level of internal growth.

   2021 First Quarter Investor Presentation                                                                                                                    28
FINANCIAL INFORMATION

           2021 FIRST QUARTER
           INVESTOR PRESENTATION
Condensed Consolidated Statements of Income

                                                                                      Three Months Ended
                                                                                           March 31,
                       $ thousands, except share and per share data                  2021                   2020
                        Revenues:                                                            (unaudited)
                           Rental revenues                                          $ 169,328               $ 163,350
                           Interest income on loans and financing receivables             12,563                  11,482
                          Other income                                                       370                   3,065
                        Total revenues                                                   182,261                 177,897
                        Expenses:
                           Interest                                                       41,828                  41,694
                           Property costs                                                  4,663                   6,004
                           General and administrative                                     25,006                   7,879
                           Depreciation and amortization                                  63,567                  59,338
                          Provisions for impairment                                        7,350                   2,900
                        Total expenses                                                   142,414                 117,815
                        Other Income:
                           Net gain on dispositions of real estate                        15,670                   2,746
                           Loss from non-real estate, equity method investment              (363 )                     -
                        Income before income taxes                                        55,154                  62,828
                          Income tax expense                                              194                     168
                        Net income                                                   $ 54,960                $ 62,660

                        Net income per share of common stock - basic and diluted     $      0.21             $      0.26

                        Dividends declared per common share                          $      0.36             $      0.35

                        Weighted average common shares outstanding – basic         266,366,698             243,355,486
                                                                   – diluted       266,366,698             243,355,486

2021 First Quarter Investor Presentation                                                                                   30
Condensed Consolidated Balance Sheets

 $ thousands, except share and per share data                                              March 31, 2021      December 31, 2020
 Assets                                                                                     (unaudited)            (audited)
 Investments:
     Real estate investments:
       Land and improvements                                                                   $ 2,825,125           $ 2,807,153
       Buildings and improvements                                                                6,171,711             6,059,513
       Intangible lease assets                                                                      61,634                61,634
     Total real estate investments                                                               9,058,470             8,928,300
     Less accumulated depreciation and amortization                                               (992,258)             (939,591)
                                                                                                 8,066,212             7,988,709
    Real estate investments held for sale, net                                                           -                22,304
    Operating ground lease assets                                                                   34,341                34,683
    Loans and financing receivables, net                                                           671,565               650,321
 Net investments                                                                                 8,772,118             8,696,071
 Cash and cash equivalents                                                                         145,565               166,381
 Other assets, net                                                                                 136,824               141,942
 Total assets                                                                                  $ 9,054,507           $ 9,004,340

 Liabilities and stockholders' equity
 Liabilities:
     Credit facility                                                                           $           -         $           -
     Unsecured notes and term loans payable, net                                                   1,510,172             1,509,612
     Non-recourse debt obligations of consolidated special purpose entities, net                   2,192,172             2,212,634
     Dividends payable                                                                                97,203                95,801
     Operating lease liabilities                                                                      39,039                39,317
     Accrued expenses, deferred revenue and other liabilities                                        124,516               131,198
 Total liabilities                                                                                 3,963,102             3,988,562
 Stockholders' equity:
     Common stock, $0.01 par value per share, 375,000,000 shares authorized, 270,008,071
        and 266,112,676 shares issued and outstanding, respectively                                  2,700                 2,661
     Capital in excess of par value                                                              5,597,279             5,475,889
     Distributions in excess of retained earnings                                                 (506,141)             (459,977)
     Accumulated other comprehensive loss                                                           (2,433 )              (2,795 )
 Total stockholders' equity                                                                      5,091,405             5,015,778
 Total liabilities and stockholders' equity                                                    $ 9,054,507           $ 9,004,340

2021 First Quarter Investor Presentation                                                                                             31
Funds From Operations and Adjusted Funds from Operations1

                                                                                               Three Months Ended
                                                                                                    March 31,
                       $ thousands, except per share data                                   2021                2020
                                                                                                   (unaudited)
                        NET INCOME                                                          $ 54,960            $ 62,660
                          Depreciation and amortization of real estate assets                  63,507              59,255
                          Provision for impairment of real estate                               5,350               2,900
                          Net gain on dispositions of real estate                             (15,670)             (2,746)
                        FUNDS FROM OPERATIONS (FFO)2                                       $ 108,147           $ 122,069
                        Adjustments:
                          Straight-line rental revenue, net:
                              Fixed rent escalations accrued                                   (1,511)             (1,265)
                              Construction period rent deferrals                                  628                 526
                          Amortization of:
                            Equity-based compensation                                         12,905              (3,572)
                             Deferred financing costs and other noncash interest expense       2,100                2,142
                             Lease-related intangibles and costs                                 827                  675
                          Provision for loan losses                                            2,000                    -
                          Lease termination fees                                                   -                 (237)
                          Capitalized interest                                                  (214)                (229)
                          Loss from non-real estate, equity method investment                    363                    -
                        ADJUSTED FUNDS FROM OPERATIONS (AFFO)2                             $ 125,245           $ 120,109

                        Net Income per share of common stock - basic and diluted3          $    0.21           $     0.26

                        FFO per share of common stock – basic and diluted3                 $    0.41           $     0.50

                        AFFO per share of common stock – basic and diluted3                $    0.47           $     0.49

2021 First Quarter Investor Presentation                                                                                     32
GAAP Reconciliations

                                  Net Income to FFO and AFFO1                                                                        Net Income to Net Operating Income
                                                                               Year Ended                                                                                     Year Ended           Three Months Ended
$ millions (unaudited)                                                                                 $ millions (unaudited)
                                                                              December 31,                                                                                   December 31,               March 31,
                                                                     2018        2019         2020                                                                      2018    2019      2020       2020      2021
NET INCOME                                                          $ 217.0     $ 285.0      $ 212.6   NET INCOME                                                       $217.0   $285.0   $212.6    $62.7     $55.0
  Depreciation and amortization of real estate assets               180.9       221.6        242.7     Adjustments:
  Provision for impairment of real estate                             5.2        18.7         22.0
                                                                                                         Interest                                                       129.1    158.4    169.7     41.7       41.8
  Net gain on dispositions of real estate2                          (45.4)      (84.1)       (22.8)
                                                                                                         General and administrative                                      45.7     54.3     49.7      7.9       25.0
FUNDS FROM OPERATIONS (FFO)4                                        $ 357.6     $ 441.2      $ 454.5
Adjustments:                                                                                             Depreciation and amortization                                  181.8    222.0    242.9     59.3       63.6
  Straight-line rental revenue:                                                                          Provisions for impairment                                       7.8      18.7     23.0      2.9       7.3
    Fixed rent escalations accrued                                   (6.1)       (6.0)        (8.1)
                                                                                                         Net gain on dispositions of real   estate2                     (45.5)   (84.1)   (22.8)    (2.7)     (15.7)
    Construction period rent deferrals                                6.6         1.6          1.9
  Amortization of:                                                                                       (Income) loss from non-real estate, equity method investment     -        -      (3.5)       -        0.4

     Equity-based compensation                                        8.6        11.7          4.7       Income tax expense                                              0.6      0.7      0.6       0.1       0.2
     Deferred financing costs and other noncash interest expense3     9.5         9.7          8.8
                                                                                                       NET OPERATING INCOME                                             $536.5   $655.0   $672.2   $171.9     $177.6
     Lease-related intangibles and costs                              2.4         2.9          3.0
  Provision for loan losses                                           2.6          -           1.0
  Lease termination fees                                               -         (4.1)        (0.6)
  Capitalized interest                                               (2.6)       (1.6)        (0.7)
  (Income) loss from non-real estate, equity method investment         -           -          (3.5)
  (Gain) loss on defeasance/extinguishment of debt                   (0.8)        0.7           -
  Executive severance costs                                            -          2.0          2.0
ADJUSTED FUNDS FROM OPERATIONS (AFFO)4                              $ 377.9     $ 458.1      $ 463.0

       2021 First Quarter Investor Presentation                                                                                                                                                                       33
GAAP Reconciliations - Leverage

                   Debt to Adjusted Debt1                                                                  Net Income to Adjusted EBITDAre1
                                                                  As of                                                                                                           Three Months Ended
$ millions (unaudited)                                                            $ millions (unaudited)
                                                              March 31, 2021                                                                                                        March 31, 2021
Credit facility                                                   $         -     NET INCOME                                                                                               $ 55.0
                                                                                  Adjustments:
Unsecured notes and term loans payable, net                           1,510.2
                                                                                     Interest                                                                                                 41.8
Non-recourse debt obligations of consolidated special
                                                                      2,192.2        Income tax expense                                                                                        0.2
purpose entities, net
                                                                                     Depreciation and amortization                                                                            63.6
                                                                                  EBITDA                                                                                                     160.6
TOTAL DEBT                                                        $ 3,702.4       Adjustments:
Adjustments:                                                                         Provision for impairment of real estate                                                                   5.3
   Unamortized net debt discount                                          5.1        Net gain on dispositions of real estate                                                                 (15.7 )
                                                                                  EBITDAre                                                                                                   150.2
   Unamortized deferred financing costs                                 33.7
                                                                                  Adjustments:
   Cash and cash equivalents                                          (145.6)
                                                                                     Provision for loan losses                                                                                 2.0
   Restricted cash deposits held for the benefit of lenders              (4.9 )      Loss from non-real estate, equity method investment                                                       0.4
                                                                                  ADJUSTED EBITDAre                                                                                        $ 152.6
ADJUSTED DEBT                                                     $ 3,590.7       Estimated adjustment to Adjusted EBITDAre as if all real estate acquisitions and dispositions
                                                                                     for the quarter ended March 31, 2021 had occurred as of January 1, 2021                                   2.0
                                                                                  ADJUSTED EBITDAre – CURRENT ESTIMATED RUN RATE                                                           $ 154.6

                                                                                  ANNUALIZED ADJUSTED EBITDAre                                                                             $ 610.4
                                                                                  ANNUALIZED ADJUSTED EBITDAre – CURRENT ESTIMATED RUN RATE                                                $ 618.4

                  ADJUSTED DEBT / ANNUALIZED ADJUSTED EBITDAre                                                                                                             5.9x

                  ADJUSTED DEBT/ ANNUALIZED ADJUSTED EBITDAre – CURRENT ESTIMATED RUN RATE                                                                                 5.8x

2021 First Quarter Investor Presentation                                                                                                                                                               34
Long-Term Debt Maturities

                                                  Remainder
    $ thousands                       Total                       2022       2023       2024       2025         2026       2027         2028       2029       2030         2031-2033       2034         Thereafter
                                                   of 2021

    Unsecured notes payable          $1,425,000      $        -    $75,000    $     -   $100,000    $       -   $200,000    $       -   $350,000   $350,000   $350,000        $        -    $       -       $        -

    Unsecured term loans                100,000     100,000              -          -          -            -          -            -          -          -            -               -            -                -

    Non-recourse mortgage notes:

      STORE Master Funding1           2,033,562      21,343         24,473    264,636    335,861    271,520      292,518    466,174        1,900      1,900      1,900            5,700     345,637                  -

      Other secured notes               182,618          3,382      38,290     25,179     10,811        2,557     55,052        1,232      1,287     36,583          490          1,611           588           5,556

    Total                            $3,741,180    $124,725       $137,763   $289,815   $446,672   $274,077     $547,570   $467,406     $353,187   $388,483   $352,390        $7,311       $346,225          $5,556

1   Prepayable, without penalty, 24 or 36 months prior to maturity.

            2021 First Quarter Investor Presentation                                                                                                                                                                 35
Credit Facility and Unsecured Notes Covenants

                 Presented below is a summary of the key financial covenants as they relate to STORE’s unsecured debt, which
                 consists of:
                          •   Unsecured Revolving Credit Facility (Credit Facility)
                          •   Note Purchase Agreements (NPAs)
                          •   Senior Unsecured Notes (Public Notes)

                 Such covenants are defined and calculated in accordance with the terms of the Credit Facility, the NPAs and the
                 governing documents of the Public Notes. The NPAs contain financial covenants that are similar to those of the
                 Credit Facility; therefore, the summary of key financial covenants is combined below, presenting the most
                 restrictive covenant, if different.

                 Credit Facility/NPAs – Key Covenants                                    Required             March 31, 2021

                          Maximum leverage ratio                                           < 60%                    37%
                          Maximum unsecured leverage ratio                                 < 60%                    24%
                          Maximum secured indebtedness ratio                               < 45%                    22%
                          Minimum fixed charge coverage ratio                              > 1.5x                    3.3x
                          Minimum unencumbered interest ratio                              > 2.0x                    7.0x
                 Public Notes – Key Covenants                                            Required             March 31, 2021
                          Limitation on incurrence of total debt                           < 60%                    37%
                          Limitation on incurrence of secured debt                         < 40%                    22%
                          Debt service coverage ratio                                      > 1.5x                    4.0x
                          Maintenance of total unencumbered assets                        > 150%                    419%

2021 First Quarter Investor Presentation                                                                                           36
COVID-19 UPDATE

         2021 FIRST QUARTER
         INVESTOR PRESENTATION
Portfolio Resilience During COVID-19
                  STORE's pandemic outperformance proves our business model.

                                                           Improved Collections as Re-Openings Occur

                                      Collections by Sector                            Deferral Repayments Through March 31, 2021
% Collections

                2021 First Quarter Investor Presentation                                                                            38
Supplemental Reporting Measures

Funds from Operations, or FFO, and Adjusted Funds from Operations, or              amortization and net gains (or losses) on sales, which are based on historical
AFFO                                                                               costs and implicitly assume that the value of real estate diminishes predictably
                                                                                   over time, rather than fluctuating based on existing market conditions.
Our reported results are presented in accordance with U.S. generally accepted      Management believes that AFFO provides more useful information to investors
accounting principles, or GAAP. We also disclose Funds from Operations, or         and analysts because it modifies FFO to exclude certain additional revenues and
FFO, and Adjusted Funds from Operations, or AFFO, both of which are                expenses such as straight-line rents, including construction period rent
non-GAAP measures. We believe these two non-GAAP financial measures are            deferrals, and the amortization of deferred financing costs, stock-based
useful to investors because they are widely accepted industry measures used by     compensation and lease-related intangibles as such items have no impact on
analysts and investors to compare the operating performance of REITs. FFO and      long-term operating performance. As a result, we believe AFFO to be a more
AFFO do not represent cash generated from operating activities and are not         meaningful measurement of ongoing performance that allows for greater
necessarily indicative of cash available to fund cash requirements; accordingly,   performance comparability. Therefore, we disclose both FFO and AFFO and
they should not be considered alternatives to net income as a performance          reconcile them to the most appropriate GAAP performance metric, which is net
measure or to cash flows from operations as reported on a statement of cash        income. STORE Capital’s FFO and AFFO may not be comparable to similarly
flows as a liquidity measure and should be considered in addition to, and not in   titled measures employed by other companies.
lieu of, GAAP financial measures.

We compute FFO in accordance with the definition adopted by the Board of
Governors of the National Association of Real Estate Investment Trusts, or
NAREIT. NAREIT defines FFO as GAAP net income, excluding gains (or losses)
from extraordinary items and sales of depreciable property, real estate
impairment losses, and depreciation and amortization expense from real estate
assets, including the pro rata share of such adjustments of unconsolidated
subsidiaries.

To derive AFFO, we modify the NAREIT computation of FFO to include other
adjustments to GAAP net income related to certain revenues and expenses that
have no impact on our long-term operating performance, such as straight-line
rents, amortization of deferred financing costs and stock-based compensation.
In addition, in deriving AFFO, we exclude certain other costs not related to our
ongoing operations, such as the amortization of lease-related intangibles.

FFO is used by management, investors and analysts to facilitate meaningful
comparisons of operating performance between periods and among our peers
primarily because it excludes the effect of real estate depreciation and

   2021 First Quarter Investor Presentation                                                                                                                           39
Supplemental Reporting Measures

We believe that presenting supplemental reporting measures, or non-GAAP            prove to be inaccurate. Our actual reported Adjusted EBITDAre for future
measures, such as EBITDA, EBITDAre and Adjusted EBITDAre, is useful to             periods may be significantly less than that implied by our reported Annualized
investors and analysts because it provides important supplemental information      Adjusted EBITDAre – Current Estimated Run Rate for a variety of reasons.
concerning our operating performance exclusive of certain non-cash and other
                                                                                   Adjusted Debt represents our outstanding debt obligations excluding
costs. These non-GAAP measures have limitations as they do not include all
                                                                                   unamortized deferred financing costs and net debt premium, further reduced
items of income and expense that affect operations. Accordingly, they should
                                                                                   for cash and cash equivalents and restricted cash deposits held for the benefit
not be considered alternatives to net income as a performance measure and
                                                                                   of lenders. We believe excluding unamortized deferred financing costs and net
should be considered in addition to, and not in lieu of, GAAP financial
                                                                                   debt premium, cash and cash equivalents and restricted cash deposits held for
measures. Our presentation of such non-GAAP measures may not be
                                                                                   the benefit of lenders provides an estimate of the net contractual amount of
comparable to similarly titled measures employed by other companies.
                                                                                   borrowed capital to be repaid, which we believe is a beneficial disclosure to
EBITDA, EBITDAre and Adjusted EBITDAre                                             investors and analysts.
EBITDA represents earnings (GAAP net income) plus interest expense, income         Adjusted Debt to Annualized Adjusted EBITDAre
tax expense, depreciation and amortization.
                                                                                   Adjusted Debt to Annualized Adjusted EBITDAre, or leverage, is a supplemental
We compute EBITDAre in accordance with the definition adopted by NAREIT.           non-GAAP financial measure we use to evaluate the level of borrowed capital
NAREIT defines EBITDAre as EBITDA (as defined above) excluding gains (or           being used to increase the potential return of our real estate investments. We
losses) from the sales of depreciable property and real estate impairment          calculate leverage by dividing Adjusted Debt by Annualized Adjusted EBITDAre.
losses.                                                                            Because our portfolio growth level is significant to the overall size of the
                                                                                   Company, we believe that presenting this leverage metric on a run rate basis is
To derive Adjusted EBITDAre we modify the NAREIT definition of EBITDAre to
                                                                                   more meaningful than presenting the metric for the historical quarterly period,
exclude other items included in GAAP net income, such as provisions for loan
                                                                                   and we refer to this metric as Adjusted Debt to Annualized Adjusted
losses, as such items are not related to our ongoing performance.
                                                                                   EBITDAre—Current Estimated Run Rate. Leverage should be considered as a
Note: The adjustments to derive Adjusted EBITDAre may not exist in every           supplemental measure of the level of risk to which stockholder value may be
quarter, therefore EBITDAre and Adjusted EBITDAre may be equal.                    exposed. Our computation of leverage may differ from the methodology
                                                                                   employed by other companies and, therefore, may not be comparable to other
Annualized Adjusted EBITDAre and Adjusted Debt                                     measures.
Annualized Adjusted EBITDAre is calculated by multiplying Adjusted EBITDAre
for the most recently completed fiscal quarter by four.                            Note: NAREIT issued a white paper in 2017 recommending that
                                                                                   companies that report EBITDA also report EBITDAre.
Annualized Adjusted EBITDAre – Current Estimated Run Rate is based on an
estimated Adjusted EBITDAre calculated as if all leases and loans in place as of
the last date of the most recently completed fiscal quarter had been in place as
of the beginning of such quarter; then annualizing that estimated Adjusted
EBITDAre for the quarter by multiplying it by four. You should not unduly rely
on this metric as it is based on several assumptions and estimates that may

 2021 First Quarter Investor Presentation                                                                                                                            40
Footnotes
Page 7:                                                                 Page 10:                                                                 5 Weighted average annual lease escalation represents the
1 Represents reported corporate revenues for financial                  1 We measure the credit quality of our portfolio on a contract-by-       weighted average annual escalation rate of the entire portfolio
statements received by STORE Capital through April 13, 2021.            contract basis using the STORE Score, which is a proprietary risk        as if all escalations occurred annually. For escalations based on
Excludes customers, representing approximately 4.2% of base             measure reflective of both the credit risk of our tenants and the        a formula including CPI, assumes the stated fixed percentage in
rent and interest, that do not report corporate revenues.               profitability of the operations at our properties. The STORE Score is    the contract or assumes 1.5% if no fixed percentage is in the
2 Represents the weighted average percentage change (by base            a quantitative measurement of contract risk computed by                  contract. For contracts with no escalations remaining in the
rent and interest) in reported corporate revenues for the               multiplying tenant default probabilities (using Moody’s RiskCalc)        current lease term, assumes the escalation in the extension
trailing 12-month (or nine-month if 12-month was not                    and estimated store closure probabilities (using a simple algorithm      term. Calculation excludes contracts representing less than
available) period as reported to STORE Capital for the period           we developed that has closure probabilities ranging from 100% to         0.1% of base rent and interest where there are no further
ended December 31, 2019 as compared to the same period                  10%, depending on unit-level profitability). Qualitative features can    escalations remaining in the current lease term and there are
ended December 31, 2018. Excludes customers representing                also impact investment risk, such as low property investment             no extension options.
6.1% of base rent and interest because sufficient comparable            amounts, favorable tenant debt capital stacks, the presence of           6 STORE defines occupancy as a property being subject to a

data was not available.                                                 third-party guarantors, or other factors. Such qualitative factors are   lease or loan contract. As of March 31, 2021, eleven of our
3 Estimated based on total revenue per employee for all                 not included in the STORE Score and may serve to mitigate                properties were vacant and not subject to a contract.
companies in the middle market (based on data reported by the           investment risk even further.                                            7 Represents the percentage (based on the number of locations)

National Center for the Middle Market for 2019) extrapolated                                                                                     of the Company’s investment locations that have been closed
to the aggregate total revenue of STORE’s customers.                    Page 12:                                                                 by the tenant but remain subject to a lease.
4 Represents the number of locations operated by STORE’s                1 STORE defines internal growth as the combination of high average       8 Represents the percentage (based on the number of locations)

customers as reported to STORE Capital through December 31,             lease escalators and a low AFFO payout ratio, which allows us to         of the Company’s investment locations that are subject to a
2019.                                                                   reinvest free cash flow back into our business.                          ground lease.
5 Represents the tolerable fall-off in lease level sales so that                                                                                 9 STORE calculates unit fixed charge coverage ratio generally as

EBITDAR after overhead will still cover the lease’s fixed charges       Page 14:                                                                 the ratio of (i) the unit’s EBITDAR, less a standardized corporate
(which includes STORE’s rent and interest) weighted by the              • Based on base rent and interest.                                       overhead expense based on estimated industry standards, to
lease’s base rent and interest (based on currently available            1 The percentage of investment portfolio subject to master leases        (ii) the unit’s total fixed charges, which are its lease expense,
results for approximately 90% of eligible properties in our             represents the percentage of the investment portfolio in multiple        interest expense and scheduled principal payments on
investment portfolio). If the variable profit coefficient for an        properties with a single customer subject to master leases.              indebtedness (if applicable). The 4-Wall coverage ratio refers to
individual lease was unavailable, we assumed the variable               Approximately 87% of the investment portfolio involves multiple          a unit’s FCCR before taking into account standardized corporate
profit coefficient for its peer group in the calculation of the fall-   properties with a single customer, whether or not subject to a           overhead expense. The weighted average unit FCCR and 4-Wall
off amount. Calculations are based on tenant statements                 master lease.                                                            coverage ratios were 3.0x and 4.0x, respectively, as of March
(either December 25, 2019 or later) received by STORE Capital.          2 The average investment amount/replacement cost (new)                   31, 2021, 3.0x and 3.9x, respectively, as of March 31, 2020 and
                                                                        represents the ratio of purchase price to replacement cost (new) at      3.0x and 3.8x, respectively, as of March 31, 2019.
Page 9:                                                                 acquisition.                                                             10 The proportion of investment contracts rated investment
1 Based on average of ratios of Realty Income and National              3 Of the 99% of our properties that are required to provide unit-        grade represents the percentage of our contracts (based on
Retail Properties as of December 31, 2020.                              level reporting, 95% have provided current obligated statements as       base rent and interest) that have a STORE Score that is
2 Ratios as of March 31, 2021; Unencumbered EBITDA based on             of April 21, 2021.                                                       investment grade; amount disclosed represents the average
NOI from Unencumbered Assets less an allocation of G&A                  4 Represents the percentage of lease contracts that were created by      since the inception of the Company. We measure the credit
expenses based on assets.                                               STORE or contain preferred contract terms such as unit-level             quality of our portfolio on a contract-by-contract basis using the
3 Represents the weighted average interest rate on balloon              financial reporting, triple-net lease provisions and, when               STORE Score, which is a proprietary risk measure reflective of
payments due in the respective years.                                   applicable, master lease provisions.                                     both the credit risk of our tenants and the profitability of the
4 Free Cash Flow approximates Cash Flow from Operations less                                                                                     operations at the properties.
dividends paid.

2021 First Quarter Investor Presentation                                                                                                                                                                        41
Footnotes
Pages 15 and 16:                                                     Page 26:                                                             Page 33:
1 Data as of March 31, 2021, 2020 and 2019, by percentage of         1 Source: Historical dividend data from Nasdaq.com.                  1 See page 39 for discussion regarding use of Funds From
                                                                     2 Represents actual AFFO ratios obtained from SEC filings. For
base rent and interest (based on rates in effect on those dates,                                                                          Operations and Adjusted Funds from Operations.
for all leases, loans and financing receivables in place as of       EPR, AFFO included a $20 million prepayment fee in Q3’18 which       2 For the year December 31, 2018, includes $130,000 of income

those dates).                                                        was excluded from AFFO per share for this presentation. For SRC,     tax expense associated with gains recognized on the
                                                                     AFFO included lawsuit settlement revenue in Q4’18 and                dispositions of certain properties.
Page 17:                                                             termination fee revenue in Q3’19; for this presentation, AFFO per    3 For the years ended December 31, 2018, 2019 and 2020

1 Data based on information available on customer websites,          share for these two periods is based on disclosed amounts            includes $2.1 million, $1.1 million and $0.4 million respectively,
news releases and/or SEC filings.                                    excluding these revenues.                                            of accelerated amortization of deferred financing costs
2 Data as of March 31, 2021, by percentage of base rent and                                                                               primarily related to the prepayment of debt.
interest (based on rates in effect on March 31, 2021, for all        Page 27:                                                             4 FFO and AFFO for the year ended December 31, 2020, include

leases, loans and financing receivables in place as of that date).   ¹ Net proceeds from sales for STORE in 2019 and 2020 include         approximately $57.1 million of net revenue that is subject to
                                                                     $4.1 million and $0.6 million, respectively, of lease termination    the short-term deferral arrangements entered into in response
Page 19:                                                             fees collected in connection with property sales. 2020 also          to the COVID-19 pandemic; the Company accounts for these
1 Source: Latest publicly available financial information as of      includes $24.8 million in proceeds from loan repayments in           deferral arrangements as rental revenue and a corresponding
December 31, 2020.                                                   conjunction with sales. Data for peers gathered from latest          increase in receivables. For the year ended December 31, 2020,
2Weighted Average Lease Duration for properties purchased            publicly available financial information as of December 31, 2020.    FFO and AFFO exclude $9.4 million collected under these short-
during quarter; NNN and VEREIT did not report lease duration                                                                              term deferral arrangements.
for all periods presented.                                           Page 28:
                                                                     Note: Data through December 31, 2020.                                Page 34:
Page 20:                                                             ¹ Growth from reinvested cash flow is equal to (i) the incremental   1 See page 40 for discussion regarding use of EBITDAre,

1 Source: Latest publicly available financial information as of      cash flow added from reinvesting retained cash assuming a prior      Adjusted EBITDAre and Adjusted Debt.
December 31, 2020.                                                   period payout ratio of 78%, leveraged at 39% with a borrowing
2 Source: Annualized rent from latest publicly available financial   cost of 2.78% and amortization of 45 years, reinvested at 8.09%
information as of December 31, 2020.                                 less incremental operating costs of 0.45% divided by (ii) prior
3 Source: Gross cap rates and lease durations in acquisitions        period rents assuming assets were acquired at 8.09%.
from publicly available financial information in the eight
quarters ended December 31, 2020. NNN and VEREIT did not             Page 32:
report lease duration for all quarters included in presentation.
                                                                     1 See page 39 for discussion regarding use of Funds From
                                                                     Operations and Adjusted Funds from Operations.
                                                                     2 FFO and AFFO for the three months ended March 31, 2021,
Page 21:
1 Acquisitions represent both acquisitions of real estate and        include approximately $2.0 million of net revenue that is subject
investment in loans and financing receivables. Dispositions          to the short-term deferral arrangements entered into in response
represent the original acquisition cost of real estate sold and      to the COVID-19 pandemic; the Company accounts for these
certain loan repayments, primarily received in conjunction with      deferral arrangements as rental revenue and a corresponding
real estate sales.                                                   increase in receivables. For the three months ended March 31,
2 Refer to pages 32 through 34 and page 39 for definitions of        2021, FFO and AFFO exclude $5.9 million collected under these
these non-GAAP financial measures and reconciliation to GAAP         short-term deferral arrangements.
                                                                     3 Under the two-class method, earnings attributable to unvested
net income.
                                                                     restricted stock are deducted from earnings in the computation
                                                                     of per share amounts where applicable.

2021 First Quarter Investor Presentation                                                                                                                                                                 42
You can also read