2018 Half Year Results Announcement - ACN 004 201 307 Caltex Australia Limited

Page created by Jimmy Schroeder
 
CONTINUE READING
2018 Half Year Results Announcement - ACN 004 201 307 Caltex Australia Limited
2018 Half Year Results
Announcement
Caltex Australia Limited
ACN 004 201 307
2018 Half Year Results Announcement - ACN 004 201 307 Caltex Australia Limited
2

Agenda
   Values Moment
   Key Highlights: Half Year 2018 Results
   Strategy Update
   Financial Highlights
   Fuels & Infrastructure Highlights
   Convenience Retail Highlights
   Asset Optimisation Review
   Capital Management Discipline
   Financial Guidance
   Short-term Priorities
   Appendices
2018 Half Year Results Announcement - ACN 004 201 307 Caltex Australia Limited
Values Moment                                                                                                                                              3

Health and safety are core to our values and the safety of our people is paramount

      Convenience Retail                                   Fuels & Infrastructure                                    Process Safety
 Total Recordable Injury Frequency                    Personal safety injury performance                   Process Safety performance
  Rate (TRIFR) has increased during a                   continued to improve across the first                 continues to be strong with only one
  period of transformation; with over                   half of 2018 in Fuels and                             recordable spill in the first half of
  240 new company operated stores                       Infrastructure, as evidenced by the                   2018 and no marine spills across
  over the last 18 months, and nearly                   lowest recorded YTD Days Away                         Caltex’s operations YTD.
  1,500 new store employees.                            From Work Frequency Rate                             Operational discipline remains a key
 Our commitment is to continue to                      (DAFWFR) over the past 3 years.                       focus to ensure that the right task is
  focus on transition processes,                       Continued focus on both strong                        performed the right way, every time.
  targeted training programs, and                       safety leadership, engagement and
  intervention to improve this result.                  culture programs.

        Convenience Retail                                 Fuels & Infrastructure                                       Process Safety
         Personal Safety                                     Personal Safety
10                                              9.0   10                                                     12                11
                                                                  8.2                     8.2
 8                                                     8                                              7.2    10     9                     9
                                                                              6.9
                        5.7                                                                                   8
 6                                                     6
                                                            3.7                                               6
 4          3.3                           3.5
                                    2.9                4
      2.1         1.9                                                   2.1         2.3                       4
 2                                                     2                                        1.0                                                 1
                              0.6                                                                             2
 0                                                     0                                                      0
       2015       2016        2017        2018 1H            2015       2016        2017        2018 1H            2015       2016      2017     2018 1H

     Days Away from Work Injury Frequency Rate             Days Away from Work Injury Frequency Rate                    Spills >1bbl and Marine Spills
     Total Recordable Injury Frequency Rate                Total Recordable Injury Frequency Rate
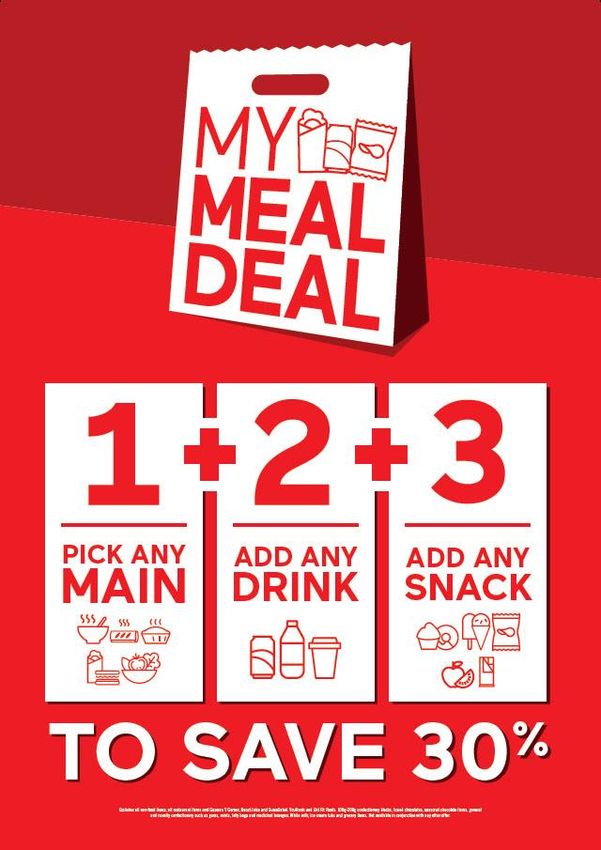
2018 Half Year Results Announcement - ACN 004 201 307 Caltex Australia Limited
Key Highlights                                                                                                                                    4

Half Year 2018 Results Summary
Consolidated Group Result                          RCOP NPAT $296 million, an increase on 1H 2017 ($294 million).
RCOP NPAT $296 million up 1%                       Extended and expanded long term partnership with Woolworths to include the co-creation of a
                                                    market-leading convenience offering as well as long term wholesale grocery supply, loyalty
Earnings per share up 1%                            and redemption arrangements.
Interim dividend down 5%                           Acquisition of equity interest in Seaoil in March.
                                                   Business operating as two business units since 1 January 2018, to deliver greater
Extended and expanded long term partnership         transparency and accountability for growth.
with Woolworths                                    Asset optimisation review complete, identifying opportunity to create value from more active
                                                    property management and development. Next steps defined.
                                                   Interim dividend 57cps declared (1H 2017 60 cps) fully franked, a 50.3% payout ratio
                                                    (guidance 40% - 60%).

Fuels & Infrastructure                             Fuels & Infrastructure EBIT of $314 million, up $27 million or 9%
RCOP EBIT $314 million                             F&I volumes up 12% to 10.2BL - Domestic (Retail and Wholesale) sales up 3.5% to 8.4BL.
                                                    International volumes of 1.8BL increased by 87%, reflecting expanding role of Ampol
Delivering on International growth strategy         Singapore.
                                                ×   Lytton refinery EBIT of $105 million, down $44 million on lower refiner margin (down
Solid underlying operational performance, but       US$2.30/bbl to US$10.06/bbl)
impacted by weaker refining margins                Reliable Lytton operational performance continues. CRM sales from production of 3.2BL, up
                                                    4.6%, the second highest HY on record. Lytton continues to deliver reliable profits.
                                                   Maintaining Woolworths fuels supply agreement provides platform for Ampol growth.

Convenience Retail                              ×   Convenience Retail EBIT of $161m, down $26m or 14%.
RCOP EBIT $161m                                 ×   Fuel contribution ($m) flat with incremental Milemaker and NTIs earnings offset by impact of
                                                    rising crude price on volume and margin
Store transition process continues to impact
                                                ×   Convenience Retail fuel volumes down 2.6% to 2.5BL, compared to market decline of ~1.6%.
earnings
                                                   Total Shop sales returned to growth trajectory (+1.1%) with transaction growth at 4.0%
Good progress on enablers and The Foodary       ×   Total Shop contribution margin down $17m, due to the broader impacts of franchise transitions
pilots underpins medium term earnings growth        and other operating impacts on store
                                                   Good progress on implementation of enablers of retail strategy – hiring of retail capability, IT
New Woolworths agreement includes loyalty           (inc. labour rostering), multi-temp supply chain, customer feedback platform
and redemption as well as convenience              The Foodary continues to resonate with customers – good sales, margin, transaction
benefits                                            performance. Ongoing work to optimise costs. Learnings to be incorporated into Metro
                                                    convenience co-creation and development of broader network.
2018 Half Year Results Announcement - ACN 004 201 307 Caltex Australia Limited
Strategy Update                                                                   5

Separate businesses and cultures emerging, both with significant growth options
2018 Half Year Results Announcement - ACN 004 201 307 Caltex Australia Limited
Strategy Update – Primed for growth                                                                                                                                  6

 Retail and F&I both have significant growth options, underpinned by core competencies and
 enabled by market leading networks

                                           Creating
Successful Transformation                                                                             Primed for Growth
                                         the Platform
              2011-2016                     2017-2018                                                         2018 and beyond

• Delivery of top quartile TSR           Quantum Leap                                                                                                            Digital
                                         program setting                                                                                                         C-lab,

                                                            Convenience Retail
                                                                                                                               Technology & innovation
• Successful transformation from         the company up                                                                                                          Fuel
                                                                                                                                                                 pay
  refiner-marketer to integrated fuels   for long-term
  retailer and distributor                                                                                              Property optimisation
                                         success via:
                                                                                                                                             Metro convenience
                                         • Operating                                                        Accelerated with
                                                                                                          Woolworths partnership             Wholesale supply
                                           model review,                                                                                     Loyalty, redemption
                                           leading to                                            Transition to company
                                           definition of                                              operations
                                           two new                                      Convenience Retail                                                      Plus:
                                           business units                                                                 QSR, The Foodary                    step-out /
                                                                                     Strategy & Capability build
                                                                                                                                                             adjacencies
                                         • Commercial                                                                                                           M&A
                                           separation
                                                            Fuels & Infrastructure
                                                                                        Alternative fuels, capability
                                           executed                                               linkages, services
                                                                                                                                 Renew product offer

                                         • Asset                                              Gull, Seaoil,
                                                                                                                         Regional Growth
                                           optimisation                                 other investments
                                           review                                                                                            Optimisation in complex
                                           completed                                                          Leveraging Ampol
                                                                                                                                             supply chains

                                         • Business                                           Protect and grow domestic            B2B, retention of
                                           efficiency                                                  volumes                     Woolworths supply
                                           initiatives                                                                    Core capabilities of infrastructure,
                                                                                     Integrated fuel supply chain
                                           ongoing                                                                        trading & shipping, manufacturing
2018 Half Year Results Announcement - ACN 004 201 307 Caltex Australia Limited
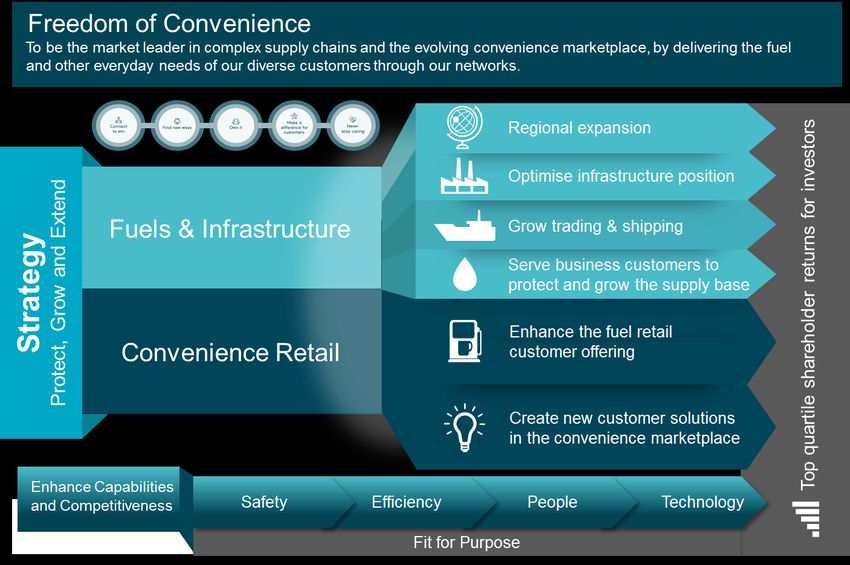
Financial Highlights                                                                                                                         7

Half Year Ending 30 June

                                                                           1H 2018                   1H 2017                 % Change
HISTORIC COST
EBIT ($m)                                                                       568                       408                        39
NPAT ($m)                                                                       383                       265                        45
EPS (cps)                                                                       147                       101                        45
REPLACEMENT COST
EBIT* ($m)                                                                      443                       454                        (2)
NPAT ($m)                                                                       296                       294                            1
EPS (cps)                                                                       113                       113                            1
Dividend (cps)                                                                   57                        60                        (5)

Net Debt ($m)                                                                 1,041                       730                        43
Gearing (%)                                                                    24%                       20%                             4
Gearing (Lease adjusted %)                                                     37%                       34%                             2
Working Capital ($m)                                                            984                       680                        45
Capital Expenditure ($m)                                                        223                       261                      (15)
Depreciation & Amortisation ($m)                                                120                       107                        13

                       * Pricing lags on product sales has now been excluded from RCOP earnings, and now included in movement in
                       inventory as a component of inventory gain/loss. All references to RCOP have been restated within this document
2018 Half Year Results Announcement - ACN 004 201 307 Caltex Australia Limited
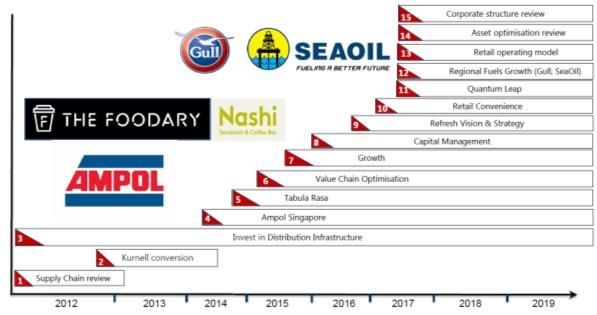
Financial Highlights                                                                                                                  8

 Modest earnings growth given strong underlying performance from Fuels & Infrastructure and
 acquisitions, more than offsetting lower CRM and Convenience Retail shop contribution

                                                                                1H 2018 RCOP NPAT represents 5 year CAGR of
$m                                                                               11% on an annualised basis since 2013.
                          Caltex RCOP NPAT
                                                                                Fuels & Infrastructure EBIT up $27 million (+9%) to
600                                                                              $314 million (including $9 million unfavourable FX
                                                                                 impact), driven by international expansion offsetting
                                                                                 lower CRM (down US$2.30/bbl to US$10.06/bbl),
500                                                                              and strong underlying business performance
                                                               344               (volume gains, lower opex).
                                  341
400                                              287                            Convenience Retail EBIT down $26m (-14%) to
                                                                                 $161m, largely due to the impact of rising crude
                                                                                 and product prices on retail fuel income, and impact
300                 256                                                          of ongoing conversion of franchise stores, as
       175                                                                       flagged in June’s profit guidance.

200                                                                             Higher Corporate costs (up $10m to $31m) due to
                                                                                 increased project costs (i.e. for M&A, Woolworths,
                                  265            262           294      296      commercial separation, asset optimisation etc).
100    180          165                                                         Net finance costs of $27 million (down $8m)
                                                                                 reflecting lower average interest rates after
 0                                                                               refinancing hybrid bond, partially offset by higher
       2013        2014           2015          2016           2017     2018     average borrowings, and discounting of Kurnell
                                                                                 conversion cost provisions.
                  1H RCOP NPAT               2H RCOP NPAT
                                                                                Effective tax rate (ETR) largely unchanged at
                                                                                 29.2%, and inline with guidance (expected to be
              *RCOP Net profit after tax, excluding significant items
                                                                                 ~29% going forward) which benefits from
                                                                                 contribution from NZ (lower co. tax regime) and
                                                                                 some utilisation of capital losses.
2018 Half Year Results Announcement - ACN 004 201 307 Caltex Australia Limited
Financial Highlights                                                                                      9

Fuels & Infrastructure delivers strong growth despite lower CRM, but Group EBIT down slightly
due to short-term impacts of Convenience Retail transition costs and growth related costs

                              HY 2017 v HY 2018 HCOP EBIT
 1000
                                       Store transitions,        Increased M&A
  900                                   and crude and              and project
                                        product timing             activity, with
  800                                 impacts on margin          underlying costs
  700                                                                  down

  600                                                                                         124   568

  500                    45     454           26            27         10           443   0
         408     1
  400
  300
                                              Strong growth in domestic
  200                                         and international volumes,
                                               partially offset by lower
  100                                                    CRM
    0
Financial Highlights                                                                                                        10

   Operating Cash Flow remains strong, with some investment in working capital to fund regional
   growth
1,500
              1H 2018 EBITDA        Timing of out of           Tax paid on                             Primarily
                $563 million        region cargoes,           HCOP basis,                               Seaoil
                                   increased Ampol             with annual                            acquisition
1,200                                 activity, and             payments
                                  increased oil price         skewed to 1H
                                                                                                                    159      1,041

                                                                                                          100
 900          443
        814
                                                                                                 42
                                                                                            82
                                                                  217        9     27

 600

                                          308            26
                        120

 300                             124

   -

                    Summary sources of cash             Summary of operating cash requirements   Discretionary capital allocations
Financial Discipline - Balance Sheet                                                                                                                       11

 Higher debt levels reflect Seaoil investment and some investment in working capital to fund
 regional growth

                                                                          %                          Caltex net debt levels**
$m
              Period end debt and gearing*                                      $m
1200                                                                      45   3000                                              Increased debt
                                                                                                                               capacity to facilitate
                                                                  1,041                                                           greater Ampol
                                                                          40                                                         activity
1000                                                                           2500
                                                                          35
                                                            814
 800               740 742                            730                 30   2000
                                          693
             617              639                                         25
 600   544                                                                     1500
                                                454                       20
                                    432
 400                                                                      15   1000

                                                                          10
 200                                                                            500
                                                                          5                                                                  Higher debt
                                                                                                                                              on M&A
   0                                                                      0        0

       Net Debt              Gearing            Gearing, Lease adj                         Ave Debt           Peak Debt           Debt Facilities^

                             * Gearing = net debt / (net debt + equity); Gearing - Lease adjusted, adjusts net debt to include lease liabilities
                             ** Average debt is the avg. level of daily debt through the period; Peak debt is the max. daily debt through the period
                             ^ Debt facilities includes committed facilities as at 30 June 2018
Financial Discipline - Dividend                                                                                                  12

Interim dividend of 57 cents per share (2017: 60cps) fully franked; pay-out ratio 50.3%

                                             Caltex dividend history*
   Cents per share                                                                                        Payout Ratio

       140                                                                                                         60%

       120                                                                                                         50%
       100
                                                                                                61                 40%
        80                                                                 70
                                                                                      52
                                                                                                                   30%
        60
                        30                                       50                                                20%
        40
                                   28                                                           60        57
                                             23        17                  47         50                           10%
        20
                25      30
                                   17        17        17        20
         0      0                                                                                                  0%

             Interim Dividend              Final Dividend                 Payout %

                             * Dividends declared relating to the operating financial year period; all dividends fully franked
                               Caltex dividend pay-out ratio (40% to 60% of RCOP NPAT, excluding significant items)
Fuels & Infrastructure Highlights - Result                                                      13

Strong underlying operational performance, with International growth strategy offsetting soft CRM
                                               1H 2018         1H 2017        Change (%)

       Total Fuels Sales Volumes (BL)             10.2             9.1              12
       Australian Domestic Volumes (BL)            8.4             8.1               3
       International Volumes (BL)                  1.8             0.9              87
       Lytton CRM Sales from Production (BL)       3.2             3.0               5
       Lytton Total Production (BL)                3.2             3.0               6

       Total External Revenue ($m)               7,785           5,592              39

       F&I (excl Lytton) EBITDA ($m)               250             174              44
       Lytton CRM ($m)                             259             311             (17)
       Lytton opex and other costs ($m)          (123)           (134)              (8)
       Lytton EBITDA ($m)                          136             177             (23)

       F&I EBITDA ($m)                             386             350              10
       F&I D&A ($m)                               (73)            (64)              14
       F&I EBIT ($m)                               314             287               9

       Lytton CRM (US$/bbl)                      10.06           12.36             (19)
Fuels & Infrastructure Highlights – Key Drivers                                                                            14

Strong underlying operational performance generating earnings growth, with acquisitions
offsetting weaker CRM
                                                 HY 2017 v HY 2018 F&I RCOP EBIT
   500

                    CRM down US$2.30/bbl to             Benefits from                      Higher D&A from
   450
                        US$10.06/bbl, given           growing regional                       acquisitions,
                    regional margin weakness,         business (Ampol,                       terminal and
   400              yield performance impacts,          Gull, Seaoil)                     Lytton investments
                        and reduced quality
                             premiums
   350                                                                                7           9
                                                                                 10                        322   9
                                                           42        8                                               314
               17         304         48
   300   287
                                                  9
   250
                                                                Largely timing
   200                                                           of T&I, will
                                                                   partially
                                             Domestic           unwind in 2H
   150                                     volume growth
                                           3.5% vs 1H17
   100

    50

     0
Fuels & Infrastructure Highlights - Volumes                                                                          15

 Overall volumes up 12% to 10.2 BL with strong growth in Wholesale (B2B diesel and jet) and
 International (Gull & Ampol regional supply growth)

BL
                  Fuels & Infrastructure Sales                         Total F&I volume up 12% to 10.2BL in 1H 2018.
11
                                                                              Domestic sales up 3.5% to 8.4BL
10                                                                            International sales up 87% to 1.8BL
                                                      1.58     1.78
 9                                                                     Total Retail volumes have fallen 2.6% to 2.5BL in
                0.36               1.00     0.95                        1H 2018. Refer to Convenience Retail (slide 22)
                         0.75
 8     0.24                                                             for detailed discussion. Total Retail volumes
 7                                                                      represent volumes sold through Caltex
                                                                        Convenience Retail network.
 6                                                                     Wholesale volumes have grown strongly, up 6%
                5.86               5.52     5.62      5.86     5.96
 5     5.48              5.38                                           (340ML) in 1H 2018, underpinned by increases in
                                                                        diesel (up ~360ML), and jet (up ~100ML).
 4                                                                      Domestic Wholesale volumes represent volume
                                                                        sold under wholesale contracts or spot
 3                                                                      transactions covering B2B customers,
 2                                                                      Woolworths and other supply counterparties.
       2.43     2.43     2.49      2.56     2.52      2.57     International volumes increased by 87% to 1.8BL
                                                               2.46
 1
                                                                in 1H 2018 given Ampol growth and a full period
 0                                                              of contributions from Gull (178ML), which is also
     1H 2015 2H 2015 1H 2016 2H 2016 1H 2017 2H 2017 1H 2018    demonstrating volume growth inline with
                                                                expectations at time of acquisition. International
     Caltex Domestic Retail Domestic Wholesale  International   volumes represent volume sold through Ampol
                                                                Trading & Shipping to third parties, Gull New
                                                                Zealand and, from 2H18 will, include volumes
                                                                supplied to Seaoil in the Philippines.
Fuels & Infrastructure Highlights - Lytton Key Drivers                                                                      16

     Weaker result driven by regional margins, despite continued solid operational performance

250
                                              HY 2017 v HY 2018 Lytton RCOP EBIT
                      External Drivers                                                 Controllable Drivers
                                                   3.16BL sales from production
                                                   in 1H 2018, up 138ML (4.6%)                   Continued good cost
200                                                     on 1H17 due to BHU                        control with some
                                                      conversion in 1H17. The                     timing benefits of
                                                   second highest HY on record                   maintenance spend
                                                       (2H16 record 3.31BL).                       between halves.
           149         7
150                                      38

                                                       11               13
                                                                                                              8        4   105
                                                                                          1
100

                      CRM down US$2.30/bbl                     Lower Yield driven by
 50                   to US$10.06/bbl, given                      1). Sub-optimal
                          regional margin                       operation in Q1 and
                      weakness, and weaker                     2). Negative impacts
                         quality premiums                      from FCCU trip in Q2

 -
Fuels & Infrastructure                                                                        17

Lytton Refinery Highlights
Lytton continuing its track record of cost competitive and reliable
performance, with near record production in 1H 2018

 Continued focus on optimisation and cashflow generation from Lytton.
   Sales averaged >6% above nameplate capacity (~108Kbopd), supported by high
    mechanical availability (97%) and optimisation of downstream units.
   Expectations for 2018 inline with annual production 6.0 – 6.2BL pa.
 Lytton continues to make modest investments in optimisation and debottlenecking.
   Target high returns on capex with fast pay backs.
   Continued investment in modest quick payback projects, including minor upgrades during
    2018 CDU1B T&I.
      Forecast to deliver EBIT ~$5-6million p.a starting in 4Q18, delivered through modest
       capex of $8million
   Outlook for annual capex anticipated to be $50-90m pa (including T&I). No major capex
    anticipated prior to 2025.
   Shift to annual T&I programs better addresses safety, execution, margin and cash flow
    risks, while also eliminating major cyclical T&I downtime.
 Lytton remains a valuable part of Caltex’s Infrastructure network.
   Provides a level of defensive and sustainable returns.
   Initial IMO2020 analysis suggest neutral impact to margins given Lytton produces
    negligible bunker fuel oil.
Fuels & Infrastructure - Lytton Refinery Highlights                                                                                     18

     1H 2018 saw softer refining margins on regional margin weakness, lower yield and lower quality
     premium, but “Structural” portion of margin limits downside.

                                                                                          Unlagged Caltex Refining Margin of
              2012-2018 Caltex Refiner Margin (US$/bbl)                                    US$10.06/bbl in 1H 2018, down from
                                                                                           US$12.36/bbl in 1H 2017, on regional
           5 year average US$11.84/bbl,                                                    margin softness, lower yield and lower
20         influenced by 2015 supply impacts                                               quality premiums.
                                                                      “Variable”
                                                                   portion of margin      Comparable Singapore Weighted
                                                                                           Average Margin (SWAM) US$11.51/bbl in
15                                                                                         1H 2018 (versus US$12.73/bbl in 1H
                                                                                           2017).

                                                                                          Refining Margins shown from 2012, given
10                                                                                         Australian refinery closures from 2012
                                                                                           have changed competitive pricing
                                                                                           dynamics.

 5
                                                                    “Structural”           Average CRM           2018               2017
                   1st percentile* US$6.08/bbl
                                                                  portion of margin
                   10th percentile* US$7.16/bbl                                                  1H        US$10.06               US$12.36
 0
                                                                                                 2H                               US$13.68

                                         CRM Brent                                           CRM         High            Low         Average

                                                                                             1 year   US$15.41          US$8.25      US$11.88
                        * 1st percentile means that 99% of CRM has been above this
                        level since Australia transitioned to an Import Pricing Parity       2 year   US$15.74          US$7.44      US$11.55
                        Dynamic (closure of refineries from Sept-12 onwards).
Fuels & Infrastructure                                                     19

International - a platform for growth
International
 Expanding role of Ampol Singapore on regional supply to Caltex
  investments and third parties.
 Seaoil strategic partnership commenced in March 2018.
   Ampol Singapore is now sourcing fuel on behalf of Seaoil.
   Target remains ~$10m pa of EBIT contribution by 2019, with Seaoil
    targeting a doubling of the company’s retail network and terminal
    storage capacity over the next 5 years.
 Strong Gull NZ performance, in line with initial expectations.
Wholesale
 Caltex’s combination of infrastructure, scale and its integrated value
  chain approach winning domestic volumes, despite declining industry
  demand.
 Leveraging integrated value chain to retain and grow domestic B2B
  volumes.
 Retention of Woolworths volumes will allow ongoing optimisation of
  supply chain.
Retail
 Arm’s length commercial arrangements put in place with Caltex
  Convenience Retail.
Convenience Retail Highlights - Result                                                                                                                 20

Retail EBIT down on 1H 2017 due to impact of rising crude prices on retail fuel margin and impact
of ongoing transition of franchise sites

                                                                   1H 2018                    1H 2017^                  Change (% )

       Period end COCO sites (#)^^                                      414                          233                           78
       Period end CORO sites (#)                                        376                          555                         (32)
       Total Sales volumes (BL)                                         2.46                        2.52                          (3)
       Premium Fuel Sales (%)                                        47.7%                       47.0%                              1

       Total Fuel Revenue ($m)*                                       2,070                       1,841                            12
       Network Shop Revenue ($m)**                                      534                          529                            1
       Total Fuel and Shop Margin ($m)**                                404                          421                          (4)
       Cost of Doing Business ($m)                                     (199)                       (193)                            3
       EBITDA ($m)                                                      205                          228                         (10)
       D&A ($m)                                                         (44)                        (40)                           10
       EBIT ($m)                                                        161                          187                         (14)

       Network Shop sales growth (%)                                   1.1%                      (0.7)%
       Shop Transactions growth (%)                                    4.0%                        2.0%
       Net Promoter Score (NPS) (%)                                       66                         N/A
                   * Excludes GST and excise
                   ** Network Shop Revenue includes both company controlled and franchise sites, which is different to revenues reported in statutory
                   accounts, but is more aligned with Total Fuel and Shop Margin. Total Fuel and Shop Margin predominantly reflects gross margin on all fuel
                   sales less fuel commission paid to franchisees, gross margin on company controlled shop sales minus costs equivalent to those covered by
                   franchisees, and non-fuel income from franchise sites.
                   ^ 1H 2017 fuel revenue and shop revenue include Milemaker contribution for full period. ^^ Includes 52 unmanned diesel stops.
Convenience Retail Highlights - Key Drivers                                                                                       21

Transition to company operations is progressing in line with plan, but it has had an impact on
earnings

                                     HY 2017 v HY 2018 Convenience Retail RCOP EBIT
      300

                  Timing impact of     Milemaker & NTI          Increase in lease                    Includes profit/loss
                    rising crude        gains, partially         costs from new                         on site sales
      250         price on volume    offset by increased         sites, including
                     and margin      site upgrade activity      Milemaker ~$9m

      200   187             10          10               17
                                                                       11
                                                                                        3        4            8             161
      150

      100                                       Broader impacts                      Variable
                                               from franchise site                  costs well
                                                   transitions                      controlled

      50

       0
Convenience Retail Highlights – Fuel Volumes                                                                                             22

Domestic Retail Fuel Sales – Favourable premium mix continues – though premium and total
petrol volumes down
                                                                              Overall Retail fuel income flat with rising crude price
BL                Convenience Retail Fuel Sales*                               impact on volume and margin, offsetting new site
3.0                                                                            contribution (including Milemaker).
                                                                              Total Retail fuel volumes fell 2.6% to 2.46BL. Petrol
                                                        0.06
                                                                               volumes were down 6.4% to 1.24BL, partially offset by
                0.06                0.05      0.05
                          0.05                                        0.05     retail diesel demand growth of 2.1% to 1.17BL. Key
2.5    0.06
                                                                               drivers include:
                0.61                0.67                0.72
                                                                                   - Industry volume decline of approximately 1.6%
       0.57               0.63                0.69
                                                                      0.70                 - Overall industry decline in petrol volumes
2.0
                                                                                              with diesel substitution and vehicle
                                                                                              efficiency. Industry remains highly
       0.46     0.49      0.46      0.46                                                      competitive.
                                              0.46      0.47
1.5                                                                   0.47
                                                                                           - Average fill size down 2% vs 1H 2017
                                                                                   - Increased site upgrade activity (refurbishments &
       0.49     0.50      0.50      0.51                                              The Foodary) resulted in greater site downtime.
                                              0.50      0.50
1.0                                                                   0.47
       0.14     0.12                0.10
                                                                              Premium fuel volume less impacted, down 1.2%.
                          0.10                0.10      0.11          0.10
                                                                   Caltex continues to optimise volumes and margins, and
0.5                                                                 has actively pursued strategies to mitigate volume
       0.73    0.76     0.74    0.76   0.73      0.71      0.66     pressure:
                                                                       - New Woolworths loyalty and redemption
0.0                                                                       relationship.
     1H 2015 2H 2015 1H 2016 2H 2016 1H 2017 2H 2017 1H 2018           - New fuel partnerships with NRMA, Toyota and
                                                                          Uber.
 ULP    E10   Premium Petrol Diesel  Vortex Diesel    Lubes & Other
                                                                       - Launch of national “FuelPay” app to make filling
                                                                          up at Caltex faster and easier for customers.

                   * All historic periods include Milemaker volumes
Convenience Retail Highlights – Shop Performance                                                                                         23

Momentum building with improved shop offer, investment in enablers to underpin future growth

Core shop offer developing momentum with customers
 Customers responding positively to improvements in store – headline sales and transaction growth in 1H 2018, with improving Q1 to Q2
  trend continued into July and August.
        Investment in price to drive improved customer perception of value and long term sales momentum.
        Stronger, more effectively communicated promotions – e.g. Meal Deal (up >100% on 1H 2017).
        Improved fresh range and offer – fresh category sales up 6.5% on 1H 2017.

 The Foodary continues to demonstrate potential of retail strategy
  37 The Foodary sites in operation at end of June 2018 – 14 new sites opened this year.
  Offer continues to resonate with customers – average ~50% sales uplift, and ~4% margin uplift,
   in sites upgraded from StarMart to The Foodary (including QSR) with fuel volume outperforming
   network (5+%).
  Improving trajectory on costs and hence profitability at sites open more than 6 months.
  A reduced total of 35-40 The Foodary sites are targeted for roll-out in 2018 while Caltex
   undertakes a review of its format strategy across the broader network (with update provided to
   market by end 2018).
  The Foodary offer still highly relevant to long term strategy given ~800 Retail sites and Metro
   target of 250 – brand strategy across network under review in light of new Woolworths
   partnership.

 Investment in enablers key to medium to longer term success in shop
  People: Continuing to bring in strong retail talent including new Chief Customer Officer, new
   regional managers in 3 of 5 regions, labour management specialist and QSR lead.
  IT system: Labour management platform to launch in 2H18, Retail ERP investment into 2019.
  Supply chain: Multi-temp solution live in SA since March. National roll-out underway, with further
   optimisation to occur in conjunction with Woolworths.
  Customer insight: “Voice of customer” system rolled out nationally in 1H - better customer
   insights and ability to quickly respond to feedback.
Convenience Retail Highlights – Woolworths Partnership                                                                                       24

Strategic partnership with Woolworths to strengthen and accelerate Convenience Retail Strategy,
underpinning the delivery of top end of $120-150m EBIT uplift range over 5-6 years.
   Larger sites                             Caltex Convenience retail network                         Smaller sites            Timing

                                                                                 Other smaller concepts                 Metro convenience
            1 New Metro convenience offering
  Co-creation of a market leading convenience offer in the P&C       Explore smaller Metro convenience formats         co-creation underway
  channel leveraging the knowledge and expertise of both             and/or continue to deploy existing Caltex
  Woolworths and Caltex                                              formats.                                          Network review 2H18
   -   Co-creation process currently underway – initial sites        Review of broader network complete by end
                                                                     2018.                                             First 4 sites planned to
       identified and target open in 1H 2019
                                                                                                                            open Q1 2019
   -   Opportunity to deliver higher sales and profit than The
       Foodary                                                                                                         Target 250 sites over 5
   -   Initial tranche of 50 sites to be completed, with target of                                                             years
       250 sites over 5 years once concept proven

                                                2 Wholesale supply
       Access to Woolworths’ buying power and broader range of products to support enhanced customer offer,                Planned 1Q19
                               competitive pricing to customers and Caltex margins
  Roll-out staged. Phase 1; ambient supply to Caltex DC. Full multi-temp supply & logistics solution in 18-24 months

                                       3 Loyalty – Woolworths Rewards                                                    “Earn” from 4Q18
       Core partner with opportunity to target 11 million plus members to increase existing customer visitation         “Burn” and targeted
                                              and attract new customers                                                   offers 1H 2019

                                                   4 Redemption
   Increasing Caltex sites offering Redemption from 104 to 229 - increased volume & customer visits anticipated to       Commencing 4Q18
             more than offset margin impact – particular attraction to price conscious segment of market

                               EBIT uplift of >$30m expected in 2020 from Retail strategy
Convenience Retail Highlights – Transition to Company                                                                                      25

Operations
Good progress on execution of transition of network to company operations, with optimisation to
come
Transition to company operations progressing well
 57 sites transitioned since February 2018 as part of the decision to transition to company owned operations.
        In addition 25 sites have been transitioned as part of the wage underpayment audits and natural expiry of agreements.
        Brings total of sites transitioned to 82 in 1H 2018, and over 240 in the past 18 months.
 Approximately 1,500 new staff joined Caltex in past 18 months – either franchise employees transferring (~1,100) or new staff (~400) –
  20 of total 63 business managers across network newly recruited.
 Confirmed transition dates, or franchise agreements expire by 2020, for 347 sites (or 80%) of the 433 franchise sites (at Feb-18).
 Caltex will now operate at least 88% of its network by the end of 2020 – expected to increase with ongoing franchisee engagement.
 No change to cost guidance for transition ($100-120 million over 3 years, with $70-80 million expensed).

Transition to operations contributing to reduced shop income
 Broader transition impacts reduced 1H 2018 EBIT by ~$16m. Shop contribution margin impacted by direct transition costs, reduced
  performance at transitioned sites, lower franchise income from continuing franchise sites and operating cost increases.
       - Reduction in sales during transition and recovery trajectory post transition improving in 2018 vs 2017.
       - High Care team of 18 established to implement transition and focus on performance post transition.

Further optimisation to come in performance of company controlled sites
 Retail enablers support ability to enhance delivery in store (see slide 23)
 Continuing to build sales momentum, managing margin mix and delivering on site cost efficiency; all key priorities to optimise shop
  performance.
 Strategic partnership with Woolworths, including wholesale grocery supply, loyalty program and redemption will support performance of
  the network.
Asset Optimisation                                                                                          26

Thorough Review Process Now Concluded

                 Maximise sustainable long-term shareholder value by ensuring optimal asset
  Objective
                 ownership and management models

                 • Review led by Corporate Strategy team, supported by independent advisors.
                 • Separate processes for Infrastructure and Convenience Retail Real Estate assets.
   Process
                 • Included confidential, targeted market sounding processes with sophisticated
                   investors regarding ownership and management alternatives.

                 Operational     • Impact on long term operational and strategic flexibility.

                                 • Potential transaction sizes based on various divestment
                                    percentages, tariff/rent structures, and risk/reward allocations.
                                 • Impact of potential asset sale and leasebacks on financial
                  Financial         accounts (incl. AASB16 lease accounting standard), capital
     Key                            structure and credit rating metrics.
considerations                   • Transaction costs including tax leakage, stamp duty and
                                    restructuring costs.

                                 • Potential valuation uplift taking into account and cashflow
                                    impacts, and valuation multiple implications
                  Valuation      • Evaluation included possible uses of any capital proceeds,
                                    optimal cost of capital, and the relative cost of alternative sources
                                    of funding.
Asset Optimisation — Infrastructure                                                                                      27

 Various ownership options considered, including partial sale with take-or-pay contract or a capacity charge.
 Also evaluated variety of structural options and tariff charges, which were confidentially tested with
  sophisticated investors.

            Operational                               Financial                              Valuation

• Significant proportion of the         • Lease charges / tariff payments       • High multiple sale values require
  portfolio comprises strategic           likely to be capitalised under new      take-or-pay charge, which is sub-
  assets.                                 accounting standards.                   optimal operationally and
                                                                                  financially – likely to reduce value
• Operational and commercial               – Likely to limit increase in debt     long-term.
  flexibility was adversely impacted         capacity due to accounting /
  under most alternative ownership           credit rating effects.             • Capacity based charge structure
  structures – particularly take-or-                                              likely to generate lower multiple
  pay structures.                       • Higher tariff charges generated         value uplift versus current trading
                                          much higher sale value potential        levels.
• Future flexibility remains              but created larger fixed cost base,
  strategically attractive.               which is likely to lead to an
                                          uncompetitive infrastructure
                                          network.
                                        • Some adverse tax consequences
                                          of sale.

 At this point in time optimal to retain full ownership.
 Focus on optimising value and retain flexibility to re-consider other ownership structures in the future if
  beneficial to operations. Market testing demonstrated strong appetite to partner with Caltex.
Asset Optimisation — Convenience Retail Real Estate                                                                  28

 Various ownership options considered, including public REIT, unlisted investment and private individual sale
  and leasebacks.
 Various models for property management and development were also considered.
 Tested with sophisticated investors and market participants.

            Operational                            Financial                              Valuation

• Review confirmed real estate is     • Rent charges expected to be          • Unlisted capital more attractive
  critical to strategy, but             capitalised under new accounting       than public REIT currently – both
  opportunities exist to more           standards.                             would value property materially
  actively manage the portfolio                                                above Caltex's trading multiple.
                                        – Likely to limit increase in debt
• Leases can be structured to             capacity due to accounting /       • Smaller private investor sales also
  minimise operational impacts e.g.       credit rating effects.               competitive, but smaller scale.
  triple net leases.
                                      • Some tax leakage and transaction
• With Convenience Retail               costs would be incurred.
  undertaking new strategic
  direction, advantageous to          • No material financial advantage if
  maintain flexibility over future      proceeds simply reduce debt.
  property assets.

 There is value upside from Caltex more actively managing its property assets, including building in-house
  capability and forming an external partnership with a sophisticated, active real estate player.
 A partial monetisation is now under consideration, with increased disclosure at the appropriate time to
  provide investors with capacity to value Retail real estate assets appropriately.
 Further monetisation may be considered in the future once benefits of current strategy fully understood.
Asset Optimisation – Convenience Retail Real Estate                                                                                                                     29

Caltex to pursue a partnership with a sophisticated Retail real estate investor as the centrepiece
of its newly instituted real estate principles, including a sale of a meaningful portfolio of sites
                                                                                                               Next Steps
                                                                                                            Internal process underway
     Manage our portfolio substantially more actively than has been the case historically
 1   via in-house and external capability to use real estate as a strategic lever for Caltex                Key appointment made*, and internal property
                                                                                                               management structure under development

     Engage with a sophisticated, active real estate player on the basis of a long-term
                                                                                                            Discussions underway with leading domestic and
 2   partnership to enable Caltex to leverage the partner’s capabilities and deliver
                                                                                                               Asian based real estate investors
     incremental value over time

                                                                                                            Considering initially selling up to ~$500m of the
     Commence the partnership with a small but meaningful ‘representative’ portfolio,
 3   with a view to growing this over time
                                                                                                               existing portfolio (i.e. 15 to 25%) with a view to
                                                                                                               further monetisation over time

     Maximise the value of our portfolio to our shareholders over the long-term to the                      Intention to retain 25 to ~50% stake in the
 4   greatest extent possible via sensible segmenting of the network, and by retaining                         partnership to benefit from future optimisation and
     meaningful ownership stakes of high value sites to benefit from future upside                             development upside

 5   Partnership must provide us with a defensible cost of capital on a risk/reward basis                   Competitive process for attractive suitable capital

     Retain a high level of operational and strategic flexibility in our portfolio as our
                                                                                                             Flexibility to roll-out new formats such as Metro
 6   Convenience Retail BU and the P&C market evolves (e.g. triple net lease)
                                                                                                               convenience and The Foodary as the P&C market
                                                                                                               evolves over time

     Institute greater disclosure on Convenience Retail real estate assets going forward to                 Following any sale Caltex plans to initiate ‘REIT style’
 7   provide investors with the ability to value appropriately                                                 disclosure of its Retail real estate assets

                          * Caltex has recently enhanced its internal real estate capability with the recruitment of David Bridger into the role of General Manager –
                          Real Estate and Construction, who has performed similar roles for Coles and McDonalds. David will start with Caltex in 2019 at the
                          expiration of his contractual obligations with his current employer.
Capital Management Discipline                                                                                                 30

Returns Focused Capital Management

Capital management objective

   Caltex regularly reviews the options for capital management based on established priorities to ensure capital is
    deployed as efficiently as possible.
   Caltex’s overarching objective is to deliver top quartile TSR over time.

Committed to maintaining prudent debt levels

   Maintain a capital structure consistent with a strong investment grade credit rating.
   Current BBB+ investment grade credit rating remains a lever to invest in growth and/or respond to changes in the
    operating environment.
   Takes into account all debt (borrowings and lease liabilities)

Disciplined use of free cash flow to generate sustainable long term earnings growth

   Caltex’s priority is to invest in the business and in growth initiatives to generate sustainable, earnings growth, in a
    capital efficient manner.
   Deliver an attractive ordinary dividend stream to shareholders (40-60% dividend payout ratio RCOP NPAT).
   Capital management opportunities in the absence of sustainable growth investments may be considered. The
    preferred form of any additional capital return is an off-market buy-back.
Financial Guidance                                                                                                              31

Indicative Capital Expenditure*, subject to change (includes T&I**)
                                                                                               Prior 2018           New 2018
    $ millions                                          2017               1H 2018
                                                                                               Forecast             Forecast*
    Lytton
      - Stay in business (includes T&I)**                   41                   11               50-70                40-50
      - Growth                                              11                    4                    0               10-20
                                                            52                   15               50-70                50-70

    Fuels and Infrastructure (excl Lytton)
      - Stay in business                                    95                   19                                    60-70
      - Growth                                            339                  102                                  120-130
                                                          433                  121            170-210^              180-200

    Convenience Retail
      - Stay in business                                    84                   46                                 120-125
      - Growth                                            227                    31                                 105-110
                                                          310                    77              ~230^              225-235

    Corporate – Other                                       13                   10               20-30                20-30

    Total                                                 809                  223            470 - 540             475-535

                    * Indicative ranges only. Subject to change pending market conditions, opportunities, etc. Excludes M&A.
                    Latest capex forecasts for Convenience Retail now include its proportionate share of technology capex
                    ** Turnaround & Inspection (T&I) – Caltex has moved to annual T&I maintenance program
                    ^ Prior 2018 capex guidance was provided with Technology capex separate to business unit capex.
                    Historical guidance has been adjusted to provide a like for like comparison
Financial Guidance                                                                                     32

Depreciation & Amortisation

                                                                          Prior 2018       New 2018
           $ millions                      2017           1H 2018
                                                                          Forecast*        Forecast*

           Convenience Retail               85               44                             90-100

           Fuels and Infrastructure        138               73                            130-150
           Corporate                         6                3              5-10            5-10
           Total                           229              120            235-270         225-260

           Increased D&A in 2018 vs 2017 a function of:
           1. M&A acquisitions (Gull)
           2. Capital expenditure on Convenience Retail new formats and digital initiatives

                   * Indicative forecasts only. Subject to any major capex / M&A changes
Financial Guidance                                                                                                        33

Preliminary impact of new lease accounting standard

Caltex has long reported its lease adjusted gearing ratio in its financial disclosures.

   The Group is well advanced for full implementation of AASB16 on 1 January 2019.
      Estimated to bring ~$1.0 bn discounted lease liability on balance sheet, with corresponding right-of-use assets.
      No cashflow impact on the Group.

   The actual impact of applying the standard in FY19 will depend on:
      Future economic conditions, including borrowing rates applicable to leases, applied at 1 January 2019
      Composition of the lease portfolio, and
      Final determination of reasonably certain renewal options on 1 January 2019.
Short-term Priorities                                              34

Retail
 Continue developing Caltex’s retail capability with
  implementation of key enablers (people, systems, supply
  chain, loyalty, customer offer).
 Continue transition of franchised network to company
  operated retail network (to be largely completed by end
  2020), with focus on improved transition performance.
 Co-creation of Metro convenience format, with roll-out of
  initial stores expected in 1H 2019.
 Implementation of loyalty program, increased redemption
  sites, and wholesale grocery supply agreements.
 Strategic partnership with Woolworths underpins the delivery
  of top end of $120-150m EBIT uplift range over 5-6 years,
  with >$30m in 2020.
 Review of Convenience Retail offering across broader
  network, with potential for upside.
Fuels & Infrastructure
 Continued growth in International volumes from Gull, Seaoil
  and Ampol regional capabilities and system optimisation.
 Continue to protect and grow our Australian transport fuels
  business, and continue to leverage infrastructure position,
  scale and its integrated value chain approach.

Strategy Day update for both business units planned for 2H 2018.
35

Appendix
Financial Highlights                                                                                                          36

Reconciliation to underlying (RCOP) profit metric

                                                                              1H 2018                   1H 2017
       Half Year Ending June
                                                                             (After Tax)               (After Tax)

       HCOP NPAT                                                                   383                       265

       Add: Inventory loss/(gain)                                                  (87)                        31

       Add: Significant items (gain)                                                  0                        (2)

       RCOP NPAT                                                                   296                       294

Pricing lags on product sales, previously included in reported externalities, has now been excluded from RCOP earnings, and
is instead included in movement in inventory as a component of inventory gain/loss. While historical HCOP profits remain
unchanged, there has been a minor change in RCOP profits. As previously announced with HY guidance.
Financial Highlights                                        37

Significant Items

                                        1H 2018   1H 2017
 Half Year Ending June
                                          $M        $M

 Sale of fuel oil business                0         19
 Franchisee Employee Assistance Fund      0        (20)
 Total Significant Items (Before Tax)     0         (1)
 Tax                                      0          3

 Total Significant Items (After Tax)      0         2
Strategy Update – Commercial Separation                                                                38

Creating the platform to deliver optionality and growth
across both business units

Key Drivers for Commercial Separation

   Optimisation of group value and long term value creation remains Caltex’s primary objective.
   Both businesses have unique set of core competencies, assets, and opportunities for growth
    as well as differing cultures. Separation will support greater internal focus and efficiency for
    each business.
   Separation will drive competition for capital and improved returns for shareholders.

Key Structural & Accounting Changes

   Fuel supply: Clearer roles and responsibilities between business units, with an internal
    sales price based upon market terms
   Corporate costs: Increased allocation of corporate costs to business units, to better reflect
    use of services and stand alone business costs.
   Woolworths supply: wholesale fuel supply and associated Starcard earnings at WOW sites
    moved from Convenience Retail to Fuels & Infrastructure to better reflect nature of
    relationship.

Next steps

   Unpicking a business that has been integrated for decades takes time, and some fine tuning
    may occur in the future (e.g. allocation of Starcard costs and margins) as Caltex starts to
    work within new commercial arrangements and structure.
Fuels & Infrastructure Highlights – By product                                                                39

Overall volumes up 12% to 10.2BL with growth in all underlying products

BL                                                               Total petrol volumes up 7.4% vs 1H
                      Fuels & Infrastructure Sales                2017, with International sales growth
11                                                                (Gull & Ampol optimisation) more than
                                                                  offsetting volume declines in
10                                                                Convenience Retail and Wholesale
                                                0.96    0.93      (WOW).
 9
      0.30                       0.77    0.81                    Strong volume growth in diesel (+16% or
              0.50       0.69                   1.47    1.55
 8                                                                ~620ML) given increased Wholesale
              1.21               1.39    1.39                     volumes (up ~360ML).
 7    1.21               1.35
                                                                 Jet volumes have also grown strongly
 6                                                                (+12% or ~160ML) given new contract
                                                4.37    4.54      volumes won in key markets, supported
 5    3.58    3.79
                         3.54    3.88    3.92                     by retention of existing customers and
                                                                  modest industry growth. Jet is a growing
 4                                                                market and Caltex is investing in the
                                                                  supply chain.
 3
 2                                                               Other volumes (predominately crude
      3.03    3.14       3.00    3.02           3.18    3.14      optimisation by Ampol, and Lytton
                                         2.92
 1                                                                exports) increased by 12% in 1H 2018
                                                                  (or ~120ML) predominately given
 0                                                                increased activity in crude optimisation.
     1H 2015 2H 2015 1H 2016 2H 2016 1H 2017 2H 2017 1H 2018
             Petrol     Diesel   Jet    Lubes   Other
Lytton Refinery Highlights                                                                                                                                      40

   Lower regional margins, higher yield losses and reduced quality premiums see CRM return back
   towards 10yr average margins

US$/bbl                                                                              Cpl                          Caltex Refiner Margin *
 16                                                                                    16                           Build-up (US$/bbl)
                                   13.68                                                                                          1H 2018            1H 2017
 14                                                                                    14
                                                                                                     Singapore WAM                   11.51             12.73
 12                                                          10.67                     12            Product freight                 3.78               3.32
 10                                              8.88                                  10            Quality premium                 0.45               1.06
                        7.69                                               8.21
                                                                                                     Crude freight                  (2.10)             (1.99)
  8                                16.26                                               8
          6.33                                                                                       Crude premium                  (2.46)             (2.32)
                                                             13.02
  6                                                                                    6
                      11.03                     10.50                                                Yield loss                     (1.13)             (0.45)
          9.79                                                            10.06
  4                                                                                    4             CRM                             10.06             12.36

  2                                                                                    2
                                                                                                  Going forward Caltex plans to report CRM quarterly
  0                                                                                    0          Market competition has seen a portion of quality
         2013        2014  2015                 2016        2017 1H 2018                           premium transfer to supply channels, which Caltex has
                    CRM (USD/bbl)                          CRM (Acpl)                              retained given its integrated business, however it has
                                                                                                   been adjusted down in CRM.

  *The Caltex Refiner Margin (CRM) represents the difference between the cost of importing a standard Caltex basket of products to Eastern Australia and the cost of
  importing the crude oil required to make that product basket. The CRM calculation represents: average Singapore refiner margin + product quality premium + crude
  discount/(premium) + product freight - crude freight - yield loss. Numbers used are volume weighted.
Lytton Refinery Highlights                                                                                                                      41

Strong controllable operational performance continues

 High Value Transport Fuels Production Volumes, Production Utilisation
                         (%) and Availability (%)
BL                                                                                                %      Strong controllable operating
                                                                                                          performance, underpinned by:
3.5                                                                                               100
                        97       97    97      97           98    97               97       97
                96                                                        97
                                                                                                          - Mechanical Availability (97.0%);
        93                                                       3.2
3.0                                                                                         3.1
                                3.0
                                               3.1                                 3.0                    - Operational Availability (96.3%);
                                                        3.0               3.0
                        2.8
                2.7                                                                               90      - 98.5% Yield; and
2.5                              90                               90
        2.5                                                 88
                        88                     88                                           88            - Utilisation (87.8%)
                                      2.2                                 86
2.0                                                                                85
                                                                                                         HVP refinery production 3.12 BL versus
                                                                                                  80      2.95 BL in 1H 2017
                80
1.5                                                                                                      CRM Sales from production 3.2BL
        76                                                                                                versus 3.0BL in 1H 2017
1.0
                                                                                                  70

0.5

                                       65

 -                                                                                                60
       1H13    2H13    1H14    2H14   1H15    2H15     1H16      2H16    1H17     2H17     1H18

      HVP Production volumes (LHS)      Utilisation (RHS)         Mechanical Availability (RHS)
Lytton Refinery Highlights                                                                                             42

Balanced product slate petrols (46%) and middle distillates (diesel, jet; 50%) provides flexibility

                                                          LYTTON
                             2013            2014           2015           2016           2017          1H 2018
 Diesel                       39%            38%            39%             39%            38%            39%
 Premium Petrols              12%            13%            12%             14%            12%            14%
 Jet                          10%            12%            12%             11%            11%            11%
                              61%            63%            63%             64%            62%            64%
 Unleaded Petrol              35%            33%            32%             33%            35%            33%
 Other                        4%              4%             5%             3%              3%             3%
 Total                       100%           100%           100%            100%           100%           100%

   Caltex produces ~1% fuel oil components (in Other), which means Caltex is well positioned for anticipated changes in
    refining margins after the introduction of IMO2020 Fuel standards.

The increase in unleaded petrol mix during 2017 was due to maintenance on the Benzene Hydrogenation Unit (BHU)
Appendix: Our Assets - Retail Infrastructure                                                                                         43

Caltex Retail Service Station Network

                                                                                        Dealer
                                                             Owned        Leased                       Total
                                                                                        Owned

                    Company operated (Calstore)                200           162           0            362

                    Company operated (Diesel Stop)              21           31            0            52

                    Company Operated (Depot Fronts)             5             0            0             5

                    Franchised                                 200           176           0            376

                    Other*                                      49           19           600           668

                    WOW                                         0             0           535           535

                    Total                                      475           388         1,135         1,998

 Regionally: In New Zealand, Caltex’s Gull NZ has 86 sites. This includes 60 controlled retail sites (including 35 unmanned stations),
  23 supply sites and 3 marinas

Valuation

 The book value of Caltex retail network approximates $1.5 billion, comprising Freehold Land, Buildings, Leasehold Improvement,
  Plant & Equipment & related Work in Progress. This is below current indications for market value with recent independent
  valuations of >$2 billion.

                                  * Other includes Supply Agreement sites and Agency StarCard sites
Appendix: Our Assets - Infrastructure (excluding Retail)                                                                                                          44

    Caltex (Non-Retail) Infrastructure Network
                                                                                                                              1    Caltex Refinery
                                                                                                                              13   Caltex owned & operated terminal

                                                                                                                              7    Joint Terminal or Terminal Services
                                                       Darwin
                                                                                                                                   Agreement
                                                                                                                              5    Terminal hosting arrangement
                                                                                          Cairns
                                                                                                                              9    Airport jet fuel supply
                             Broome
                                                                                                                              1    Lubricant manufacturing facility
                                                                                                Townsville
                                                                                                                              2    Lubricant distribution centre
                                                                                                    Mackay
                         Port Hedland                                                                                         5     Major pipeline
                                                                                                         Rockhampton
                                                                                                             Gladstone

                                                                                                                 Brisbane

Geraldton                                                                                                        Gold Coast
                                     Kalgoorlie

     Perth
   Coogee
                                                                                                          Newcastle
                                      Esperance
                       Albany
                                                                Adelaide                                Sydney
                                                                                                        Canberra
                                                                                                                                                              Gull NZ*
                                                                           Corio                                                                              Mt Maunganui
                                                                                   Melbourne

                                                                                        Devonport

     *Gull NZ is a wholly owned subsidiary of Caltex                                           Hobart

                                                                                                                                                                   V20180803
Convenience Retail Update                                             45

Audit of Franchisee underpayment of employees

 Caltex implemented a comprehensive audit program, to audit
  Caltex franchise sites (using independent auditors).

 As at 20/08/2018, we have completed audits/or commenced
  audits of more than 60% of our franchise network (363 sites).

 In July 2018 Caltex commenced the final Tranche of audits (199
  sites), which is anticipated to be completed by mid-2019.

 Caltex previously established a $20 million assistance fund
  (including project costs) for franchisee employees who have not
  been paid their lawful wage by their franchisee employer. A total
  of 390 claims have been received to date, totalling
Appendix: Finance - Balance Sheet                                                                                                      46

Funding Sources & Debt Maturity Profile

 Incorporates Seaoil acquisition: A$114m (20% shareholding acquired March 2018), the issuance of $300m medium term notes and
  a $320m upsize of bank facilities.

                    Current Sources of Funding                                                 Debt Maturity Profile

                        A$m     Source

Medium Term Notes       450     Australian and Asian institutional

Bilateral Bank                                                                                                         1,300
                       1,934    Global banks
Facilities*

                      $2,384m
                                                                                                                               300
                                                                                               250
                                                                             150     169                140                    75
                                                                            2018    2019      2020     2021    2022    2023 Beyond
                                                                                                                             2023

                                                                            Bilateral Bank Facilities* (A$)   Medium Term Notes (A$)

     *AUD equivalent. Funded from Australian and global banks. Contain an ‘evergreen provision’ to facilitate extensions.
Appendix: Historical Segment Results                                                                                                          47

                                                                        1H 2017                     2017

         Fuels & Infrastructure
         Total External Revenue ($m)                                       5,592                    11,893

         F&I (excl Lytton) EBITDA ($m)                                        174                       417
         Lytton CRM ($m)                                                      311                       648
         Lytton opex and other costs ($m)                                   (134)                     (261)
         Lytton EBITDA ($m)                                                   177                       388

         F&I EBITDA ($m)                                                      350                       805
         F&I D&A ($m)                                                        (64)                     (138)
         F&I EBIT ($m)                                                        287                       666

         Convenience Retail^
         Total Fuels Revenue ($m)*                                         1,841                      3,725
         Total Shop Revenue ($m)^^                                            529                     1,069
         Total Fuels and Shop Margin ($m)**                                   421                       823
         Cost of doing business ($m)                                        (193)                     (404)
         EBITDA ($m)                                                          228                       419
         CR D&A ($m)                                                         (40)                       (85)
         EBIT ($m)                                                            187                       334

         * Excludes GST and excise
         ** Fuel and Shop Margin predominately reflects gross margin on all fuel sales less fuel commission paid to franchisees, gross margin on
         company controlled shop sales minus any costs covered by select franchise agreements, and non-fuel income from franchise sites.
         ^ 1H 2017 fuel sales and shop sales include Milemaker contribution for full period
Appendix                                                                                                                                         48

  Summary Financial Information*
                                                                                1H 2018    2017     2016          2015          2014          2013
Dividends

Dividends ($/share)                                                                0.57     1.21     1.02          1.17          0.70             0.34

Dividend payout ratio - RCOP basis (excl. significant items)*                      50%      51%      51%           50%           38%              28%

Dividend franking percentage                                                      100%    100%     100%          100%           100%          100%

Other data

Total revenue ($m)                                                               10,192   16,288   13,027        15,009        18,970        19,595

Earnings per share - HCOP basis (cents per share)                                  147      237      232           193             7              196

Earnings per share - RCOP basis (cents per share) (excl. significant items)*       113      238      199           233           183              123

Earnings before interest and tax - RCOP basis ($m) (excl. significant items)*      443      935      813           977           794              551

Operating cash flow per share ($/share)                                            0.54     2.82     3.56          3.28          2.45             2.25

Interest cover - RCOP basis (excl. significant items)*                             16.3     14.0     11.2          12.7           7.1              6.2

Return on capital employed - RCOP basis (excl. significant items)*               13.5%    15.8%    16.1%         19.5%         15.5%          9.9%

Total equity ($m)                                                                 3,337    3,108    2,810         2,788         2,533         2,597

Return on equity (members of the parent entity) after tax - (HCOP basis)         17.5%    15.8%    18.7%         16.2%          0.6%         15.9%

Total assets ($m)                                                                 7,099    6,355    5,303         5,105         5,129         6,021

Net tangible asset backing ($/share)                                              10.72     9.88     9.88          9.60          8.64             9.05

Net debt ($m)                                                                     1,041     814      454           432           639              742

Net debt to net debt plus equity                                                   24%      21%      14%           13%           20%              22%

                                                                                                      * Based on reported RCOP NPAT of the time
IMPORTANT NOTICE                                                                                                                                   49

This presentation for Caltex Australia Limited is designed to provide:
    an overview of the financial and operational highlights for the Caltex Australia Group for the 6 months period ended 30 June 2018;
      and
    a high level overview of aspects of the operations of the Caltex Australia Group, including comments about Caltex's expectations of
      the outlook for 2018 and future years, as at 28th August 2018.

This presentation contains forward-looking statements relating to operations of the Caltex Australia Group that are based on management’s
own current expectations, estimates and projections about matters relevant to Caltex’s future financial performance. Words such as “likely”,
“aims”, “looking forward”, “potential”, “anticipates”, “expects”, “predicts”, “plans”, “targets”, “believes” and “estimates” and similar expressions
are intended to identify forward-looking statements.

References in the presentation to assumptions, estimates and outcomes and forward-looking statements about assumptions, estimates and
outcomes, which are based on internal business data and external sources, are uncertain given the nature of the industry, business risks,
and other factors. Also, they may be affected by internal and external factors that may have a material effect on future business performance
and results. No assurance or guarantee is, or should be taken to be, given in relation to the future business performance or results of the
Caltex Australia Group or the likelihood that the assumptions, estimates or outcomes will be achieved.

While management has taken every effort to ensure the accuracy of the material in the presentation, the presentation is provided for
information only. Caltex Australia Limited, its officers and management exclude and disclaim any liability in respect of anything done in
reliance on the presentation.

All forward-looking statements made in this presentation are based on information presently available to management and Caltex Australia
Limited assumes no obligation to update any forward looking- statements. Nothing in this presentation constitutes investment advice and
this presentation shall not constitute an offer to sell or the solicitation of any offer to buy any securities or otherwise engage in any
investment activity. You should make your own enquiries and take your own advice in Australia (including financial and legal advice) before
making an investment in the company's shares or in making a decision to hold or sell your shares.
50
You can also read