KBC Group Company presentation - FY 2018 / 4Q 2018 More information: www.kbc.com
←
→
Page content transcription
If your browser does not render page correctly, please read the page content below
KBC Group
 Company presentation
 FY 2018 / 4Q 2018

More information: www.kbc.com

KBC Group - Investor Relations Office – E-mail:   investor.relations@kbc.com

                                                                               1
Important information for investors
This presentation is provided for information purposes only. It does not constitute an offer to sell or the solicitation to buy any
security issued by the KBC Group.
KBC believes that this presentation is reliable, although some information is condensed and therefore incomplete. KBC cannot be
held liable for any loss or damage resulting from the use of the information.
This presentation contains non-IFRS information and forward-looking statements with respect to the strategy, earnings and capital
trends of KBC, involving numerous assumptions and uncertainties. There is a risk that these statements may not be fulfilled and
that future developments differ materially. Moreover, KBC does not undertake any obligation to update the presentation in line
with new developments.
By reading this presentation, each investor is deemed to represent that it possesses sufficient expertise to understand the risks
involved.
2
4Q 2018 key takeaways
4Q18 financial performance
Commercial bank-insurance franchises in core FY18
markets performed well ROE 16%
Cost-income ratio 57% (excl. specific items)
Customer loans and customer deposits
Combined ratio 88%
increased in most of our core countries
Credit cost ratio -0.04%
Higher net interest income and net interest Common equity ratio 16.0% (B3, DC, fully loaded)
margin
Leverage ratio 6.1% (fully loaded)
Lower net fee and commission income Excellent NSFR 136% & LCR 139%
Lower net gains from financial instruments at net Pay-out ratio 59% (including the total dividend and AT1
coupon)
fair value and higher net other income result of
Excellent sales of non-life insurance and lower 621m 855 Net result
sales of life insurance y-o-y EUR in 630
691 692 701
621
Strict cost management 4Q18 556
399
Low net impairments on loans
Solid solvency and liquidity 1Q17 2Q17 3Q17 4Q17 1Q18 2Q18 3Q18 4Q18
A total gross dividend of 3.5 EUR per share
will be proposed to the AGM for the 2018
accounting year (of which an interim dividend of 1 EUR per
share paid in November 2018 and a final dividend of 2.5 EUR per share)
Comparisons against the previous quarter unless otherwise stated 3
Overview of building blocks of the 4Q18 net result

                                                                      1.848
                                                        93                             -41
                                        183

                         407                                                                         -954
         1.166

                                                                                                                                   4
                                                                                                                     -43
                                                                                                                                          -192

                                                                                                                                                    621

          NII            NFCI        Technical        Other  Total Income Bank tax                Opex excl. Impairments          Other   Taxes   4Q18 net
                                     Insurance      Income**                                       bank tax                                        result
                                      Result*
Q-o-Q      +3%            -4%            1%             -37%           -2%                           0%                                             -11%

Y-o-Y      +2%           -11%            32%            -21%            0%                           -3%                                            +66%
***

        * Earned premiums – technical charges + ceded reinsurance
        ** Dividend income + net result from FIFV + net realised result from debt instruments FV through OCI + net other income
        *** Y-o-Y comparison based on pro forma 4Q17 numbers

                                                                                          4
Main exceptional items
                                                                                 4Q18                 3Q18                   4Q17

        NOI – Settlement of legacy legal files                                        +33m EUR
        Opex – Expenses for early retirement                                                                -4m EUR
BE BU

        Tax – DTA impact                                                              +20m EUR
        Tax – Belgian corporate tax reform                                                                                      -85m EUR
                       Total Exceptional Items BE BU                       +53m EUR               -4m EUR                -85m EUR

        Opex – Restructuring costs                                                      -1m EUR               -5m EUR
CZ BU

                       Total Exceptional Items CZ BU                       -1m EUR                -5m EUR
IM BU

        IRL - NOI - Provisions related to the tracker mortgage review                                                          -61.5m EUR
        IRL - Opex - Costs related to sale of part of legacy loan portf.
                                                                                        -1m EUR              -3m EUR
                       Total Exceptional Items IM BU                       -1m EUR                -3m EUR               -61.5m EUR

        NOI – Settlement of legacy legal file                                                                +5m EUR
        Opex – Expenses for early retirement                                                                 -2m EUR
GC

        Tax – Belgian corporate tax reform                                             -16m EUR                                 -126m EUR
                       Total Exceptional Items GC                          -16m EUR               +3m EUR                 -126m EUR

            Total Exceptional Items (pre-tax)                              +35m EUR                  -9m EUR             -272.5m EUR

           Total Exceptional Items (post-tax)                              +26m EUR
                                                                             5
                                                                                                     -7m EUR             -265m EUR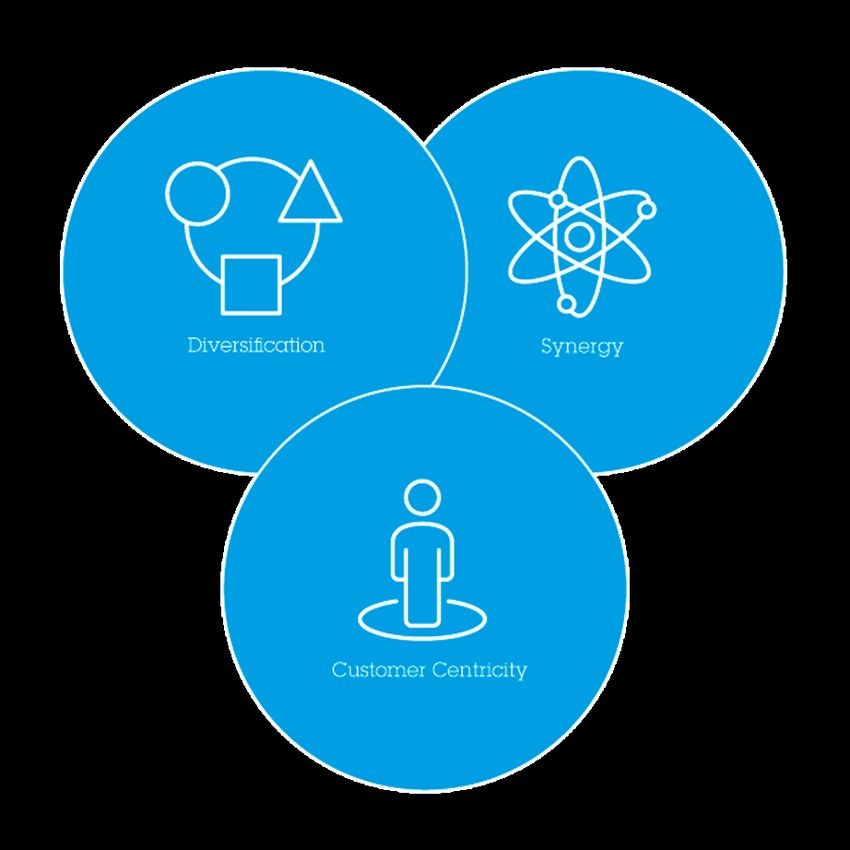
Contents

 1    4Q 2018 performance of KBC Group

 2    4Q 2018 performance of business units

 3    Strong solvency and solid liquidity

 4    FY 2018 key takeaways

 5    Looking forward

Annex 1: FY 2018 performance of KBC Group
Annex 2: Company profile
Annex 3: Other items

                                            6
KBC Group

Section 1

4Q 2018 performance of KBC Group

               7
Net result at KBC Group
                                                                                               CONTRIBUTION OF BANKING ACTIVITIES
                                                                                                   TO KBC GROUP NET RESULT*
                                                                                                 750

                                                                                                                                             603
                                                                                                        575                         574
                                                                                        526                                                         539
                                                                                                                            461
                         NET RESULT AT KBC GROUP*
                                                                                                                     330
                       855
                                                                                        1Q17    2Q17    3Q17         4Q17   1Q18   2Q18     3Q18    4Q18
                                 691               692   701
                630                                            621
                                             556
                                                                                               CONTRIBUTION OF INSURANCE ACTIVITIES
                                       399                                                          TO KBC GROUP NET RESULT*
                                                                                                        137                         155
               1Q17 2Q17 3Q17 4Q17 1Q18 2Q18 3Q18 4Q18
                                                                                        111      113
                                                                                                         96                          74      107     93
                                                                                                                      78    102
                                                                                                 64
                                                                                         78                           27     42               73     66
                                                                                                                                    113
                                                                                                 82      93           84     75
                                                                                         61                                                   61     62

                                                                                        -29                                 -15     -32      -27    -35
* Difference between net result at KBC Group and the sum of the banking and insurance            -33     -52         -34
 contribution is accounted for by the holding-company/group items
                                                                                        1Q17    2Q17    3Q17         4Q17   1Q18   2Q18     3Q18    4Q18

                                                                                                       Non-Life result      Non-technical & taxes

              Amounts in m EUR                                                      8
                                                                                                       Life result
Higher net interest income and net interest margin
NII (pro forma for 2017*) Amounts in m EUR
1,094 1,114 1,137 1,125 1,117 1,136 1,166 Net interest income (1,166m EUR)
1,081
28 21 22 47 27 19 128 17 125 24 • Up by 3% q-o-q and by 2% y-o-y. Note that NII banking
143 3 142 3 144 2 135 3 128 0 124 1 2 2
increased by 3% q-o-q and by 7% y-o-y
• The q-o-q increase was driven primarily by:
1,016
907 928 946 952 970 972 989 o additional positive impact of both short- & long-term
interest rate increases in the Czech Republic
o continued good loan volume growth
1Q17 2Q17 3Q17 4Q17 1Q18 2Q18 3Q18 4Q18 o lower funding costs
NII - netted positive impact of ALM FX swaps** NII - Insurance
o higher netted positive impact of ALM FX swaps
NII - Holding-company/group NII - Banking
partly offset by:
NIM (pro forma for 2017***) o lower reinvestment yields in our euro area core countries
2.01% 2.00% 2.02% o pressure on commercial loan margins in most core
1.96% 1.96% 1.97% 1.98%
1.93% countries
Net interest margin (2.02%)
• Up by 4 bps q-o-q and by 5 bps y-o-y due mainly to the
positive impact of repo rate hikes in the Czech Republic and
lower funding costs
1Q17 2Q17 3Q17 4Q17 1Q18 2Q18 3Q18 4Q18
* 2017 pro forma figures for NII as the impact of ALM FX derivatives was ‘netted’ in NII as of 2018
** From all ALM FX swap desks
*** NIM is calculated excluding the dealing room and the net positive impact of ALM FX swaps & repos
ORGANIC VOLUME TREND Total loans** o/w retail mortgages Customer deposits*** AuM Life reserves
Volume 147bn 61bn 194bn 200bn 28bn
Growth q-o-q* +1% +1% 0% -6% -2%
Growth y-o-y +5% +3% +1% -8% -4%
* Non-annualised ** Loans to customers, excluding reverse repos (and bonds) 9
*** Customer deposits, including debt certificates but excluding repos. Customer deposit volumes excluding debt certificates & repos stable q-o-q and +5% y-o-yLower net fee and commission income
F&C (pro forma for 2017*) Amounts in m EUR
Net fee and commission income (407m EUR)
463 454 456 450
• Down by 4% q-o-q and by 11% y-o-y
433 438 424 407
• Q-o-q decrease was the result chiefly of:
208 213 213 229 215 223 219 o Net F&C income from Asset Management Services
225
decreased by 7% q-o-q as a result of lower management
fees from mutual funds and unit-linked life insurance
323 314 301
products, despite seasonally higher entry fees from mutual
295 299 281 275 255
funds and unit-linked life insurance products
o Net F&C income from banking services increased by 3%
-70 -74
-69 -73 -74 -75 -64 -66 q-o-q due mainly to higher network income and higher fees
1Q17 2Q17 3Q17 4Q17 1Q18 2Q18 3Q18 4Q18 from credit files & bank guarantees, partly offset by
seasonally lower fees from payment services
Distribution Banking services Asset management services
o Distribution costs rose by 6% q-o-q due chiefly to higher
* 2017 pro forma figures as the network income shifted from FIFV to net F&C as of 2018
commissions paid on life insurance sales
• Y-o-y decrease was mainly the result of:
Amounts in bn EUR
o Net F&C from Asset Management Services decreased by
15% y-o-y as a result of lower entry and management fees
AuM*
from mutual funds & unit-linked life insurance products
214 213 215 217 213 214 213 o Net F&C income from banking services decreased by 2%
200
y-o-y as higher fees from payment services and higher
network income was more than offset by lower securities-
related fees and lower fees from credit files & bank
guarantees
1Q17 2Q17 3Q17 4Q17 1Q18 2Q18 3Q18 4Q18
Assets under management (200bn EUR)
• Decreased by 6% q-o-q (and by 8% y-o-y) due largely to a
* Note that 3Q18 AuM figures were restated due to a reclassification of roughly -1bn negative price effect
EUR of assets under investment advice
• The mutual fund business has seen small net
10 outflows, mainly to savings accountsInsurance premium income up y-o-y
and excellent combined ratio
PREMIUM INCOME (GROSS EARNED PREMIUMS) Insurance premium income (gross earned
825
premiums) at 825m EUR
794
672 660
714 707 696 • Non-life premium income (409m) increased by 7%
636
410
416 y-o-y
336 315 293
312 267 282 • Life premium income (416m) up by 42% q-o-q and
by 1% y-o-y
360 369 378 384 378 392 403 409
1Q17 2Q17 3Q17 4Q17 1Q18 2Q18 3Q18 4Q18
Life premium income Non-Life premium income
The non-life combined ratio for FY18
COMBINED RATIO (NON-LIFE) amounted to 88%, an excellent level in line
90%
84% 88% 83% 88% 88% 88% with FY17. Note however that FY17 benefited
79%
from an one-off release of provisions in
Belgium (positive effect of 26m EUR).
Excluding this one-off release, the combined
ratio amounted to 90% at FY17
1Q 1H 9M FY
2017 2018
11
Amounts in m EURNon-life sales up y-o-y, life sales down y-o-y
NON-LIFE SALES (GROSS WRITTEN PREMIUM) Sales of non-life insurance products
468 492 • Up by 9% y-o-y thanks to a good commercial
performance in all major product lines in our core
382 378 373
358 349 342 markets and tariff increases
1Q17 2Q17 3Q17 4Q17 1Q18 2Q18 3Q18 4Q18
Sales of life insurance products
• Increased by 33% q-o-q and decreased by 13% y-o-y
LIFE SALES • The q-o-q increase was driven mainly by higher sales of
588 guaranteed interest products in Belgium (attributable
510
474 498 chiefly to traditionally higher volumes in tax-
426
415 405 318 383 incentivised pension saving products in 4Q18) and
267 279 341 higher sales of unit-linked products in Belgium and the
222 218 261 230 Czech Republic
207
270 219
• The y-o-y decrease was driven primarily by lower sales
193 187 153 169
165 of unit-linked products in Belgium
1Q17 2Q17 3Q17 4Q17 1Q18 2Q18 3Q18 4Q18 • Sales of unit-linked products accounted for 33% of total
life insurance sales in 4Q18
Guaranteed interest products Unit-linked products
12
Amounts in m EURLower FV gains and higher other net income
FV GAINS (pro forma for 2017*) The lower q-o-q figures for net gains from
180 financial instruments at fair value were
130
attributable mainly to:
86 118
94 96 • a negative change in market, credit and funding value
79
110 94
54 adjustments (mainly as a result of changes in the
73 71 73 35 66 2 underlying market value of the derivatives portfolio
1 7 4 32 and increased credit & funding spreads)
19 21 12 11 17 19 33 11 2
-14 -27 -3 • lower net result on equity instruments (insurance)
1Q17 2Q17 3Q17 4Q17 1Q18 2Q18 3Q18 4Q18 partly offset by:
Other FV gains Net result on equity instruments (overlay insurance) • a positive change in ALM derivatives
M2M ALM derivatives Note that dealing room income stabilised q-o-q
* 2017 pro forma figures as:
1) the impact of the FX derivatives was ‘netted’ in NII as of 2018
2) the shift from realised gains on AFS shares and impairments on AFS shares to FIFV
due to IFRS 9 (overlay approach for insurance) Other net income amounted to 76m EUR,
higher than the normal run rate of around 50m
EUR. 4Q18 was positively impacted by the
OTHER NET INCOME settlement of legacy legal files in the Belgium
77
71
76 Business Unit (+33m EUR). Note that 4Q17 was
56 negatively impacted by an additional provision
47 of 61.5m EUR related to an industry wide review
23 of the tracker rate mortgage products
4 originated in Ireland before 2009
-14
1Q17 2Q17 3Q17 4Q17 1Q18 2Q18 3Q18 4Q18
13
Amounts in m EURStrict cost management
OPERATING EXPENSES Cost/income ratio (banking): 54% in 4Q18 and
57.5% in FY18. C/I ratio adjusted for specific
1,291
1,229 items* at 61% in 4Q18 and 57% in FY18 (55% in
361 914
1,021 371 966 981 996 FY17). Excluding the consolidation impact of
910 41
19 18
24 26 41
UBB/ Interlease, bank tax, FX effect and one-off
costs, operating expenses in FY18 rose by 1.7%
980 956 954
y-o-y
868 891 896 920 942
• Operating expenses excluding bank tax roughly
stabilised q-o-q primarily as a result of:
1Q17 2Q17 3Q17 4Q17 1Q18 2Q18 3Q18 4Q18
o lower staff expenses, despite wage inflation in
Bank tax Operating expenses
most countries
o less one-off costs (2m EUR in 4Q18 vs 14m in
3Q18)
offset by:
BANK TAX SPREAD IN 2018 o seasonal effects such as traditionally higher ICT and
TOTAL Upfront Spread out over the year professional fee expenses
4Q18 1Q18 2Q18 3Q18 4Q18 1Q18 2Q18 3Q18 4Q18 o higher depreciation & amortisation costs
Note that contrary to previous years, marketing
BE BU 0 273 -4 0 0 0 0 0 0
expenses were better spread throughout the year
CZ BU 0 29 1 0 0 0 0 0 0
Hungary 22 26 0 0 0 19 22 21 22 • Operating expenses without bank tax decreased by
3% y-o-y in 4Q18 due mainly to lower marketing and
Slovakia 4 3 0 0 0 4 4 4 4
staff expenses, partly offset by higher ICT costs
Bulgaria 0 14 1 0 0 0 0 0 0
Ireland 14 3 0 0 0 1 0 1 14 • Total bank taxes (including ESRF contribution)
increased from 439m EUR in FY17 to 462m EUR in
GC 0 0 0 0 0 0 0 0 0 FY18
TOTAL 41 347 -2 0 0 24 26 26 41
14
Amounts in m EUR * See glossary (slide 89) for the exact definitionOverview of bank taxes*
KBC GROUP BELGIUM BU
Bank taxes of 462m EUR in Bank taxes of 269m EUR in
361 371 278 273
FY18, representing 10.9% of FY18, representing 10.8% of
53 FY18 opex at the Belgium BU
83 98 FY18 opex at KBC Group** 58
225 215
278 273
41 41
19 18 24 26 0 3 0 0
20 22 2 -4 -7
-1 -2
-6 -7 -4
1Q17 2Q17 3Q17 4Q17 1Q18 2Q18 3Q18 4Q18 1Q17 2Q17 3Q17 4Q17 1Q18 2Q18 3Q18 4Q18
European Single Resolution Fund contribution ESRF contribution Common bank taxes
Common bank taxes
Bank taxes of 163m EUR in
FY18, representing 17.9% of
Bank taxes of 30m EUR in FY18 opex at the IM BU
CZECH REPUBLIC BU FY18, representing 4.1% of
INTERNATIONAL MARKETS BU
29 FY18 opex at the CZ BU 70
26
57 18
11
41 41
22
20
25 25 27 26
46 1 52
24 28
6 1 0 0 6 1 0 0
-1
1Q17 2Q17 3Q17 4Q17 1Q18 2Q18 3Q18 4Q18
1Q17 2Q17 3Q17 4Q17 1Q18 2Q18 3Q18 4Q18
ESRF contribution Common bank taxes
ESRF contribution Common bank taxes
* This refers solely to the bank taxes recognised in opex, and as such it does not take account of income tax expenses, non-recoverable VAT, etc.
** The C/I ratio adjusted for specific items of 57% in FY18 amounts to roughly 50% excluding these bank taxes
15Low asset impairments, excellent credit cost ratio and
improved impaired loans ratio
ASSET IMPAIRMENT
43 Low asset impairments
31 2 13
8 10 • This was attributable mainly to:
29 30
7 1
21
6
20 o loan loss impairments of 48m EUR in Belgium due to a
5 -8 6
-76 -27 -63
-21 -2 number of corporate files
-1 o small loan loss impairments in Slovakia and Bulgaria
-56
partly offset by:
-71 o net loan loss impairment releases in Ireland of 15m EUR (in
1Q17 2Q17 3Q17 4Q17 1Q18 2Q18 3Q18 4Q18 line with 3Q18)
Other impairments Impairments on financial assets at AC* and FVOCI o small net loan loss impairment reversals in Hungary and
* AC = Amortised Cost. Under IAS 39, impairments on L&R
Group Centre
CREDIT COST RATIO Note that there were no loan loss impairments nor releases in
0.42% the Czech Republic
0.23%
• Impairment of 13m EUR on ‘other’, mainly as the result of a
0.09%
review of residual values of financial car leases under short-term
contracts in the Czech Republic
-0.06% -0.04%
FY14 FY15 FY16 FY17 FY18 The credit cost ratio amounted to -0.04% in FY18 due to
low gross impairments and several releases
IMPAIRED LOANS RATIO
6.8% 6.9% 6.6%
6.0% 5.9%
5.5% 5.5% The impaired loans ratio improved to 4.3%, 2.5% of
4.3% which over 90 days past due. This sharp improvement
was mainly the result of the sale of part of the Irish legacy
3.6% 3.9% 3.7% 3.4% 3.5% 3.2% 3.2%
portfolio (closed during 4Q18)
2.5%
1Q17 2Q17 3Q17 4Q17 1Q18 2Q18 3Q18 4Q18
16
Impaired loans ratio of which over 90 days past dueKBC Group
Section 2
4Q 2018 performance of business units
17Business profile
BELGIUM CZECH GROUP
SLOVAKIA HUNGARY BULGARIA IRELAND
REPUBLIC CENTRE
4Q18 NET RESULT (in million euros) 361m 170m 13m 49m 19m 11m -3m
ALLOCATED CAPITAL (in billion euros) 6.5bn 1.6bn 0.6bn 0.8bn 0.4bn 0.6bn 0.3bn
LOANS (in billion euros) 100bn 23bn 7bn 4bn 3bn 10bn
DEPOSITS (in billion euros) 131bn 32bn 6bn 8bn 4bn 5bn
BRANCHES (end 2018) 585 235 122 206 214 16
Clients (end 2018) 3.5m 3.6m 0.6m 1.6m 1.3m 0.3m
18Belgium BU (1): net result of 361m EUR
NET RESULT Net result at the Belgium Business Unit amounted
483
to 361m EUR
455
437 • The quarter under review was characterised by higher
409 net interest income, lower net fee and commission
336
361 income, sharply lower trading and fair value income,
301 higher other net income, an excellent combined ratio,
243 higher sales of life insurance products, lower operating
expenses and higher impairment charges q-o-q
• Customer deposits excluding debt certificates and
repos rose by 5% y-o-y, while customer loans also
increased by 5% y-o-y
1Q17 2Q17 3Q17 4Q17 1Q18 2Q18 3Q18 4Q18
Amounts in m EUR
ORGANIC VOLUME TREND Total loans** o/w retail mortgages Customer deposits*** AuM Life reserves
Volume 100bn 35bn 131bn 186bn 26bn
Growth q-o-q* +1% +1% 0% -6% -2%
Growth y-o-y +5% +2% -1% -8% -4%
* Non-annualised ** Loans to customers, excluding reverse repos (and bonds)
*** Customer deposits, including debt certificates but excluding repos. Customer deposit volumes excluding debt certificates & repos stable q-o-q and +5% y-o-y
19Belgium BU (2): higher NII and NIM
NII (pro forma for 2017*) Amounts in m EUR
681 677 677
Net interest income (647m EUR)
664 649 642 637 647
28 19 20 39 19 11 8 11 • Up by 2% q-o-q due mainly to:
129
130 132 123 117 113 116 113 o good loan volume growth
o higher netted positive impact of FX swaps
o lower funding costs on term deposits
523
partly offset by:
523 529 512 515 513 518 513
o lower reinvestment yields
o pressure on commercial margins
1Q17 2Q17 3Q17 4Q17 1Q18 2Q18 3Q18 4Q18 • Down by 4% y-o-y, driven primarily by:
NII - netted positive impact of ALM FX swaps** NII - contribution of banking o lower netted positive impact of FX swaps
NII - contribution of insurance o lower reinvestment yields
o pressure on commercial loan margins
* 2017 pro forma figures for NII as the impact of ALM FX derivatives was ‘netted’ in NII as of 2018
** From all ALM FX swap desks partly offset by:
*** NIM is calculated excluding the dealing room and the net positive impact of ALM FX swaps & repos o lower funding costs on term deposits
o good loan volume growth
NIM (pro forma for 2017***)
1.78% 1.79% 1.73% 1.73%
• Note that NII banking rose by 2% both q-o-q and y-o-y
1.72% 1.72% 1.69% 1.72%
Net interest margin (1.72%)
• Rose by 3 bps q-o-q due chiefly to a higher transformation result
(as a result of higher volumes)
• Fell by 1 bp y-o-y due mainly to the negative impact of lower
reinvestment yields and pressure on commercial loan margins
1Q17 2Q17 3Q17 4Q17 1Q18 2Q18 3Q18 4Q18
20Credit margins in Belgium
PRODUCT SPREAD ON CUSTOMER LOAN BOOK, OUTSTANDING
1.3
1.2
1.1
1.0
0.9
0.8
0.7
0.6
0.5
0.4
0.3
0.2
0.1
0.0
1Q11 2Q11 3Q11 4Q11 1Q12 2Q12 3Q12 4Q12 1Q13 2Q13 3Q13 4Q13 1Q14 2Q14 3Q14 4Q14 1Q15 2Q15 3Q15 4Q15 1Q16 2Q16 3Q16 4Q16 1Q17 2Q17 3Q17 4Q17 1Q18 2Q18 3Q18 4Q18
Customer loans
PRODUCT SPREAD ON NEW PRODUCTION
1.8
1.6
1.4
1.2
1.0
0.8
0.6
0.4
0.2
1Q11 2Q11 3Q11 4Q11 1Q12 2Q12 3Q12 4Q12 1Q13 2Q13 3Q13 4Q13 1Q14 2Q14 3Q14 4Q14 1Q15 2Q15 3Q15 4Q15 1Q16 2Q16 3Q16 4Q16 1Q17 2Q17 3Q17 4Q17 1Q18 2Q18 3Q18 4Q18
SME and corporate loans Mortgage loans
21Belgium BU (3): lower net F&C income
F&C (pro forma for 2017*) Amounts in m EUR
Net fee and commission income (273m EUR)
356
339
10
9 307
321 318 302 • Net F&C income decreased by 5% q-o-q due mainly to:
8 9 289 273
7 9 9 11
o lower management fees from mutual funds and unit-
linked life insurance products
o lower securities-related fees
391 376 352 368 356 345 333 319
o seasonally lower fees from payment services
o higher commissions paid on life insurance sales
partly offset by:
o seasonally higher entry fees from mutual funds and
-45 -45 -52 -55 -47 -53 -53 -57 unit-linked life insurance products
1Q17 2Q17 3Q17 4Q17 1Q18 2Q18 3Q18 4Q18 o higher network income
F&C - network income F&C - contribution of banking • Fell by 15% y-o-y driven chiefly by lower entry and
F&C - contribution of insurance management fees from mutual funds & unit-linked life
insurance products and lower securities-related fees
* 2017 pro forma figures as the network income shifted from FIFV to net F&C as of 2018
partly offset by higher fees from payment services and
higher network income
AuM* Amounts in bn EUR
200 198 200 202 199 200 199
186
Assets under management (186bn EUR)
• Decreased by 6% q-o-q (and by 8% y-o-y) due largely to a
negative price effect
1Q17 2Q17 3Q17 4Q17 1Q18 2Q18 3Q18 4Q18
* Note that 3Q18 AuM figures were restated due to a reclassification of roughly -1bn
EUR of assets under investment advice
22Belgium BU (4): higher y-o-y non-life sales,
excellent combined ratio
Sales of non-life insurance products
NON-LIFE SALES (GROSS WRITTEN PREMIUM) • Increased by 4% y-o-y
329
323 • Premium growth in all classes
256 262 252
241 238
228
1Q17 2Q17 3Q17 4Q17 1Q18 2Q18 3Q18 4Q18
Amounts in m EUR
COMBINED RATIO (NON-LIFE)
93% Combined ratio amounted to 87% in FY18
87% 87%
77%
81% 80%
86% 87%
(86% in FY17), an exceptional level as a result of
low technical charges. Note that FY17 was
positively impacted by an one-off release of
provisions (positive effect of 26m EUR). Excluding
this one-off release, the combined ratio
amounted to 88% in FY17
1Q 1H 9M FY
2017 2018
23Belgium BU (5): higher q-o-q life sales, good cross-selling
ratios
LIFE SALES Sales of life insurance products
460
• Rose by 41% q-o-q driven mainly by higher sales of
404
guaranteed interest products (attributable chiefly to
396 397
traditionally higher volumes in tax-incentivised
340
306
333 pension saving products in 4Q18) and higher sales of
290
250
282 unit-linked products due to commercial efforts
241
197
193 233
309 • Decreased by 14% y-o-y driven entirely by lower sales
201 of unit-linked products
• As a result, guaranteed interest products and unit-
170
155 143 113
154
101 81 87 linked products accounted for 78% and 22%,
respectively, of life insurance sales in 4Q18
1Q17 2Q17 3Q17 4Q17 1Q18 2Q18 3Q18 4Q18
Guaranteed interest products Unit-linked products
Amounts in m EUR
MORTGAGE-RELATED CROSS-SELLING RATIOS Mortgage-related cross-selling ratios
90 • 85.6% for property insurance
85 85.6%
• 79.5% for life insurance
80 79.5%
75
70
65
60 63.7%
Property insurance Life insurance
55
50
45 49.5%
40
24Belgium BU (6): sharply lower FV gains and higher other net
income
FV GAINS (pro forma for 2017*) The sharply lower q-o-q figures for net gains
110
from financial instruments at fair value were
61
74
51 54 53
primarily due to a negative change in market,
23
36 34
7
14 33
credit and funding value adjustments (mainly
29 30 36
20 21
10
14 12
17
19 33 18
as a result of changes in the underlying
17
-2 -2
2 3 2
-45
market value of the derivative portfolio and
increased credit & funding spreads) and, to a
-40
1Q17 2Q17 3Q17 4Q17 1Q18 2Q18 3Q18 4Q18
lesser extent, a negative change in ALM
derivatives
Other FV gains Net result on equity instruments (overlay insurance)
M2M ALM derivatives
* 2017 pro forma figures as:
1) the impact of the FX derivatives was ‘netted’ in NII as of 2018
2) the shift from realised gains on AFS shares and impairments on AFS shares to FIFV
due to IFRS 9 (overlay approach for insurance)
Other net income amounted to 73m EUR in
OTHER NET INCOME
4Q18, higher than the normal run rate driven
73 by the settlement of legacy legal files
59
51 49
46 44
40 38
1Q17 2Q17 3Q17 4Q17 1Q18 2Q18 3Q18 4Q18
25
Amounts in m EURBelgium BU (7): lower opex and higher impairments, good
credit cost ratio
OPERATING EXPENSES Operating expenses: -3% q-o-q and -4% y-o-y
822 822
• Operating expenses without bank tax fell by 3% q-o-q and
by 4% y-o-y due mainly to lower ICT, staff and marketing
expenses, partly offset by higher professional fee expenses
278 273
544 520
566 562 559 541 • Cost/income ratio: 53% in 4Q18 and 58% in FY18. Adjusted
for specific items, the C/I ratio amounted to 62% in 4Q18
and 58% in FY18 (53% in FY17)
544 550 527 549 566
-6 -7 -4
1Q17 2Q17 3Q17 4Q17 1Q18 2Q18 3Q18 4Q18
Bank tax Operating expenses
ASSET IMPAIRMENT
60
Loan loss impairments increased to 48m EUR in 4Q18
(compared with 3m EUR in 3Q18) as 4Q18 was
49
1
impacted by a number of corporate files. Credit cost
ratio amounted to 9 bps in FY18 (9 bps in FY17)
34
24 26 Impaired loans ratio slightly increased to 2.6%, 1.2%
13
48
of which over 90 days past due
14 4
3 1
-1
-2
1Q17 2Q17 3Q17 4Q17 1Q18 2Q18 3Q18 4Q18
Other impairments Impairments on financial assets at AC* and FVOCI
* AC = Amortised Cost. Under IAS 39, impairments on L&R
Amounts in m EUR 26Net result at the Belgium BU
CONTRIBUTION OF BANKING ACTIVITIES TO
NET RESULT OF THE BELGIUM BU*
385
336 325
302
271 279
NET RESULT AT THE BELGIUM BU* 208
165
483
455 437
409
361
336
301 1Q17 2Q17 3Q17 4Q17 1Q18 2Q18 3Q18 4Q18
243
CONTRIBUTION OF INSURANCE ACTIVITIES TO
NET RESULT OF THE BELGIUM BU*
119 135
1Q17 2Q17 3Q17 4Q17 1Q18 2Q18 3Q18 4Q18
93 98 58
79 84 82
48 65 78
64 9 20 55 52
101
70 80 74 63
50 48 49
-19 -5 -19 -19
-21 -20 -24
-40
* Difference between net profit at the Belgium Business Unit and the sum of 1Q17 2Q17 3Q17 4Q17 1Q18 2Q18 3Q18 4Q18
the banking and insurance contribution is accounted for by the rounding up
Non-Life result Life result Non-technical & taxes
or down of figures
Amounts in m EUR 27Czech Republic BU
NET RESULT Amounts in m EUR
181 183
170 171 170
Net result of 170m EUR in 4Q18
167 168
145
+2% q-o-q excluding FX effect due mainly to higher net
interest income and lower impairments, partly offset by
lower net results from financial instruments at fair value
and higher costs
Customer deposits (including debt certificates, but
1Q17 2Q17 3Q17 4Q17 1Q18 2Q18 3Q18 4Q18
excluding repos) rose by 8% y-o-y, while customer loans
increased by 6% y-o-y
NII & NIM Amounts in m EUR
291 Highlights
263
234 248 241
216 220
2.93% 2.91%
218
2.84% 2.95% 3.02% 2.97% 3.04% 3.25% Net interest income
• +11% q-o-q and +25% y-o-y excl. FX effects
• Q-o-q increase: primarily due to short- & long-term increasing
interest rates and growth in loan and deposit volume, despite
pressure on commercial margins
1Q17 2Q17 3Q17 4Q17 1Q18 2Q18 3Q18 4Q18 • Net interest margin at 3.25%: +21 bps q-o-q and +30 bps y-o-y
NIM NII
ORGANIC VOLUME TREND Total loans ** o/w retail mortgages Customer deposits*** AuM Life reserves
Volume 23bn 11bn 32bn 9.5bn 1.3bn
Growth q-o-q* 0% +2% +1% -3% +2%
Growth y-o-y +6% +8% +8% -1% +3%
* Non-annualised ** Loans to customers, excluding reverse repos (and bonds) *** Customer deposits, including debt certificates but excluding repos
28Czech Republic BU
Net F&C income
F&C (pro forma for 2017*) • +4% q-o-q and +1% y-o-y on a pro forma basis excl. FX effects
Amounts in m EUR • Q-o-q increase driven mainly by higher fees from payment
64
67
64 64
services and higher fees from credit files & bank guarantees
62
56 56 10 8 10
53 10 10
9 9
10
Assets under management
47 47
53 57 56 52 54 • 9.5bn EUR
43
• -3% q-o-q and -1% y-o-y due largely to a negative price effect
1Q17 2Q17 3Q17 4Q17 1Q18 2Q18 3Q18 4Q18
F&C - network income F&C - banking & insurance Trading and fair value income
* 2017 pro forma figures as the network income shifted from FIFV to net F&C as of 2018 • 16m EUR lower q-o-q net results from financial instruments at
fair value (to 4m EUR) due mainly to a lower q-o-q change in
market, credit & funding value adjustments and lower dealing
room results
CROSS-SELLING RATIOS
Mortg. & prop. Mortg. & life risk Cons.fin. & life risk Insurance
• Insurance premium income (gross earned premium): 143m EUR
o Non-life premium income (64m EUR) +10% y-o-y excluding FX
effect, due to growth in all products
65% 63%
61% 59%
47% 48% 48%
57% 54% o Life premium income (79m EUR) +25% q-o-q and -18% y-o-y,
excluding FX effect. Q-o-q increase mainly in unit-linked single
2016 2017 2018 2016 2017 2018 2016 2017 2018 premiums
• Combined ratio of 97% in FY18 (97% in FY17)
29Czech Republic BU
Operating expenses
OPERATING EXPENSES Amounts in m EUR
• 187m EUR; +4% q-o-q and +6% y-o-y, excluding FX effect
189 187
177 173 180
0
and bank tax
165 0 0
151 153 29 1 • Q-o-q increase excluding FX effect and bank tax was due
26 1 0 mainly to seasonally higher facilities & other expenses and
higher professional fees. Note that staff expenses
180 186
stabilised q-o-q as wage inflation was offset by fewer FTEs
150 152
176
160 172 and less severance costs
139
• Y-o-y increase excluding FX effect and bank tax was due
primarily to higher staff expenses (wage inflation) and
higher support to the Czech Post (which is compensated by
1Q17 2Q17 3Q17 4Q17 1Q18 2Q18 3Q18 4Q18 lower paid fee)
Bank tax Operating expenses • Cost/income ratio at 45% in 4Q18 and 47% in FY18.
Adjusted for specific items, C/I ratio amounted to roughly
47% in 4Q18 and 46% in FY18 (43% in FY17)
ASSET IMPAIRMENT Amounts in m EUR
Loan loss and other impairment
16
• No loan loss impairments in 4Q18 compared with 12m
11 9 4
EUR loans loss impairments in 3Q18 due to 1 large
11 10 corporate file. Credit cost ratio amounted to 0.03% in FY18
3 7
13 13 12 2014 2015 2016 2017 2018
3 6
7
2 CCR 0.18% 0.18% 0.11% 0.02% 0.03%
1 1
-2
-1 -4
• Impaired loans ratio amounted to 2.4%, 1.3% of which >90
1Q17 2Q17 3Q17 4Q17 1Q18 2Q18 3Q18 4Q18
days past due
Other impairments Impairments on financial assets at AC* and FVOCI • Impairment of 10m EUR on ‘other’ mainly as the result of a
* AC = Amortised Cost. Under IAS 39, impairments on L&R review of residual values of financial car leases under
short-term contracts
30International Markets BU
Amounts in m EUR
177 NET RESULT
5 163 Net result of 93m EUR
26 141
137
Slovakia 13m EUR, Hungary 49m EUR, Ireland 11m EUR
31
114
4
99 21
55
and Bulgaria 19m EUR
93
32
78 74 57 19
67
22 18 11
47
3 62 51 Highlights (q-o-q results)
40 34 49
20 39 Lower net interest income. NIM 2.74% in 4Q18 (-5 bps q-o-q and
27
22 25 16 16 23 19 13 -10 bps y-o-y)
-1 Lower net fee and commission income
1Q17 2Q17 3Q17 4Q17 1Q18 2Q18 3Q18 4Q18
Lower result from financial instruments at fair value
Bulgaria Ireland Hungary Slovakia An excellent combined ratio of 90% in FY18
Lower life insurance sales (in HU)
Higher costs (mainly higher bank taxes in IRL)
Lower net impairment releases
ORGANIC VOLUME TREND Total loans ** o/w retail mortgages Customer deposits*** AuM Life reserves
Volume 24bn 14bn 23bn 5.0bn 0.7bn
Growth q-o-q* +1% +2% +2% +4% 0%
Growth y-o-y +4% +4% +2% -11% +3%
* Non-annualised ** Loans to customers, excluding reverse repos (and bonds) *** Customer deposits, including debt certificates but excluding repos
31International Markets BU - Slovakia
Net result of 13m EUR
NET RESULT Amounts in m EUR
27
25
23
22
Highlights (q-o-q results)
19
Lower net interest income as margin pressure more than offset
16 16
the volume growth
13
Lower net fee & commission income due mainly to seasonally
lower fees from payment services
Lower net results from financial instruments at fair value due
entirely to lower M2M ALM derivatives
Lower net other income
1Q17 2Q17 3Q17 4Q17 1Q18 2Q18 3Q18 4Q18
Excellent combined ratio (87% in FY18); slightly higher technical
insurance result in life
Higher operating expenses due mainly to higher marketing and
regulatory costs
Impairments (mainly in corporates and leasing) in 4Q18
compared with net impairment releases in 3Q18; credit cost
ORGANIC Total o/w retail Customer ratio of 0.06% in FY18
VOLUME TREND loans ** mortgages deposits***
Volume 7bn 3bn 6bn Volume trend
Growth q-o-q* +2% +2% 0% Total customer loans rose by 2% q-o-q and by 8% y-o-y, among
other things due to the continuously increasing mortgage
Growth y-o-y +8% +10% +5%
portfolio and corporate portfolio
* Non-annualised ** Loans to customers, excluding reverse repos (and bonds)
Total customer deposits stabilised q-o-q and increased by 5%
*** Customer deposits, including debt certificates but excluding repos y-o-y (due mainly to retail)
32International Markets BU - Hungary
Net result of 49m EUR
NET RESULT Amounts in m EUR
62
51
Highlights (q-o-q results)
49
47 Higher net interest income excluding FX effect (despite margin
40 39
34
pressure)
Stable net fee and commission income excluding FX effect
20 Lower net results from financial instruments at fair value due
mainly to lower M2M ALM derivatives and dealing room result
Stable net other income
Good non-life commercial performance y-o-y in all major
1Q17 2Q17 3Q17 4Q17 1Q18 2Q18 3Q18 4Q18
product lines and growing average tariff in motor retail;
excellent combined ratio (90% in FY18); lower sales of life
insurance products q-o-q
Higher operating expenses excluding FX effect due mainly to
higher ICT and professional fee expenses
Net impairment releases on loans (in retail). Credit cost ratio of
-0.18% in FY18
ORGANIC Total o/w retail Customer
VOLUME TREND loans ** mortgages deposits***
Volume 4bn 1bn 8bn Volume trend
Total customer loans rose by 1% q-o-q and by 7% y-o-y, the
Growth q-o-q* +1% +6% +6% latter due mainly to mortgages, corporates and SMEs
Growth y-o-y +7% +10% +6% Total customer deposits +6% q-o-q and y-o-y (due mainly to
retail and SMEs)
* Non-annualised ** Loans to customers, excluding reverse repos (and bonds)
*** Customer deposits, including debt certificates but excluding repos
33International Markets BU - Ireland
Net result of 11m EUR
99 NET RESULT Amounts in m EUR
Highlights (q-o-q results)
Lower net interest income due mainly to the closing of the sale
67 of part of the legacy loan portfolio during 4Q18
57 55 Lower net results from financial instruments due entirely to
lower M2M ALM derivatives
32
Higher expenses due entirely to higher bank tax. Costs
11
excluding bank tax fell q-o-q due mainly to lower ICT expenses
3 and lower one-off costs (1m in 4Q18 compared with 3m EUR in
-1 3Q18)
1Q17 2Q17 3Q17 4Q17 1Q18 2Q18 3Q18 4Q18 Stable net impairment releases (-15m EUR both in 4Q18 and
3Q18). Releases in 4Q18 were driven by an increase in the
9-month average House Price Index. Credit cost ratio of -0.96%
in FY18
ORGANIC Total o/w retail Customer Volume trend
VOLUME TREND loans ** mortgages deposits*** Total customer loans rose by 1% q-o-q and stabilised y-o-y
Total customer deposits -3% q-o-q and -9% y-o-y as expensive
Volume 10bn 9bn 5bn
corporate deposits were deliberately replaced by intragroup
Growth q-o-q* +1% +1% -3% funding
Growth y-o-y 0% +1% -9%
* Non-annualised
** Loans to customers, excluding reverse repos (and bonds) and disregarding the
sale of part of the legacy loan portfolio (which closed during 4Q18, and thus has
been deducted from the loan volumes) 34
*** Customer deposits, including debt certificates but excluding reposInternational Markets BU - Bulgaria
Net result of 19m EUR
NET RESULT Amounts in m EUR
31
Highlights (q-o-q results)
26 Banking (CIBank & UBB/Interlease): lower net result
22 21 Lower net interest income due to margin pressure
19
18 Lower net fee and commission income due mainly to higher
insurance distribution expenses (due to higher sales)
Stable net results from financial instruments
4 5 Higher operating expenses due mainly to higher ICT and staff
expenses
1Q17 2Q17 3Q17 4Q17 1Q18 2Q18 3Q18 4Q18 Small loan loss impairments in 4Q18 compared with net
impairment releases on loans in 3Q18. Credit cost ratio of -
0.31% in FY18. Impairment of 2m EUR on ‘other’, mainly on a
legacy property file
Insurance (DZI): stable net result
Strong non-life commercial performance y-o-y in motor retail
(both strong volume growth and growing average tariff), but
ORGANIC Total o/w retail Customer also higher technical charges; excellent combined ratio at 91%
VOLUME TREND loans ** mortgages deposits*** in FY18
Volume 3bn 1bn 4bn Higher life insurance sales with stable technical charges
Growth q-o-q* 0% 0% +3% Volume trend:
Total customer loans stabilised q-o-q and +3% y-o-y, the latter
Growth y-o-y +3% +2% +5%
mainly due to the increasing mortgage and corporate portfolio
* Non-annualised ** Loans to customers, excluding reverse repos (and bonds)
Total customer loans: new business stable q-o-q and +6% y-o-y,
*** Customer deposits, including debt certificates but excluding repos while legacy -6% q-o-q and -26% y-o-y
Total customer deposits rose by 3% q-o-q and by 5% y-o-y
35Group Centre
NET RESULT Amounts in m EUR Net result of -3m EUR
33 The net result for the Group Centre comprises the results
12 from activities and/or decisions specifically made for
5
group purposes (see table below for components)
-3
-12 -17
Highlights (q-o-q results)
-53 Q-o-q improvement was attributable mainly to:
-179 a positive change in ALM derivatives
1Q17 2Q17 3Q17 4Q17 1Q18 2Q18 3Q18 4Q18
partly offset by
higher income taxes
BREAKDOWN OF NET RESULT AT GROUP CENTRE 1Q17 2Q17 3Q17 4Q17 1Q18 2Q18 3Q18 4Q18
Group item (ongoing business) -50 0 -31 -157 -17 -63 -27 -18
Operating expenses of group activities -14 -14 -20 -25 -17 -15 -18 -28
Capital and treasury management -18 17 5 -5 -4 8 4 11
o/w net subordinated debt cost -9 -9 -9 -13 -6 -3 -3 -2
Holding of participations -9 -13 -13 18 1 3 -4 -9
o/w net funding cost of participations -2 0 0 -1 -1 -2 -4 -8
Group Re 5 6 5 10 7 6 3 3
Other -14 5 -9 -154 -3 -64 -13 5
Ongoing results of divestments and companies in run-down 83 11 19 -22 23 10 10 15
Total 33 12 -12 -179 5 -53 -17 -3
Amounts in m EUR 36Overview of contribution of business units to FY18 result
Amounts in m EUR
NET PROFIT – KBC GROUP
FY18 ROAC: 24%
2,639 2,575 2,570
2,427
462 621
863
685
1,762
473
2,113 1,948
1,776 1,742
1,289
2014 2015 2016 2017 2018
4Q 9M
NET PROFIT – BELGIUM NET PROFIT – CZECH REPUBLIC NET PROFIT – INTERNATIONAL MARKETS
FY18 ROAC: 22% FY18 ROAC: 39% FY18 ROAC: 24%
1,516 1,564 1,575 702
1,432 1,450 654
335 596 168
348 542 533
414 361 528 170
439 131 444 93
121 119 428
74
139
1,216 1,240 534 245
1,102 1,089 465 484
993 408 423 61 440
370
289
184
2014 2015 2016 2017 2018 2014 2015 2016 2017 2018 -7
-175
4Q 9M 4Q 9M
-182
2014 2015 2016 2017 2018
4Q 9M
37Balance sheet:
Loans and deposits continue to grow in most core countries
10%
8%
BE
5%
5%
2%
Y-O-Y ORGANIC* VOLUME GROWTH -1% Loans** Retail Deposits***
Loans** Retail Deposits*** mortgages
mortgages
8% 8%
5% 6%
CR 5%
3% 2%
3%
Loans** Retail Deposits*** Loans** Retail Deposits***
4% mortgages mortgages****
1%
10%
Loans** Retail Deposits*** 7%
mortgages 6%
0% 1%
Loans** Retail Deposits***
-9%
mortgages
* Volume growth excluding FX effects and divestments/acquisitions Loans** Retail Deposits***
** Loans to customers, excluding reverse repos (and bonds)
*** Customer deposits, including debt certificates but excluding repos
mortgages
38
**** Retail mortgages in Bulgaria: new business (written from 1 Jan 2014) +6% y-o-y, while legacy -26% y-o-yKBC Group
Section 3
Strong solvency and
solid liquidity
39Strong capital position
Fully loaded Basel 3 CET1 ratio at KBC Group (Danish Compromise) At the end of 4Q18, the CET1 ratio has
increased by 24 bps q-o-q to 16.22%. In line
15.7% 15.7% 15.9% 16.3% 15.9% 15.8% 16.0% 16.0%
with our capital distribution policy, the
14.0% ‘Own Capital Target’ Board of Directors decided that for the year
2018 the capital above the ‘Reference
10.6% fully loaded regulatory minimum
Capital Position‘ (16.0%) will be paid out
(which will be proposed to the AGM and
lead to a payout ratio of 59%). As such, the
common equity ratio* remained stable at
16.0% at the end of FY18 based on the
Danish Compromise. This clearly exceeds the
1Q17 1H17 9M17 FY17 1Q18 1H18 9M18 FY18 minimum capital requirements** set by the
competent supervisors of 10.6% fully loaded
and our ‘Own Capital Target’ of 14.0%
Fully loaded Basel 3 total capital ratio (Danish Compromise)
20.8% 20.9% * Note that 1 January 2018, there is no longer a difference between
19.7% 19.2% fully loaded and phased-in
2.4% T2 2.3% T2 ** Excludes a pillar 2 guidance (P2G) of 1.0% CET1
2.3% T2 2.2% T2
1.5% AT1 2.6% AT1 2.6% AT1
1.1% AT1
The fully loaded total capital ratio fell from
20.9% at the end of 9M18 to 19.2% at the
end of 2018 as we announced we will call
15.9% CET1 15.8% CET1 16.0%CET1 16.0% CET1 the 1.4bn EUR AT1 in March 2019. Hence,
the capital value of the AT1 has already been
excluded from AT1
1Q18 total 1H18 total 9M18 total FY total
capital ratio capital ratio capital ratio capital ratio 40Fully loaded Basel 3 leverage ratio and Solvency II ratio
Fully loaded Basel 3 leverage ratio at KBC Group Fully loaded Basel 3 leverage ratio at KBC Bank
5.7% 5.7% 5.8%
6.1% 6.0% 6.1% 6.1%
5.7%
5.2% 5.2%
4.8% 4.7% 4.7% 5.0% 4.7% 5.1%
1Q17 1H17 9M17 FY17 1Q18 1H18 9M18 FY18 1Q17 1H17 9M17 FY17 1Q18 1H18 9M18 FY18
Solvency II ratio
9M18 FY18 The increase (+1% point) in the Solvency II ratio
was mainly the result of a decrease in equity
Solvency II ratio 216% 217% markets and a higher volatility adjustment
41Strong and growing customer funding base with liquidity
ratios remaining very strong
KBC Bank continues to have a strong retail/mid-cap deposit base in its core markets – resulting in a stable funding mix with a significant portion of the funding
attracted from core customer segments and markets
Customer funding increased further versus FY17. The net unsecured interbank funding was related to ST arbitrage opportunities
9% 100%
3% 3% 2% 10% Funding from customers (m EUR)
6% 4% 5% 8% 7%
9% 0% 2% 2% 7% 163 824
8% 10% 8% 8% 8% 9% 139 560 143 690
155 774
131 914 132 862 133 766
7% 9% 129 555
9% 8% 9% 8% 8% 7%
9% 3% 2% 3% 3% 10%
3% 8%
FY11 FY12 FY13 FY14 FY15 FY16 FY17 FY18
73% 75% 73% 73% 77%
69% 69% 70%
4%
77%
Retail and SME
customer 21%
Mid-cap
-1% driven
-6% -9% Debt issuance in retail network
74% Government and PSE
FY11 FY12 FY13 FY14 FY15 FY16 FY17 FY18
Net unsecured interbank funding Total equity
Net secured funding Certificates of deposit
Debt issues placed with institutional investors Funding from customers
Ratios FY17 FY18 Regulatory requirement NSFR is at 136% and LCR is at 139% by the end of FY18
NSFR* 134% 136% ≥100% • Both ratios were well above the regulatory requirement of 100%
LCR** 139% 139% ≥100%
* Net Stable Funding Ratio (NSFR) is based on KBC Bank’s interpretation of the proposal of CRR amendment.
** Liquidity Coverage ratio (LCR) is based on the Delegated Act requirements. From EOY2017 onwards, KBC
Bank discloses 12 months average LCR in accordance to EBA guidelines on LCR disclosure 42KBC Group
Section 4
FY 2018 key takeaways
43FY 2018 key takeaways
FY18 financial performance
Commercial bank-insurance franchises in core FY18
markets performed well ROE 16%
Cost-income ratio 57% (excl. specific items)
Customer loans and customer deposits
Combined ratio 88%
increased in most of our core countries
Credit cost ratio -0.04%
Higher net interest income and net interest Common equity ratio 16.0% (B3, DC, fully loaded)
margin
Leverage ratio 6.1% (fully loaded)
Lower net fee and commission income Excellent NSFR 136% & LCR 139%
Lower net gains from financial instruments at net Pay-out ratio 59% (including the total dividend and AT1
coupon)
fair value and higher net other income result of
Excellent sales of non-life insurance and lower 2,570m Net result
2.575 2.570
sales of life insurance y-o-y EUR in 2.427
Costs up FY18
Net impairments releases on loans
FY16 FY17 FY18
Solid solvency and liquidity
A total gross dividend of 3.5 EUR per share
will be proposed to the AGM for the 2018
accounting year (of which an interim dividend of 1 EUR per
share paid in November 2018 and a final dividend of 2.5 EUR per share)
44KBC Group
Section 5
Looking forward
45Looking forward
European economic conditions generally solid, although the growth peak is behind us.
Decreasing unemployment rates, with growing labour shortages in some European economies,
combined with gradually rising wage inflation will continue to support private consumption.
Economic Moreover, also investments will remain an important growth driver. The main elements that
outlook could substantially impede European economic sentiment and growth remain the risk of further
economic de-globalisation, including an escalation of trade conflicts, Brexit and political turmoil
in some euro area countries
Solid returns for all Business Units
A negative impact of the first-time application of IFRS 16 (as of January 1st 2019) on our CET1
ratio of approximately 6 bps
Impact of the reform of the Belgian corporate income tax regime: recurring positive P&L impact
Group as of 2018 onwards and one-off negative impact in 4Q17 will be fully recuperated in roughly 3
guidance years’ time
B4 impact (as of January 1st 2022) for KBC Group estimated at roughly 8bn EUR higher RWA on
fully loaded basis at year-end 2018, corresponding with 9% RWA inflation and -1.3% points
impact on CET1 ratio
Next to the Belgium and Czech Republic Business Units, the International Markets Business Unit
Business
has become a strong net result contributor (although 2018 figures were flattered by net
units impairment releases)
46KBC Group
Annex 1
FY 2018 performance of KBC Group
47FY 2018 net result amounted to 2,570m EUR
Net result stabilised y-o-y at 2,570m EUR in 2018, mainly
as a result of the following:
NET RESULT
• Revenues fell by 1% y-o-y pro forma mainly due to sharply lower
2,575 0% 2,570
net result from FIFV and lower net fee & commission income,
largely offset by higher net interest income, net other income and
result from life and non-life insurance after reinsurance
• Operating expenses excluding bank tax increased by 4% y-o-y or
137m EUR y-o-y in FY18. Total bank taxes (including ESRF
contribution) increased from 439m EUR in FY17 to 462m EUR in
FY18. Excluding the consolidation impact of UBB/ Interlease, bank
tax, FX effect and one-off costs, operating expenses in FY18 rose
by 1.7% y-o-y
• Net impairment releases of 17m EUR, due chiefly to:
2017 2018
o A net loan loss provision release in Ireland (112m EUR) and
small reversals in Hungary, Bulgaria and the Group Centre
o Low gross impairments in all segments and all countries
o Impairment of 45m EUR on ‘other’, mainly as the result of a
review of residual values of financial car leases under short-
term contracts in the Czech Republic
48
Amounts in m EURHigher net interest income and net interest margin
Amounts in m EUR NII (pro forma for 2017*) Net interest income
• Net interest income rose by 3% y-o-y
+3% 4,543
4,426
3 87
• Net interest income banking rose by 6% y-o-y due mainly to
123 12 -10% 507
564 lower funding costs, the additional positive impact of both
short- & long-term interest rate increases in the Czech
Republic, continued good loan volume growth and the
3,946
3,727 +6% consolidation of UBB, which were partly offset by lower
reinvestment yields in our euro area core countries, pressure
on commercial loan margins in most core countries and lower
2017 2018 netted positive impact of ALM FX swaps
NII - netted positive impact of ALM FX swaps** NII - insurance contribution • Net interest income insurance fell by 10% y-o-y due to the
NII - contribution of holding-company /group NII - banking contribution negative impact of lower reinvestment yields
• Loan volumes increased by 5% y-o-y (+5% in the Belgium BU,
NIM (pro forma for 2017***) +6% in the Czech Republic BU and +4% in the International
+5bps 2.00%
Markets BU)
1.95%
• Customer deposits excluding debt certificates and repos also
rose by 5% y-o-y (+5% in the Belgium BU, +7% in the Czech
Republic BU and +2% in the International Markets BU)
2017 2018 Net interest margin (2.00%)
* 2017 pro forma figures for NII as the impact of ALM FX derivatives was ‘netted’ in NII as of 2018 • Increased by 5 bps y-o-y due mainly to the positive impact of
** From all ALM FX swap desks repo rate hikes in the Czech Republic and lower funding costs
*** NIM is calculated excluding the dealing room and the net positive impact of ALM FX swaps & repos
VOLUME TREND Total loans* o/w retail mortgages Customer deposits** AuM Life reserves
Volume 147bn 61bn 194bn 200bn 29bn
Growth y-o-y +5% +3% +1% -8% -1%
* Loans to customers, excluding reverse repos (and bonds) 49
** Customer deposits, including debt certificates but excluding repos. Customer deposit volumes excluding debt certificates & repos stable q-o-q and +5% y-o-yLower net fee and commission income and AUM
F&C (pro forma for 2017*)
Net fee and commission income
-5%
1,806 1,719 • Decreased by 5% y-o-y:
864
o Net F&C from Asset Management Services
883
decreased by 10% y-o-y as a result of lower
entry and management fees from mutual funds
1,232 1,110 & unit-linked life insurance products
o Net F&C income from banking services
-290 -274 increased by 2% y-o-y due mainly to higher fees
2017
Amounts in m EUR
2018 from payment services
o Distribution costs fell by 5% y-o-y
Distribution Banking services Asset Management Services
* 2017 pro forma figures as the network income shifted from FIFV to net F&C as of 2018
AuM
217 -8%
200
Assets under management (200bn EUR)
• Decreased by 8% y-o-y due largely to a negative
price effect
2017 2018
Amounts in bn EUR
50Higher non-life insurance sales and exceptional
combined ratio
NON-LIFE SALES
(GROSS WRITTEN PREMIUM)
1,518
+7% 1,626 Sales of non-life insurance products
• Up by 7% y-o-y mainly thanks to a good
commercial performance in all major product lines
in our core markets and tariff increases
2017 2018
Amounts in m EUR
COMBINED RATIO (NON-LIFE)
The non-life combined ratio at FY18 stood at
79%
90%
84% 88% 83% 88% 88% 88% an exceptional 88%. This is in line with FY17,
which benefited from an one-off release of
provisions in Belgium (positive effect of 26m
EUR). Excluding this one-off release, the
combined ratio amounted to 90% at FY17
1Q 1H 9M FY
2017 2018
51Lower life insurance sales and lower VNB
LIFE SALES Sales of life insurance products
1,881 -3%
1,817
• Down by 3% y-o-y
o The 18% y-o-y decrease in sales of unit-linked
1,025 1,112
products was the result of a less favourable
investment climate
o Sales of guaranteed interest products rose by 8%
856 705
y-o-y
2017 2018
• Sales of unit-linked products accounted for 39% of
total life insurance sales
Guaranteed interest products Unit-linked products
Amounts in m EUR
VNB
VNB (Life)* • Fell by 21% y-o-y to 231.7m EUR due to the
exceptionally good 2017 result:
300
293.5
30 o Overall decrease in new business volumes of unit-
250 231.7 25 linked products in most entities. Due to
200 20%
exceptionally good unit-linked sales in 2017, the
150 15
decrease is most pronounced for KBC Insurance NV
9.9% 9.0% and K&H Insurance
100 10
o At KBC Insurance NV, the decrease in unit-linked
50 5
volumes was partly offset by an increase in new
0 0%
2017 2018 business volumes of guaranteed interest products
VNB (m EUR) VNB/PVNBP (%)
• Overall profitability still supported by stable volume
and high profitability of risk products
• VNB = Value of New Business = present value of all future profit attributable to the shareholders from the new life insurance policies written during the year 2018
• The VNB of KBC Group includes the expected future income generated by other parties within KBC Group arising from the sales of life insurance business. In 2018, this income amounted to 114m EUR
(compared with 175m EUR in 2017)
• VNB/PVNBP = VNB at point of sale compared with the Present Value of New Business Premiums. This ratio reflects the margin earned on total premiums
52Lower FV gains and higher other net income
FV GAINS (pro forma for 2017*) The sharply lower y-o-y figure for net gains
522 from financial instruments at fair value was
attributable to:
360
• Lower dealing room results
231 • A negative change in market, credit and funding
147
value adjustments (mainly as a result of changes in
92 the underlying market value of the derivatives
70 51
33 portfolio and increased credit spreads)
FY17 FY18 • A negative change in ALM derivatives (33m EUR in
FY18 compared with 92m EUR in FY17)
Other FV gains Net result on equity instruments (overlay insurance)
M2M ALM derivatives
• Lower net result on equity instruments (insurance)
* 2017 pro forma figures as:
1) the impact of the FX derivatives was ‘netted’ in NII as of 2018
2) the shift from realised gains on AFS shares and impairments on AFS shares to FIFV
due to IFRS 9 (overlay approach for insurance)
OTHER NET INCOME Other net income sharply increased to 226m
226
EUR in FY18 from 114m EUR in FY17. This is
mainly the result of the settlement of some
+98% legacy legal files in 2018, while 2017 was
114 impacted by an additional provision of 116m
EUR related to the industry wide review of
the tracker rate mortgage products
originated in Ireland before 2009
2017 2018
53
Amounts in m EURStrict cost control, good cost/income ratio
Cost/income ratio (banking): 57.5% in FY18
OPERATING EXPENSES Adjusted for specific items*, the C/I ratio
4,074
+4% 4,234 amounted to 57% in FY18 (compared with 55% in
439 +5%
462
FY17). Excluding bank tax, C/I ratio amounted to
50% in FY18
3,635
+4% 3,772 • Operating expenses excluding bank tax increased by 4%
y-o-y or 137m EUR y-o-y in FY18
• Total bank taxes (including ESRF contribution) increased
from 439m EUR in FY17 to 462m EUR in FY18
2017 2018
• Excluding the consolidation impact of UBB/ Interlease,
Bank tax Opex bank tax, FX effect and one-off costs, operating
expenses in FY18 rose by 1.7% y-o-y
Amounts in m EUR 54
* See glossary (slide 89) for the exact definitionNet impairment releases, excellent credit cost and
improved impaired loans ratio
ASSET IMPAIRMENT
Net impairment releases of 17m EUR in FY18, due
45 45 chiefly to:
• A net loan loss provision release in Ireland (112m EUR)
and small reversals in Hungary, Bulgaria and the Group
-87 -62
-17
Centre
• Low gross impairments in all segments and all countries
-42
2017 2018 • Impairment of 45m EUR on ‘other’, mainly as the result
of a review of residual values of financial car leases under
Other impairments Impairments on financial assets at AC* and FVOCI short-term contracts in the Czech Republic
* AC = Amortised Cost. Under IAS 39, impairments on L&R
CCR RATIO
1.21%
0.82% The credit cost ratio amounted to -0.04% in FY18
0.71%
due to low gross impairments and several releases
0.42% (-0.06% in FY17)
0.23%
0.09%
-0.04%
-0.06%
FY11 FY12 FY13 FY14 FY15 FY16 FY17 FY18
IMPAIRED LOANS RATIO
9.9%
8.6%
The impaired loans ratio improved to 4.3%, of
4.4% 7.2% which 2.5% over 90 days past due. This sharp
6.0%
3.8%
3.3% 4.3%
improvement was partly the result of the sale of
2.6%
1.8% part of the Irish portfolio
5.5% 4.8% 3.9% 3.4% 2.5%
FY14 FY15 FY16 FY17 FY18
Impaired loans ratio of which over 90 days past due 55KBC Group
Annex 2
Company profile
56KBC Group in a nutshell (1)
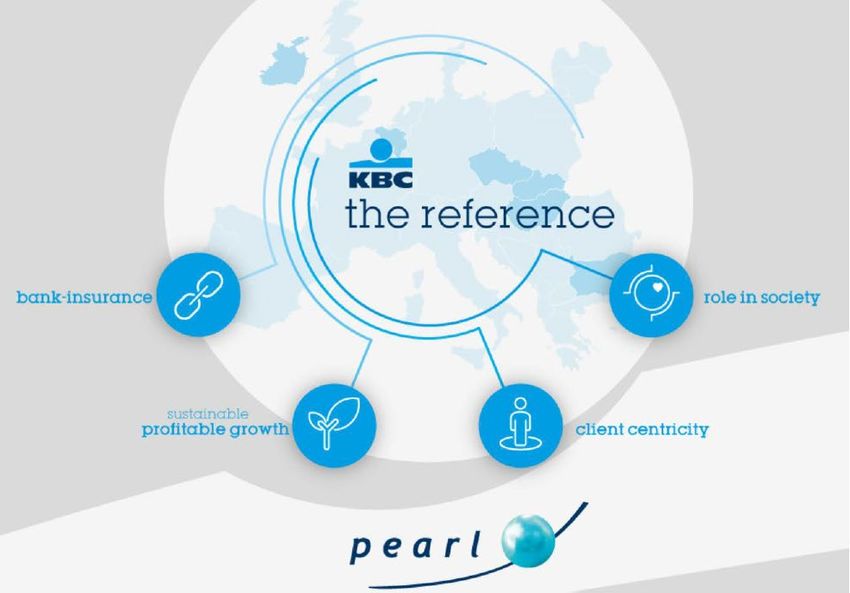
We want to be among Europe’s best performing financial institutions! By achieving this,
KBC wants to become the reference in bank-insurance in its core markets
• We are a leading European financial group with a focus on providing bank-insurance products and services to
retail, SME and mid-cap clients, in our core countries: Belgium, Czech Republic, Slovakia, Hungary, Bulgaria and
Ireland.
Diversified and strong business performance
… geographically
• Mature markets (BE, CZ, IRL) versus developing markets (SK, HU, BG)
• Economies of BE & 4 CEE-countries highly oriented towards Germany, while IRL is more oriented to the UK & US
• Robust market position in all key markets & strong trends in loan and deposit growth
… and from a business point of view KBC Group: topline diversification 2014-2018 (in %)
• An integrated bank-insurer 100%
• Strongly developed & tailored AM business 80% 45% 47% 49% 47%
49%
• Strong value creator with good operational
60%
results through the cycle Diversification Synergy
• Unique selling proposition: in-depth 40%
55%
knowledge of local markets and profound 20%
53% 51% 51% 53%
relationships with clients
0%
• Integrated model creates cost synergies and results Customer Centricity FY 2014 FY 2015 FY 2016 FY 2017 FY 2018
in a complementary & optimised product offering Net Interest Income Other Income
• Broadening ‘one-stop shop’ offering to our clients 57You can also read


